Article

The Microstructure, Crystallization Behavior, and Mechanical Performance Evolutions of Li2O-Al2O3-SiO2 Glass and Glass–Ceramics with Different Alkaline Earth Oxide Modifications

1
State Key Laboratory of Silicate Materials for Architectures, Wuhan University of Technology, 122 Luoshi Road, Hongshan, Wuhan 430070, China
2
Sanya Science and Education Innovation Park of Wuhan University of Technology, Yazhou District, Sanya 572025, China
3
Hepu Research Center for Silicate Materials Industry Technology, 27 Huanzhu Avenue, Hepu County, Beihai 536100, China
*
Authors to whom correspondence should be addressed.
Materials 2025, 18(6), 1383; https://doi.org/10.3390/ma18061383
Submission received: 8 February 2025 / Revised: 15 March 2025 / Accepted: 18 March 2025 / Published: 20 March 2025
(This article belongs to the Section Advanced and Functional Ceramics and Glasses)

Abstract

:
The introduction of alkaline earth oxides into Li2O-Al2O3-SiO2 glass components can improve the mechanical and optical performances of glass and glass–ceramics for various applications. In this research, microstructures, thermal properties, crystallization behavior, and mechanical performance changes in specific Li2O-Al2O3-SiO2 glass with the introduction of different alkali earth oxides, MgO, CaO, SrO, and BaO, were investigated. From Raman and NMR spectra microstructure analysis, it was confirmed that the addition of MgO could compete with Al as a network former and charge compensator, while increasing the bridging oxygen number with Si and affecting the chemical shift in 29Si. Meanwhile, the glass structures slightly changed due to the introduction of CaO, SrO, and BaO, with larger ionic radii. Meanwhile, the glass transition and first crystallization temperatures increased due to MgO introduction and then decreased with larger-radii alkali earth oxides’ addition, due to different glass network connectivity. After heat treatment, the crystal phases in the glass–ceramics changed with the introduction of alkaline earth oxides. The main crystal phases varied from Li2Si2O5, SiO2, and LiAlSi4O10 in glass without alkali earth oxide introduction; to SiO2, LixAlxSi3−xO6, and MgAl2Si4O12 in glass with MgO addition; to SiO2 and LixAlxSi3−xO6 with CaO addition; to SiO2, LiAlSi4O10, and Li2SiO3 for glass with SrO addition; and further to Li2SiO5, SiO2, and LiAlSi4O10 for glass with BaO addition. Moreover, in the mechanical performance of the glass–ceramics, the Vickers hardness and elastic modulus reached a maximum of 8.61 GPa for glass with MgO and 90.12 GPa for glass with BaO modification, respectively, probably due to different crystal phases. More importantly, the crack resistance values presented a large increase for MgO glass and MgO- or CaO-modified glass–ceramics.

1. Introduction

It has long been known that lithium–aluminum–silica glass and glass–ceramics have excellent mechanical properties, significant chemical stability, high thermal shock resistance, low thermal expansion, and high transparency [1,2,3] and are used in mobile device screen protectors, camera lenses for dental applications, and mirrors [4,5,6,7,8,9,10,11,12]. These related mechanical performances can be further enhanced through crystallization processes, crystal phases, and glass compositions [13,14].
Different protocols have been developed to control crystal precipitation and improve mechanical performance. Recently, Fabris et al. [15] surface-crystallized Li2O-Al2O3-SiO2-K2O-Na2O-MgO-CaO glass, increasing the hardness of the crystalline glass from 6.3 GPa to 7.5 GPa, and the optimum fracture strength reached 680 MPa. Yang et al. [16] optimized Li2O-Al2O3-SiO2-K2O-ANa2O-MgO-CaO glass by optimizing the heat treatment process; transparent surface-crystallized aluminosilicate glass with ultra-high CR (75.1 N) and high hardness (7.1 GPa) was prepared. So-Won Kim [17] et al. found that the substitution of Li2O with MgO in LAS glass showed the most favorable properties, including a low dielectric constant and low thermal expansion, due to their different alkali earth oxides in the glass investigation. In a study by Weigel et al. [18], the incorporation of Mg, Ca, Sr, and Ba into XAlSiO4 glass systems revealed a proportional increase in the atomic packing density and elastic modulus with cation field strength. In general, the introduction of alkaline earth cations into silicate glass can destroy the bridging oxygen bond and glass network connectivity [19], further having an obvious effect on the glass microstructure, high-temperature viscosity, hardness, and modulus and other properties. It is necessary to study the detailed influence of different alkali earth oxide additions on LAS glass, especially on the mechanical properties.
In the current research, different alkali earth oxides, MgO, CaO, SrO, and BaO, were introduced into LAS glass and glass–ceramics with specific compositions. The effects of the alkali earth oxides on the microstructure, thermal properties, and mechanical properties were investigated. In combination with X-ray diffraction (XRD) and scanning electron microscopy (SEM) images, the composition and morphology of the glass crystalline phases were determined to explore the crystallization mechanism. In addition, the mechanical performances were evaluated by the Vickers hardness, elastic modulus, and crack resistance.

2. Experimental Section

2.1. Glass and Glass–Ceramics’ Preparation

Raw material powder, lithium carbonate (Li2CO3, ≥98%), alumina (Al2O3, 99.0%), silicon oxide (SiO2, 99.0%), magnesium oxide (MgO, 98.5%), calcium carbonate (CaCO3, 99%), strontium carbonate (SrCO3, 99%), barium carbonate (BaCO3, 99%), zirconium oxide (ZrO2, 99%), and antimony trioxide (Sb2O3, 99.0%) were purchased from the China National Pharmaceutical Group Chemical Reagent Co. Glass specimens with nominal compositions of 70.0SiO2-4.3Al2O3-16.1Li2O-2.8ZrO2-0.9P2O5-5.36 RO (mol%) and one additional reference glass without alkaline earth oxide addition were prepared by the conventional melt-quenching method, named LAS, MLAS, CLAS, SLAS, and BLAS, respectively, with RLAS denoting all alkali earth oxide-modified glass. The raw material powders were weighed, mixed thoroughly, melted in a platinum crucible at 1600 °C for 3 h, and annealed in an annealing furnace at 535 °C for 10 h to remove internal stresses. The obtained glass and glass–ceramics were cut into 10 mm × 10 mm × 2 mm dimensions and polished for further characterization.

2.2. Characterization

The amorphous state of the prepared samples and the crystalline-phase glass–ceramics were characterized in the range of 10–80° 2θ with a scanning speed of 2°/min and a step size of 0.02° using an X-ray diffractometer (Bruker, D8 Advance, Rheinstetten, Germany). The density of the glass specimen was measured according to Archimedes’ principle. The data were taken from the average of 10 repeated measurements. The molar volume was calculated from the molar weight and density of the glass.
The Raman spectra were collected from an LABHRev-UV laser confocal micro-Raman spectrometer (Horiba, Kyoto, Japan), under a 10.6 mW 532 nm laser beam excitation, with 4 s accumulation duration. The network structure of the glasses was analyzed using a magic-angle spinning NMR spectrometer (MAS-NMR, VANCE III 400, Bruker, Germany). The glass samples were ground into fine powder and then measured at chemical frequencies of 104.26 MHz and 79.49 MHz for 27Al and 29Si data, respectively. The pulse sequences were single pulses with relaxation delays of 2 and 5 s, respectively.
The glass transition temperatures (Tg) and crystallization temperatures (Tc) were measured using a TG-DSC thermal analyzer (STA4F3, NETZSCH, Selb, Germany), with a 25~1000 °C temperature range and a heating rate of 10 °C/min under an ambient atmosphere. Glass rods with dimensions of 5 mm × 25 mm × 5 mm were fabricated to measure the coefficient of thermal expansion (CET) using a thermal expansion meter (DIL 402SE, NETZSCH, Germany).
Samples of glass etched in 10 vol% HF solution for 30 s were made and the crystal morphology in the glass was observed using a field emission scanning electron microscope (FE-SEM, S-4800, Hitachi, Tokyo, Japan) with an accelerating voltage of 5 kV and a beam current of 10 mA.
The Vickers hardness of the glass and glass–ceramics was measured using a microhardness tester (HV-1000A, Huayin Testing Instruments, Guangzhou, China) at a load of 200 g for 10 s. Hardness values were derived from the average of 10 indentations and the corresponding calculated hardness data with an error of 0.2 GPa. The reduced modulus of elasticity was tested using a nanoindentation tester (Bruker hysitron, ti-980).
Thirty indentation angle cracks were generated by optical microscopy at room temperature. The probability of crack initiation was then calculated by dividing the number of radial corner cracks by the total number of indentation angles (four times the number of indentations). The probability of crack initiation was ensured to increase gradually by increasing the indentation load from 0% to 100%. The percentage of crack initiation was plotted against the applied load. A 50% probability load was identified as CR, as defined by Wada [20]. The uncertainty of CR was approximately ±1.7 N. All the measurements were performed at room temperature.

3. Results and Discussion

3.1. The Basic Physical Properties and Microstructures of the Glass

The broad peaks at 20–30° in the XRD patterns of all obtained specimens (Figure 1a) indicated the glassy status. The glass densities gradually increased from 2.44 g/cm3 for LAS to 2.67 g/cm3 for BLAS (Figure 1b) due to alkali earth oxide addition and larger atomic mass. In addition, the molar volumes of all glasses also increased, which was consistent with B2O-Al2O3-SiO2 glass with different alkali earth oxide modifications [21], due to the balance of the growing density and weakened glass structure induced by decreased ion field strength with larger ionic radii of Mg2+ to Ba2+ ions.
The Raman spectra of the glasses (Figure 2a) showed three main bands, located at 400–550 cm−1, 750–840 cm−1, and 900–1200 cm−1, which could be attributed to the [Si-O-Si] bending vibration of three or four silica rings in the glass structure, the symmetric stretching vibration of [Si-O-Si] or [Si-O-Al] in the aluminosilicate glasses, and the Si-O stretching vibration, respectively [22,23]. There was no significant microstructure change in the R = Ca, Sr, and Ba glasses, compared with the LAS glass (Figure 2a, inset). The high-frequency band could be attributed to the tensile vibration of T-O (T = Si, Al) in different Qn-TO4 (n is the bridge oxygen number of the structural unit; Q is Al or Si) tetrahedral units [24,25]. The results indicated that the larger divalent cations (Ca, Sr, or Ba) did not disturb the bridging oxygen in the [SiO4] and [AlO4] network formation and acted as charge balances. On the other hand, the glass microstructure presented obvious changes due to MgO addition. In fact, the high-frequency band of 850–1250 cm−1 was broader and higher. The peak at 850–1250 cm−1 was related to the vibration of the glass network structure. This result further confirmed that Mg2+ competed with Al3+ in the glass structure and ended up acting as a network former [26] and charge compensator [27] to further affect the crystallization and mechanical properties of the glass.
The 29Si MAS-NMR spectra of the glasses presented broad peaks ranging from −110 to 80 −200 to 0 ppm (Figure 3a), indicating the Qn groups in the glass structures, Q4 groups at −110~−100 ppm, Q3 at −95~−90 ppm, Q2 at −90~−80 ppm, and Q1 −76~−68 ppm [28,29,30]. It is reasonable to propose that the glass was composed of Q3 and Q2 since the broad peaks were centered at ~90 ppm. Furthermore, the almost overlapped NMR spectra further confirmed the small effect on the glass structure from CaO, SrO, and BaO addition. The peak center of the MLAS glass was slightly shifted to the left by 2 ppm, suggesting that Mg2+ acted as a network former and charge compensator and increased the amount of bridging oxygen associated with Si, thus affecting the chemical shift in 29Si. The 27Al NMR spectra of all glasses exhibited broad asymmetric peaks centered at 51 ppm (Figure 3b), indicating the main [AlO4] groups and minor [AlO5] and [AlO6] groups. The unchanged spectra, with different alkali earth oxide additions, confirmed the compositional indecency of Al coordination groups in the glass structures [31].

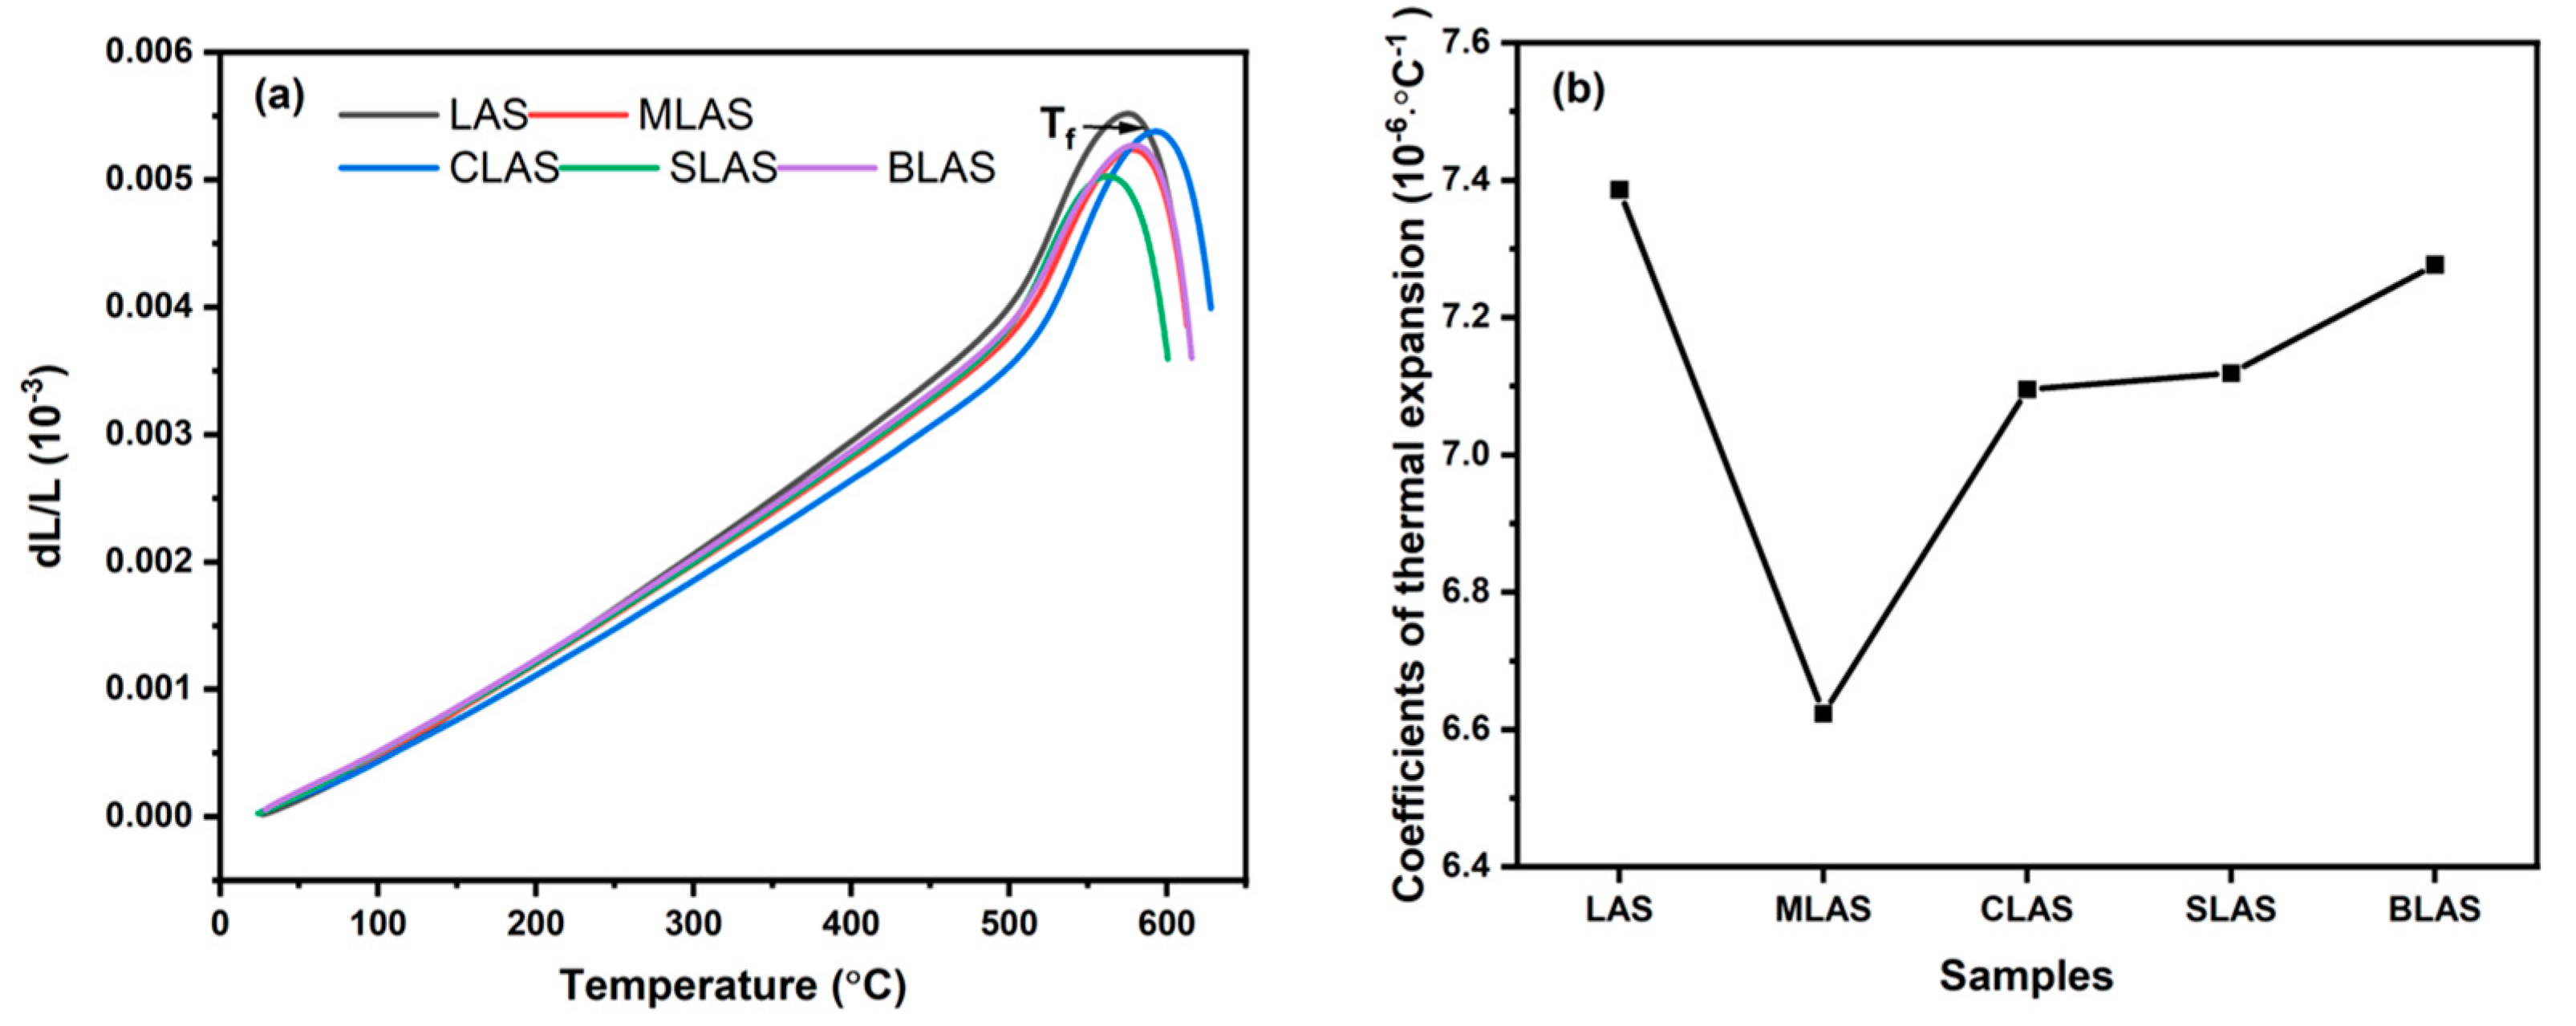
3.2. The Thermal Properties of the Glass

The DSC diagrams of the glasses (Figure 4) show that there was an increase in glass transition temperatures (Tg) from 501.4 °C to 547.3 °C due to MgO addition and then a decrease with greater alkali earth oxide introduction, as listed in Table 1. Meanwhile, the glass crystallization peak temperatures (Tp) also exhibited a similar trend. The increased Tg and Tp could originate from the better glass connectivity [16,32] due to the high local electric field and small ionic radius of Mg2+ resulting in MgO glass formers in the microstructures, which was consistent with the analysis from the Raman (Figure 2c) and NMR (Figure 3a) spectra. On the other hand, the larger ionic radius of Ca, Sr, and Ba decreased the local electric field, making CaO, SrO, and BaO act as glass modifiers and destroy the glass networks [33]. The differences between Tg and Tc were larger than 200 °C, implying the good glass-forming abilities of all compositions.
Asymmetric changes in vibrational amplitude and potential energy between two atoms at elevated temperatures largely determine the coefficient of thermal expansion (CTE) of a glass [34,35]. The temperature dependence of the glass bar length and the calculated CTE values are shown in Figure 5a, b. With the introduction of alkaline earth oxides into the glass, the CTE values gradually increased from 6.23 × 10⁻⁶/°C to 7.27 × 10⁻⁶/°C, with a lager ionic radius, from Mg to Ba. In general, the ion field strength decreased with a growing ionic radius, which led to the higher amplitude of the thermal vibration and eventually the easier expansion of the glass. The dropping CTE from LAS to MLAS could be attributed to the possible MgO network formed in the microstructure.
The glasses were heat-treated for crystal precipitation and glass–ceramic formation. The protocol was a two-step heat treatment, with the first step at 640 °C for 2 h for nucleation and different temperatures at 680, 700, 740, and 780 °C for 1 h for crystal growth for all glasses. The XRD patterns (Figure 6) demonstrated the crystallization evolution. All the glasses showed crystal phases after heat treatment in the second step of 680 °C for 1 h. Then, the crystal phases changed and the sizes grew with higher temperatures. For the LAS glass, lithium disilicate (Li2Si2O5), petalite (LiAlSi4O10), and silica (SiO2) crystals were precipitated in the glass matrix. Meanwhile, SiO2 crystals formed in the glass matrix with MgO addition in the low-temperature second-step heat treatment, and LixAlxSi3−xO6 crystals appeared with increased temperature; then, MgO was involved in crystal formation and MgAl2Si4O12 crystals were precipitated due to MgO with a further temperature increase. For CLAS, with CaO introduction, SiO2 crystals formed at first; then, LixAlxSi3−xO6 crystals appeared, and crystals grew with a further temperature increase, without new Ca-O-related phase formation. For the glasses with SrO and BaO addition, SiO2 and Li2SiO3 crystals formed at low temperatures, and then LiAlSi4O10 crystals were precipitated and grew, which was similar to the crystal formation and growth procedure in the LAS glass without alkali earth oxides’ introduction. SrO and BaO were not involved in the crystal phases. It is easy to understand that large-radii Ca2+, Sr2+, and Ba2+ ions could not be incorporated into Si-Al-O-related crystal phases [36]. The different crystal phases in the glass matrix implied the different mechanical performances of glass–ceramics.
The crystal morphologies in the glass matrix after the two-step heat treatment, at 640 °C/2 h + 780 °C/1 h, confirmed the uniform distribution of spherical crystal precipitation (Figure 7). The diameters of the crystals were varied with different alkali earth oxides’ introduction, with fine nanocrystals with a diameter around 30 nm for LAS, around 100 nm for MLAS, around 50 nm for CLAS, and 30 nm for BLAS glass–ceramics, indicating different crystal formation and growth processes due to alkali earth oxides’ introduction.

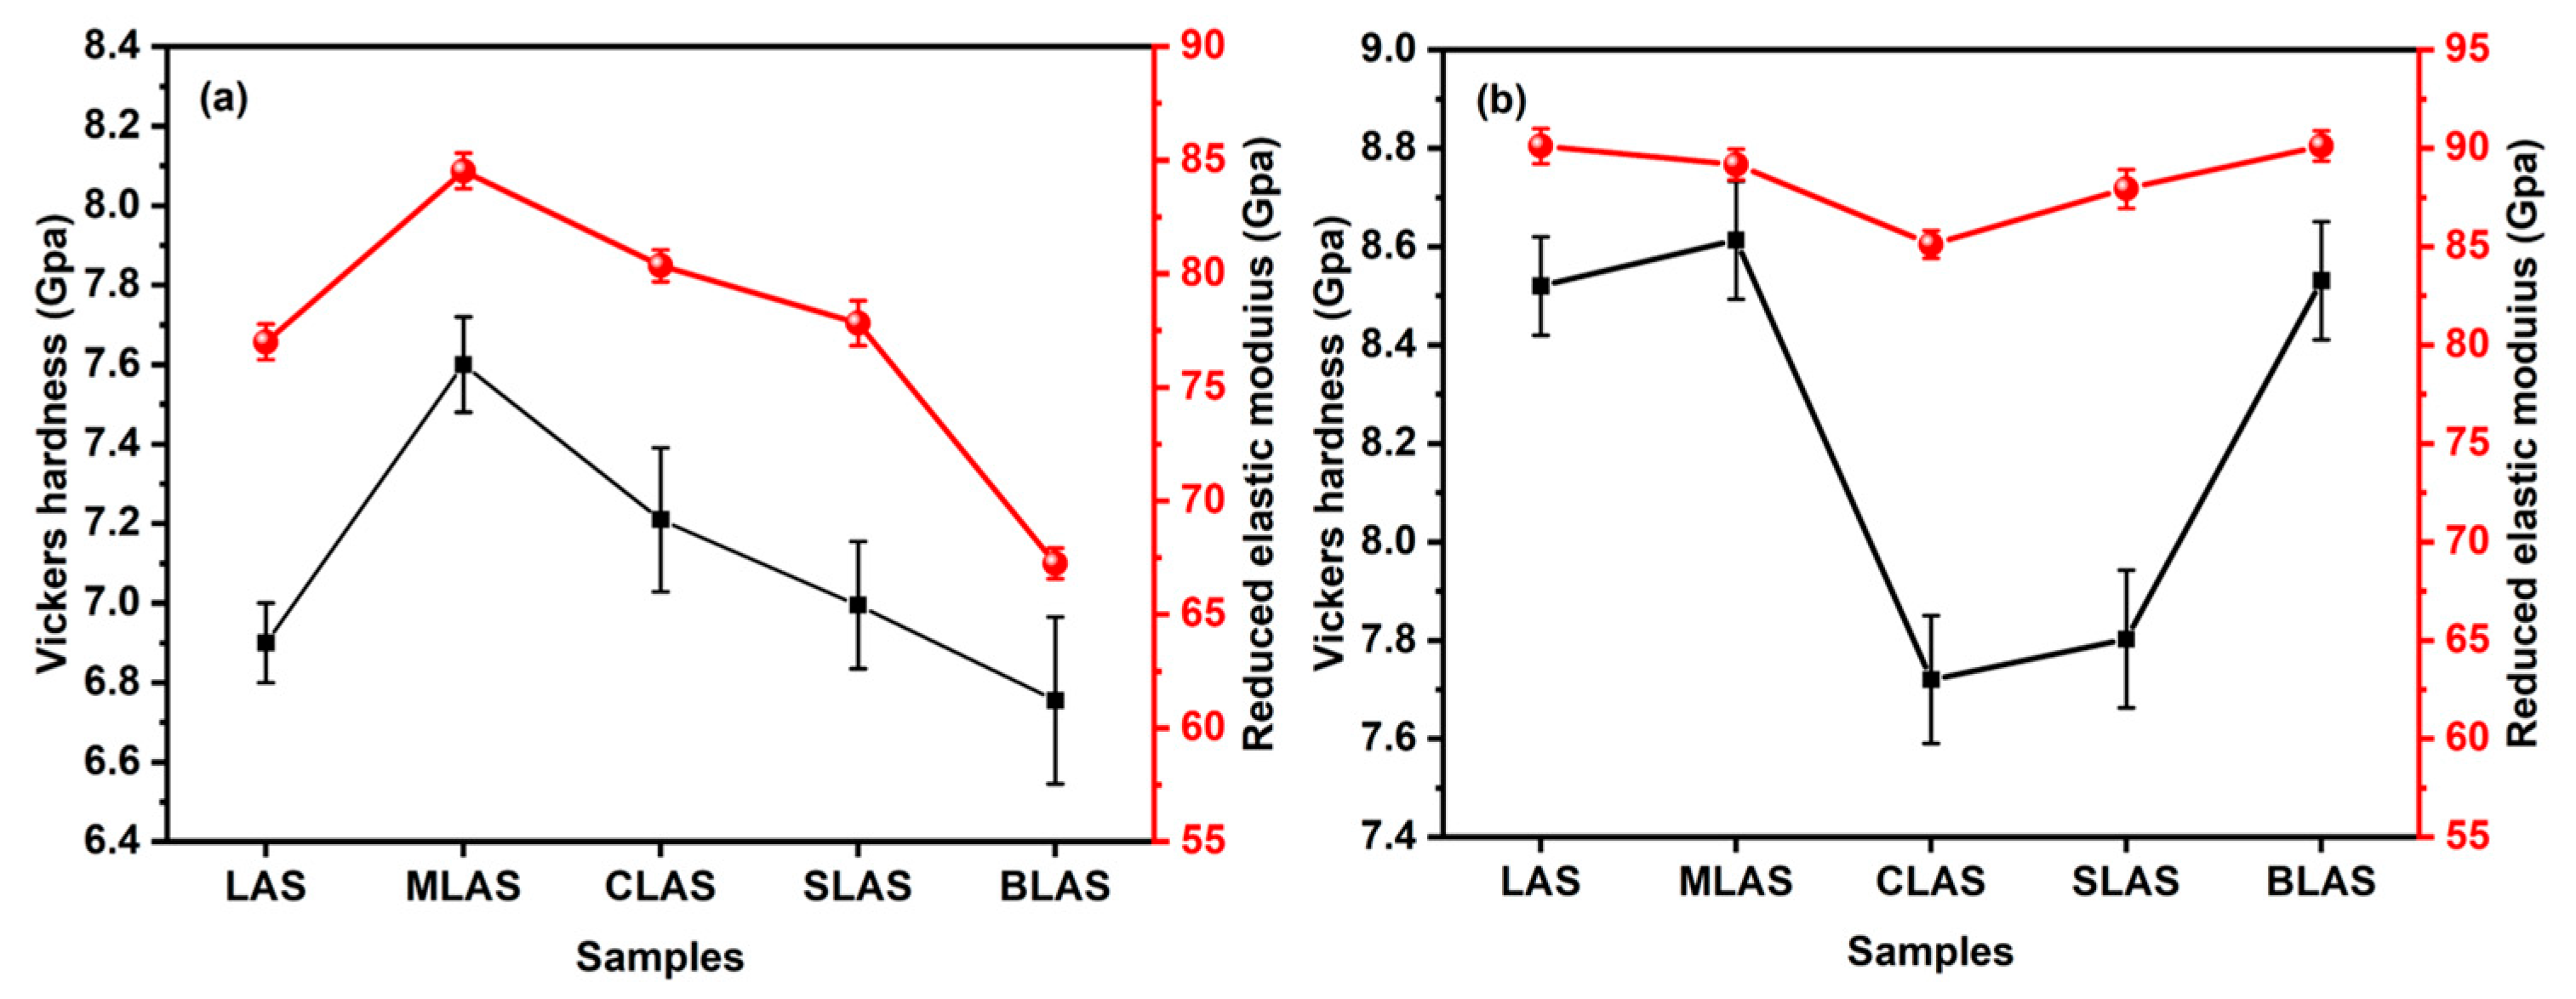
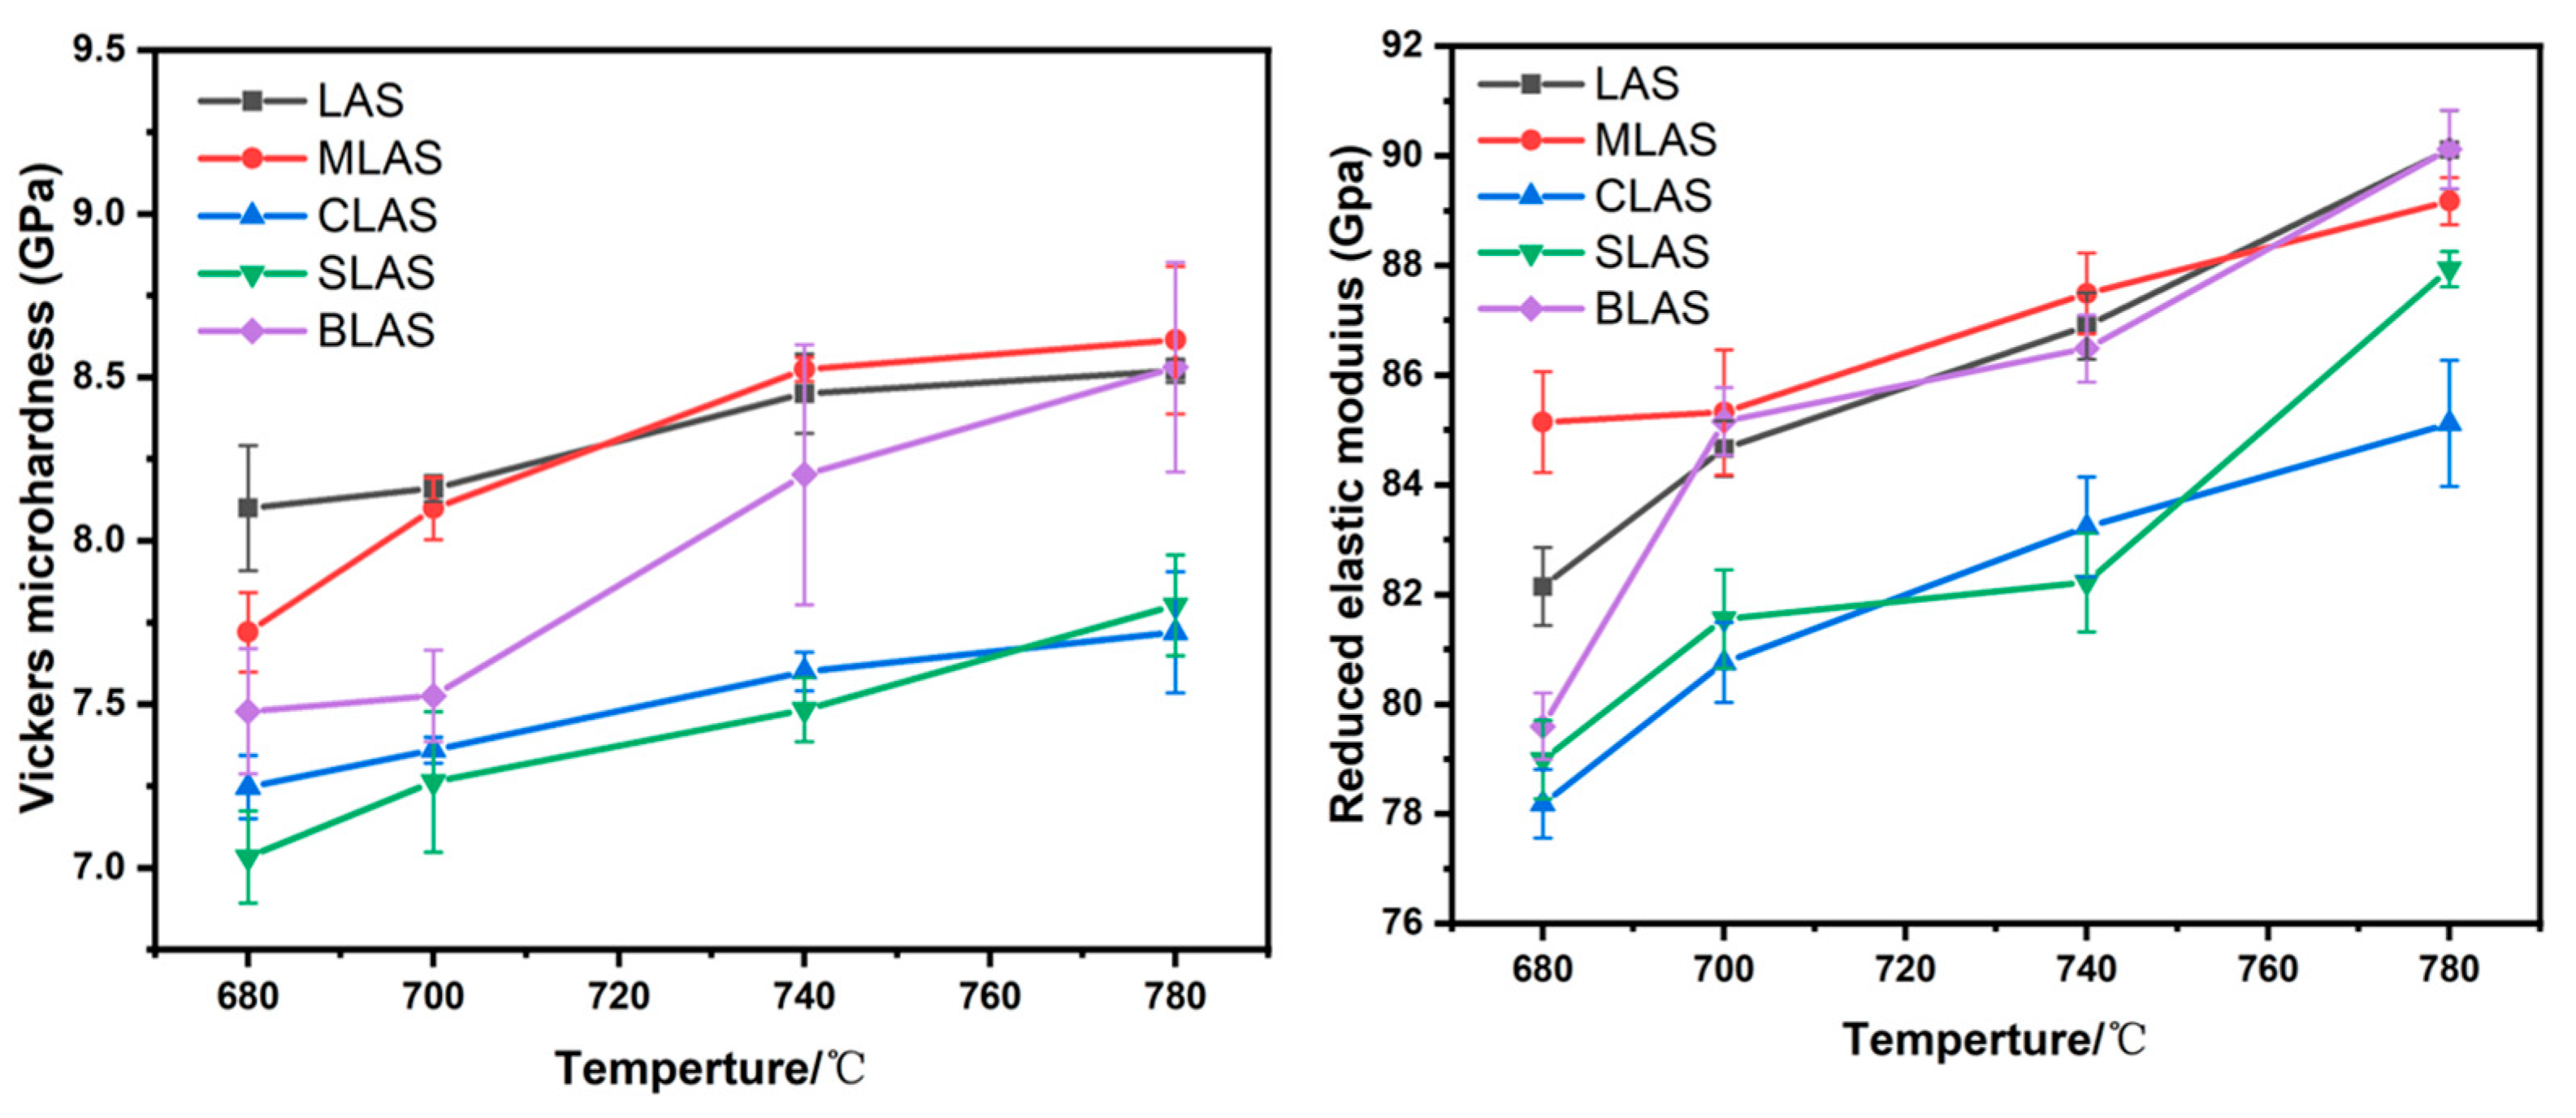
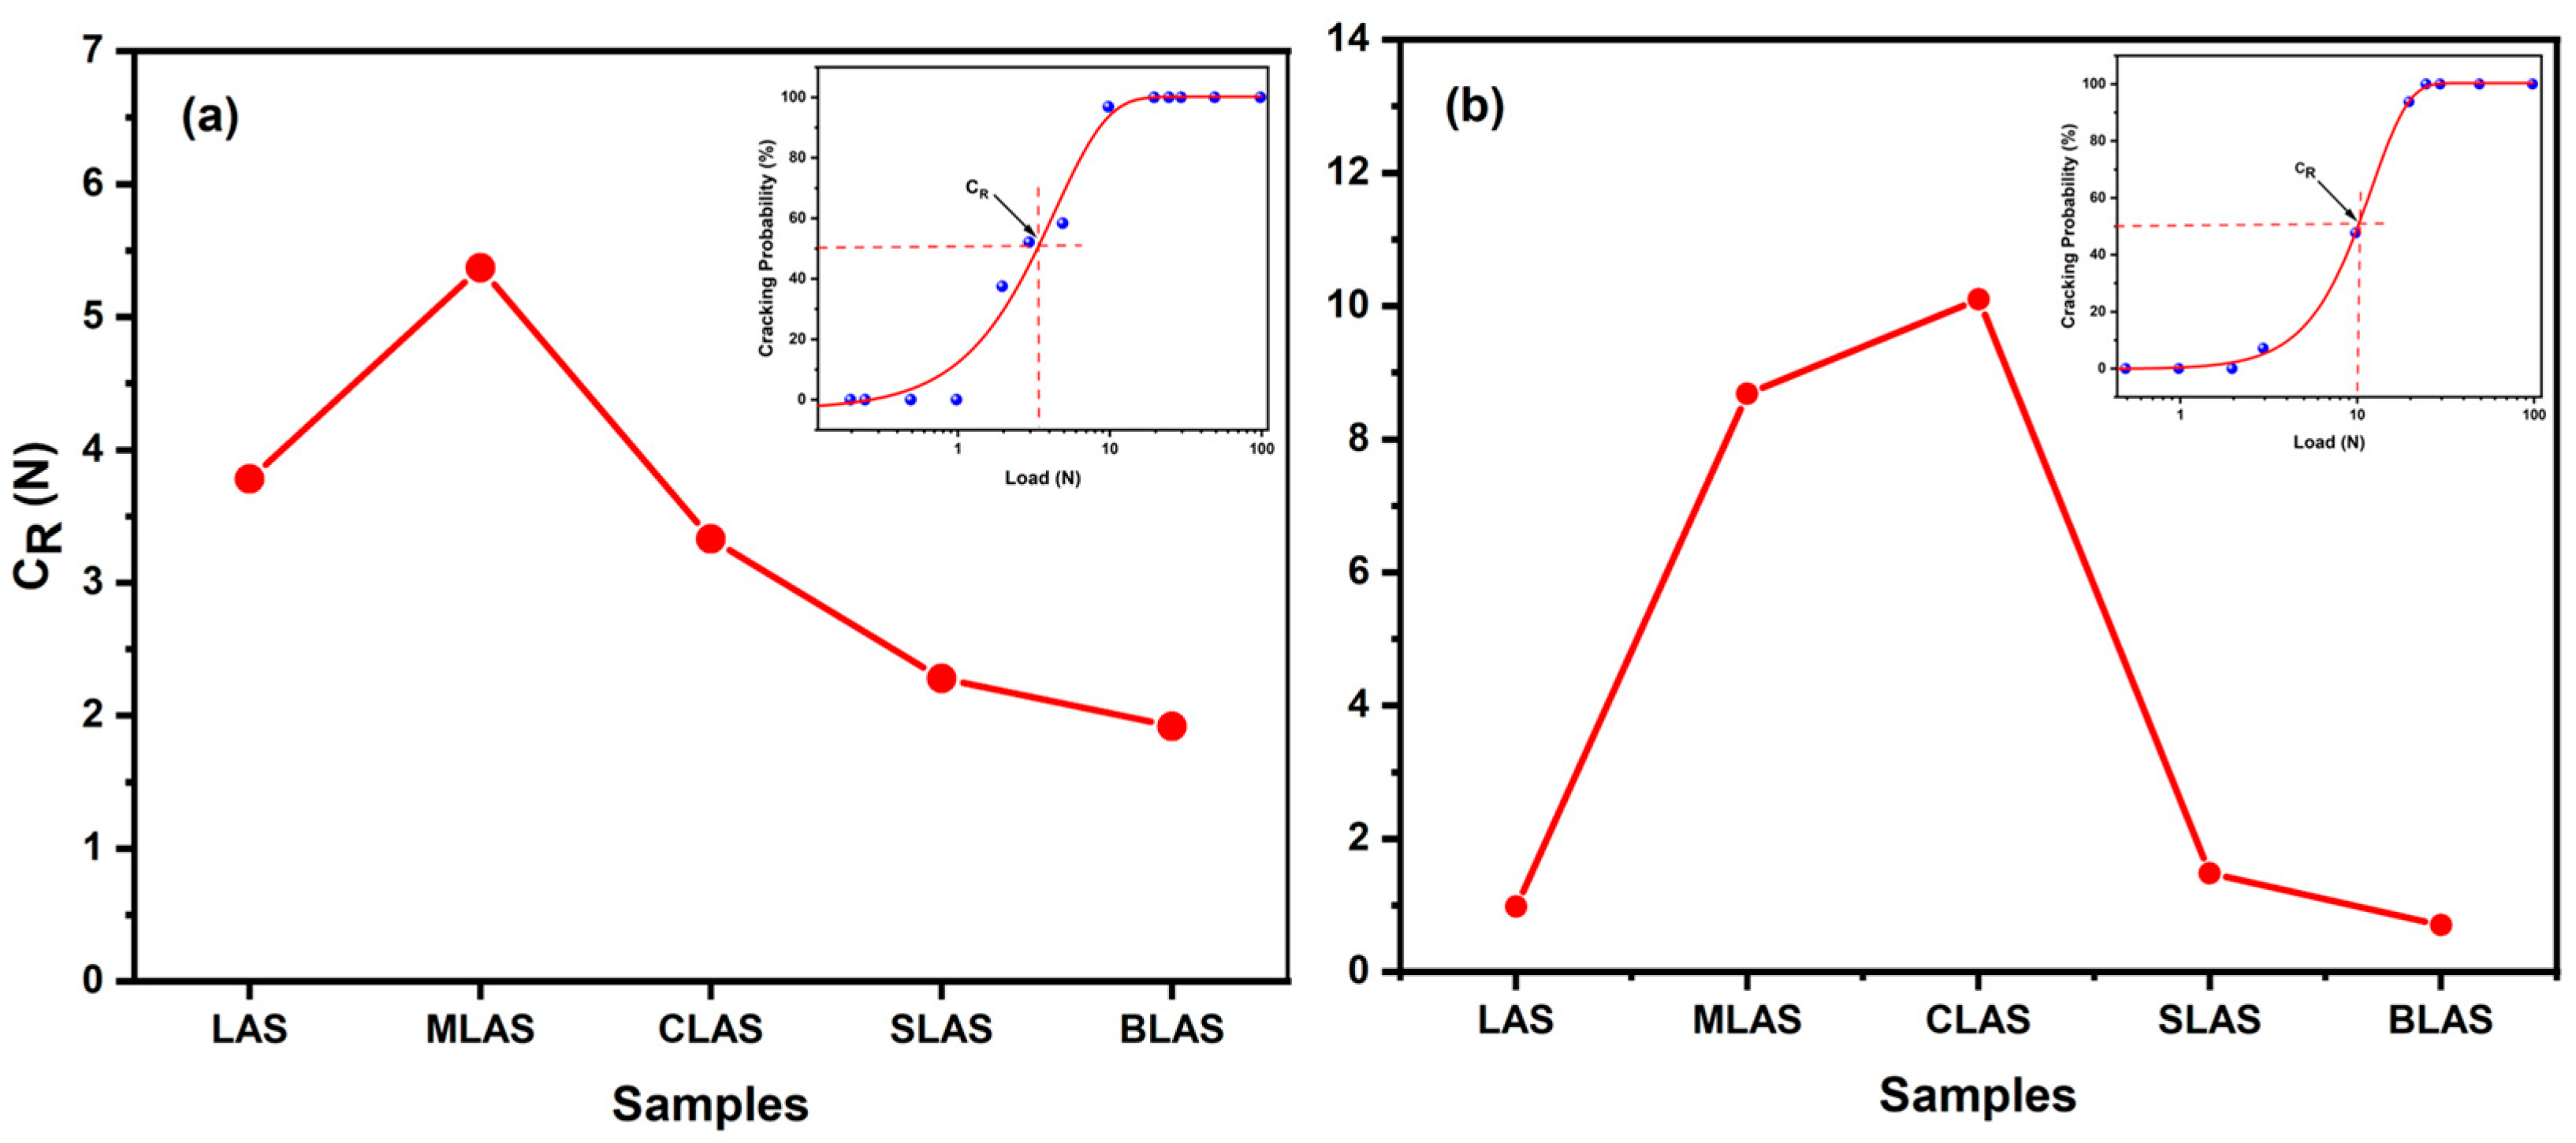
3.3. The Mechanical Performances of the Glass and Glass–Ceramics

The Vickers hardness and elastic modulus of the as-prepared glass (Figure 8a) increased from 6.91 GPa and 77.2 GPa for the LAS glass, with a maximum of 7.65 GPa and 84.2 GPa with MgO introduction, and then gradually decreased to 6.75 GPa and 67.25 GPa with larger-radii alkai earth oxides’ introduction. The changes in the hardness and modulus probably resulted from the different microstructures of the glass. The Raman spectra of the MLAS glass showed obvious changes from those of LAS, and the MgO in the glass matrix could act as a glass former in a certain range, which increased the glass connectivity. On the other hand, the introduction of CaO could make SrO and BaO glass modifiers, which decreased the glass connectivity. Furthermore, the larger ionic radius decreased the electric field intensities, which further decreased the glass transition and crystallization temperatures (Figure 4 and Table 1) and the mechanical performance. After the two-step heat treatment at 640 °C for 2 h and 780 °C for 1 h, the hardness slightly increased from 8.52 GPa for LAS to 8.61 GPa for MLAS glass–ceramics, dropped to 7.72 GPa for CLAS and 7.82 for SLAS, and recovered to 8.53 GPa for BLAS glass–ceramics (Figure 8b). Meanwhile, the elastic modulus of the glass–ceramics slightly decreased from 90.01GPa for LAS to 89.1 GPa for MLAS and 85.12 GPa for CLAS, and it then increased to 87.93 GPa for SLAS and 90.12 GPa for BLAS. The hardness and modulus values were equivalent to or better than those of other LAS glasses with different modifications (Table 2). The change in the hardness and elastic modulus of the glass–ceramics could originate from crystal phases and crystallinity. The close hardness and elastic modulus between LAS and BLAS could result from similar crystal phases (Figure 6 LAS, BLAS) and morphologies (Figure 7a,e).
The Vickers hardness and elastic modulus increased after heat treatment, for all the glass, due to the formation of crystals in the glass matrix (Figure 9). When crystallized at 680 °C, the BLAS glass–ceramic exhibited a Vickers hardness of ~7.56 GPa due to the low crystallinity of ~34.71%. When the crystallization temperature continued to increase to 700 °C, 740 °C, and 780 °C, the crystallinities were ~43.89%, ~60.87%, and ~63.21%, respectively. The Vickers hardness of the BLAS glass–ceramic increased with increasing crystallinity. Meanwhile, the LAS and RLAS glass–ceramic samples had similar trends. Therefore, as the crystallization temperature increased, the crystallinity of the glass and the proportion of the crystalline phase increased, thus increasing the Vickers hardness of the glass–ceramics. The Vickers hardness of BLAS microcrystals at 780 °C was as high as 8.53 GPa, and the elastic modulus was as high as 90.12 GPa. At the same time, the Vickers hardness of LAS microcrystals at 780 °C was as high as 8.52 GPa, and the elastic modulus was as high as 90.01 GPa. The Vickers hardness and modulus were improved due to the crystallization of the glass and were highly dependent on the crystalline phase. It is reasonable to believe that the high hardness and high elastic modulus of BLAS came from the effect of the LiAlSi4O10 crystal phase.
Crack resistance (CR) is the critical indentation load measured by a Vickers indenter and can be used to evaluate the crack germination hindering ability of a glass [37]. In order to evaluate the fracturing resistance of the glass and glass–ceramics, the CR value of the glass and glass–ceramics are shown in Figure 10, along with the relationship between the load value and cracking probabilities of the highest CR value of MLAS for the glass (Figure 10a inset) and CLAS for the glass–ceramics (Figure 10b inset). For the glass (Figure 10a), the CR values rapidly increased to 5.37 N due to MgO introduction and then decreased with other larger alkali earth oxides. Generally, glasses with stronger oxide bonds have higher crack resistance due to higher fracture surface energy [38,39]. The high-field-strength cation (Mg) could form a relatively strong oxidative bond with oxygen and exhibit a high CR due to its high fracture surface energy. Compared with the glass containing Mg, the glass containing Ca, Sr, and Ba had a larger atomic packing density (Figure 2b), which resulted in the decreased densification space and fragmentation resistance of the glass. In fact, the CR values of the MLAS and CLAS glass–ceramics were greatly improved, due to the MgO and CaO in the glass components. This was probably because the main crystal phases in the MLAS sample were MgAl2Si4O12 and LixAlxSi3−xO6, and the main crystal phase in the CLAS sample was LixAlxSi3−xO6. The CR of CLAS being higher than that of the MLAS glass–ceramic was probably due to the formation of the high-expansion-quartz solid-solution MgAl2Si4O12 phase, which produced certain stress and reduced the anti-cracking ability. Meanwhile, the LAS, SLAS, and BLAS glass–ceramics showed decreased CR due to crystallization.
Table 2. Mechanical properties and crystalline phases of LAS microcrystalline glasses with different compositions.
Composition SystemCrystallization ProcessMain Crystalline PhasesVickers Hardness (GPa)Elastic Modulus (GPa)References
LAS680–750 °C/1–2 h + 800–950 °C/1–4 hβ-quartz, β-Spodumene6.5–7.595–110[40]
LAS + TiO2720 °C/0.5 h + 850 °C/1 hβ-quartz 6.8–7.380–90[41]
LAS + ZrO2700 °C/1 h + 880 °C/1.5 hβ-quartz7.2–7.6105–112[42]
MLAS640 °C/2 h + 780 °C/1 hMgAl2Si4O12, LixAlxSi3−xO68.6189.1This work

4. Conclusions

In conclusion, different alkali earth oxide-modified LAS glasses and glass–ceramics were prepared, and the density and molar volume of the glasses increased gradually with the increase in the alkaline earth oxide cation radius. The glass containing BaO showed the highest density and molar capacity, with a density of 2.67 g/cm3 and a molar volume of 24.21 cm3/mol. The introduction of MgO into the glass had an obvious effect on the microstructures, and Mg2+ had both glass formation and modifier roles in the glass, while CaO, SrO, and BaO introduction had weak influences. The glass transition and crystallization temperatures increased with MgO and then decreased with CaO, SrO, and BaO. Meanwhile, the CTE of the glass dropped due to MgO introduction and then increased, due to the decreasing electrical field intensities of alkali earth oxides with larger ionic radii. After heat treatment, different crystal phases were precipitated in the glass matrix, including Li2Si2O5, LiAlSi4O10, and SiO2 in the LAS glass, LixAlxSi3−xO6, MgAl2Si4O12, and SiO2 in the MLAS glass, LixAlxSi3−xO6 and SiO2 in the CLAS glass, and Li2SiO3 and LiAlSi4O10 in the SLAS glass, and similar crystal phases were precipitated in the BLAS glass and LAS glass. The evolution of the crystallization behaviors led to the different mechanical performances of the glass–ceramics. The introduction of MgO improved the hardness, which reached a maximum 8.61 GPa, while the elastic modulus reached a maximum of 89.1 GPa in the LAS glass–ceramics. Moreover, the crack resistance values showed a maximum for the MLAS glass and for the CLAS glass–ceramics, due to the glass structure and crystal phase change. This research can provide promising candidates for high-strength glass and glass–ceramics.

Author Contributions

Methodology, data curation, writing—original draft, writing—review and editing, C.Z.; methodology, data curation, investigation, D.L.; data curation, investigation, M.G.; conceptualization, methodology, project administration, writing—review and editing, supervision, J.Z.; project administration, writing—review and editing, supervision, J.X.; methodology, project administration, J.H. All authors have read and agreed to the published version of the manuscript.

Funding

This research was financially supported by the National Natural Science Foundation of China (52372033) and Guangxi Science and Technology Major Program (AA24263054).

Institutional Review Board Statement

Not applicable.

Informed Consent Statement

Not applicable.

Data Availability Statement

The data presented in this study are available on request from the corresponding author. The data are not publicly available due to privacy.

Conflicts of Interest

The authors declare no conflicts of interest.

References

  1. Fu, L.; Engqvist, H.; Xia, W. Glass–ceramics in dentistry: A Review. Materials 2020, 13, 1049. [Google Scholar] [CrossRef]
  2. Xing, Z.; Ling, J.; Hui, Y. Effects of Li replacement on the nucleation, crystallization and microstructure of Li2O-Al2O3-SiO2 glass. J. Non Cryst. Solids 2008, 354, 4031–4036. [Google Scholar]
  3. Kleebusch, E.; Patzig, C.; Krause, M.; Hu, Y.; Höche, T.; Rüssel, C. The formation of nanocrystalline ZrO2 nuclei in a Li2O-Al2O3-SiO2 glass— A combined XANES and TEM study. Sci. Rep. 2017, 7, 10869. [Google Scholar]
  4. Beall, G.H.; Monique, C.; Dejneka, M.J.; Paulo, M.; Philippe, P. Ion-Exchange in glass-ceramics. Front. Mater. 2016, 3, 41. [Google Scholar]
  5. Venkateswaran, C.; Sreemoolanadhan, H.; Vaish, R. Lithium aluminosilicate (LAS) glass-ceramics: A review of recent progress. Int. Mater. Rev. 2021, 67, 620–657. [Google Scholar]
  6. Karmakar, B.; Kundu, P.; Jana, S.; Dwivedi, R.N. Crystallization kinetics and mechanism of low-expansion lithium aluminosilicate glass-ceramics by dilatometry. J. Am. Ceram. Soc. 2002, 85, 2572–2574. [Google Scholar]
  7. Zanotto, E.D. Bright future for glass-ceramics. J. Am. Ceram. Soc. Bull. 2010, 89, 19–27. [Google Scholar]
  8. Hasselman, D.; Donaldson, K.Y. Thermal conductivity of vapor-liquid-solid and vapor-solid silicon carbide whisker-reinforced lithium aluminosilicate glass-ceramic composites. J. Am. Ceram. Soc. 1996, 79, 742–748. [Google Scholar]
  9. Soares, V.O.; Serbena, F.C.; Mathias, I.; Crovace, M.C.; Zanotto, E.D. New, tough and strong lithium metasilicate dental glass-ceramic. Ceram. Int. 2021, 47, 2793–2801. [Google Scholar]
  10. Łączka, K.; Cholewa-Kowalska, K.; Środa, M.; Rysz, J.; Marzec, M.M.; Łączka, M. Glass–ceramics of LAS (Li2O-Al2O3-SiO2) system enhanced by ion-exchange in KNO3 salt bath. J. Non Cryst. Solids 2015, 428, 90–97. [Google Scholar]
  11. Sasmal, N.; Garai, M.; Molla, A.R.; Tarafder, A.; Singh, S.P.; Karmakar, B. Effects of lanthanum oxide on the properties of barium-free alkaline-earth borosilicate sealant glass. J. Non Cryst. Solids 2014, 387, 62–70. [Google Scholar]
  12. Nakane, S. Recent research on Li2O-Al2O3-SiO2 glass-ceramics for expansion of applications. J. Non Cryst. Solids X 2022, 16, 100121. [Google Scholar]
  13. Sun, T.; Zheng, C.; Zhang, F.; Zhang, J.; Han, J.; Xie, J.; He, J.; Jiang, H. Xie. Mixed CaO/MgO effect on microstructure, mechanical properties and crystallization behavior of Li2O-Al2O3-SiO2-ZrO2-P2O5 glass. J. Non Cryst. Solids 2023, 616, 122457. [Google Scholar]
  14. Zhang, X.; Wang, J.; Han, J. Crystallization kinetics, structural and mechanical properties of transparent lithium alumino-silicate glass-ceramics. J. Non Cryst. Solids 2023, 603, 122113. [Google Scholar]
  15. Fabris, D.C.N.; Miguel, E.H.; Vargas, R.; Canto, R.B.; Villas-Boas, M.d.O.C.; Peitl, O.; Sglavo, V.M.; Zanotto, E.D. Microstructure, residual stresses, and mechanical performance of surface crystallized translucent glass-ceramics. J. Eur. Ceram. Soc. 2022, 42, 4631–4642. [Google Scholar]
  16. Yang, J.; Xing, J.; Zheng, Q.; Qiao, A.; Tao, H. Transparent surface crystallized aluminosilicate glasses with an ultrahigh crack resistance. J. Non Cryst. Solids 2024, 635, 122996. [Google Scholar]
  17. Kim, S.-W.; Lee, H.-S.; Jun, D.-S. Enhancing the Plasma-Resistance Properties of Li2O-Al2O3-SiO2 Glasses for the Semiconductor Etch Process via Alkaline Earth Oxide Incorporation. Materials 2023, 16, 5112. [Google Scholar] [CrossRef]
  18. Weigel, C.; Le Losq, C.; Vialla, R.; Dupas, C.; Clément, S.; Neuville, D.R.; Rufflé, B. Elastic moduli of XAlSiO4 aluminosilicate glasses: Effects of charge-balancing cations. J. Non Cryst. Solids 2016, 447, 267–272. [Google Scholar] [CrossRef]
  19. Shelby, J.E. Introduction to Glass Science and Technology; Royal Society of Chemistry: Edinburgh, UK, 2020. [Google Scholar]
  20. Wada, M.; Furukawa, H.; Fujita, K. Crack resistance of glass on Vickers indentation. Proc. X Int. Congr. Glass. 1974, 11, 39–46. [Google Scholar]
  21. Fry, A.L.; Krug, C.; Ladinger, L. Fracture toughness of Ca-, Sr-, and Ba-aluminoborosilicate glasses. J. Am. Ceram. Soc. 2023, 107, 830–843. [Google Scholar]
  22. Furukawa, T.; Fox, K.E.; White, W.B. Raman spectroscopic investigation of the structure of silicate glasses. III. Raman intensities and structural units in sodium silicate glasses. J. Chem. Phys. 1981, 75, 226–3237. [Google Scholar] [CrossRef]
  23. Ross, S.; Welsch, A.M.; Behrens, H. Lithium conductivity in glasses of the Li2O-Al2O3-SiO2 system. Phys. Chem. Chem. Phys. 2015, 17, 465–474. [Google Scholar] [CrossRef] [PubMed]
  24. Poe, B.T.; McMillan, P.F.; Coté, B.; Massiot, D.; Coutures, J. Structure and Dynamics in Calcium Aluminate Liquids: High-Temperature 27Al NMR and Raman Spectroscopy. J. Am. Ceram. Soc. 1994, 77, 1832–1838. [Google Scholar] [CrossRef]
  25. Ke, X.; Wang, X.; Wang, Y.; Ren, X.; Tao, H. Mg and Al mixed effects on thermal properties in aluminosilicate glasses. J. Am. Ceram. Soc. 2023, 106, 7449–7459. [Google Scholar] [CrossRef]
  26. Qu, W.; Liu, S.; Xiao, Z.; Ma, J.; Wei, M. Rheological and thermodynamic properties of alkaline earth oxide bearing silicate glasses: Implication of structural role of Mg2+ in peralkaline glasses. J. Alloy. Compd. 2016, 661, 1–5. [Google Scholar] [CrossRef]
  27. Kolay, S.; Bhargava, P. Role of MgO in Lowering Glass Transition Temperature and Increasing Hardness of Lithium Silicate Glass and Glass-Ceramics. Ceram. Int. 2022, 48, 12699–12711. [Google Scholar] [CrossRef]
  28. Park, S.Y.; Lee, S.K. High-resolution solid-state NMR study of the effect of composition on network connectivity and structural disorder in multi-component glasses in the diopside and jadeite join: Implications for structure of andesitic melts. Geochim. Cosmochim. Acta 2014, 147, 26–42. [Google Scholar] [CrossRef]
  29. Jakobsen, H.J.; Skibsted, J.; Bildsøe, H.; Nielsen, N.C. Magic-angle spinning NMR spectra of satellite transitions for quadrupolar nuclei in solids. J. Magn. Reson. 1989, 85, 173–180. [Google Scholar] [CrossRef]
  30. Goswami, M.; Kothiyal, G.P.; Montagne, L.; Delevoye, L. MAS-NMR study of lithium zinc silicate glasses and glass-ceramics with various ZnO content. J. Solid State Chem. 2008, 181, 269–275. [Google Scholar] [CrossRef]
  31. Stebbins, J.F.; Kroeker, S.; Lee, S.K.; Kiczenski, T. Quantification of five-and six-coordinated aluminum ions in aluminosilicate and fluoride-containing glasses by high-field, high-resolution 27Al NMR. J. Non Cryst. Solids 2000, 275, 1–6. [Google Scholar] [CrossRef]
  32. Lilensten, L.; Fu, Q.; Wheaton, B.R.; Credle, A.J.; Stewart, R.L.; Kohli, J.T. Kinetic study on lithium-aluminosilicate (LAS) glass-ceramics containing MgO and ZnO. Ceram. Int. 2014, 40, 11657–11661. [Google Scholar]
  33. Lu, Z.; Lu, J.; Li, X.; Shao, G. Effect of MgO addition on sinter ability, crystallization kinetics, and flexural strength of glass–ceramics from waste materials. Ceram. Int. 2016, 42, 3452–3459. [Google Scholar]
  34. Shan, Z.; Li, C.; Tao, H. Mixed alkaline-earth effect on the mechanical and rheological properties of Ca–Mg silicate glasses. J. Am. Ceram. Soc. 2017, 100, 4570–4580. [Google Scholar] [CrossRef]
  35. Hou, Y.; Cheng, J.; Kang, J.; Yuan, J. Structure, glass stability and rheological properties of Na2O-CaO-Al2O3-SiO2 glasses doped with Y2O3. Ceram. Silik. 2018, 62, 173–180. [Google Scholar]
  36. Atila, A.; Ghardi, E.M.; Ouaskit, S.; Hasnaoui, A. Atomistic insights into the impact of charge balancing cations on the structure and properties of aluminosilicate glasses. Phys. Rev. B 2019, 100, 144109. [Google Scholar]
  37. Moysan, C.; Riedel, R.; Harshe, R.; Rouxel, T.; Augereau, F. Mechanical characterization of a polysiloxane-derived SiOC glass. J. Eur. Ceram. Soc. 2006, 27, 397–403. [Google Scholar]
  38. Hermansen, C.; Matsuoka, J.; Yoshida, S.; Yamazaki, H.; Kato, Y.; Yue, Y. Densification and plastic deformation under microindentation in silicate glasses and the relation to hardness and crack resistance. J. Non Cryst. Solids 2013, 364, 40–43. [Google Scholar]
  39. Rouxel, T.; Yoshida, S. The fracture toughness of inorganic glasses. J. Am. Ceram. Soc. 2017, 100, 4374–4396. [Google Scholar]
  40. Beall, G.H. Design and Properties of Glass-Ceramics. Annu. Rev. Mater. Sci. 1992, 22, 91–119. [Google Scholar]
  41. Höland, W.; Rheinberger, V.; Schweiger, M. Studies on Crystal Phase Formation in Lithium Aluminosilicate Glass-Ceramics. J. Eur. Ceram. Soc. 1999, 19, 2277–2283. [Google Scholar]
  42. Cheng, X.; Li, Y. Effect of ZrO2 on LAS Glass-Ceramics. Ceram. Int. 2018, 44, 16368–16375. [Google Scholar]
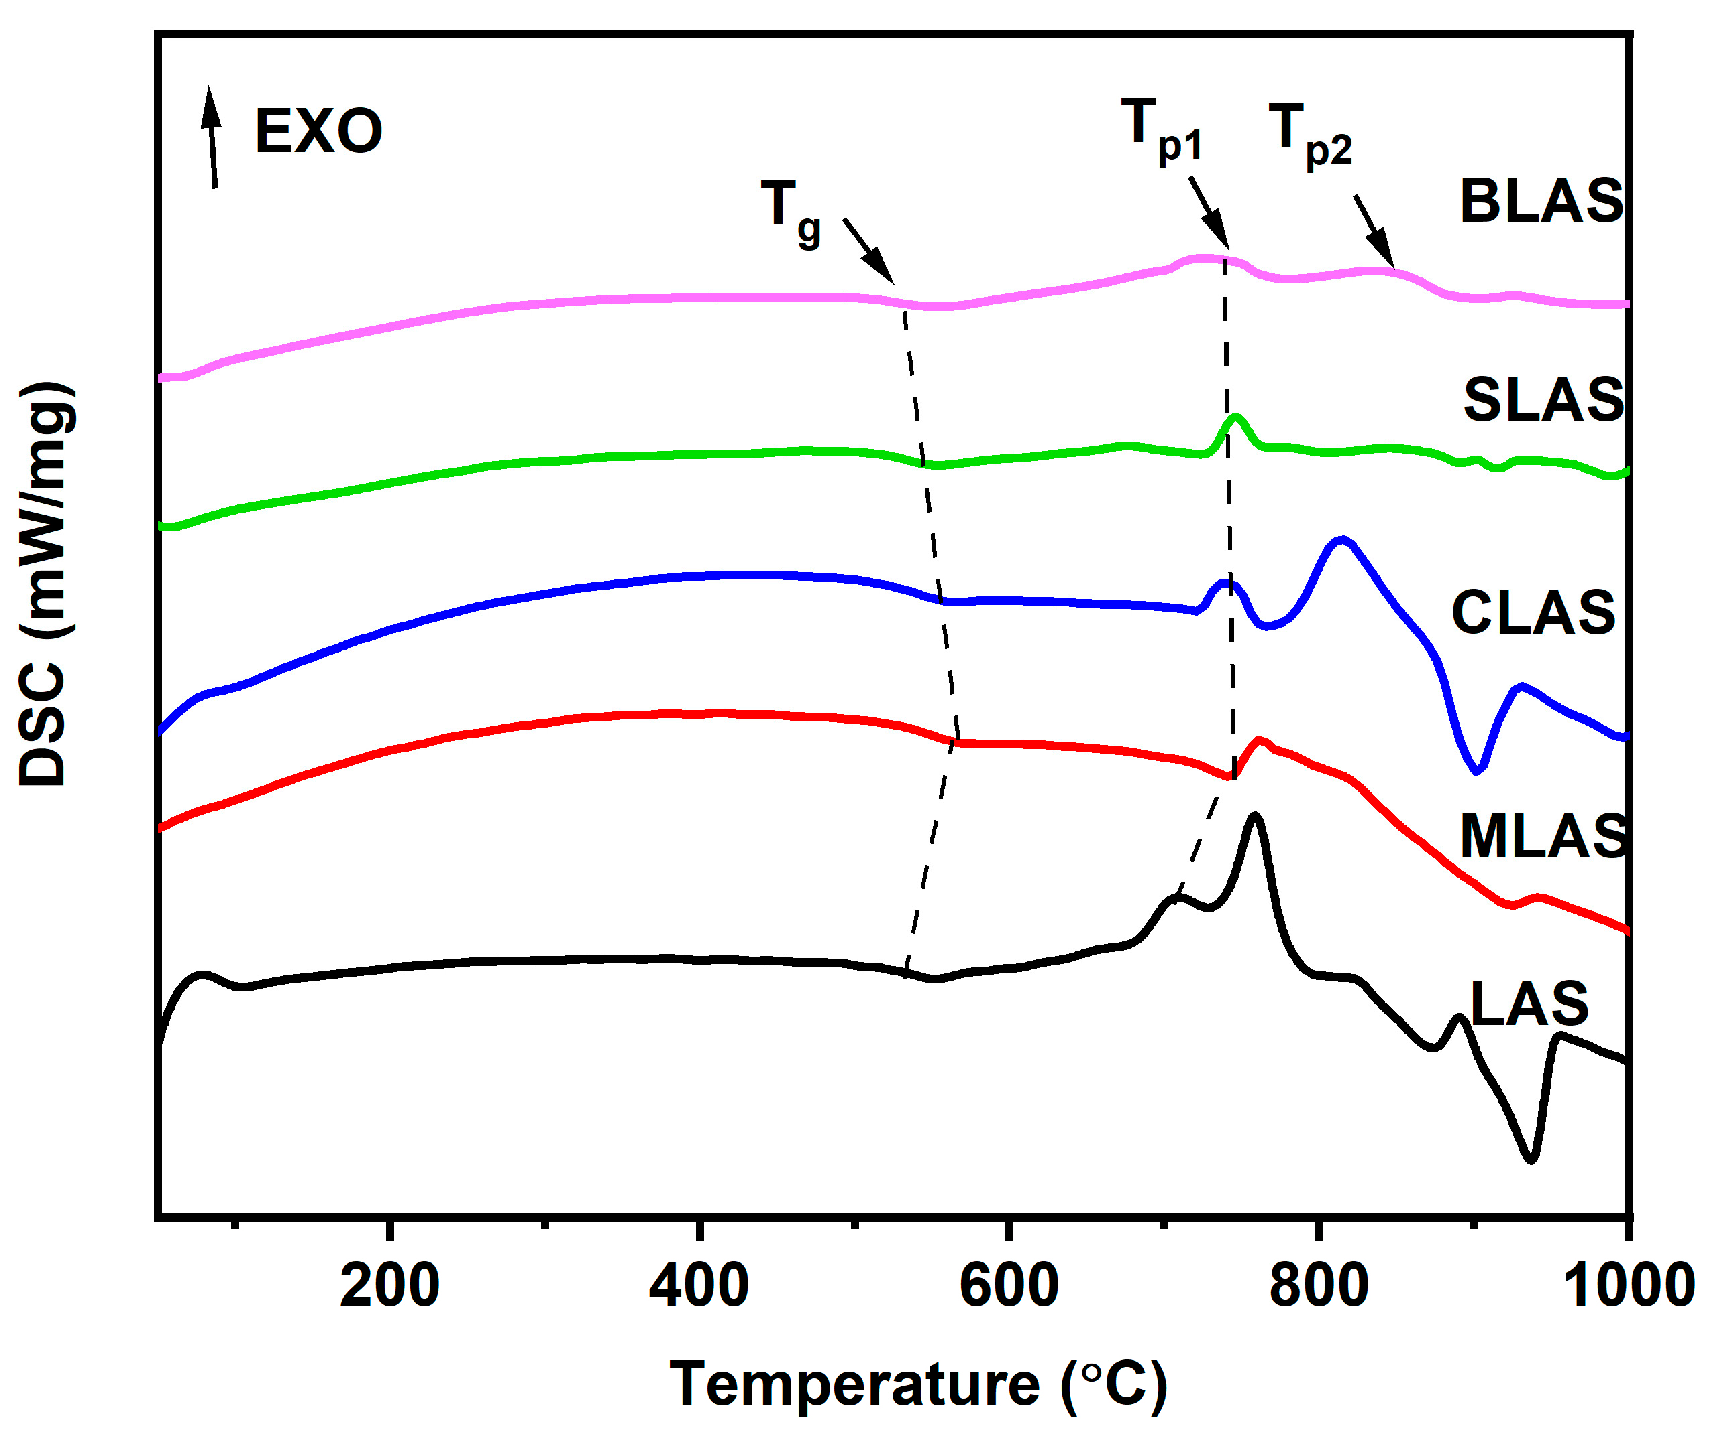
Figure 1. The XRD patterns (a) and the densities and molar volumes of LAS and RLAS glass (b).
Materials 18 01383 g001
Figure 2. The Raman spectra of the LAS and RLAS glasses. The spectra are shifted vertically for clarity (a). Normalized Raman spectra in the range of 300–1250 cm−1 (b) and in the range of 850~1250 cm−1 (c).
Materials 18 01383 g002
Figure 3. 29Si MAS NMR spectra (a) and 27Al MAS NMR spectra (b) of LAS and RLAS glasses.
Materials 18 01383 g003
Figure 4. DSC diagram of LAS and RLAS glasses.
Materials 18 01383 g004
Figure 5. The temperature dependence of the glass rod length change (a) and calculated CTE (b) of LAS and RLAS glasses.
Materials 18 01383 g005
Figure 6. XRD patterns of glass–ceramics: LAS, MLAS, CLAS, SLAS, and BLAS, after heat treatment at 640 °C for 2 h and 680–780 °C for 1 h.
Materials 18 01383 g006
Figure 7. SEM images of nanocrystals in LAS (a), MLAS (b), CLAS (c), SLAS (d), and BLAS (e) glass–ceramics after two-step heat treatment at 640 °C for 2 h and 780 °C for 1 h.
Materials 18 01383 g007
Figure 8. The Vickers hardness and the elastic modulus of the LAS and RLAS glasses (a) and glass–ceramics (b) after the two-step heat treatment at 640 °C for 2 h and 780 °C for 1 h.
Materials 18 01383 g008
Figure 9. The Vickers hardness and the elastic modulus of the LAS and RLAS glass–ceramics, with different second-step heat-treatment temperatures (GPa).
Materials 18 01383 g009
Figure 10. The cracking resistance of LAS and RLAS glasses. (a) Inset: the dependence of cracking probabilities on the load of the MLAS glass and glass–ceramics after two-step heat treatment at 640 °C for 2 h and 780 °C for 1 h. (b) Inset: the dependence of cracking probabilities on the load of CLAS glass–ceramics.
Materials 18 01383 g010
Table 1. The glass transition temperature (Tg), the first crystallization peak temperature (Tp1), and the second crystallization peak temperature (Tp2) of LAS and RLAS glasses obtained from the DSC diagram.
LASMLASCLASSLASBLAS
Tg (°C)501.4547.3534.3529.7528.4
Tp1 (°C)708.5741.4738.7687.8685.9
Tp2 (°C)758.3827.7814.2734.0731.2
Disclaimer/Publisher’s Note: The statements, opinions and data contained in all publications are solely those of the individual author(s) and contributor(s) and not of MDPI and/or the editor(s). MDPI and/or the editor(s) disclaim responsibility for any injury to people or property resulting from any ideas, methods, instructions or products referred to in the content.

