
Evolution of Compaction Characteristics and Void Features in Stone Mastic Asphalt Mixtures Based on Computed Tomography Images

Abstract
:1. Introduction
2. Materials and Methods
2.1. Materials
2.2. Methods
2.2.1. Preparation of Marshall Specimens with a Variable Number of Blows
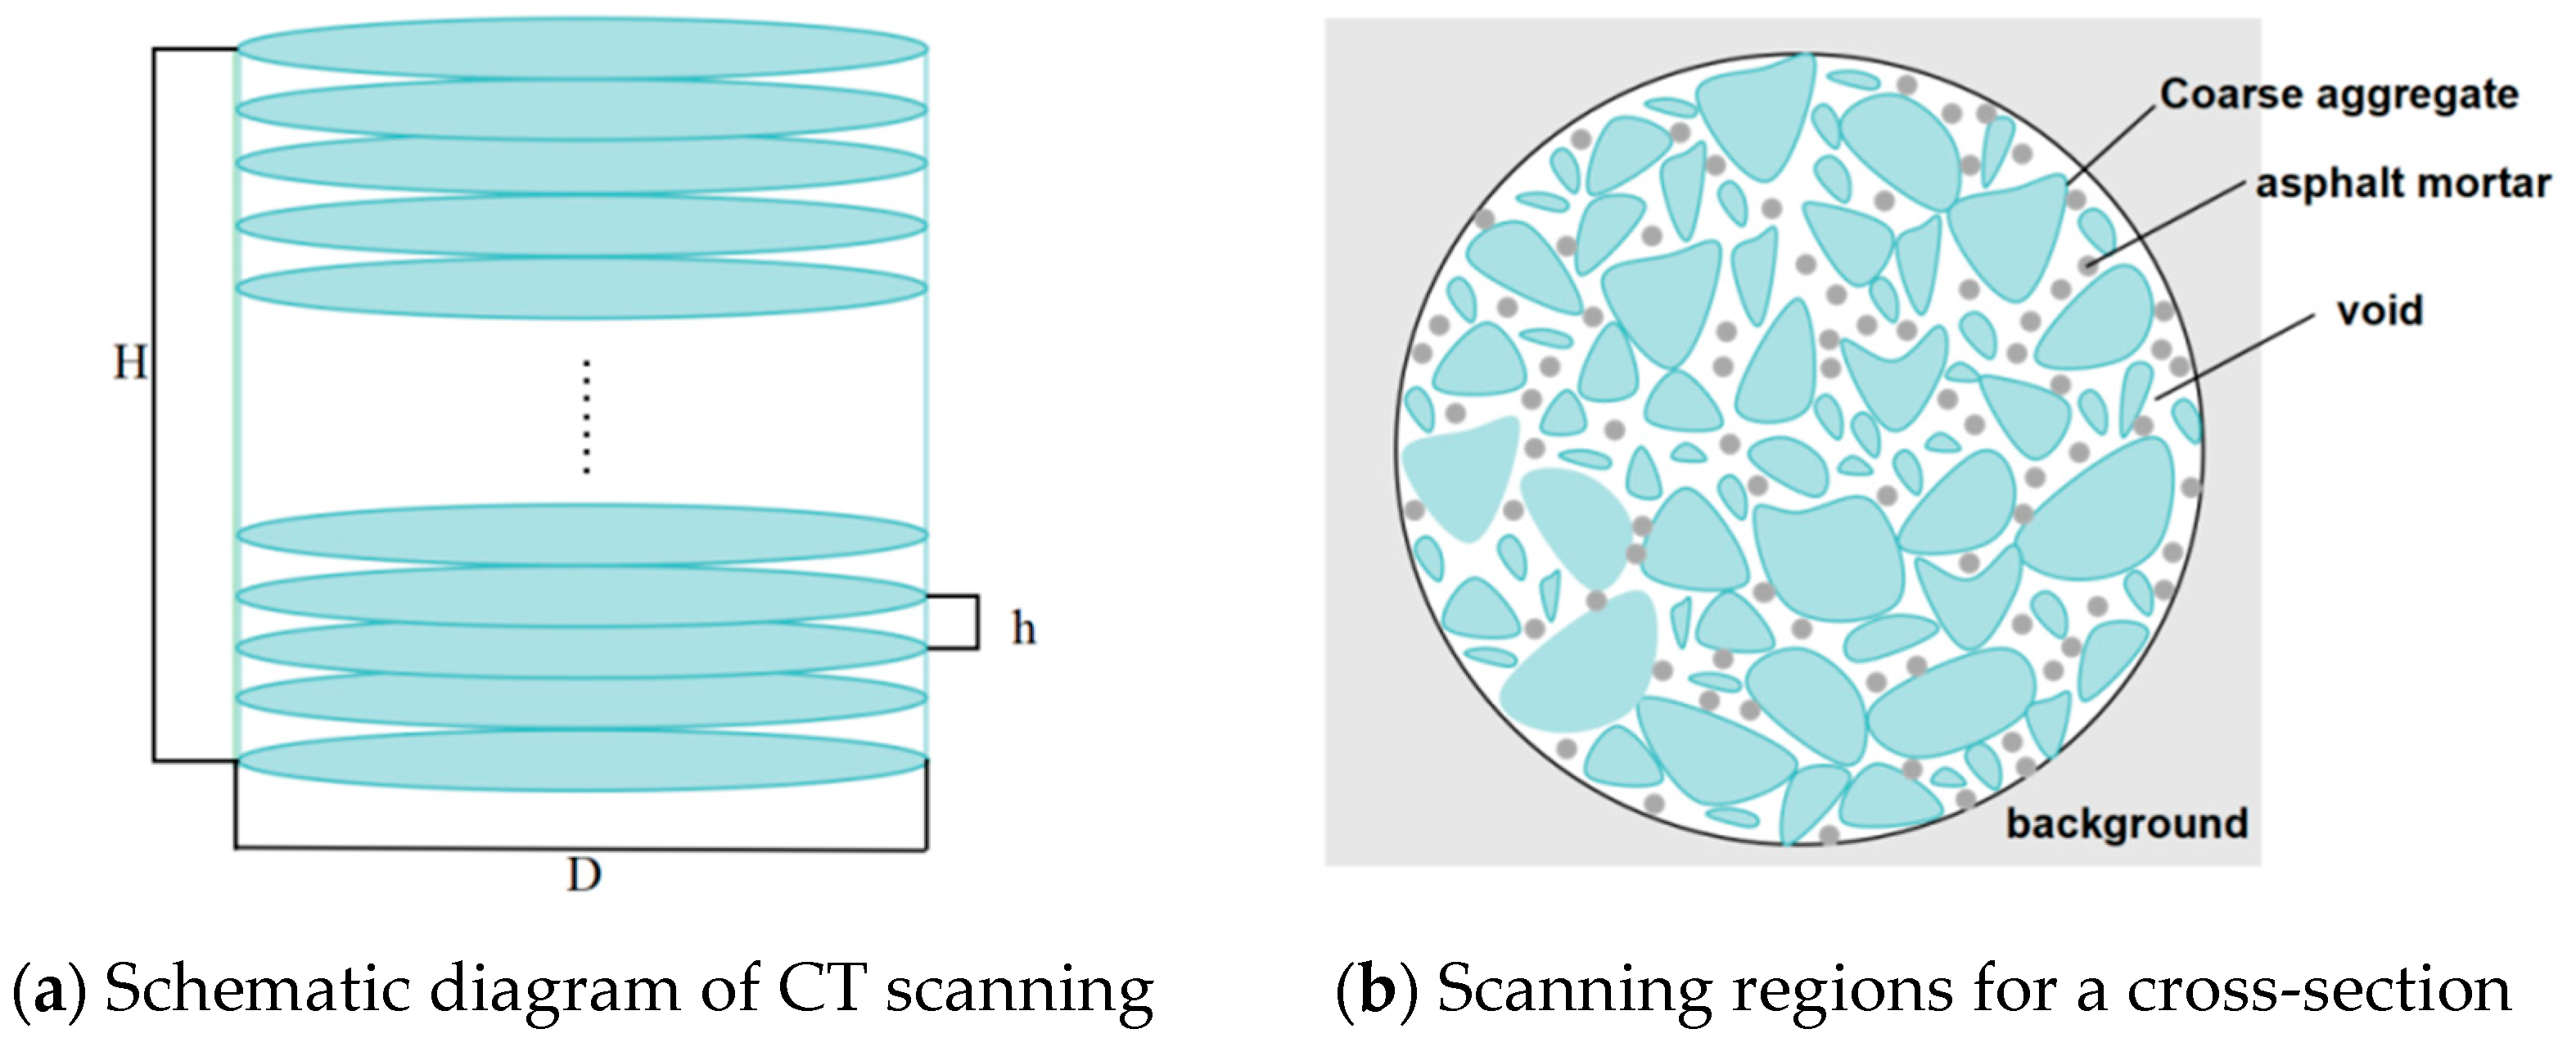
2.2.2. Computerized Tomography (CT) Scanning Test
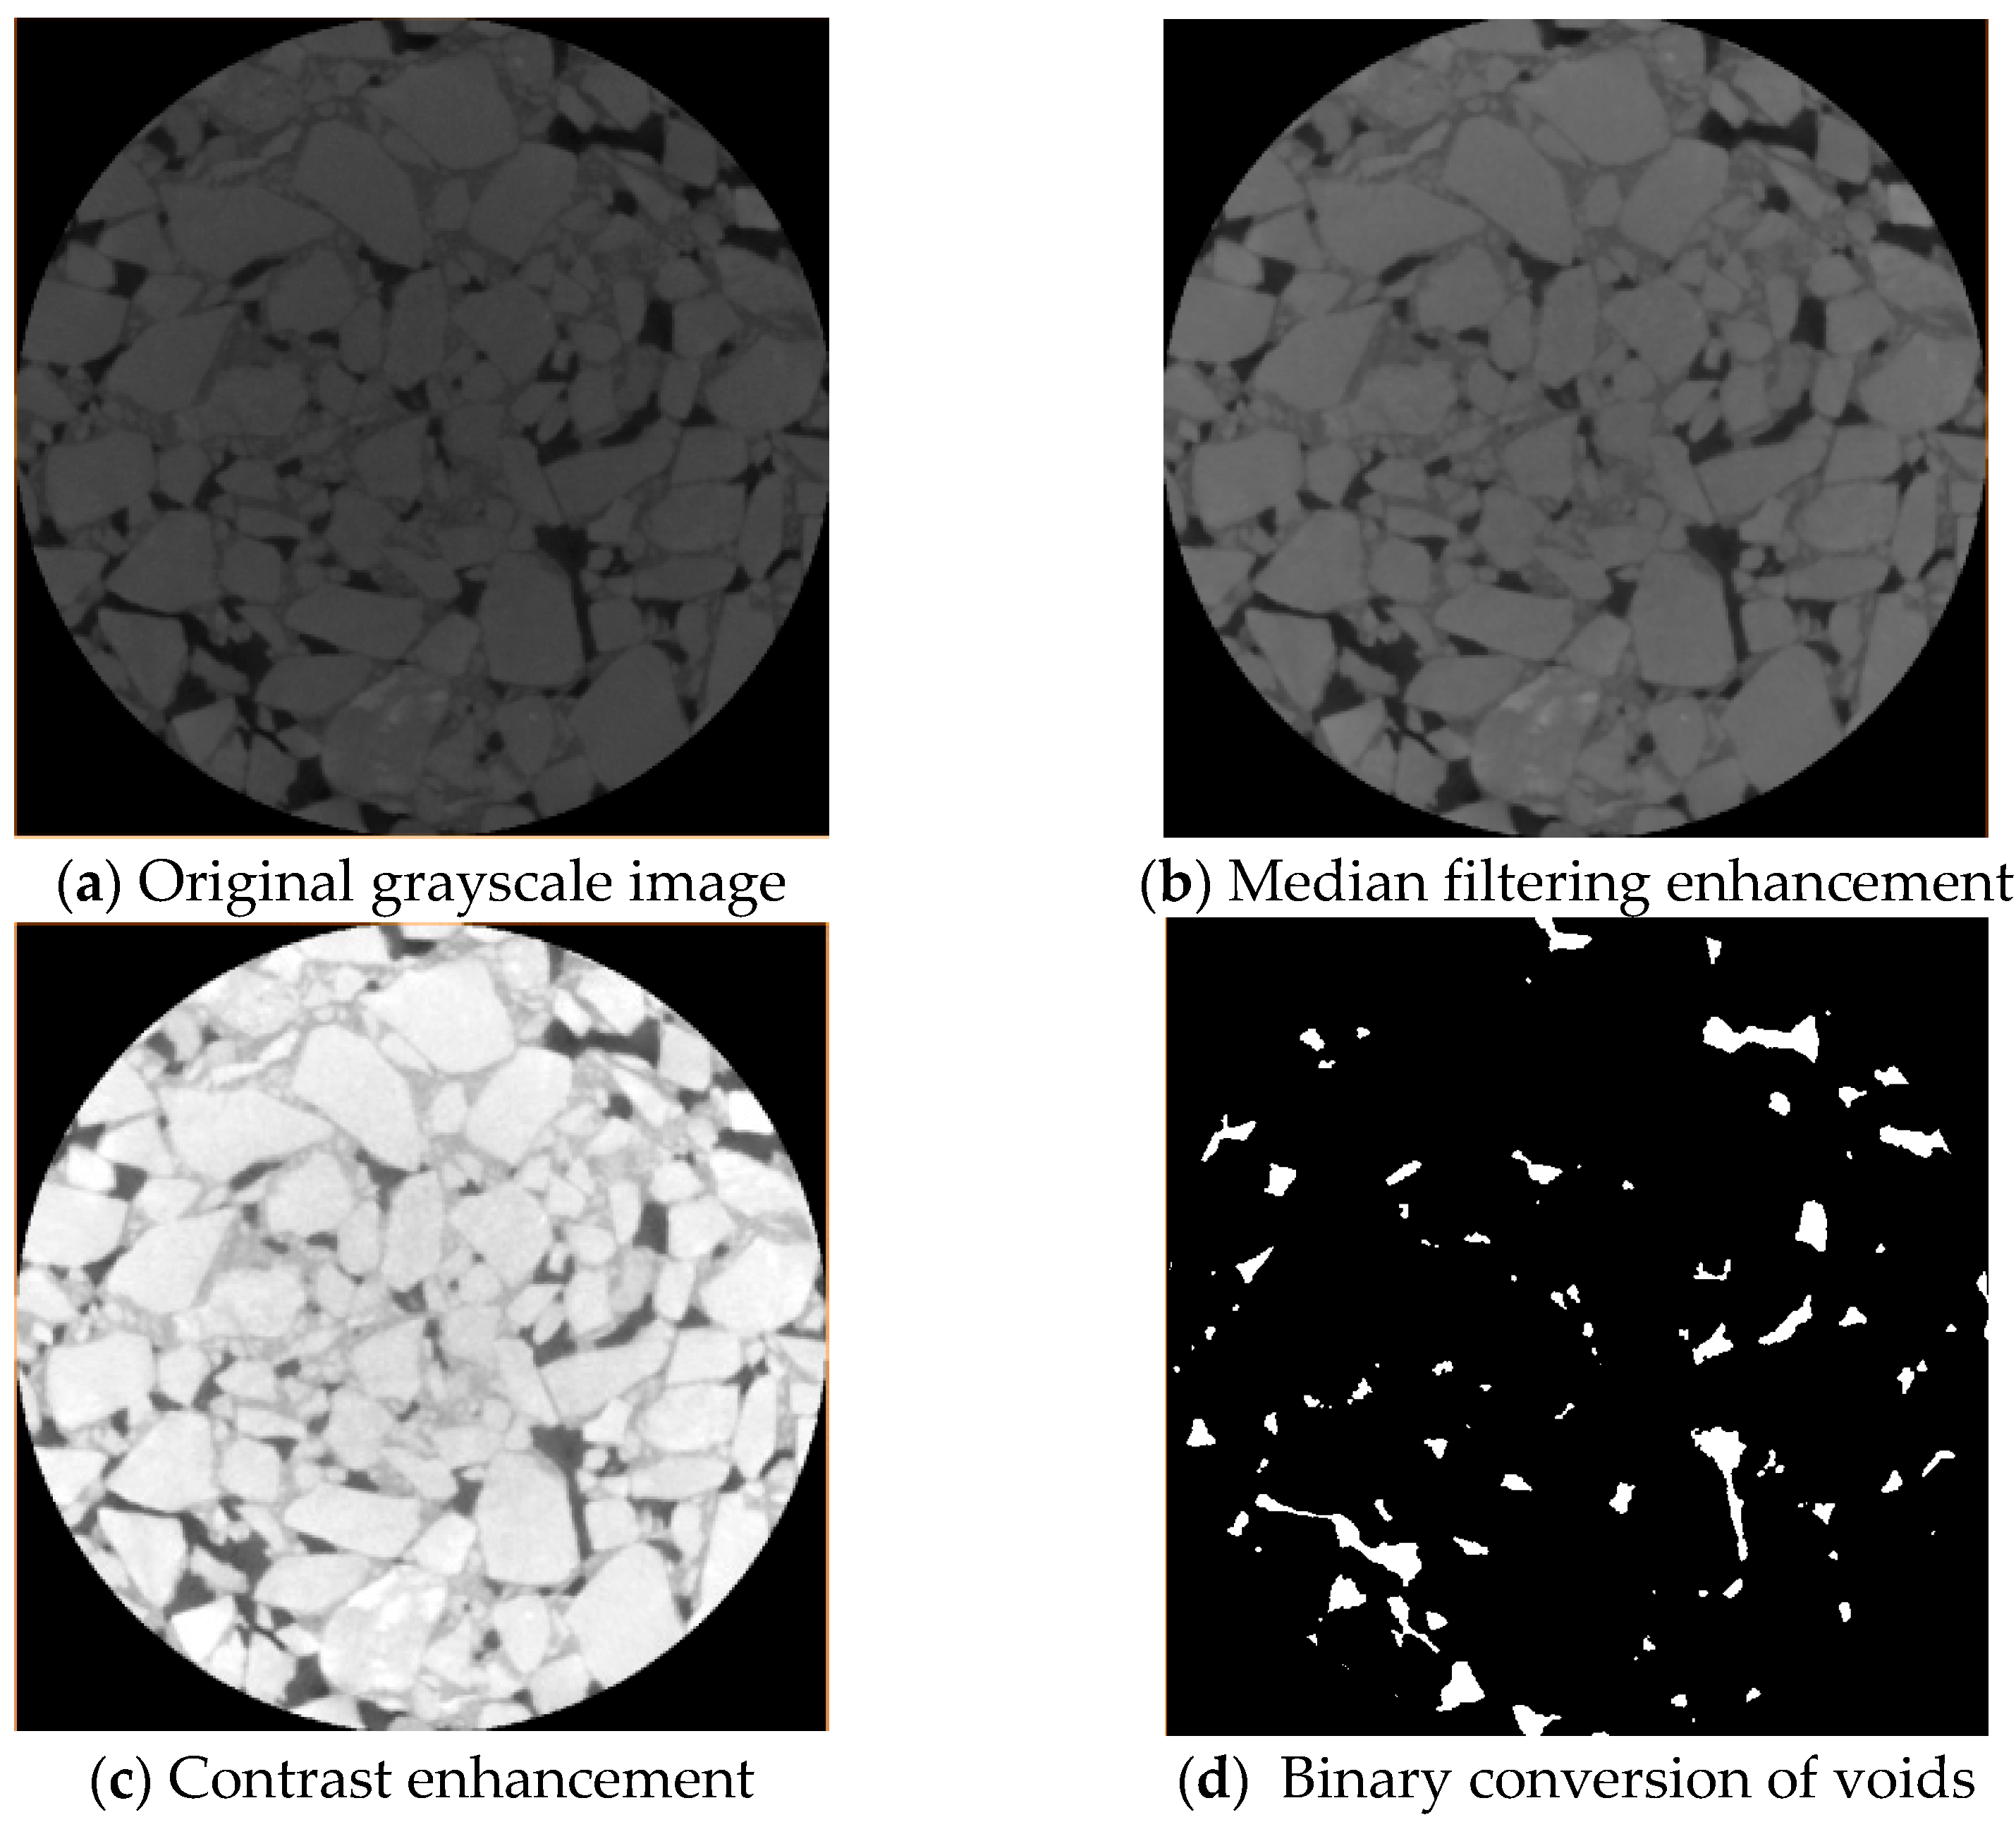
2.2.3. Digital Image Processing and Void Identification
2.2.4. Define the Compaction Degree and Void Ratio
2.2.5. Calculation of Void Features in Digital Images
3. Results and Discussion
3.1. Analysis of Compaction Evolution
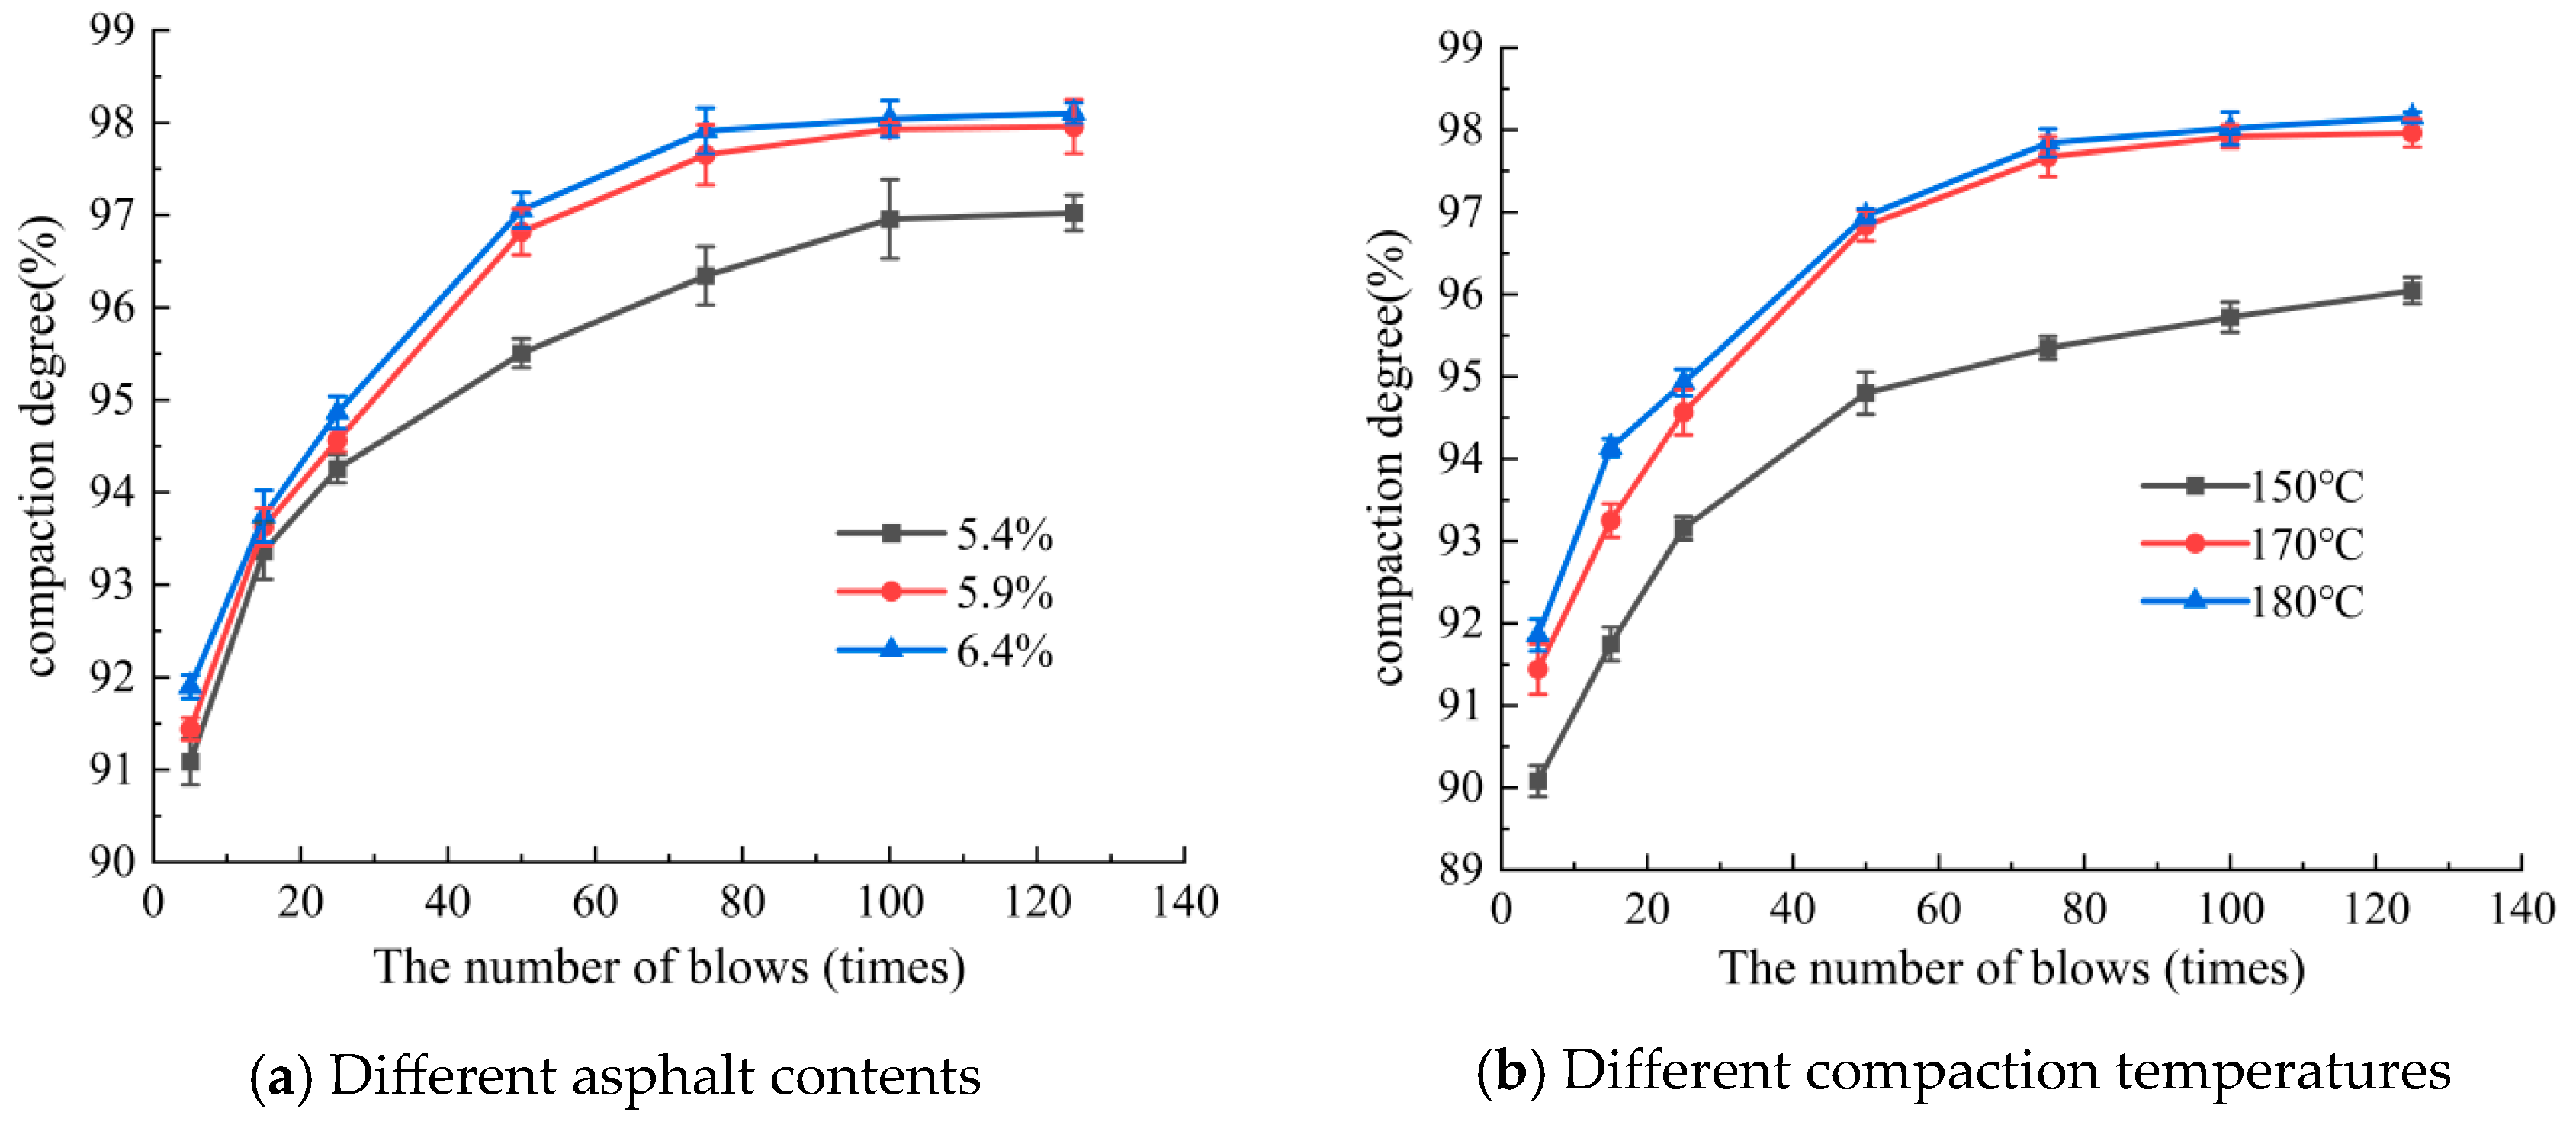
3.1.1. Impact of Asphalt Content
3.1.2. Effect of Initial Compaction Temperature
3.2. Compaction Numerical Regression Model and Compaction Coefficient
3.2.1. Compaction Numerical Regression Model
3.2.2. The Evaluation Index: Compaction Coefficient
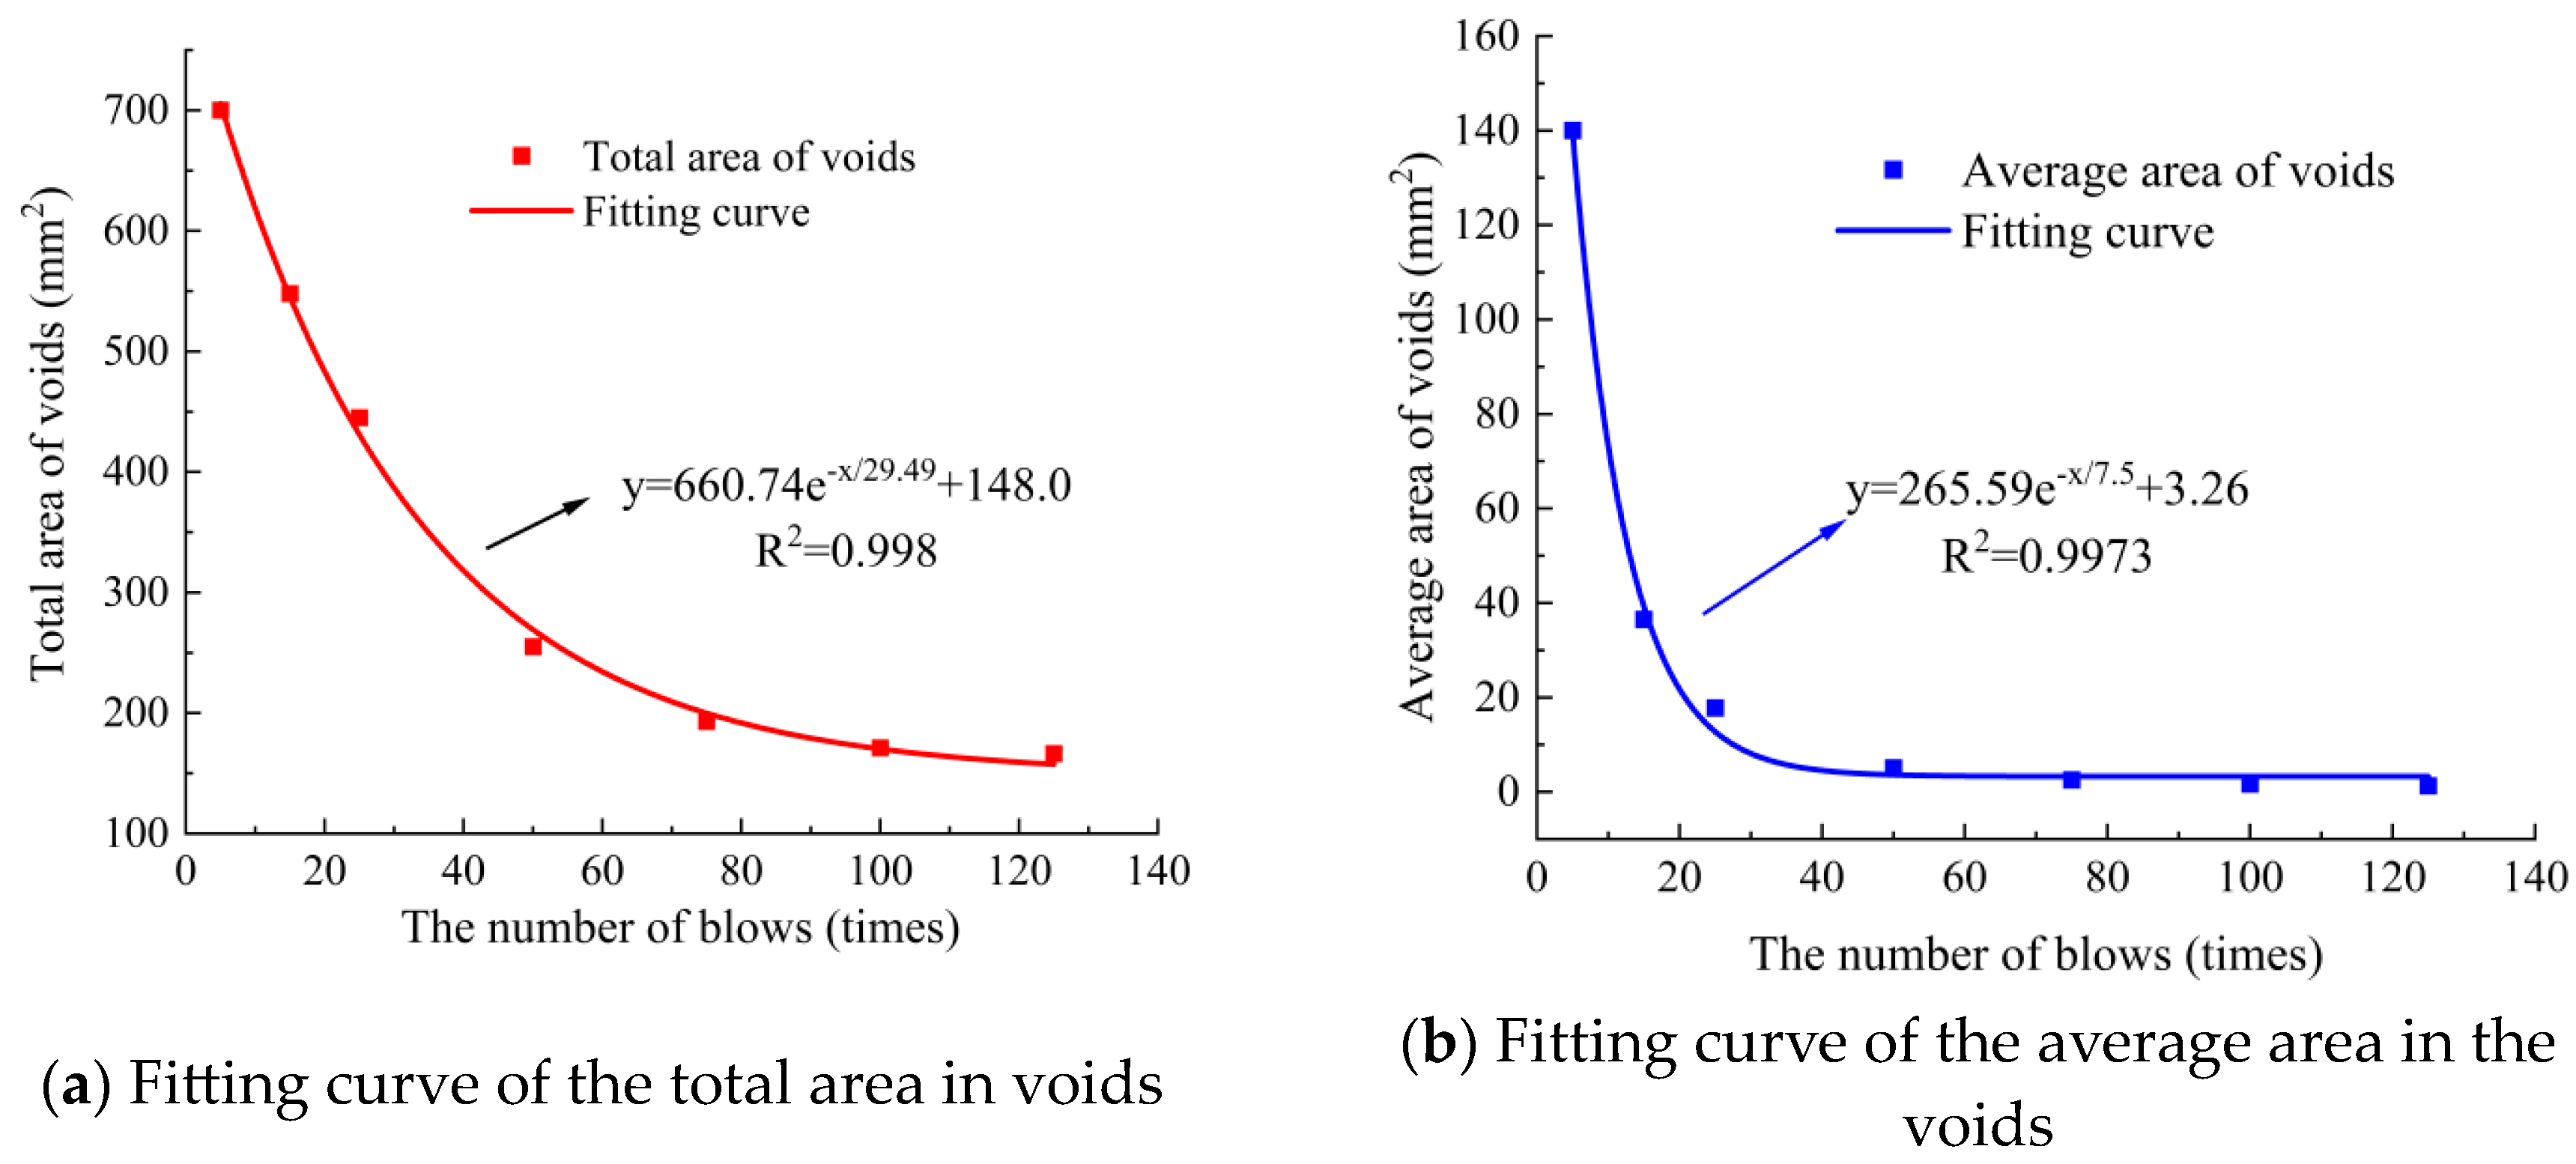
3.3. Evolution of Void Characteristics During Compaction
3.4. Distribution and Evolution of Void Ratio
4. Conclusions
- The compaction curve of SMA-13 increases exponentially during compaction, and the established numerical regression model of compaction can better characterize the compaction characteristics of SMA-13. The compaction characteristics of SMA-13 are significantly correlated with the initial compaction degree (), ultimate compaction degree () and curvature factor (). The compaction coefficient () can effectively evaluate the compaction difficulty of SMA-13. When the compaction coefficient is larger, SMA-13 is easier to compact, and the compaction effect is better.
- The void ratio, number of voids, and void area of SMA-13 during compaction show exponential function decay and exponential function correlation with the number of blows of compaction. At the early compaction (0–25 times), the compaction degree grows fastest, and it is easiest to compact, but it becomes more and more difficult to compact in the middle and late stages. Therefore, the construction should pay special attention to the initial compaction, which can obtain better compaction performance.
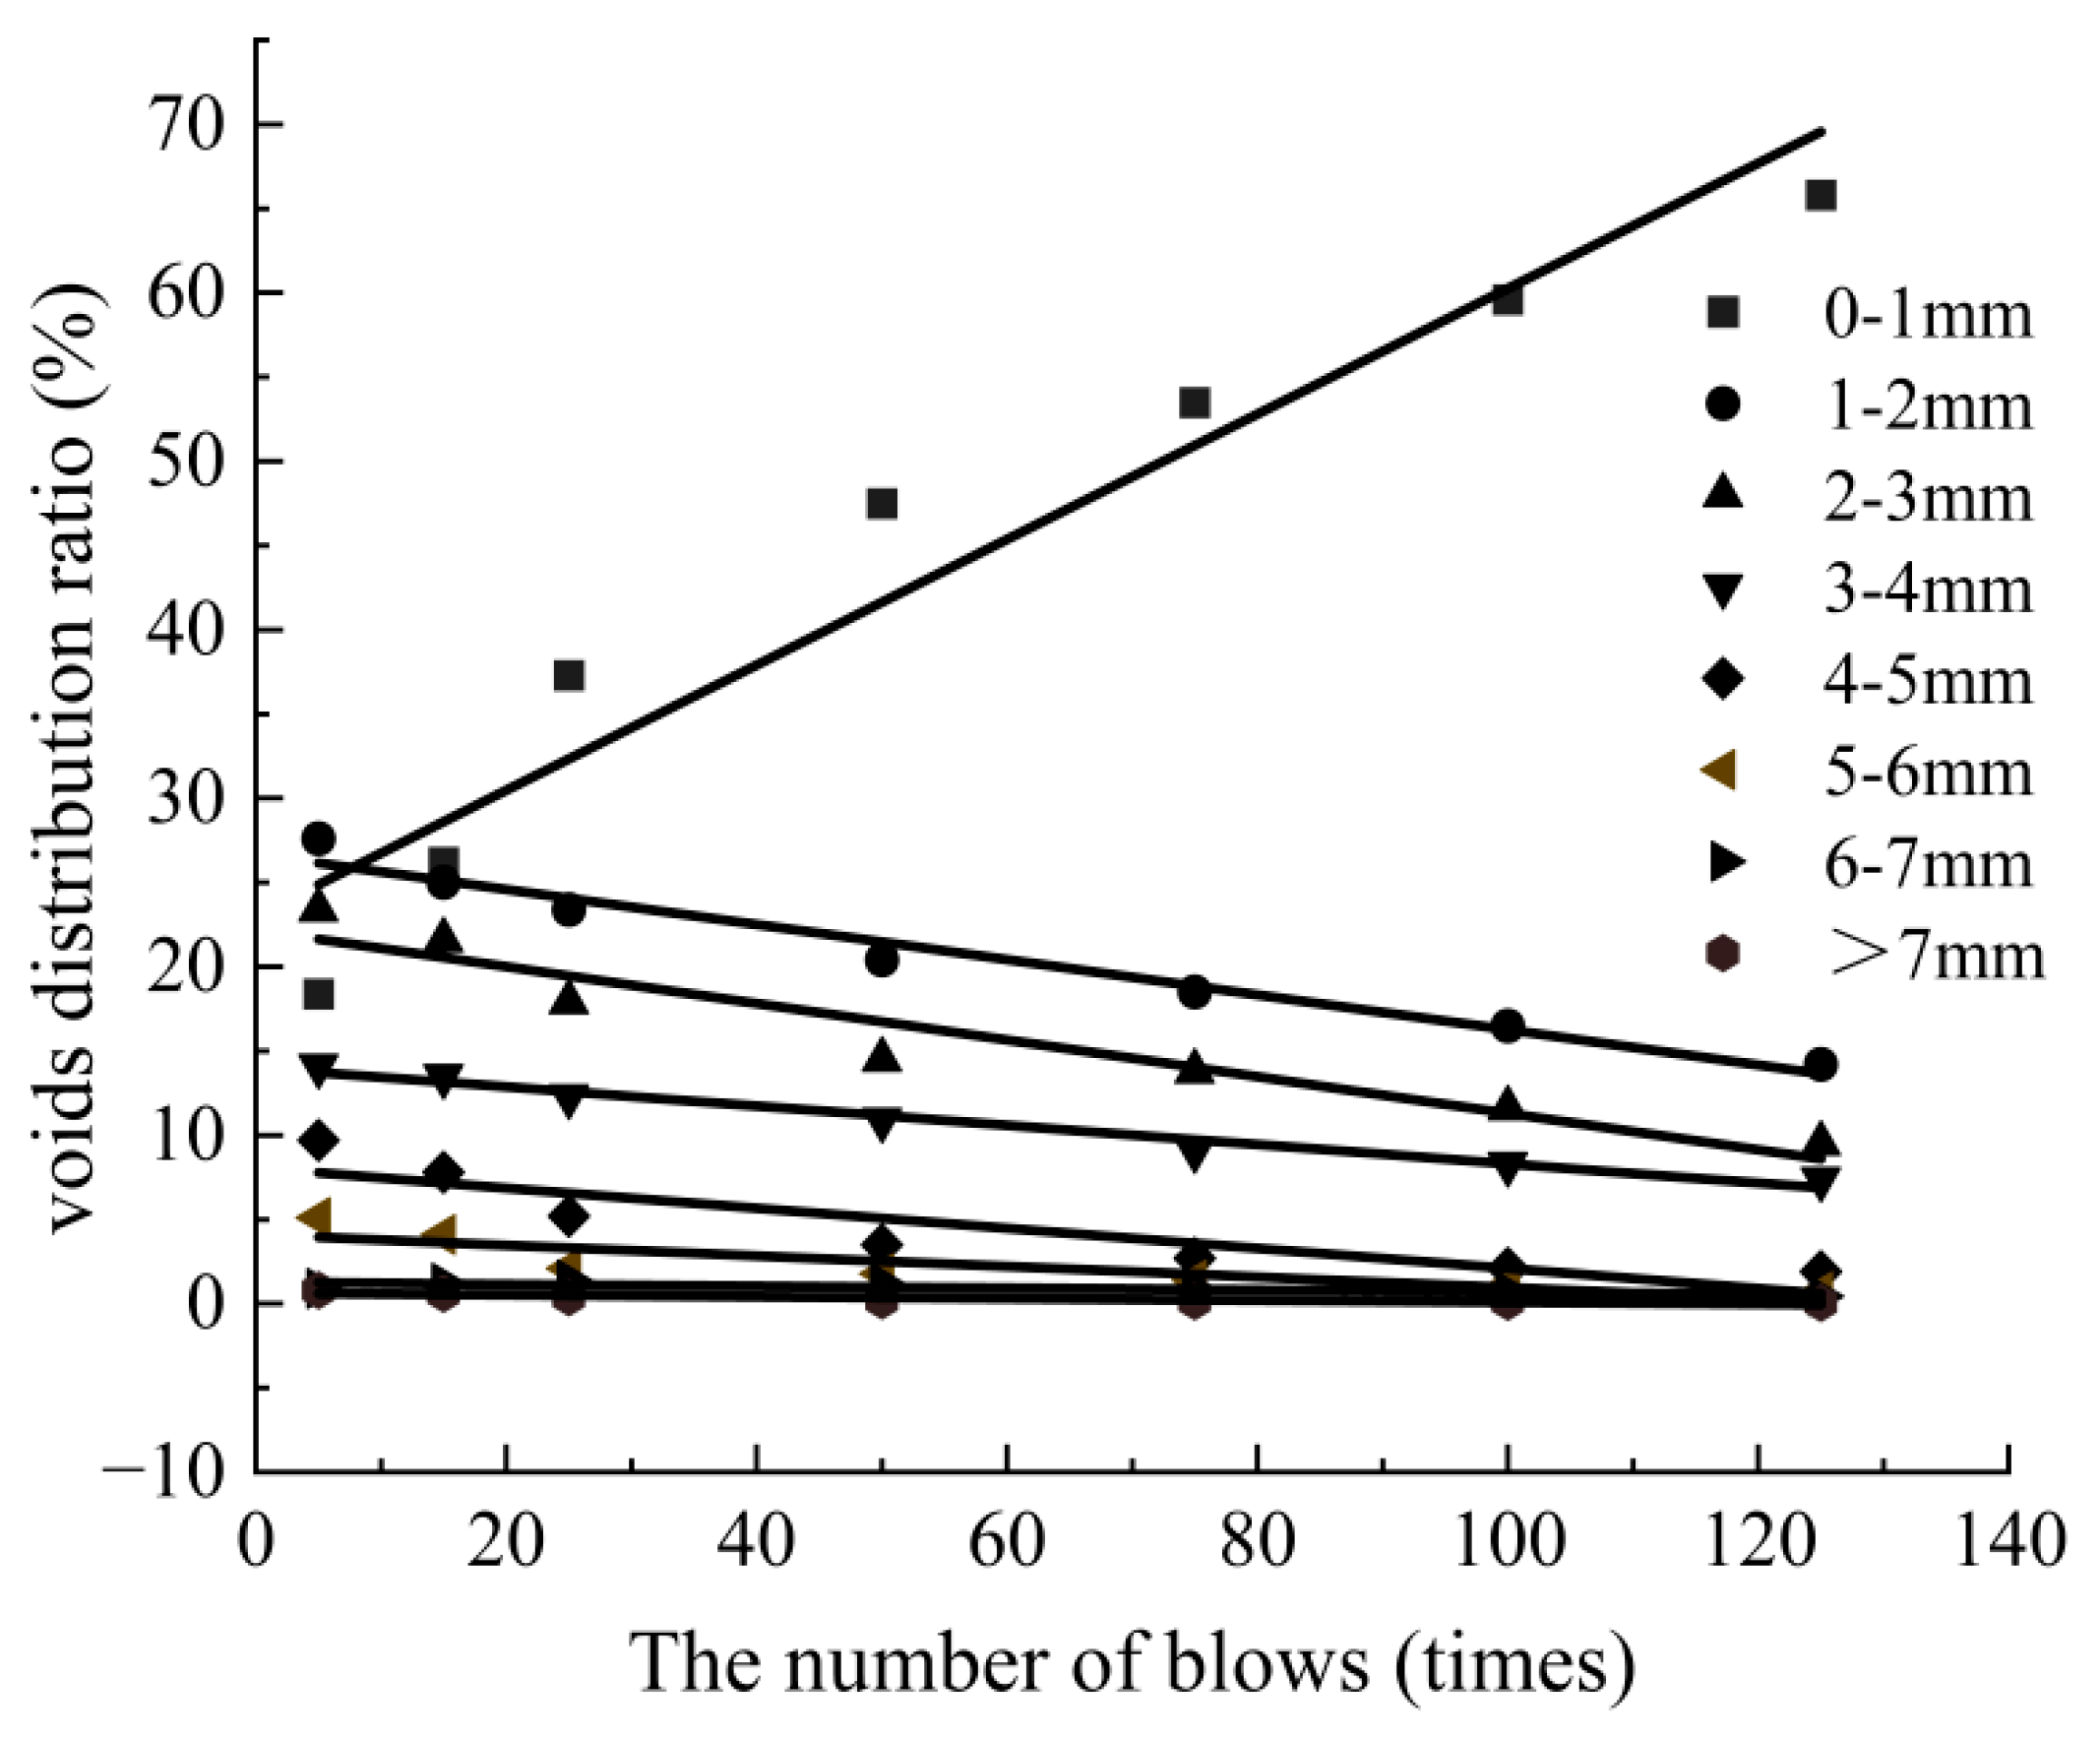
- During compaction, the voids with equivalent diameters of 1–7 mm gradually decreased in SMA-13, and the distribution rate of the voids showed a non-equal proportional linear decay; the voids with equivalent diameters of 0–1 mm gradually increased, and the distribution rate increased linearly, and they were the main void components of SMA-13.
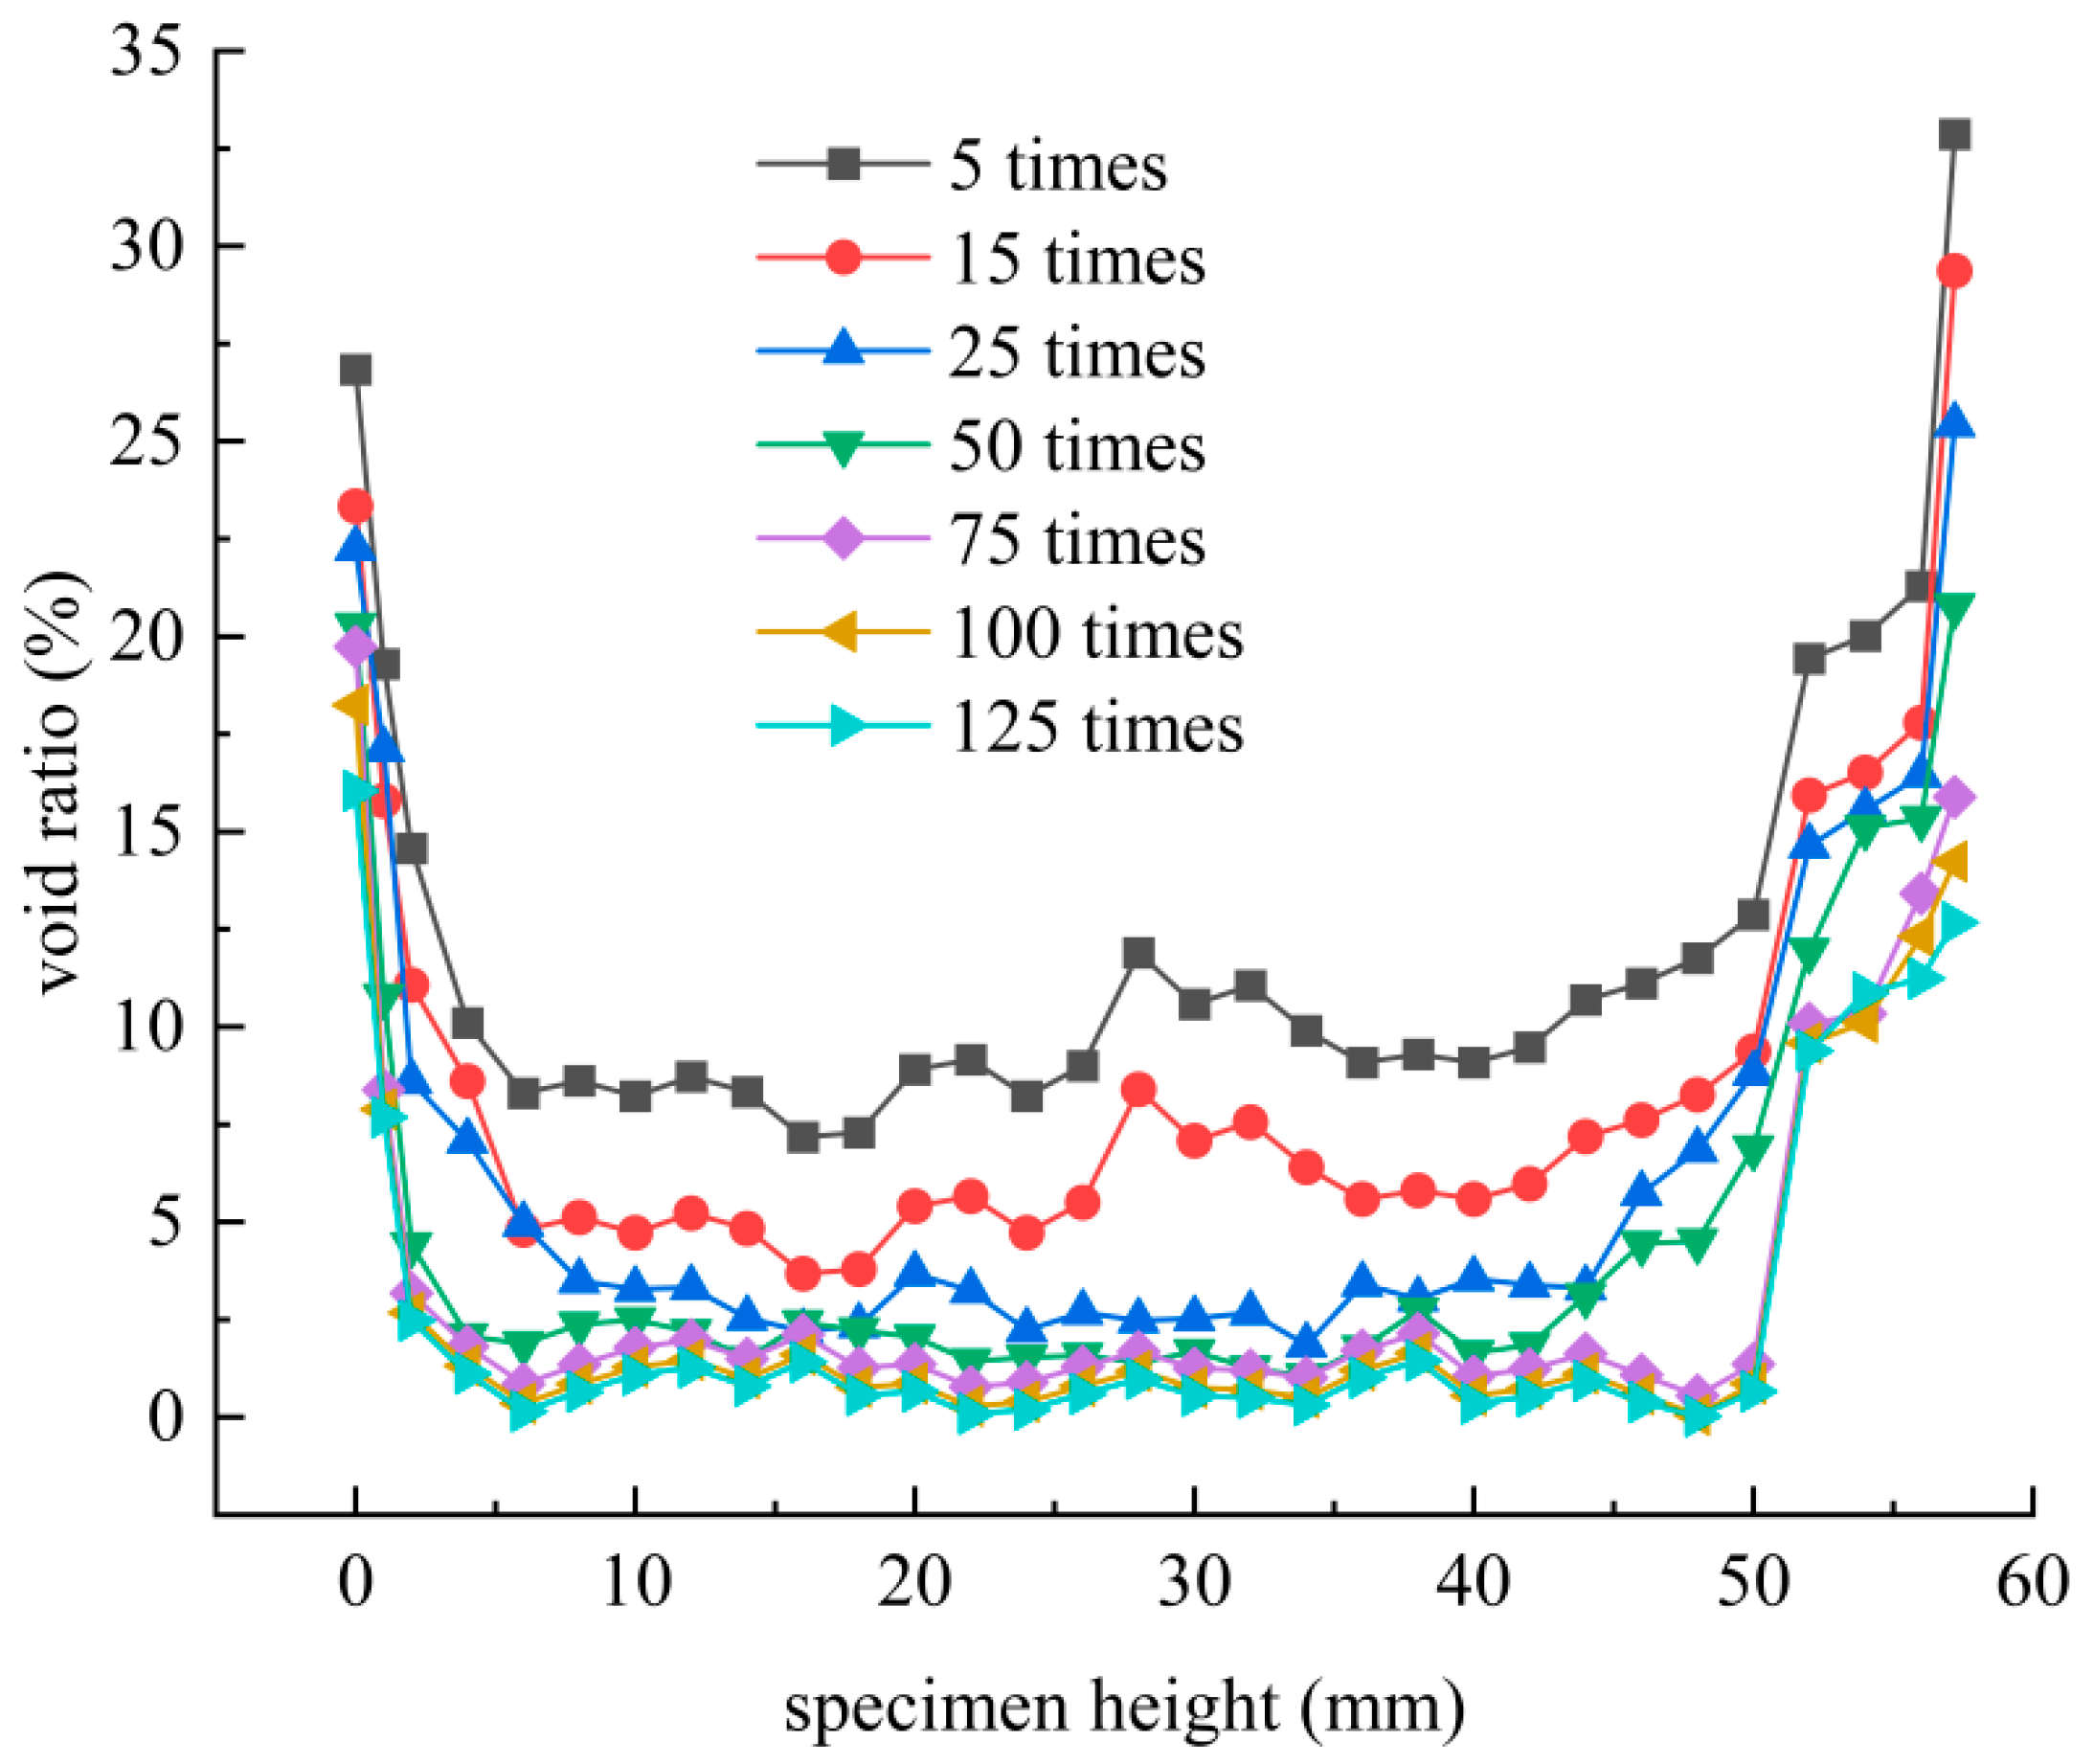
- During compaction, the void ratio of SMA-13 gradually decreased along the direction of height, and the distribution of void ratio was “great at both ends and small in the middle”. The void ratio at 5–55 mm decreased from about 10% to about 0%, and the void ratio distribution was relatively uniform. The void ratio at the bottom 0–5 mm and top >50 mm was large and unevenly distributed, mostly between 10% and 40%.
- It is worth noting that the compaction coefficient () in the paper only evaluates the compaction difficulty of SMA-13, and more asphalt mixture types (e.g., AC-13, AC-20, etc.) should be covered in later studies to explore the reliability and adaptability of the compaction coefficient () to other mixtures.
Author Contributions
Funding
Institutional Review Board Statement
Informed Consent Statement
Data Availability Statement
Conflicts of Interest
References
- Zhang, Y.; Wang, W.; Fang, L.; Liu, J.; Xiao, C.; Yu, S. Assessment of void distribution in asphalt mixture rutting process based on X-ray CT images. J. Beijing Inst. Technol. 2024, 50, 508–522. [Google Scholar]
- Yang, Y.; Wang, H.; Yang, Y. Pore characteristics of emulsified asphalt cold recycled mixture under freeze-thaw cycle. Mater. Introd. 2022, 36, 69–75. [Google Scholar]
- Rezvan, B.; Mohsen, R. Estimation and Evaluation of Water Damage Resistance of Warm-Stone Matrix Asphalt Mixture with Compound Polymer Modifiers Using Regression Tree Ensemble Method. J. Mater. Civ. Eng. 2024, 36, 04023575. [Google Scholar]
- Dinis, G.; Luís, P.; Silvino, C.; Luzia, R. Asphalt mix design: Discussion on the bulk specific gravity procedure influence on the results obtained from empirical, volumetric, and performance-based methods. Constr. Build. Mater. 2022, 342, 127870. [Google Scholar]
- Su, J.; Li, P.; Zhu, L.; Dong, C. The Influence of Microscopic Contact Friction Effect of Mineral/Asphalt System on Compaction Characteristics. J. Chongqing Jiaotong Univ. (Nat. Sci. Ed.) 2021, 40, 96–102. [Google Scholar]
- Li, P.; Su, J.; Sun, S.; Wang, X.; Ma, Y. Research progress on particle characteristics, interface effects, and migration behavior of multi-level mineral asphalt system. Chin. J. Highw. 2023, 36, 1–15. [Google Scholar]
- Enríquez-León, A.J.; de Souza, T.D.; Aragão, F.T.; Pereira, A.M.; Nogueira, L.P. Characterization of the air void content of fine aggregate matrices within asphalt concrete mixtures. Constr. Build. Mater. 2021, 300, 124214. [Google Scholar] [CrossRef]
- Xu, H.; Shi, H.; Tan, Y. Evaluation method and analysis of three-dimensional void morphology characteristics of asphalt mixtures. Chin. J. Highw. 2020, 33, 210–220. [Google Scholar]
- Zhao, Y.; Wu, X.; Wang, G.; Liu, J.; Xiao, C.; Yu, S. Research on the Microscopic Pore Characteristics of Permeable Asphalt Mixtures Based on CT Technology. Highway 2023, 68, 59–68. [Google Scholar]
- Chen, S.; You, Z.; Yang, S.L.; Garcia, A.; Rose, L. Influence of air void structures on the coefficient of permeability of asphalt mixtures. Powder Technol. 2021, 377, 1–9. [Google Scholar] [CrossRef]
- Guo, N.; You, Z.P.; Tan, Y.; Zhao, Y. Prediction method for void fraction of asphalt mixture based on CT technology. Chin. J. Highw. 2016, 29, 12–21+42. [Google Scholar] [CrossRef]
- Xiong, R.; Jiang, W.; Yang, F.; Li, K.; Guan, B.; Zhao, H. Investigation of voids characteristics in an asphalt mixture exposed to salt erosion based on CT images. Materials 2019, 12, 3774. [Google Scholar] [CrossRef] [PubMed]
- Zheng, C.; Xu, J.; Zhang, T.; Tan, G. Study on the microscopic damage of porous asphalt mixture under the combined action of hydrodynamic pressure and ice crystal frost heave. Constr. Build. Mater. 2021, 303, 124489. [Google Scholar] [CrossRef]
- Li, J.; Li, P.; Su, J.; Xue, Y.; Rao, W. Effect of aggregate contact characteristics on densification properties of asphalt mixture. Constr. Build. Mater. 2019, 204, 691–702. [Google Scholar] [CrossRef]
- Polaczyk, P.; Huang, B.S.; Shu, X.; Gong, H. Investigation into locking point of asphalt mixtures utilizing Superpave and Marshall compactors. J. Mater. Civ. Eng. 2019, 31, 04019188. [Google Scholar] [CrossRef]
- Fattah, M.Y.; Hilal, M.; Flyeh, H.B. Assessment of mechanical stability performance of asphalt mixture using Superpave gyratory compactor. J. Transp. Eng. Part B Pavements 2019, 145, 04019004. [Google Scholar] [CrossRef]
- Li, P.; Su, J.; Ma, S.; Dong, H. Effect of aggregate contact condition on skeleton stability in asphalt mixture. Int. J. Pavement Eng. 2020, 21, 196–202. [Google Scholar] [CrossRef]
- Su, J.; Li, P.; Sun, S.; Zhu, L.; Dong, C. Effect of Contact Slip Behavior of Particle on Compaction Characteristics of The Asphalt Mixture. Int. J. Pavement Eng. 2020, 23, 1295–1305. [Google Scholar] [CrossRef]
- Moslemipour, A.; Sadeghnejad, S. Dual-scale pore network reconstruction of vugular carbonates using multi-scale imaging techniques. Adv. Water Resour. 2021, 147, 103795. [Google Scholar] [CrossRef]
- Baychev, T.G.; Jivkov, A.P.; Rabbani, A.; Raeini, A.Q.; Xiong, Q.; Lowe, T.; Withers, P.J. Reliability of Algorithms Interpreting Topological and Geometric Properties of Porous Media for Pore Network Modelling. Transp. Porous Media 2019, 128, 271–301. [Google Scholar] [CrossRef]
- Gerke, K.M.; Sizonenko, T.O.; Karsanina, M.V.; Lavrukhin, E.V.; Abashkin, V.V.; Korost, D.V. Improving watershed-based pore-network extraction method using maximum inscribed ball pore-body positioning. Adv. Water Resour. 2020, 140, 103576. [Google Scholar] [CrossRef]
- Silin, D.; Patzek, T. Pore space morphology analysis using maximal inscribed spheres. Phys. A Stat. Mech. Its Appl. 2006, 371, 336–360. [Google Scholar] [CrossRef]
- Silin, D.B.; Jin, G.; Patzek, T.W. Robust determination of the pore space morphology in sedimentary rocks. In Proceedings of the SPE Annual Technical Conference and Exhibition, OnePetro, Denver, CO, USA, 5–8 October 2003. [Google Scholar]
- Dong, H.; Blunt, M.J. Pore-network extraction from micro-computerized-tomography images. Phys. Rev. E 2009, 80, 36307. [Google Scholar] [CrossRef] [PubMed]
- Guo, N.; You, Z.; Tan, Y.; Zhao, Y.; Jing, H. Method for evaluating the uniformity of asphalt mixture based on CT technology. Chin. J. Highw. 2017, 30, 1–9+55. [Google Scholar]
- Wu, X.; He, Z.; Zhang, S.; Gan, X. Cooling and compaction characteristics of asphalt mixture under different temperatures and wind speeds in the transition zone between Sichuan and Tibet. J. Southwest Univ. (Nat. Sci. Ed.) 2024, 46, 149–163. [Google Scholar] [CrossRef]
- Wu, X.; Tang, X.; Liu, L.; He, Z.; He, S. The Friction–Lubrication Effect and Compaction Characteristics of an SMA Asphalt Mixture under Variable Temperature Conditions. Materials 2024, 17, 1694. [Google Scholar] [CrossRef]


| Property | Test Result | Technical Requirement | |
|---|---|---|---|
| Penetration (25 °C, 5 s, 100 g, 0.1 mm) | 57 | 40–60 | |
| Softening point TR&B (°C) | 65.6 | ≥60 | |
| Ductility (5 °C, 5 cm/min) | 26.8 | ≤20 | |
| Brinell rotational viscosity (135 °C, Pa s) | 1.38 | ≤3 | |
| Density (25 °C, g/cm3) | 1.023 | - | |
| Specific Gravity (Relative to water density at 25 °C, dimensionless) | 1.026 | - | |
| After RTFOT | Mass change (%) | 0.02 | ≤±1.0 |
| Needle penetration ratio (25 °C,%) | 68.43 | ≥65 | |
| Ductility (5 °C, cm) | 17.3 | ≥15 | |
| Aggregate Grade (Basalt Gravel) | Apparent Specific Gravity (Dimensionless) | Apparent Density (g/cm3) | Bulk Specific Gravity (Dimensionless) | Water Absorption (%) |
|---|---|---|---|---|
| 9.5–16 mm | 2.938 | 2.931 | 2.883 | 0.65 |
| 4.75–9.5 mm | 2.937 | 2.930 | 2.858 | 0.94 |
| 2.36–4.75 mm | 2.803 | 2.796 | 2.703 | 1.32 |
| 0–3 mm | 2.712 | 2.704 | - | - |
| Mineral powder | 2.75 | 2.745 | - | - |
| Asphalt Mixture Type | Mass Percentage (%) Passing the Following Sieve Sizes (mm) | |||||||||
|---|---|---|---|---|---|---|---|---|---|---|
| 0.075 | 0.15 | 0.3 | 0.6 | 1.18 | 2.36 | 4.75 | 9.5 | 13.2 | 16 | |
| SMA-13 | 10 | 12.9 | 14.7 | 17 | 19 | 21.4 | 27.6 | 60.8 | 96.8 | 100 |
| Upper limit | 12 | 15 | 16 | 20 | 24 | 26 | 34 | 75 | 100 | 100 |
| Lower limit | 8 | 9 | 10 | 12 | 14 | 15 | 20 | 50 | 95 | 100 |
| SMA-13 Type | Initial Compaction Degree (%)
| Ultimate Compaction Degree (%) | Curvature Factor | Correlation Coefficient |
|---|---|---|---|---|
| SMA-13(5.4) | 89.86 | 96.46 | 0.071 | 0.9905 |
| SMA-13(5.9) | 90.12 | 98.23 | 0.086 | 0.9982 |
| SMA-13(6.4) | 90.62 | 98.32 | 0.082 | 0.9967 |
| SMA-13(150) | 88.93 | 96 | 0.076 | 0.9978 |
| SMA-13(170) | 90.11 | 98.22 | 0.086 | 0.9982 |
| SMA-13(180) | 91.92 | 98.5 | 0.069 | 0.9947 |
| SMA-13 Types | Compaction Degree Difference | Curvature Factor | Compaction Coefficient |
|---|---|---|---|
| SMA-13(5.4) | 6.60 | 0.071 | 0.47 |
| SMA-13(5.9) | 8.11 | 0.086 | 0.70 |
| SMA-13(6.4) | 7.7 | 0.082 | 0.63 |
| SMA-13(150) | 7.07 | 0.076 | 0.54 |
| SMA-13(170) | 8.11 | 0.086 | 0.70 |
| SMA-13(180) | 7.56 | 0.080 | 0.61 |
Disclaimer/Publisher’s Note: The statements, opinions and data contained in all publications are solely those of the individual author(s) and contributor(s) and not of MDPI and/or the editor(s). MDPI and/or the editor(s) disclaim responsibility for any injury to people or property resulting from any ideas, methods, instructions or products referred to in the content. |
© 2025 by the authors. Licensee MDPI, Basel, Switzerland. This article is an open access article distributed under the terms and conditions of the Creative Commons Attribution (CC BY) license (https://creativecommons.org/licenses/by/4.0/).
Share and Cite
Wu, X.; He, Z.; Li, M.; Tang, T.; Wei, D. Evolution of Compaction Characteristics and Void Features in Stone Mastic Asphalt Mixtures Based on Computed Tomography Images. Materials 2025, 18, 1513. https://doi.org/10.3390/ma18071513
Wu X, He Z, Li M, Tang T, Wei D. Evolution of Compaction Characteristics and Void Features in Stone Mastic Asphalt Mixtures Based on Computed Tomography Images. Materials. 2025; 18(7):1513. https://doi.org/10.3390/ma18071513
Chicago/Turabian StyleWu, Xia, Zhaoyi He, Maorong Li, Tiang Tang, and Dingbang Wei. 2025. "Evolution of Compaction Characteristics and Void Features in Stone Mastic Asphalt Mixtures Based on Computed Tomography Images" Materials 18, no. 7: 1513. https://doi.org/10.3390/ma18071513
APA StyleWu, X., He, Z., Li, M., Tang, T., & Wei, D. (2025). Evolution of Compaction Characteristics and Void Features in Stone Mastic Asphalt Mixtures Based on Computed Tomography Images. Materials, 18(7), 1513. https://doi.org/10.3390/ma18071513