
Effects of Stress States and Joint Configurations on Dynamic Mechanical Properties of Rock Masses

Abstract
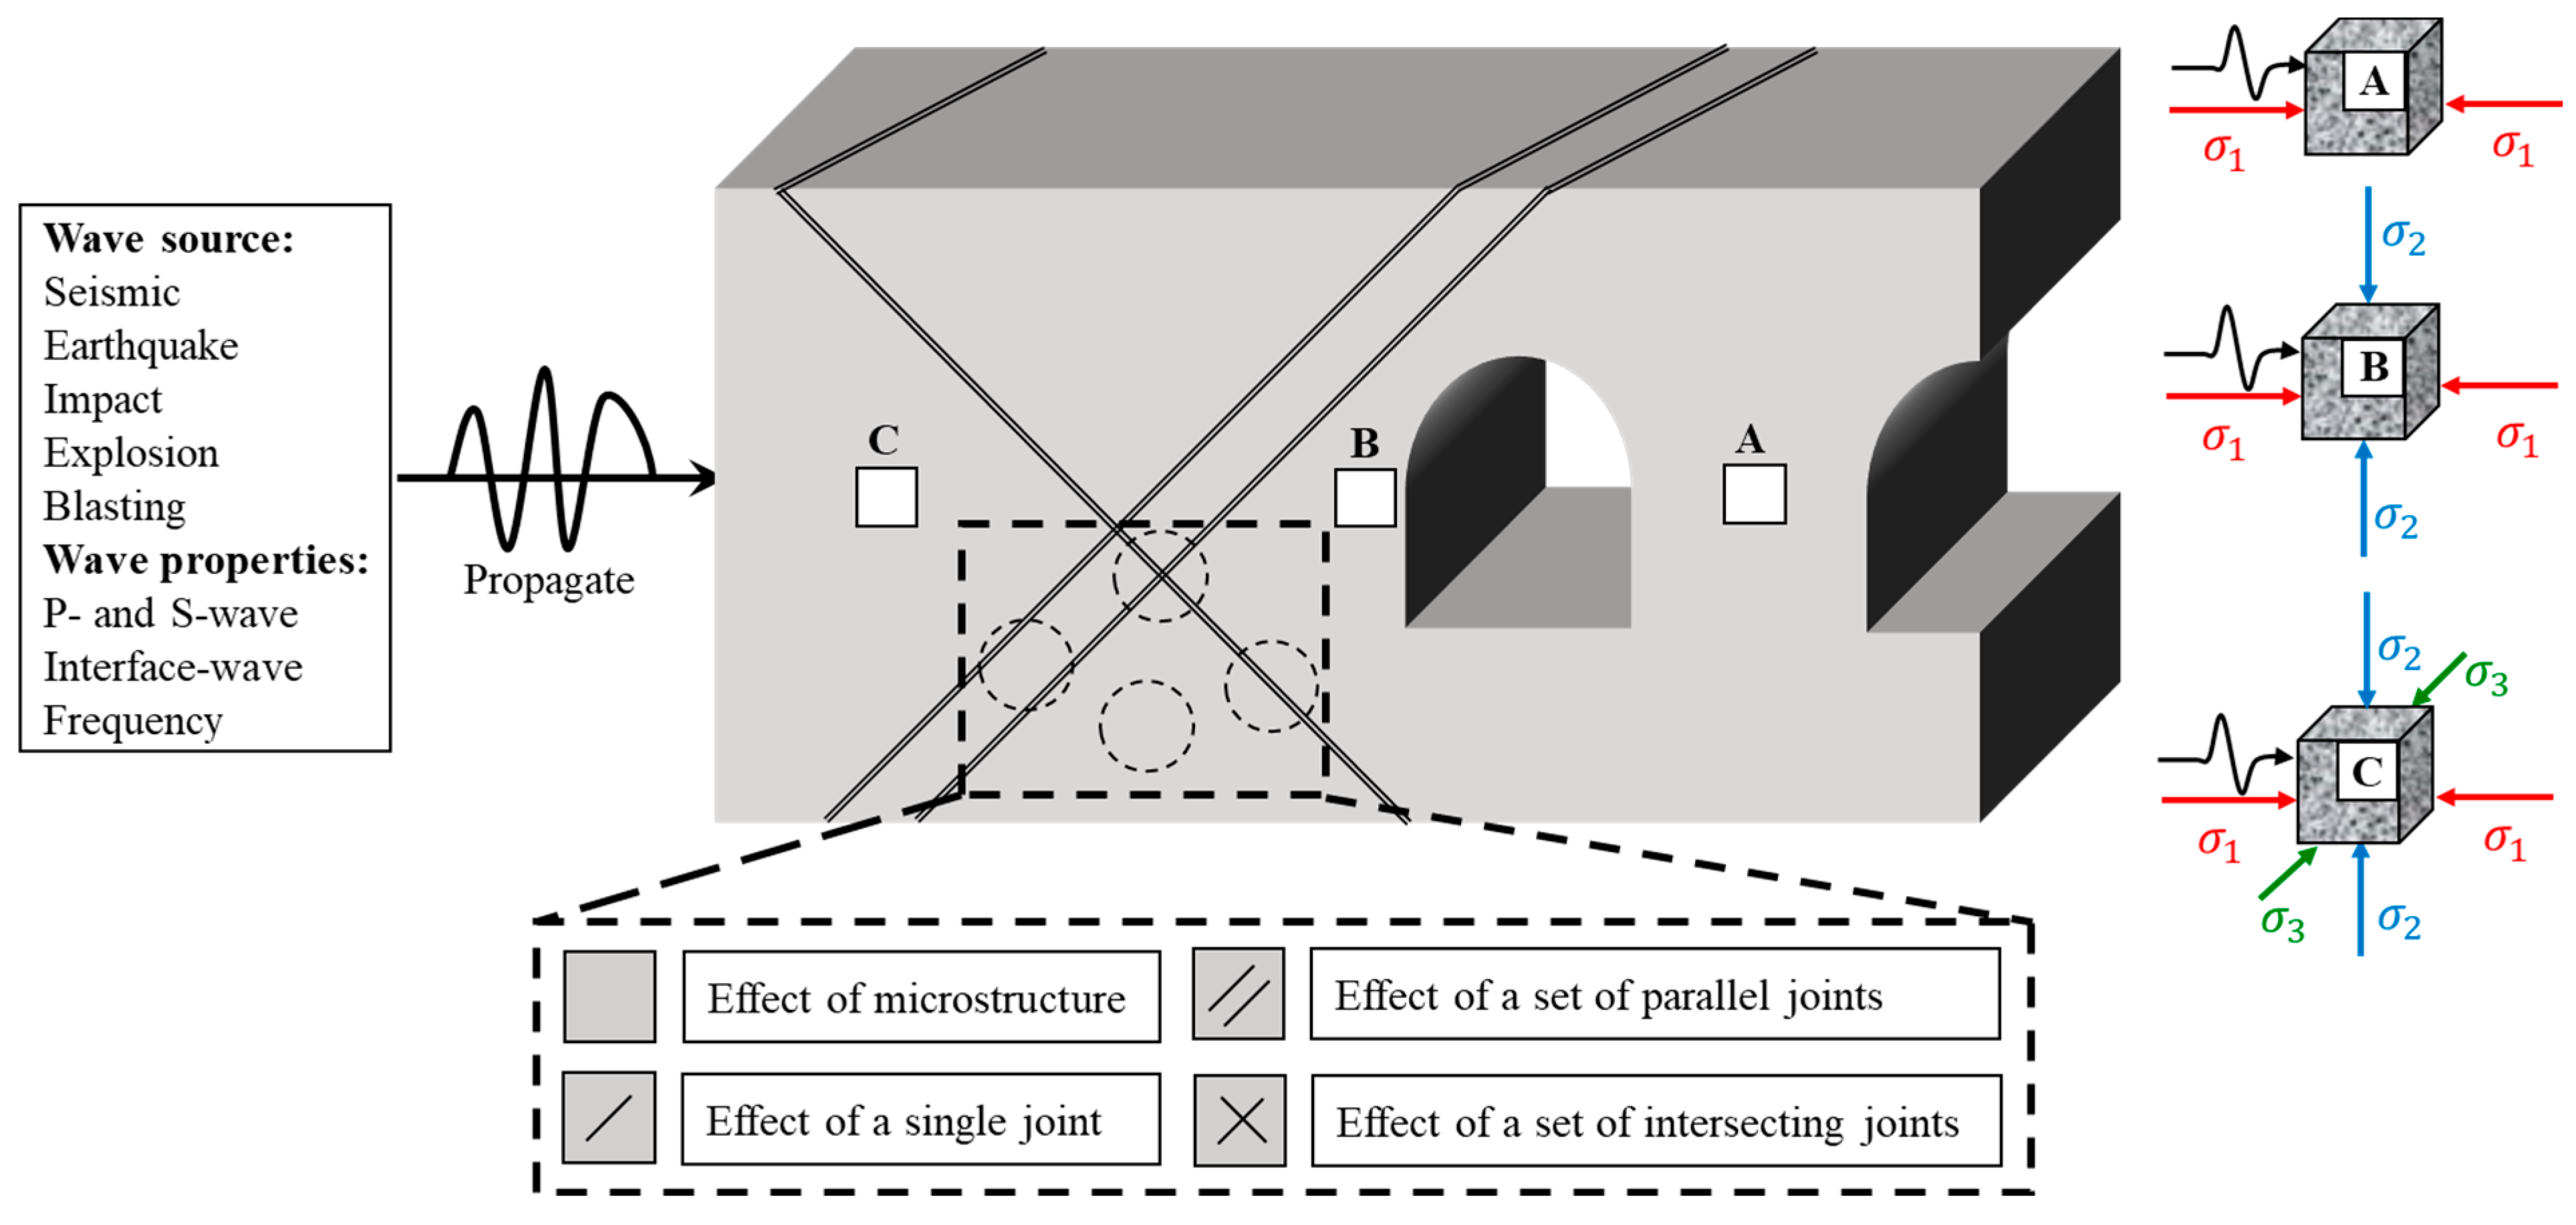
1. Introduction
2. Numerical Method
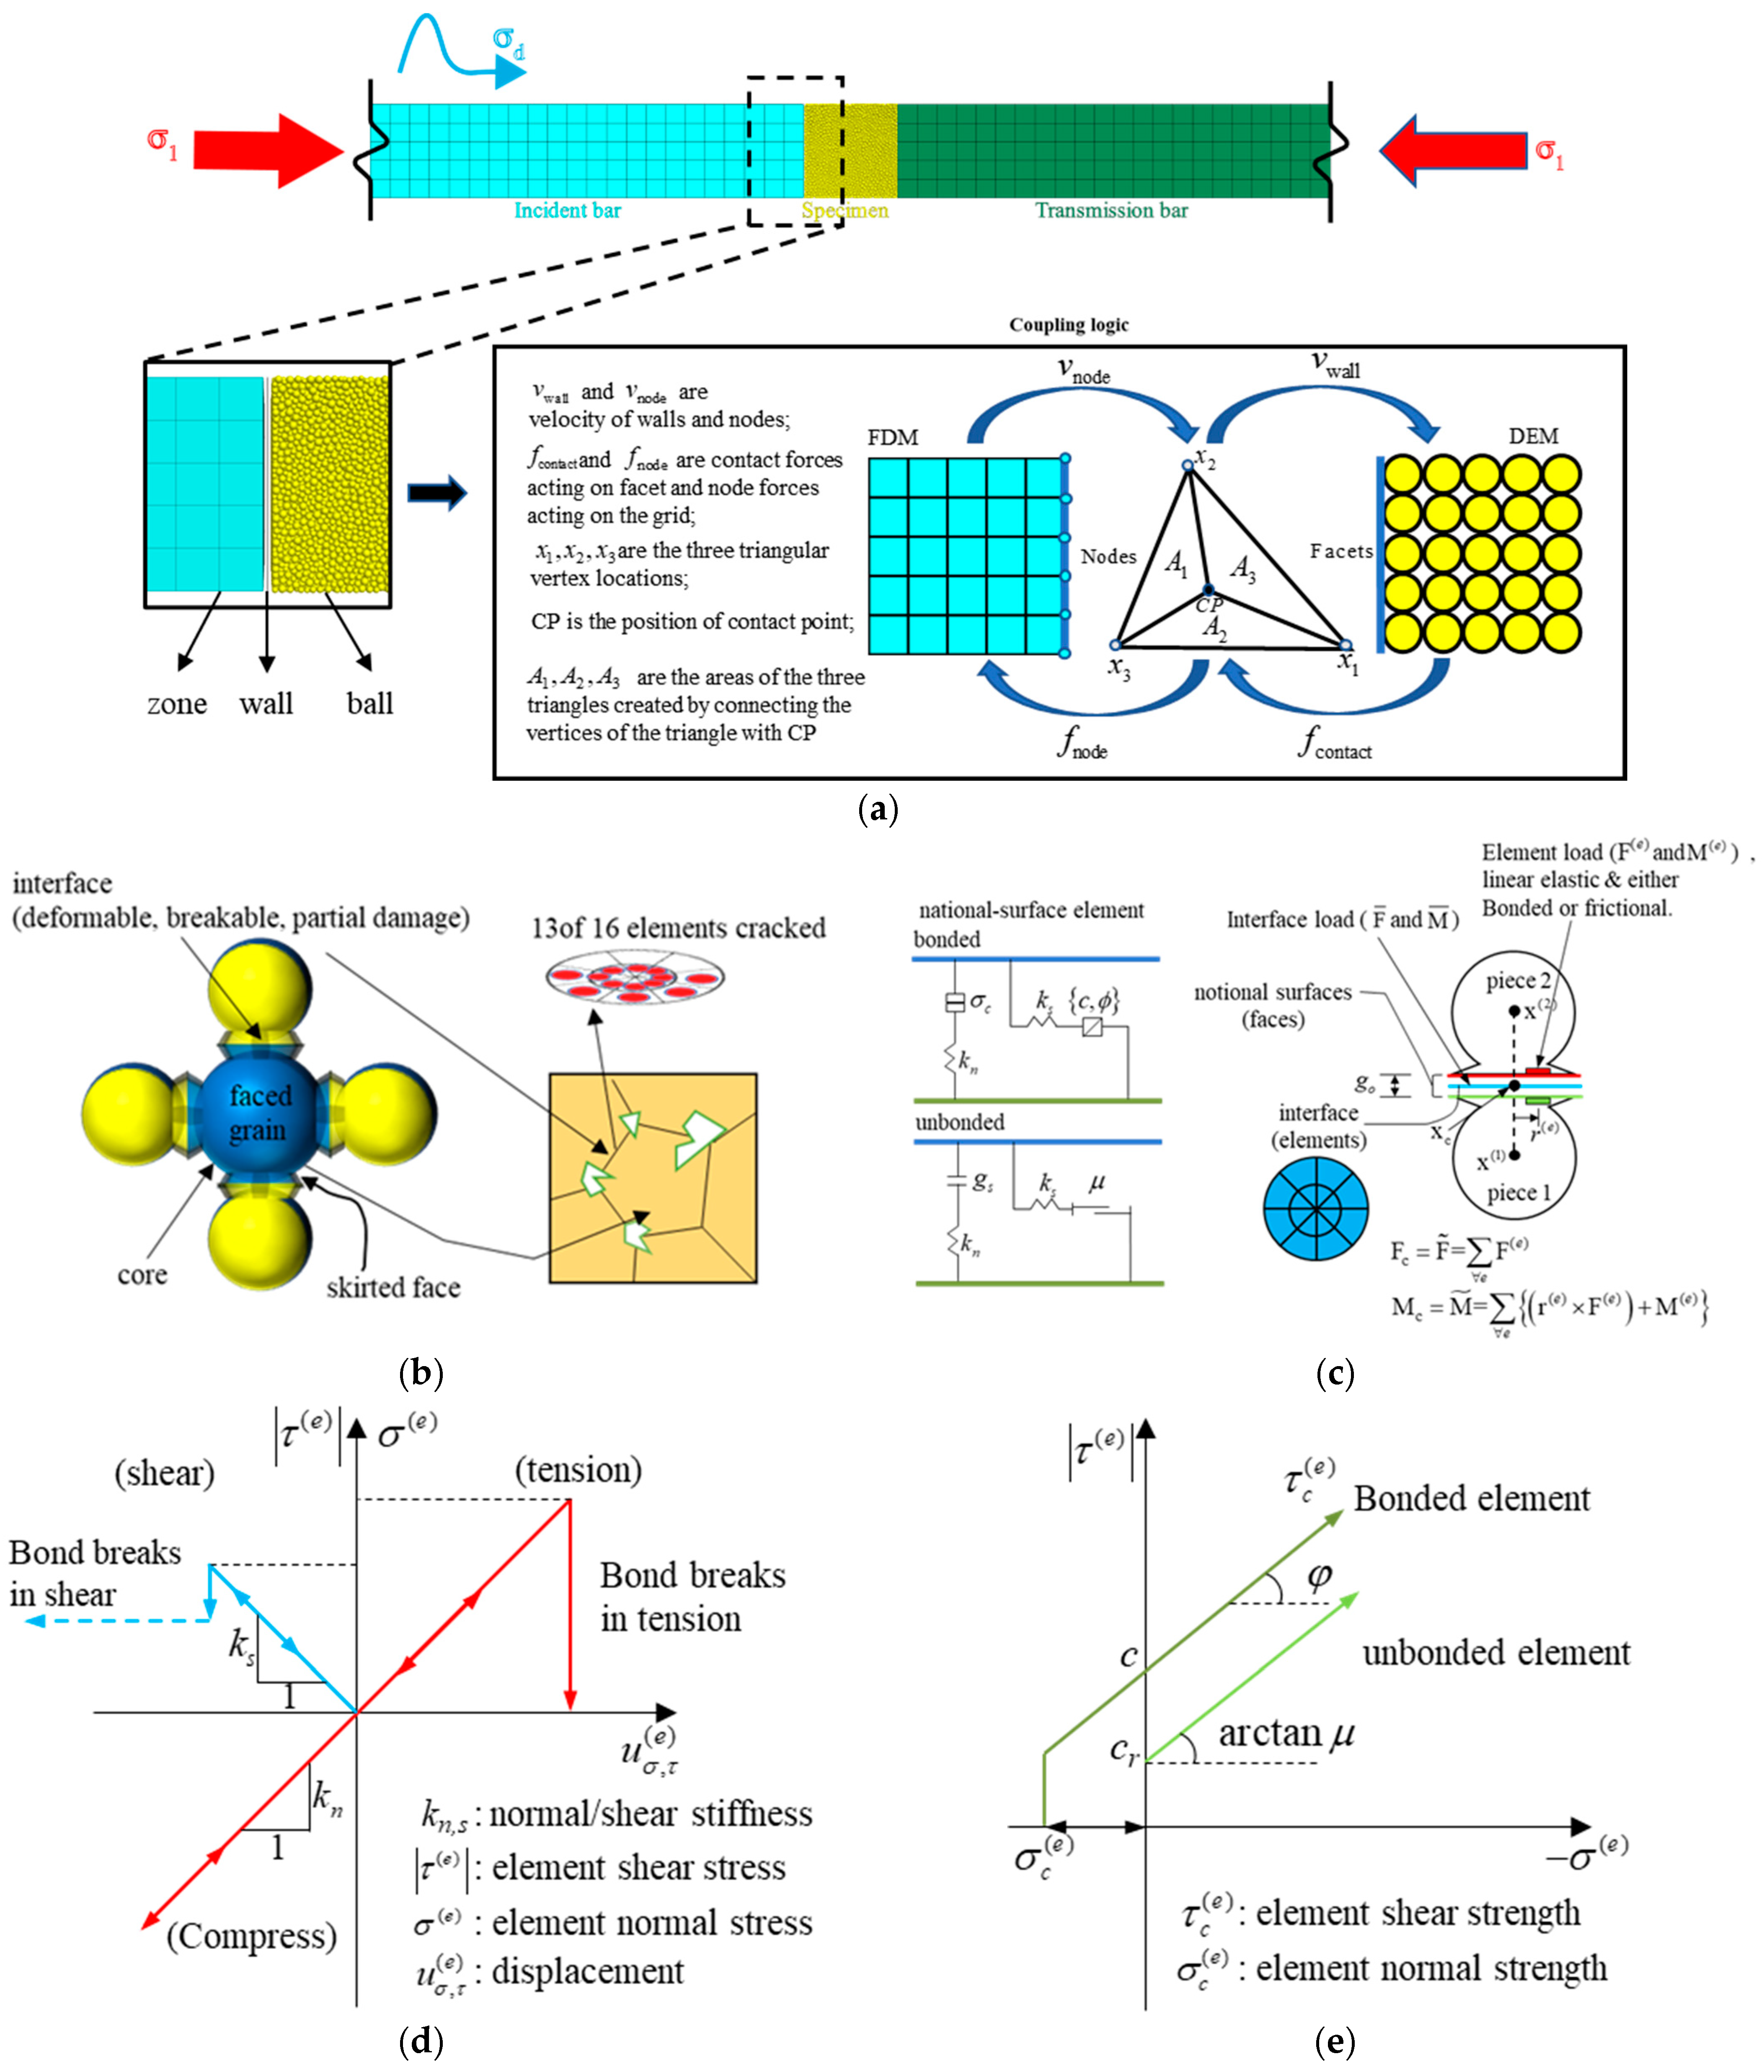
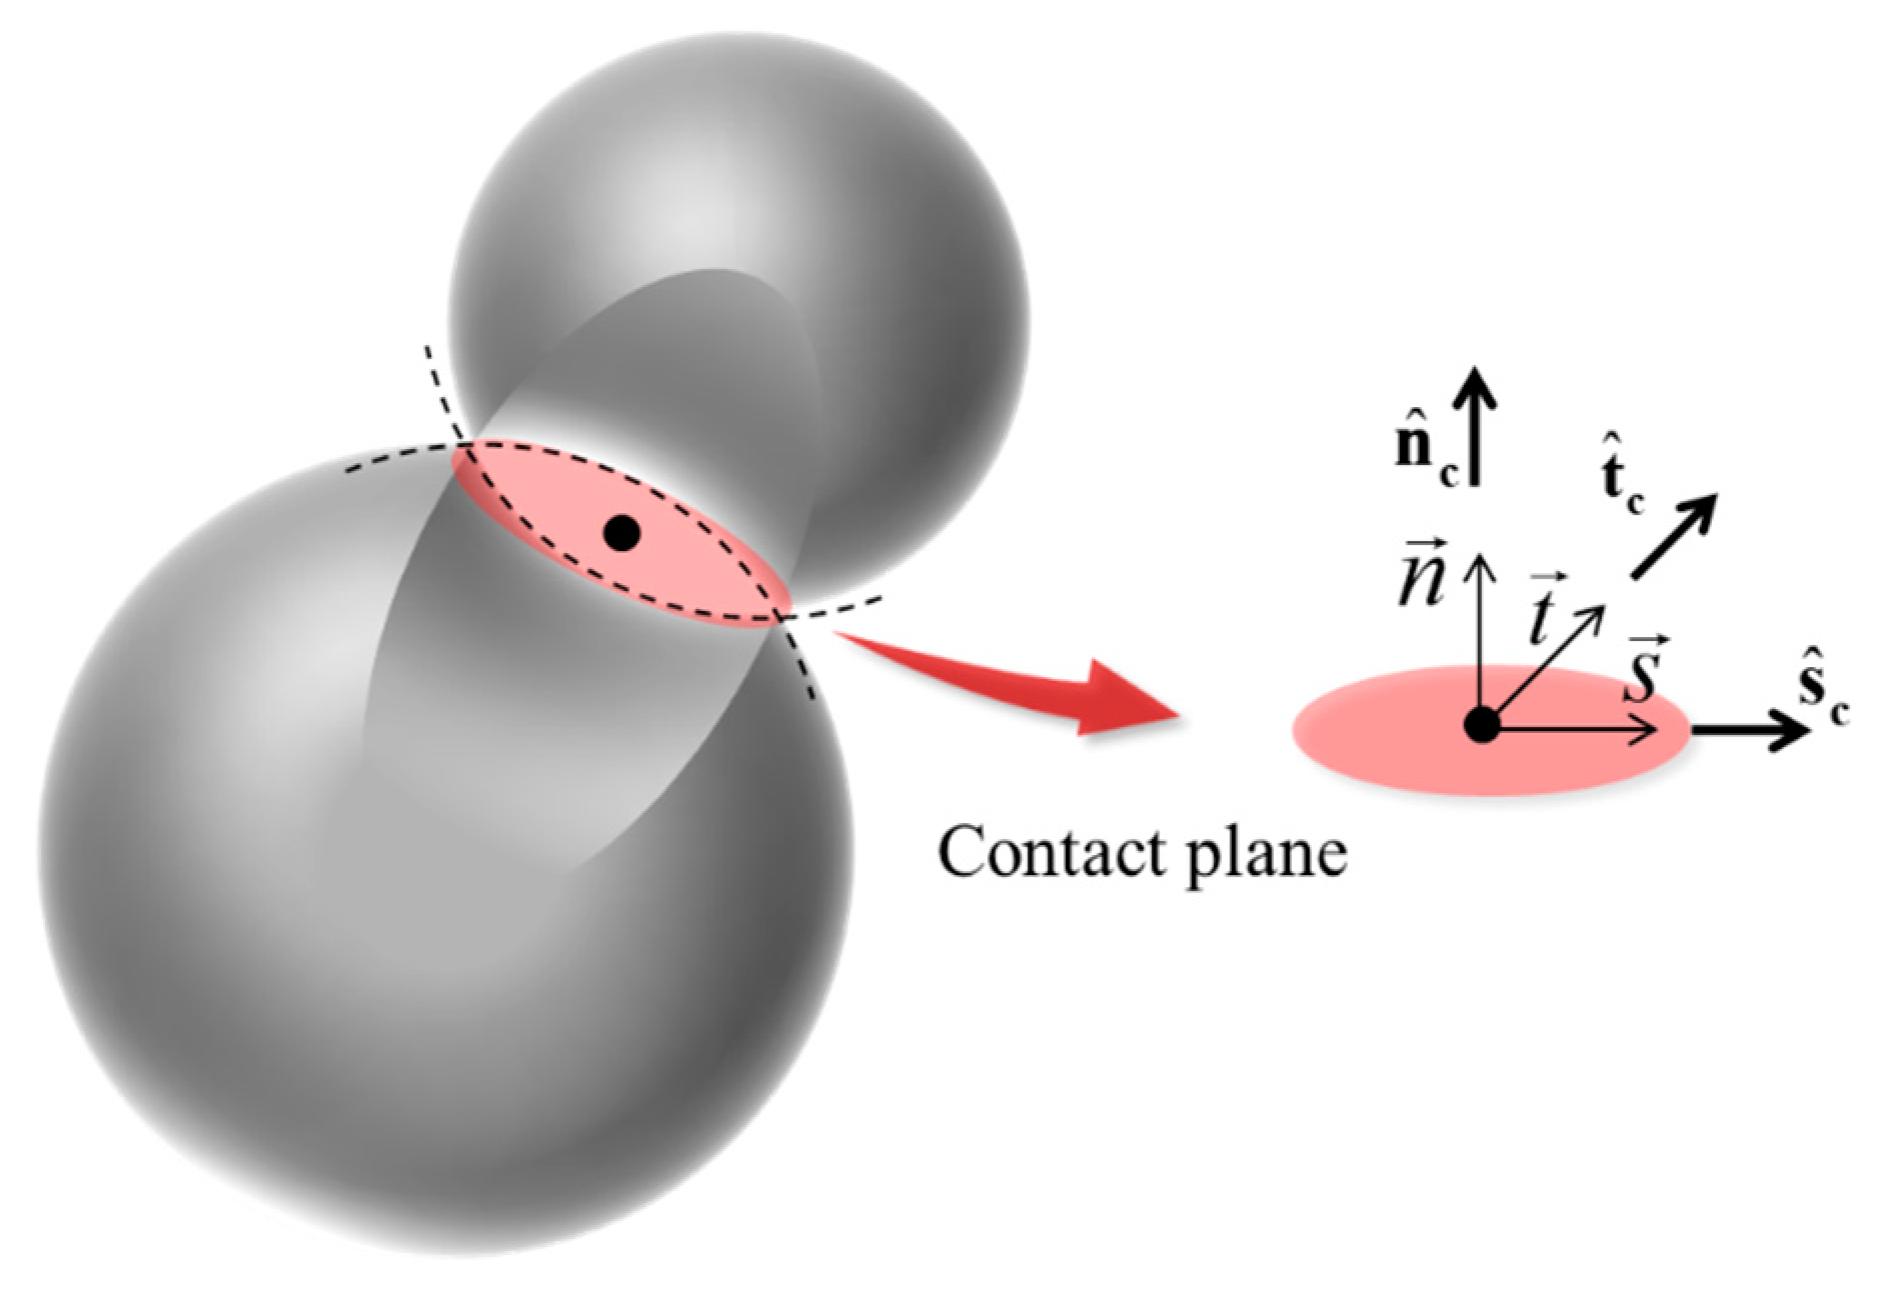
2.1. Continuous–Discrete Coupling Method
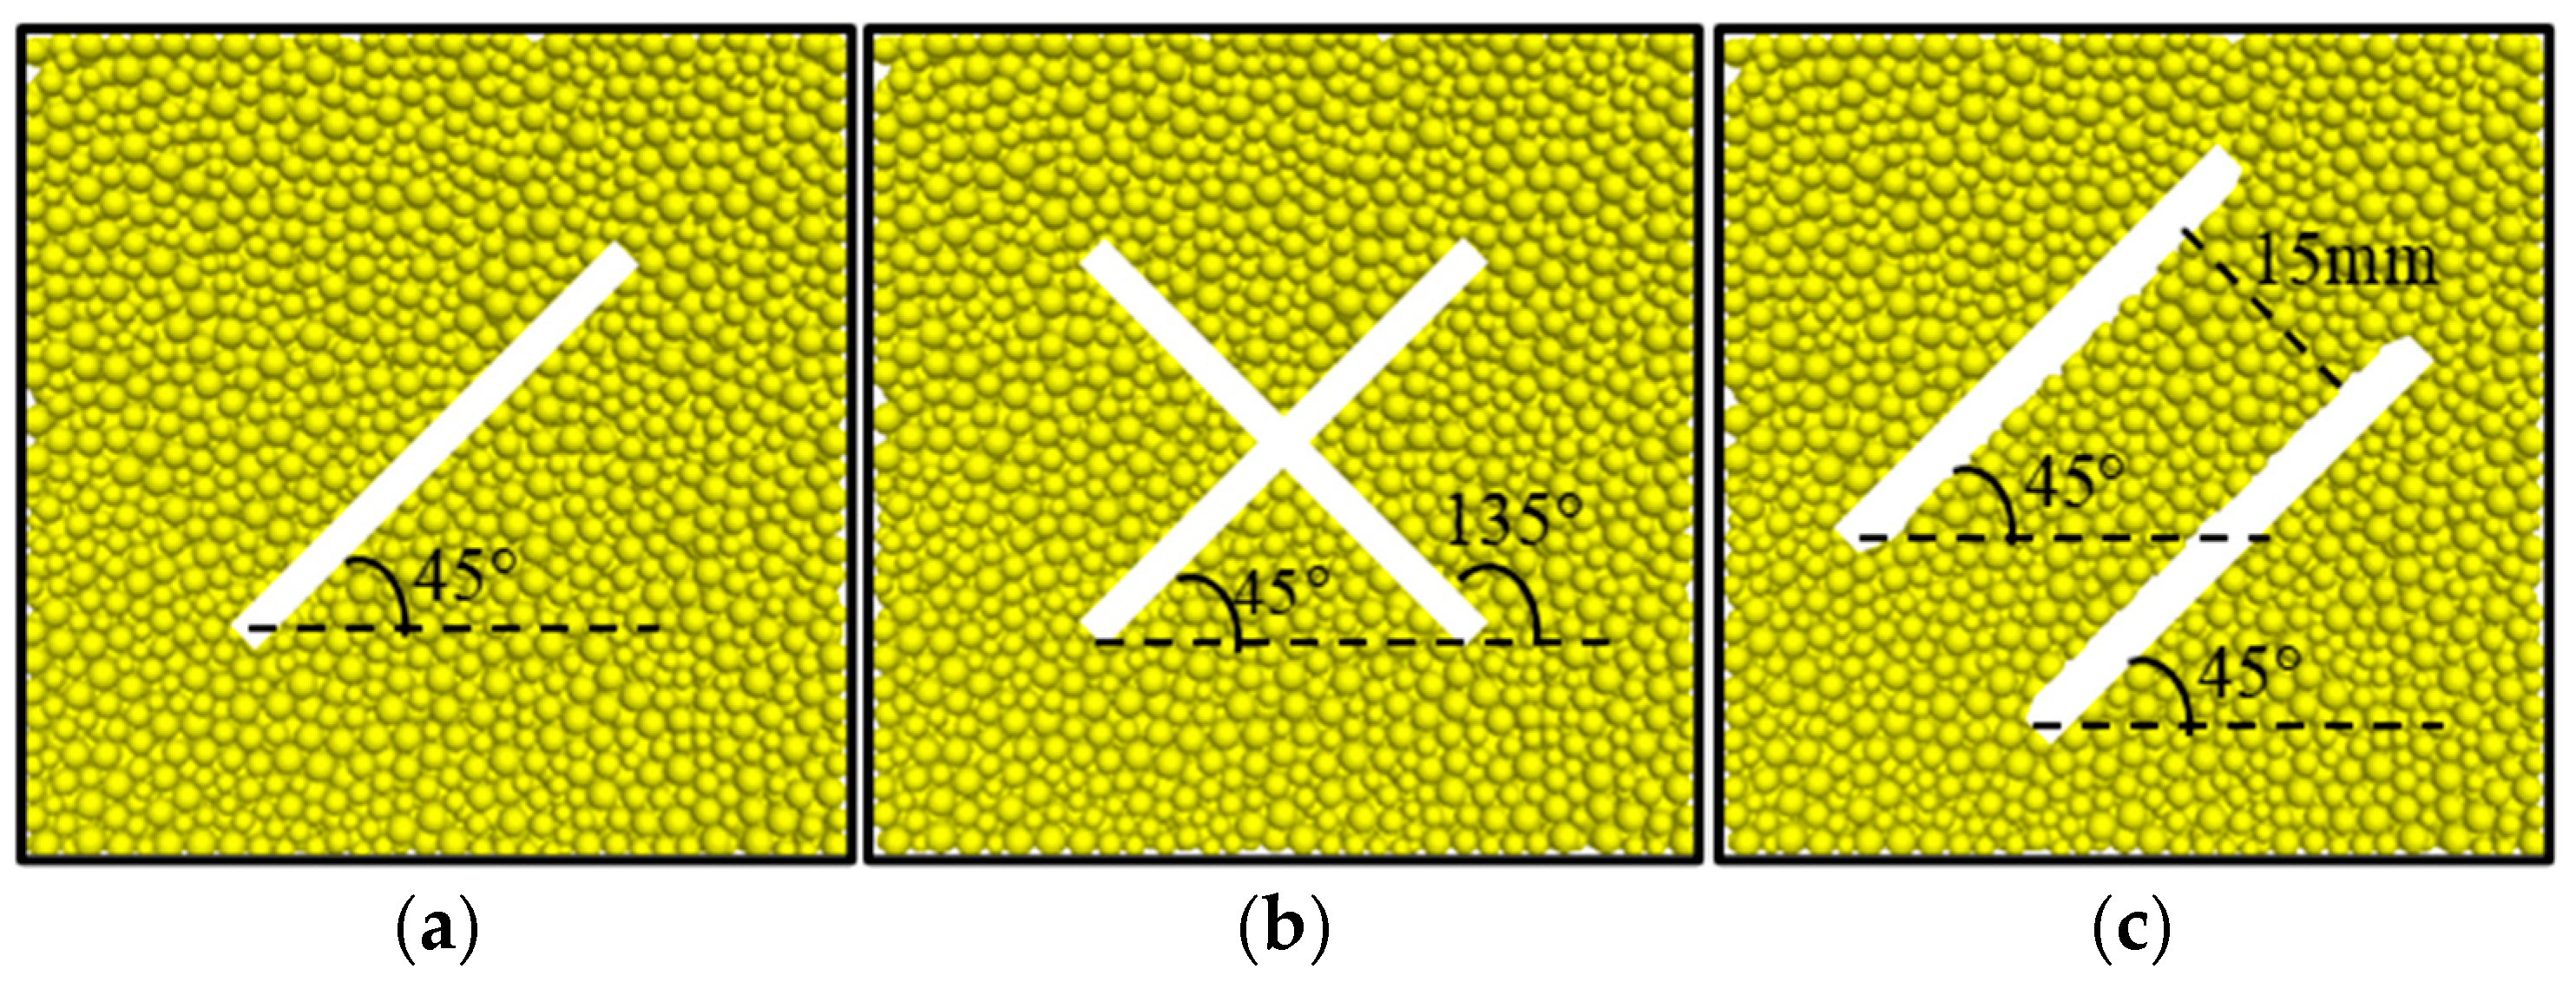
2.2. Jointed Granite Model
2.3. Multiaxial Hopkinson Pressure Bar
2.4. Selection of Numerical Model Parameters
3. Model Verification and Result Analysis
3.1. Model Verification
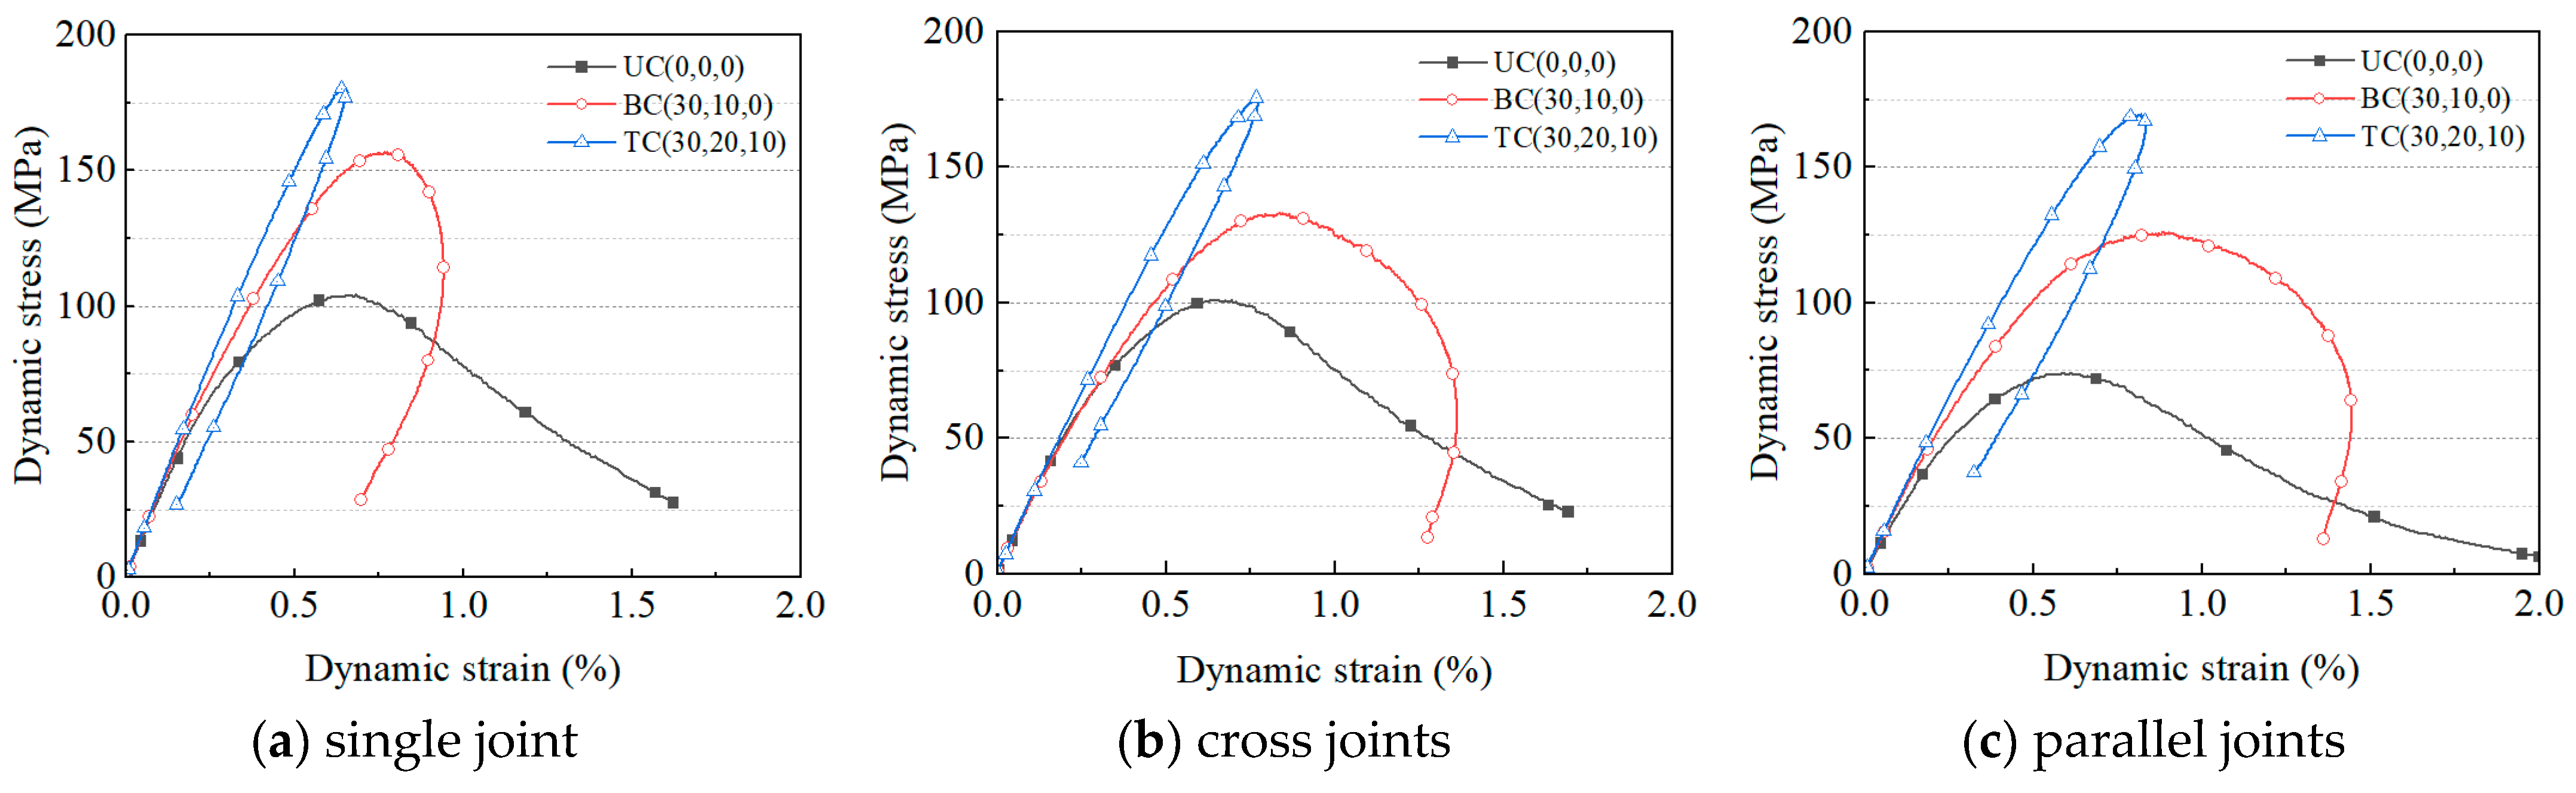
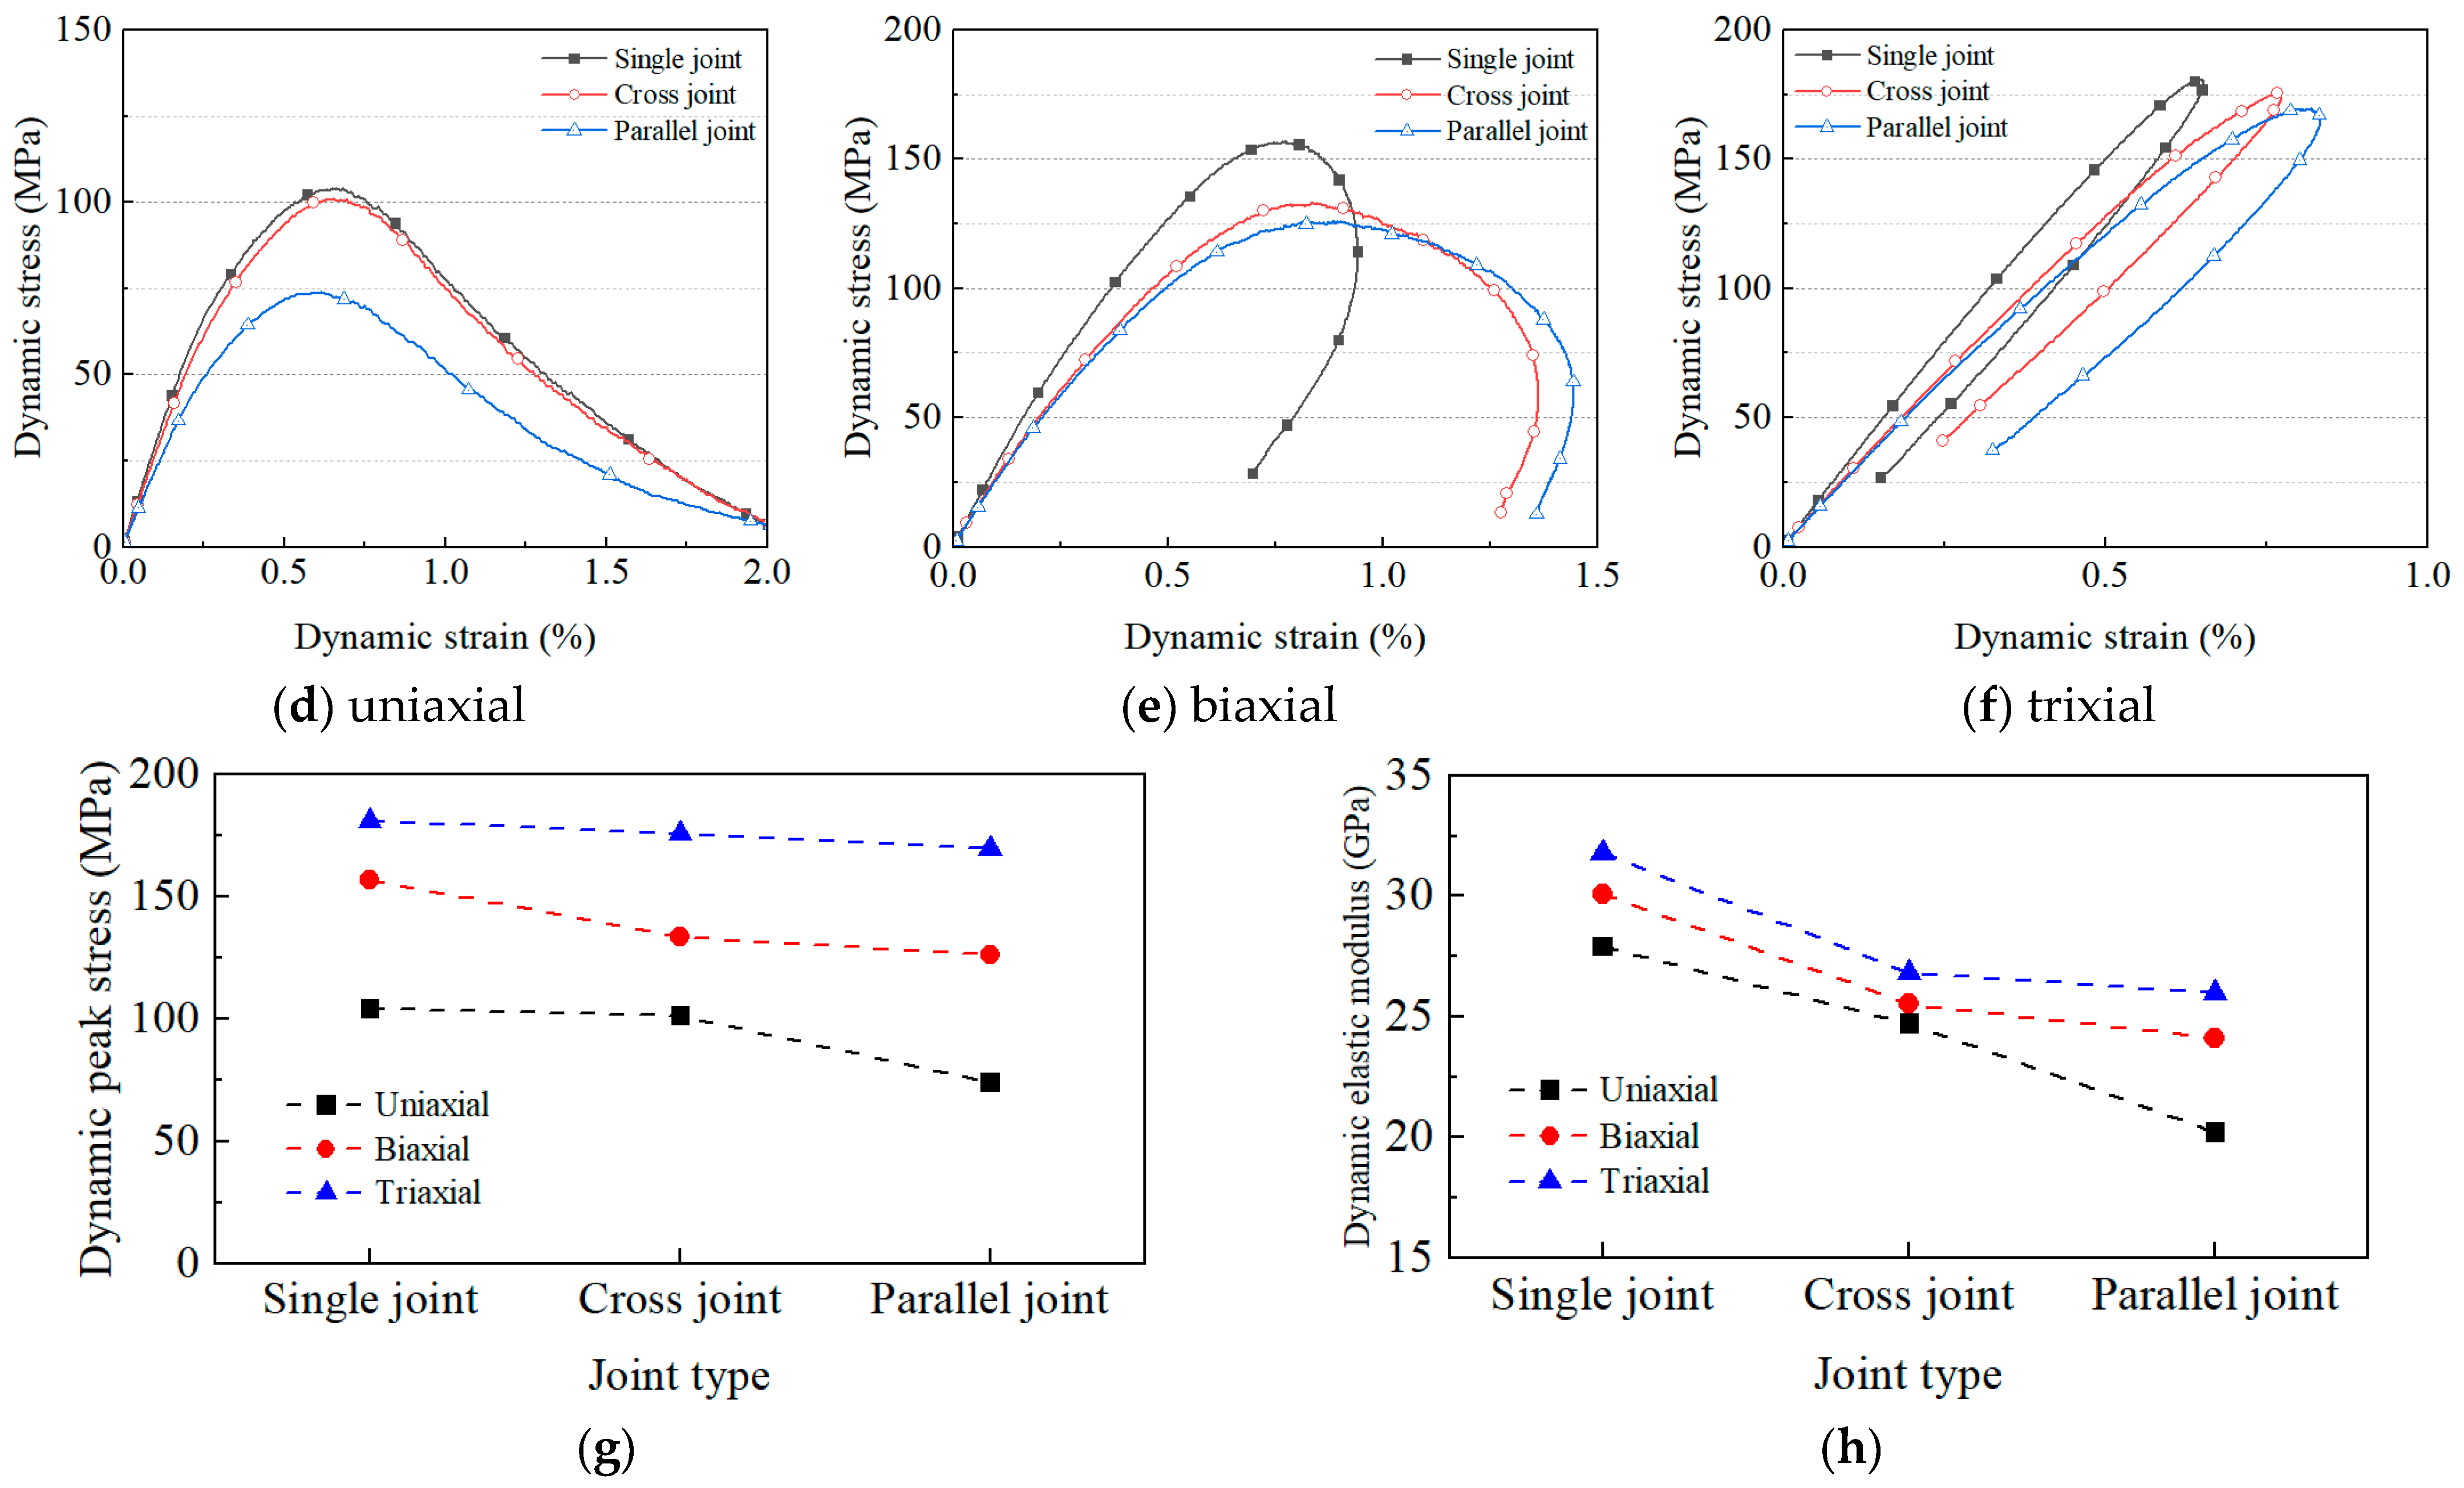
3.2. Result Comparison
4. Discussion
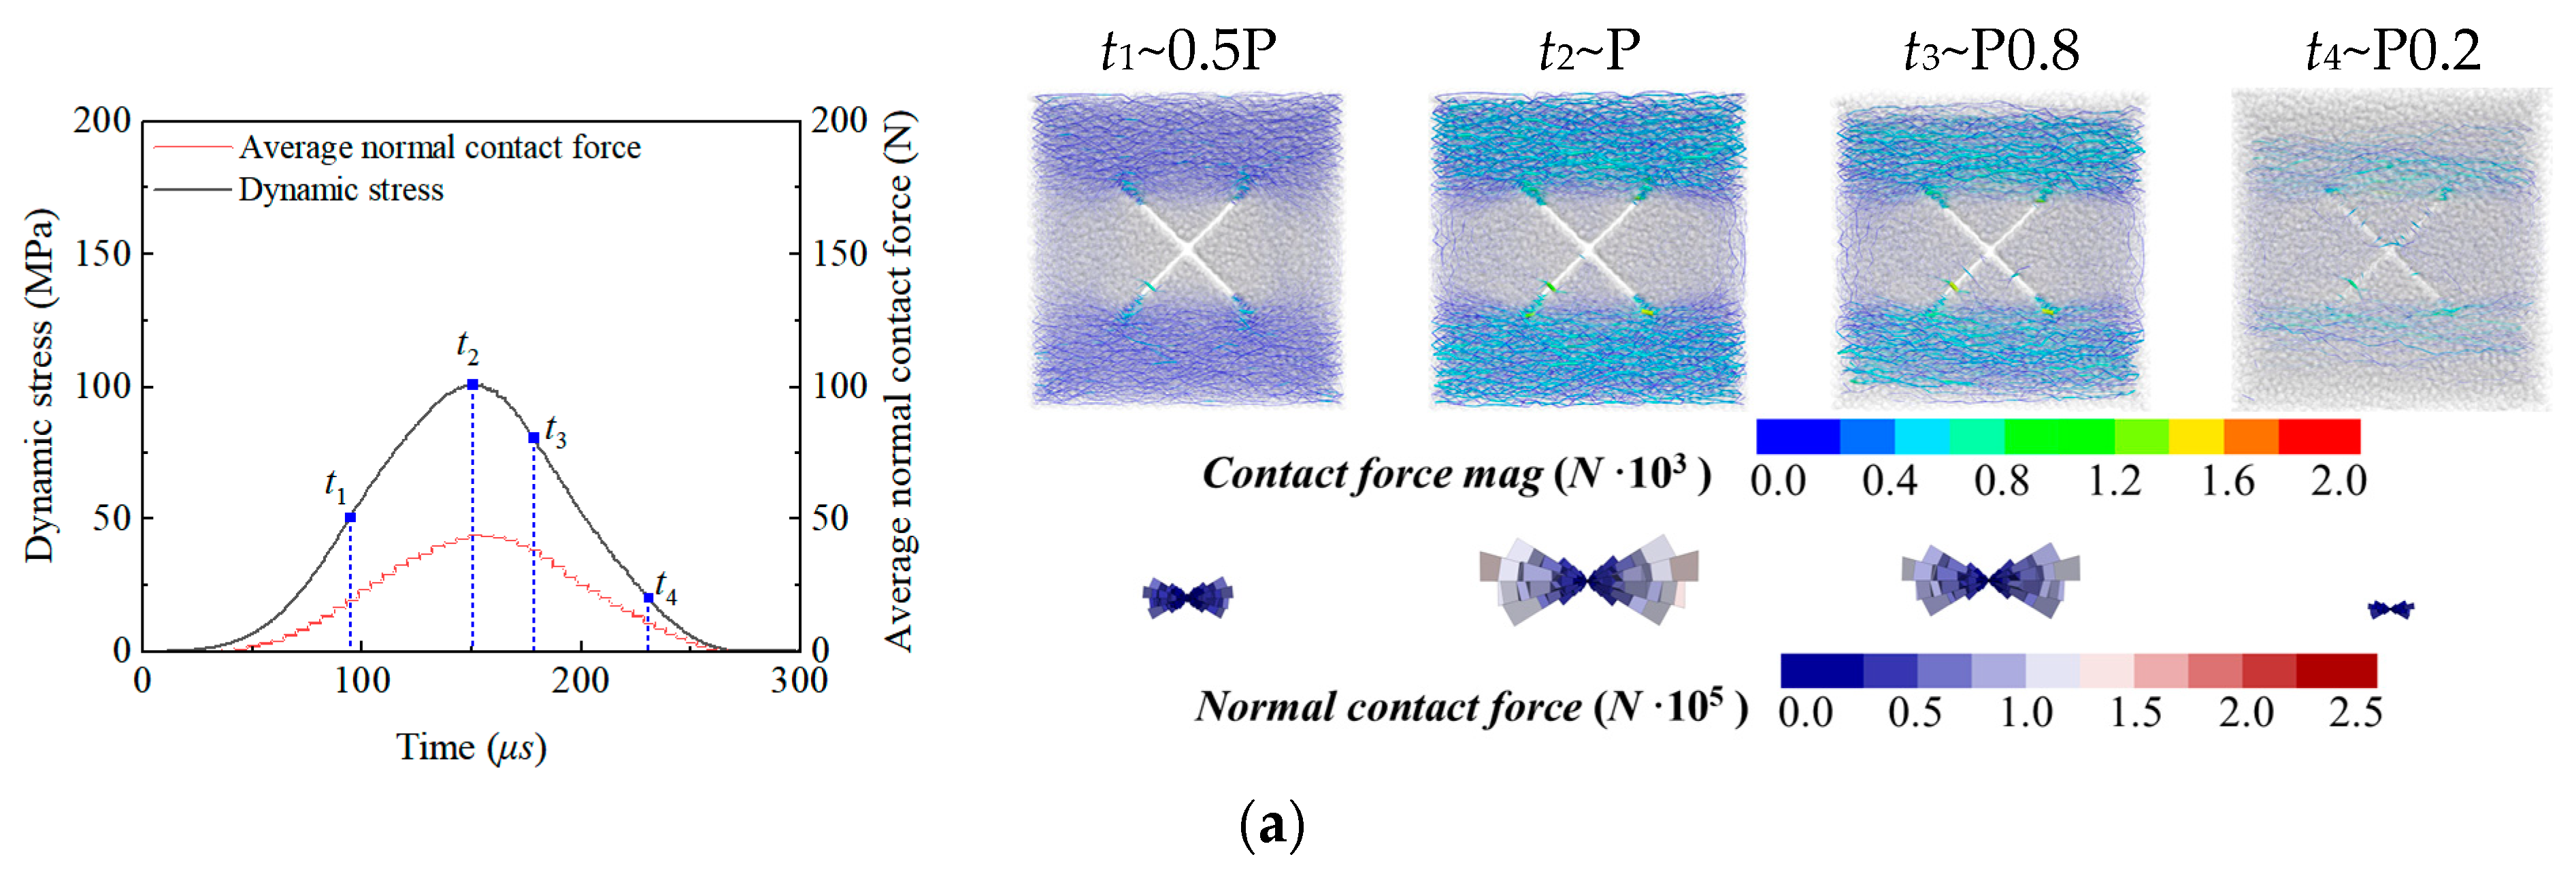
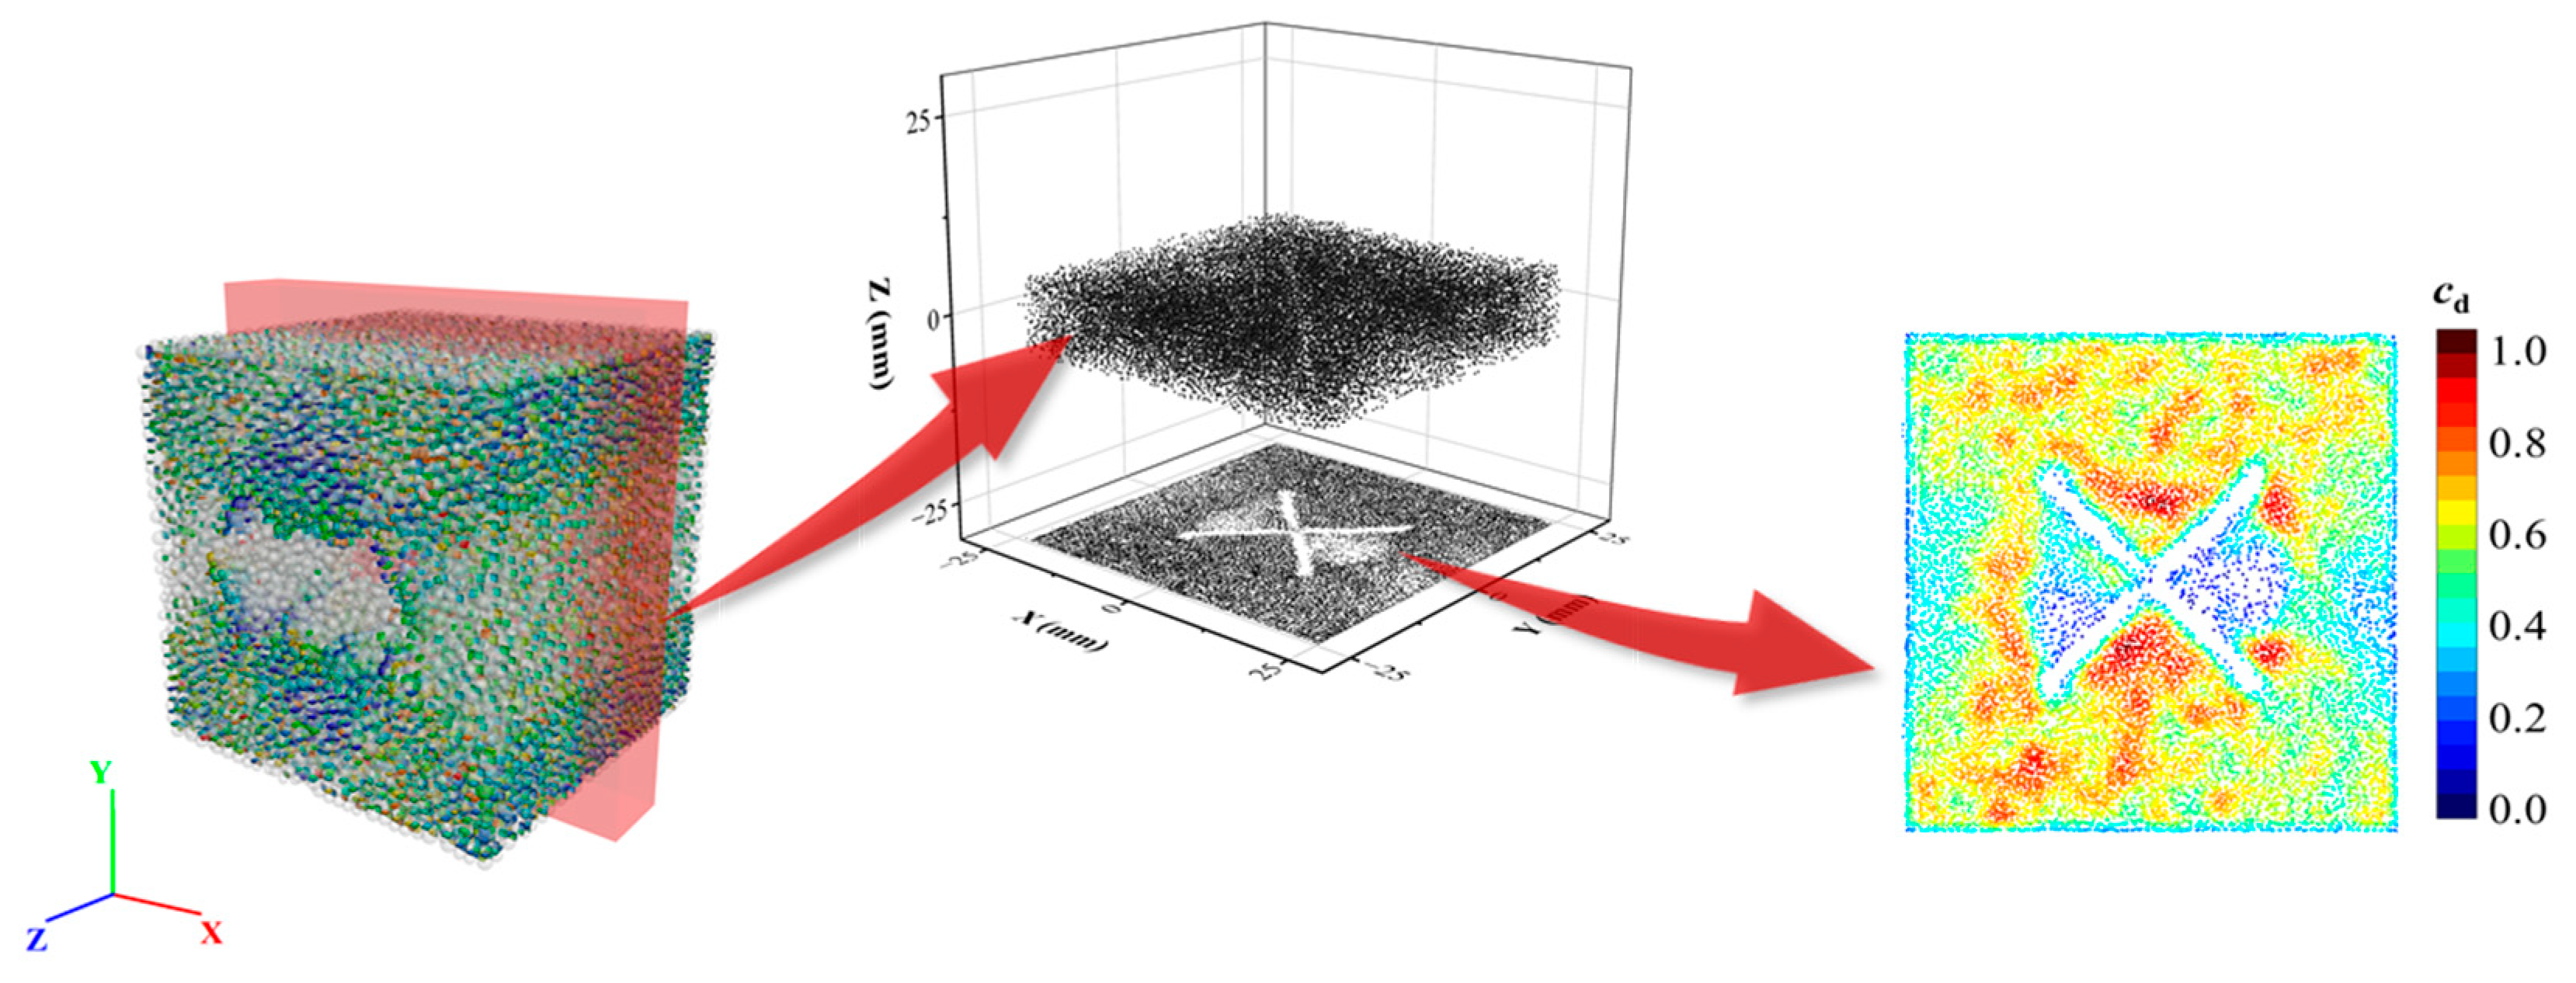
4.1. Evolution of Contact Force Distribution
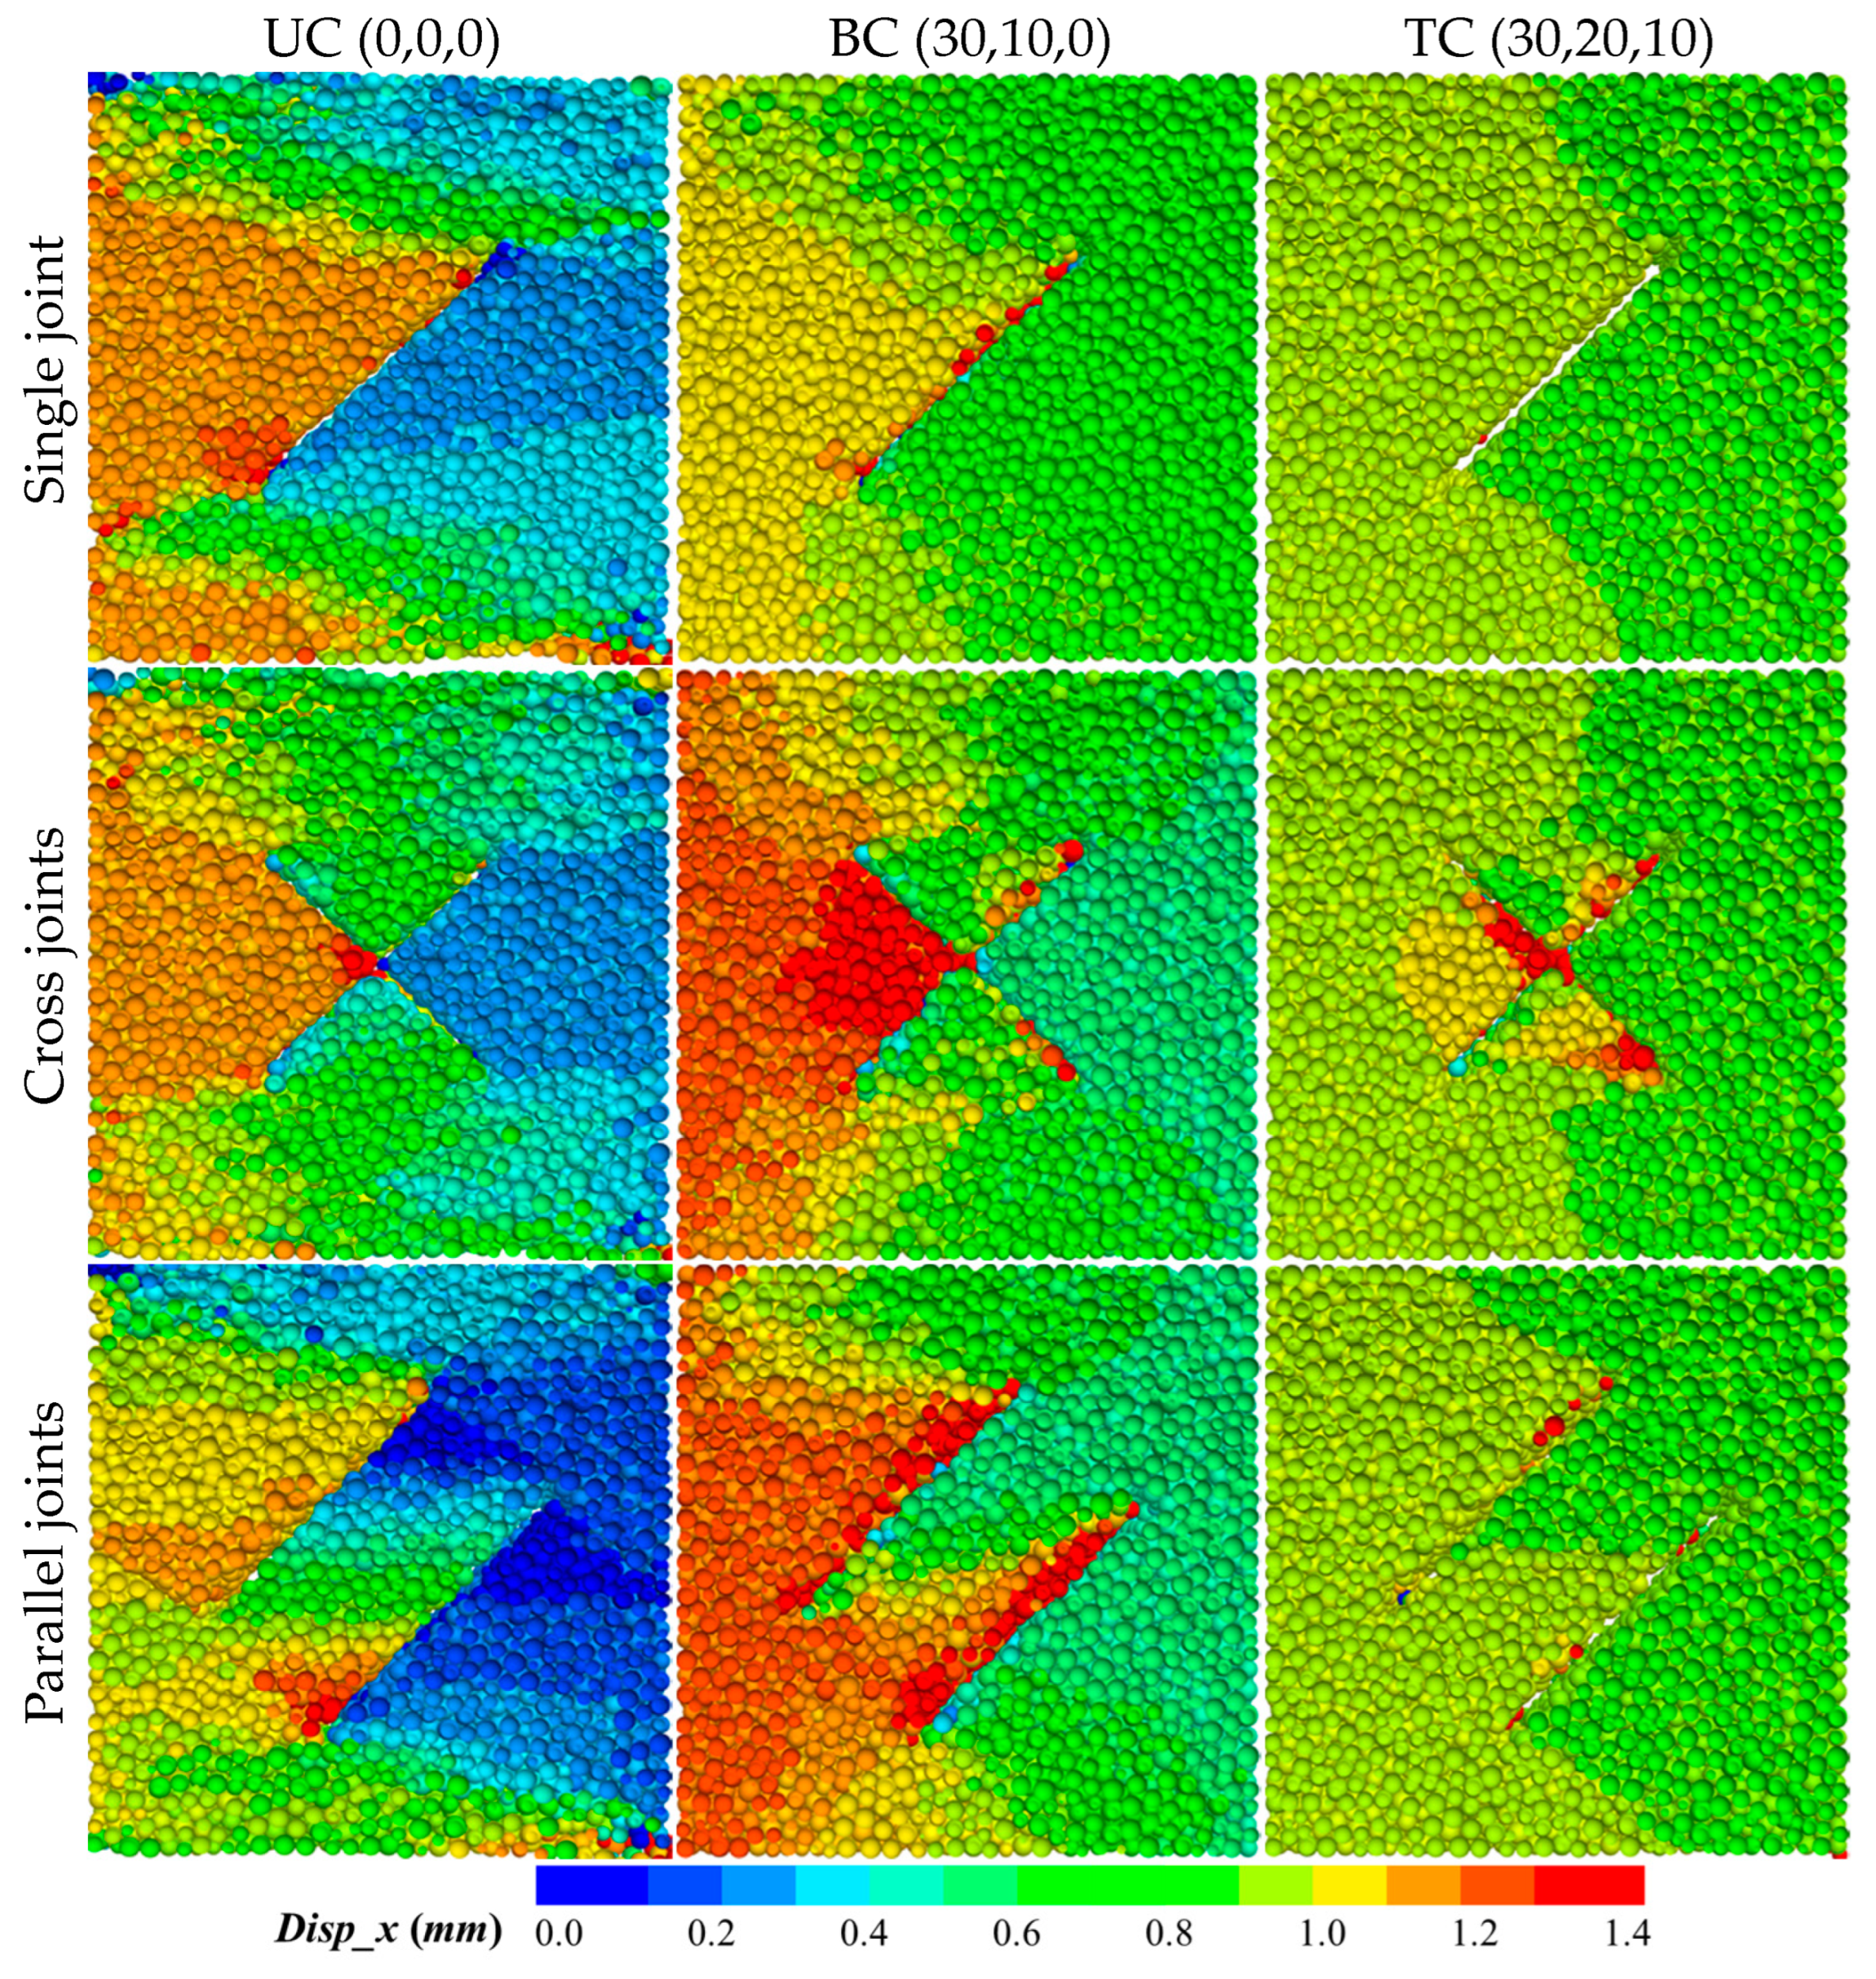
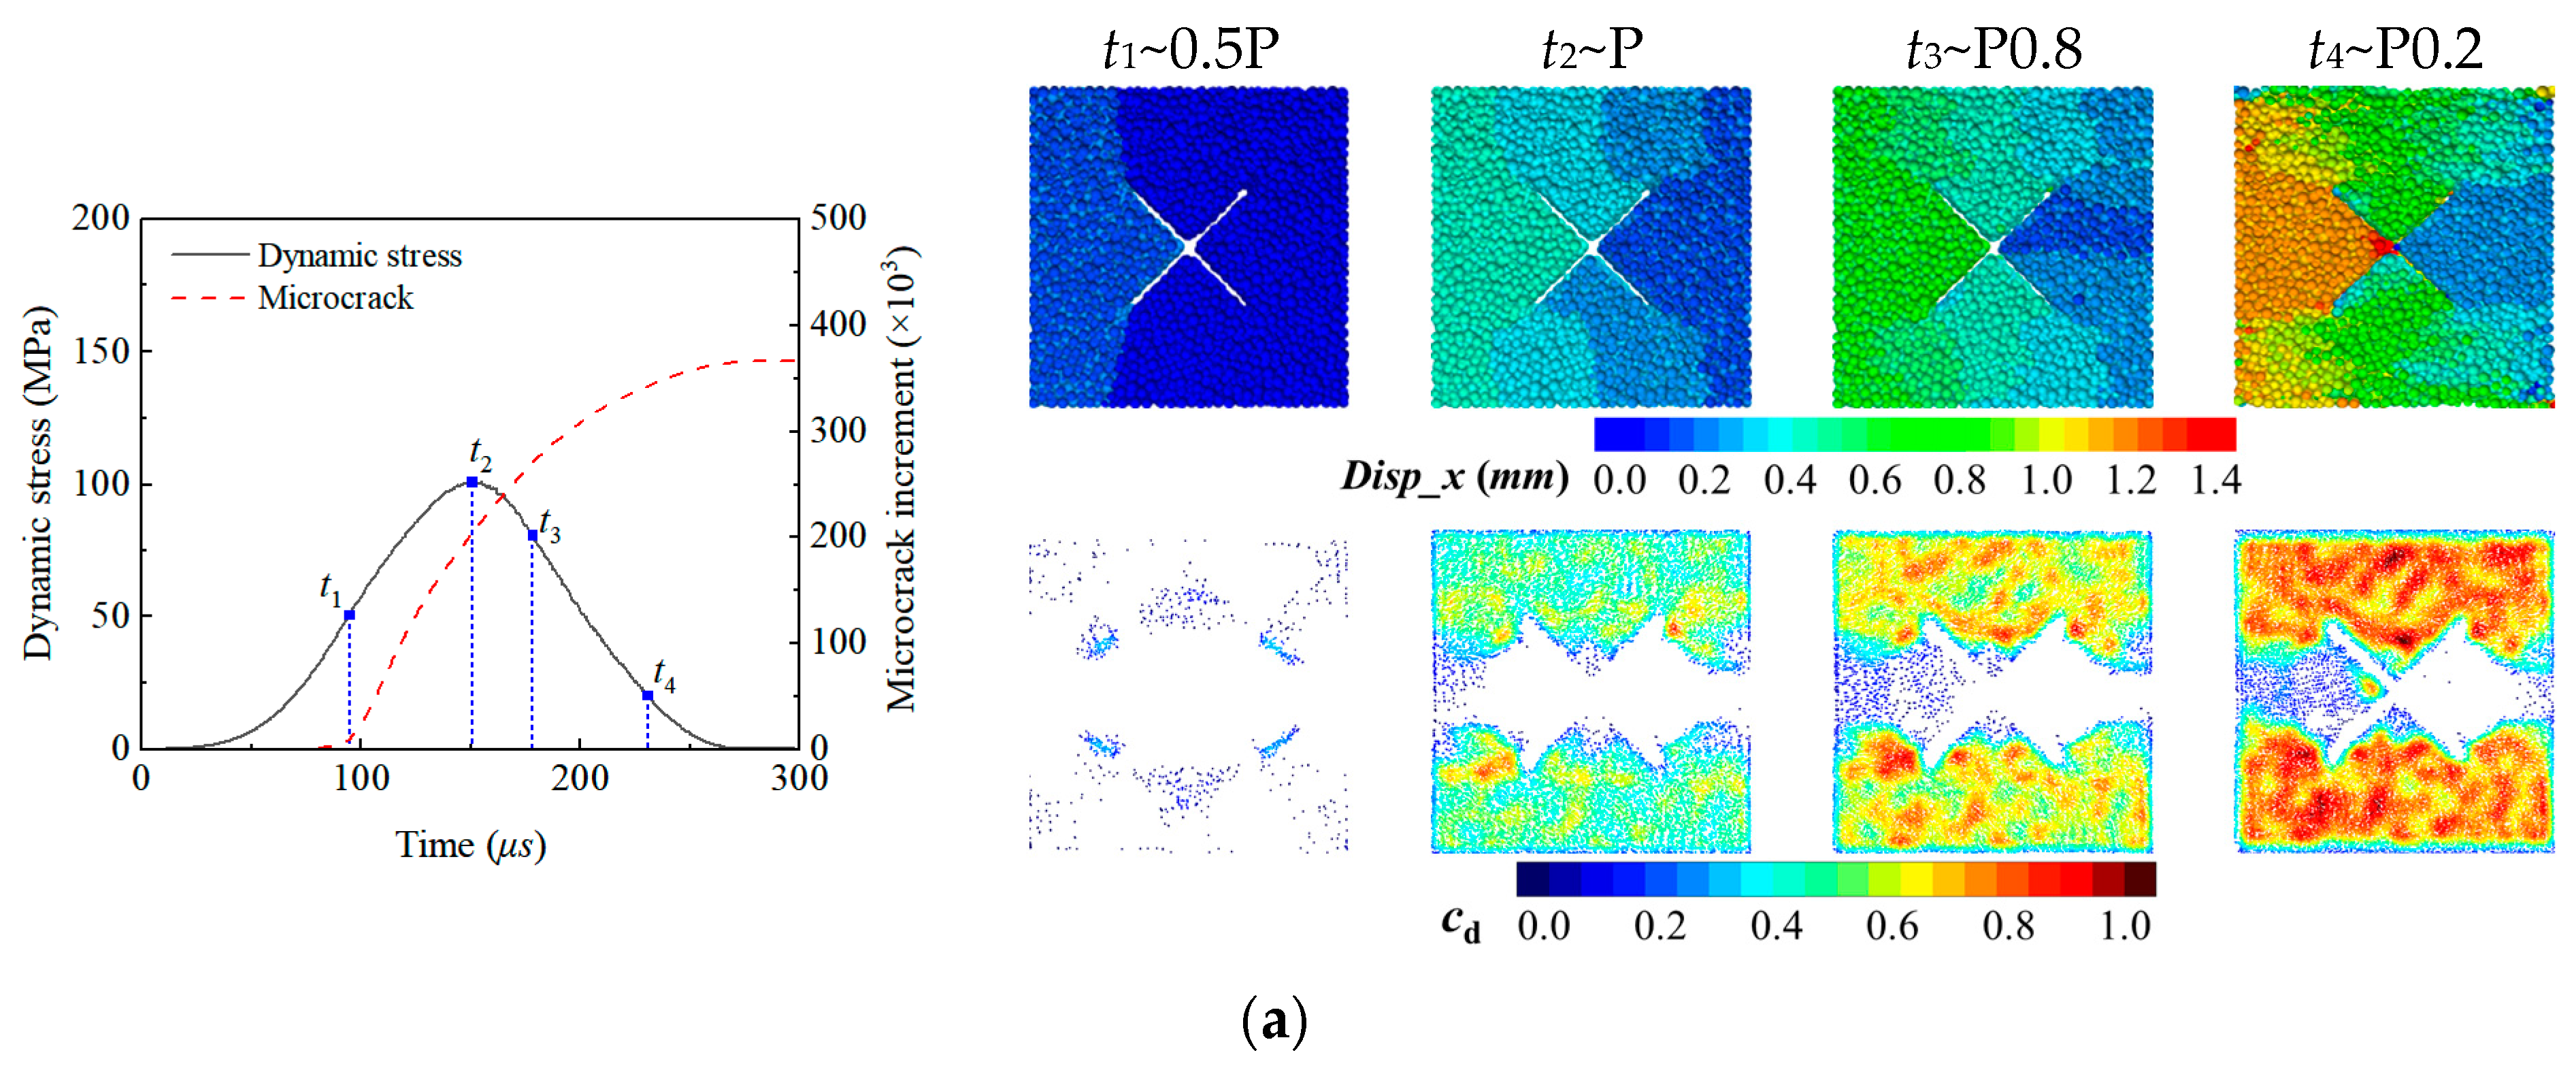
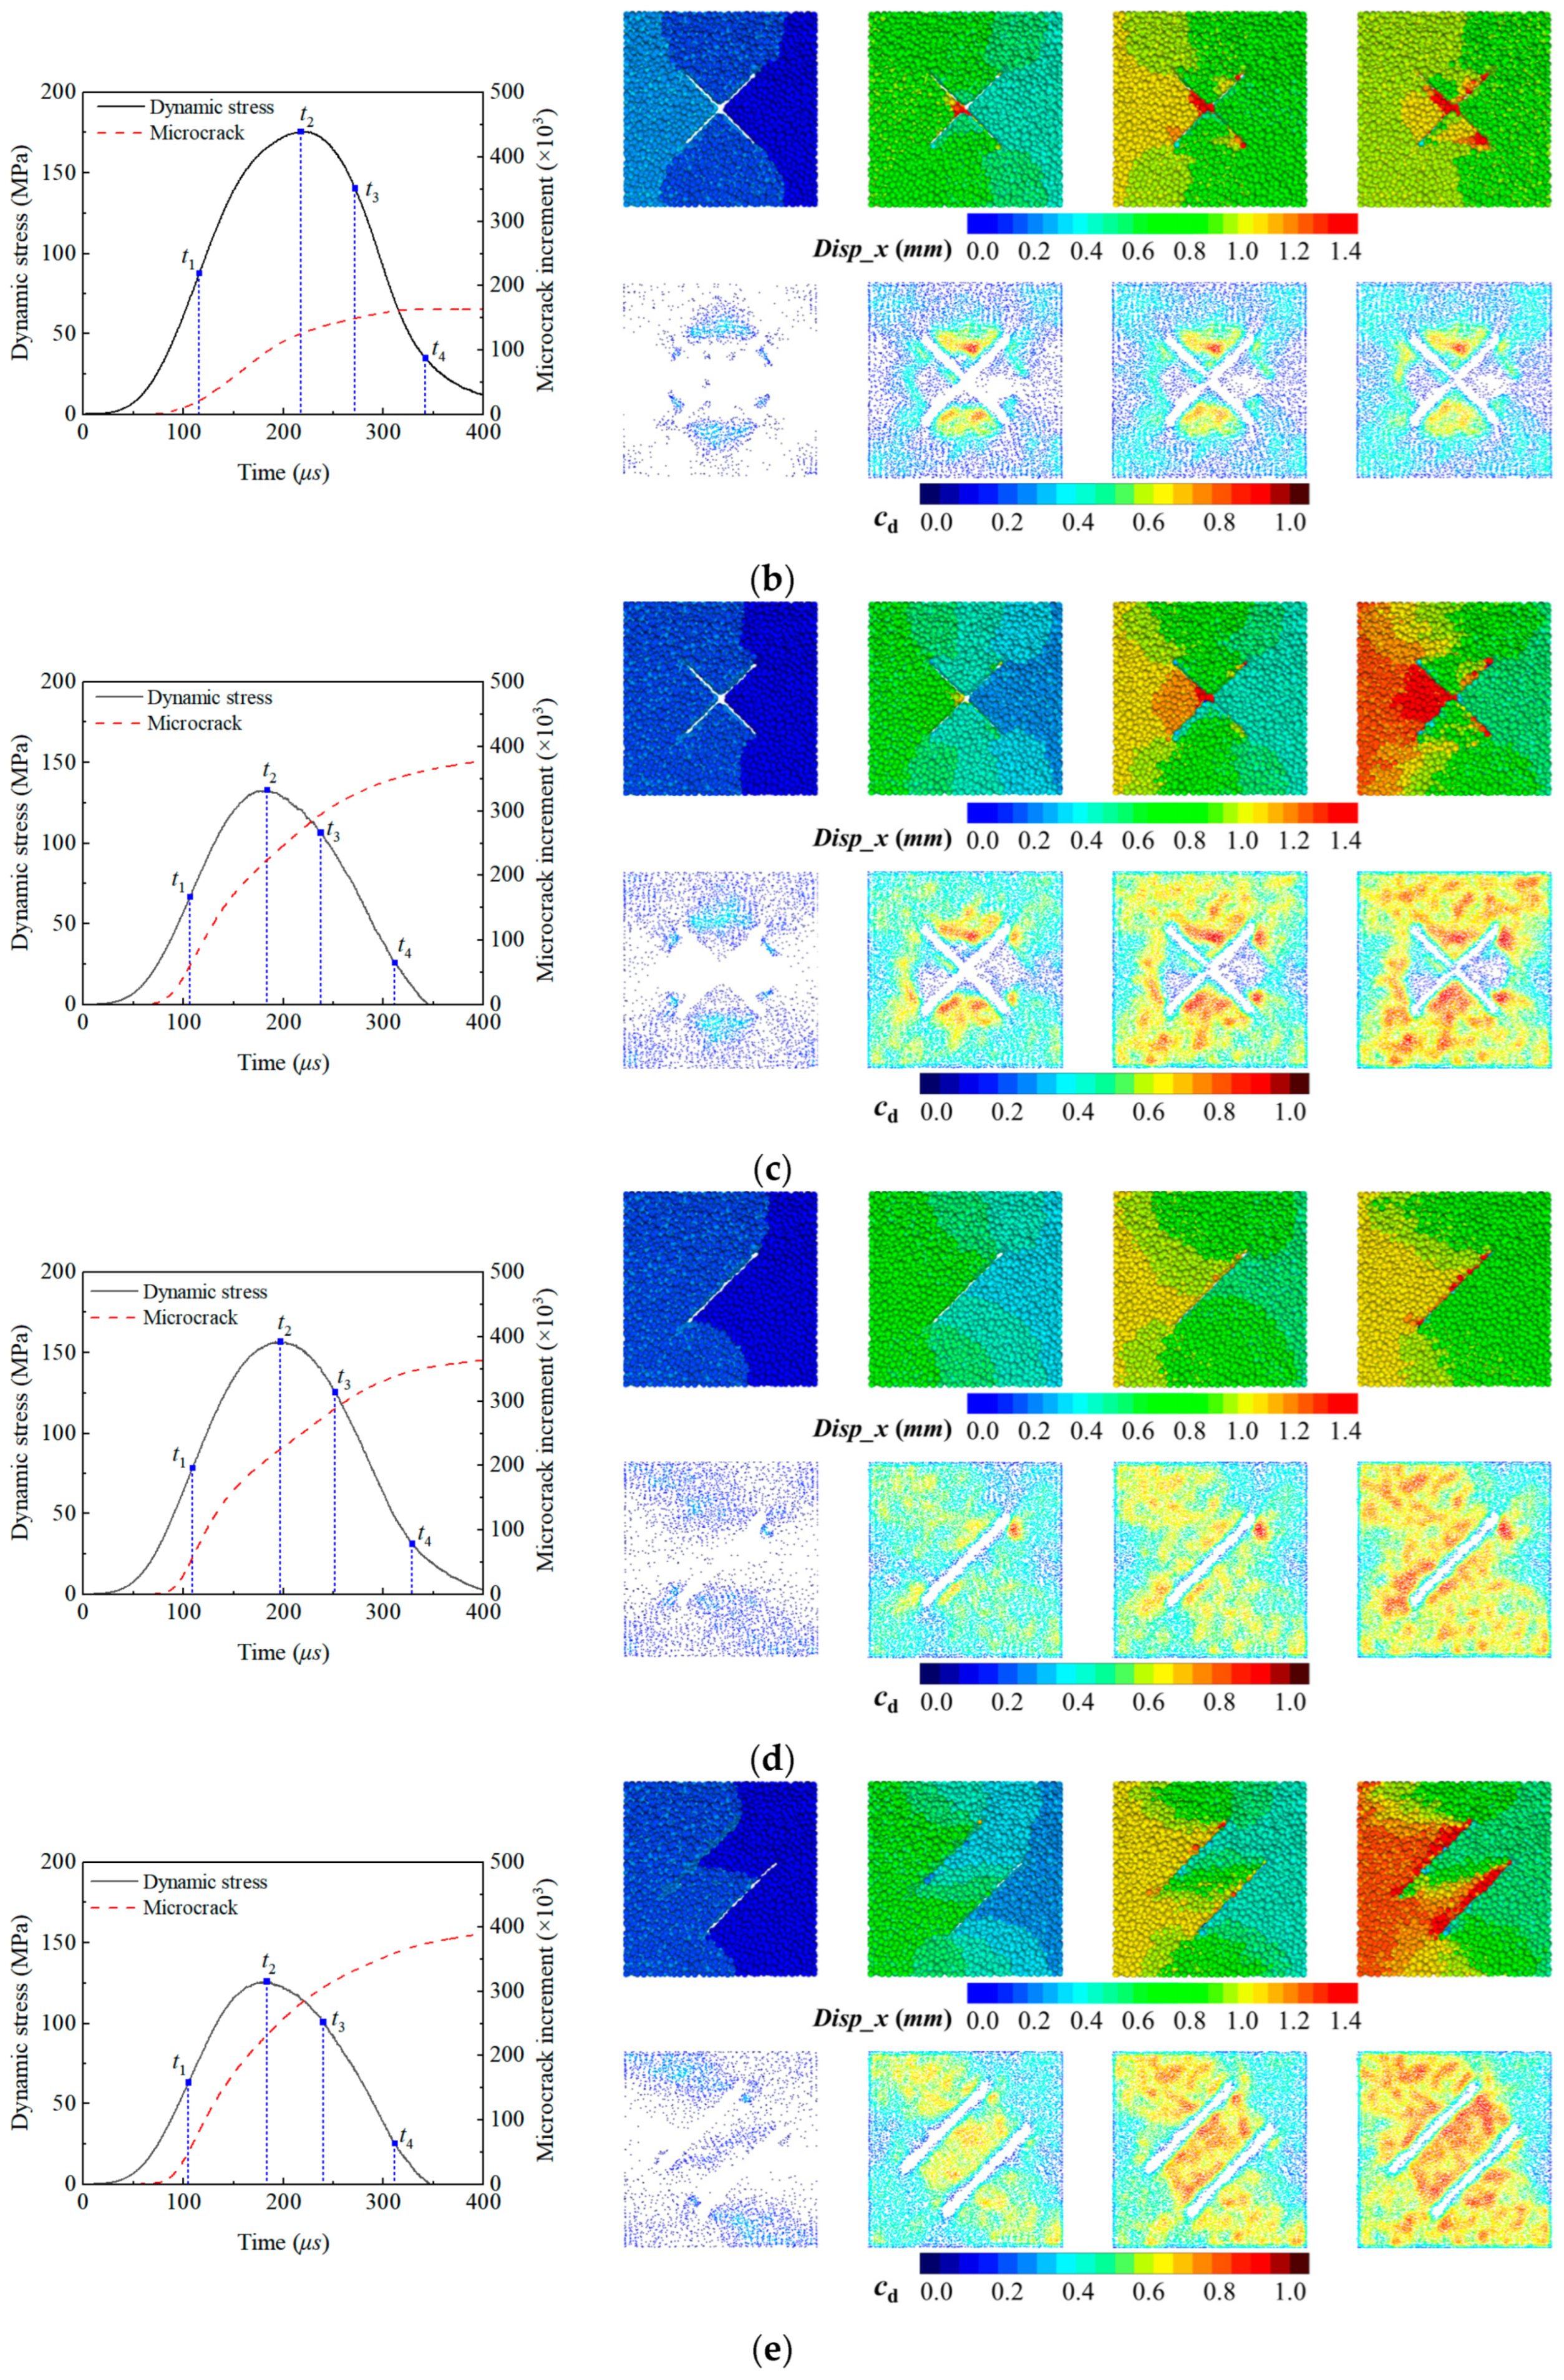
4.2. Progressive Crack Propagation
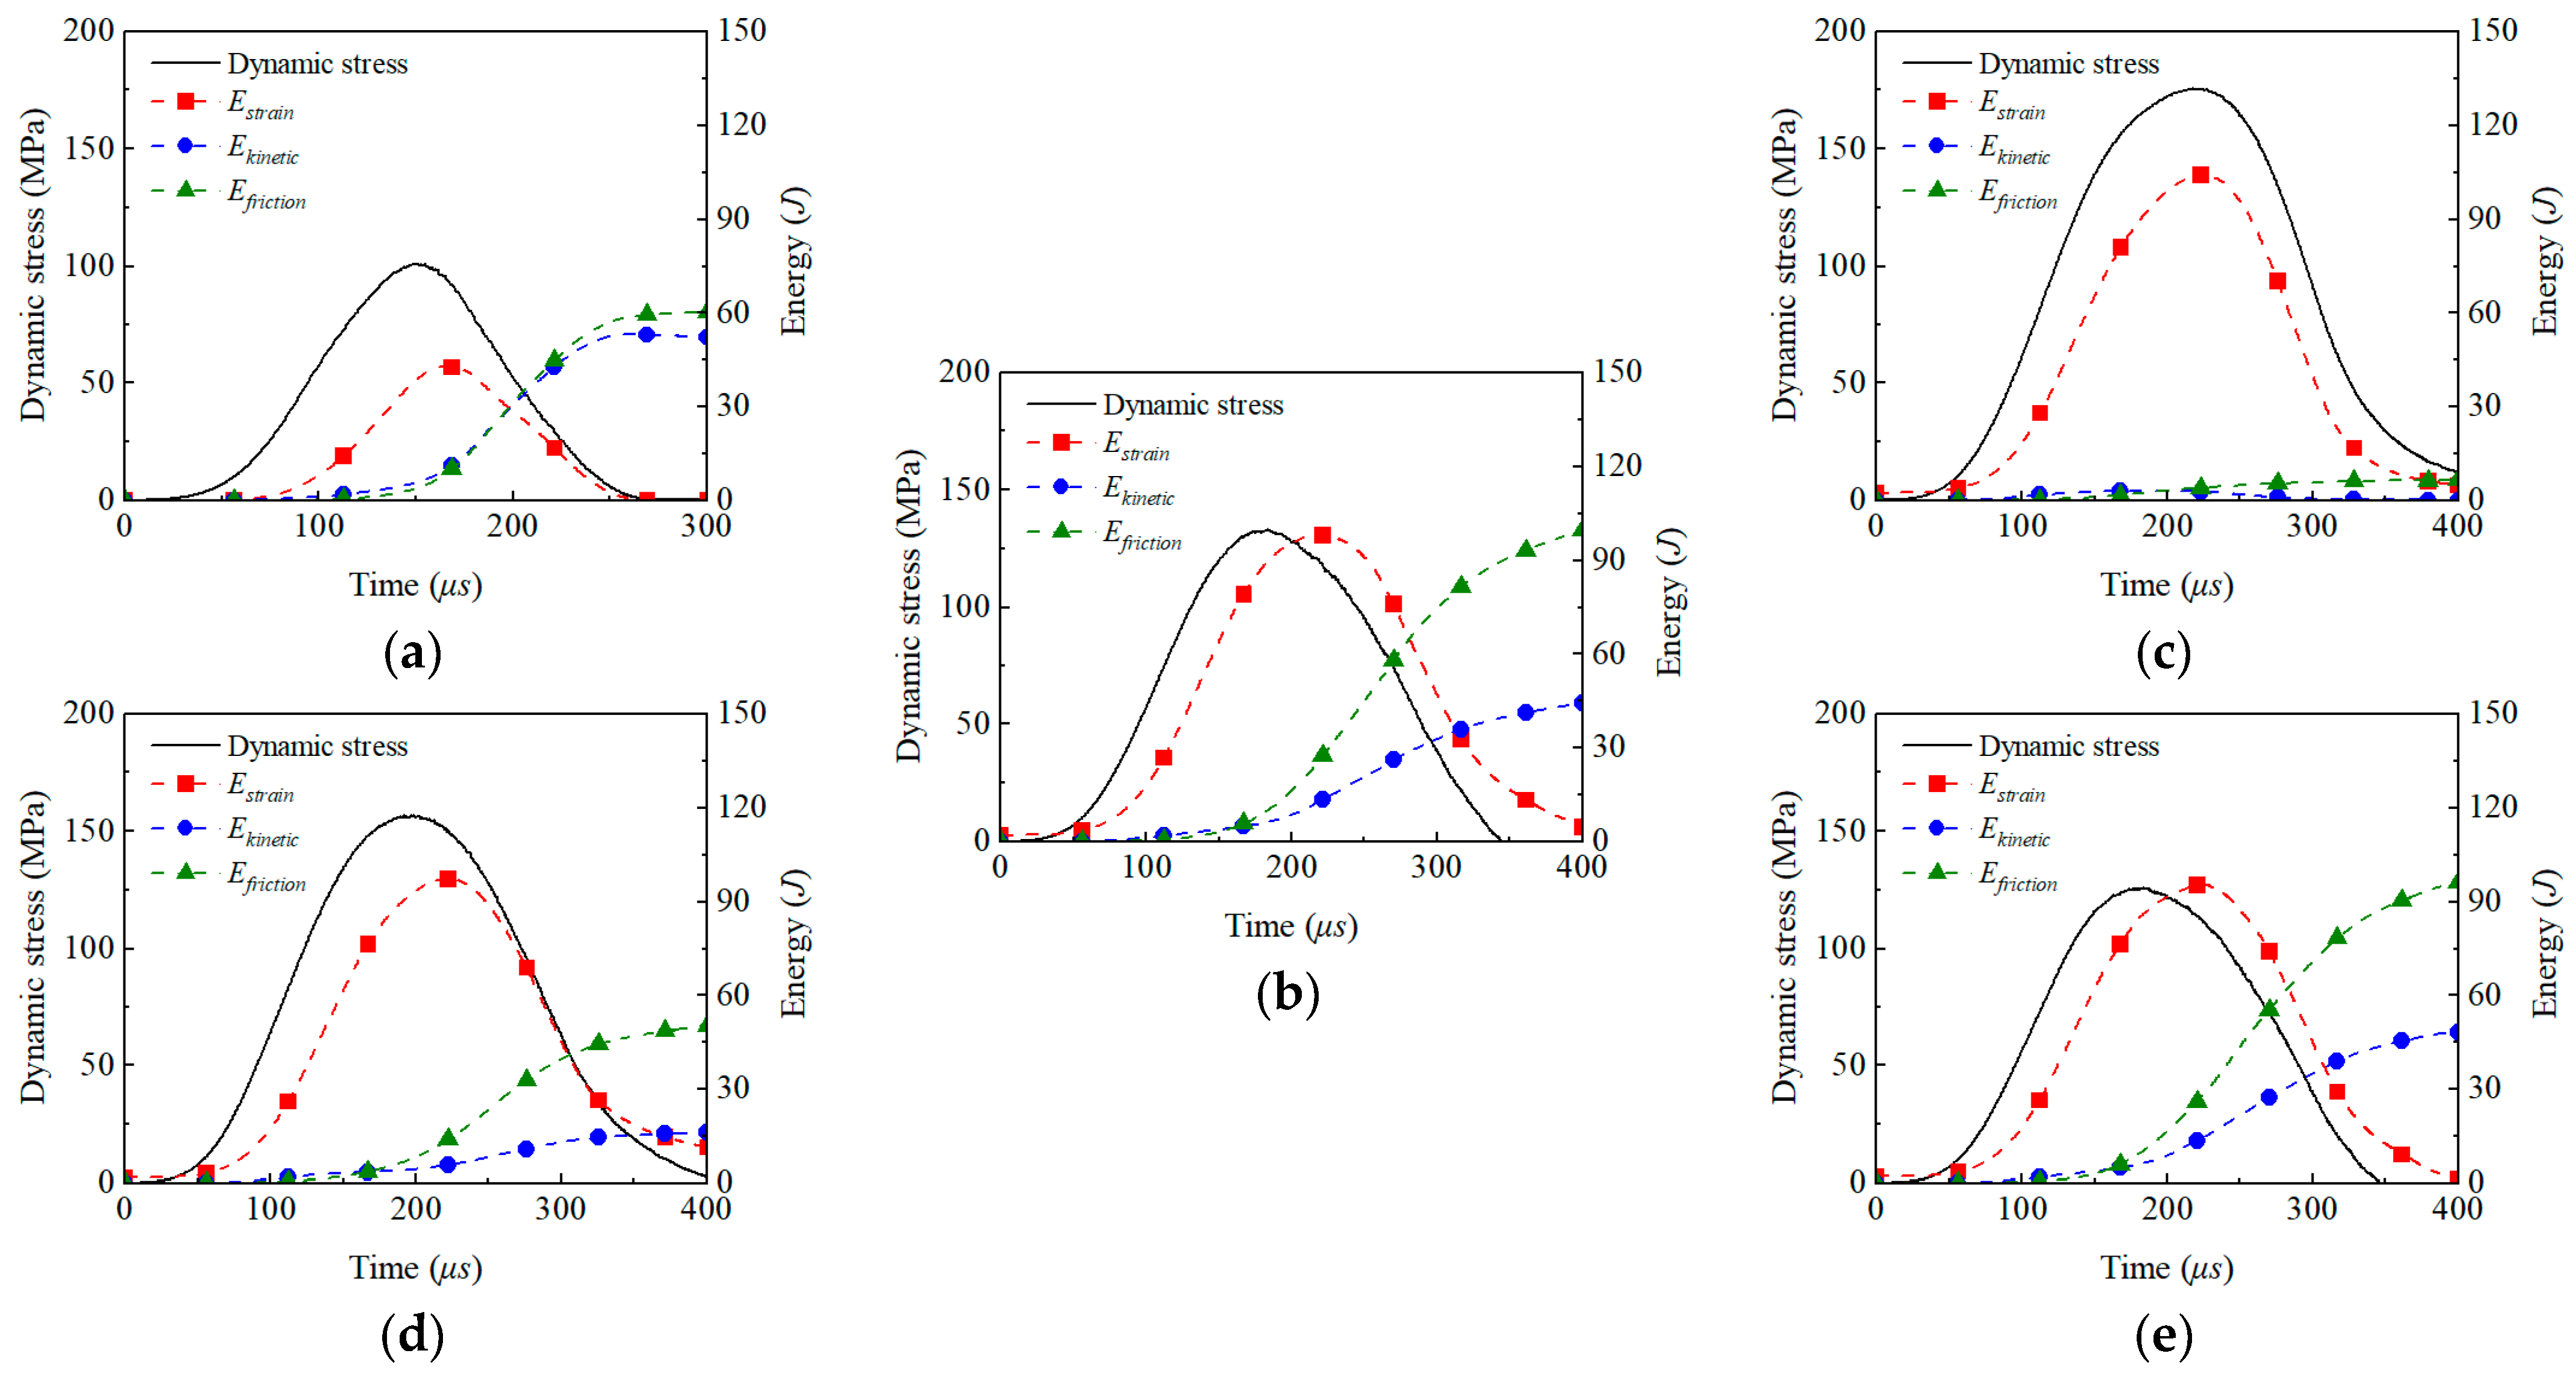
4.3. Energy Dissipation Law
5. Conclusions
Author Contributions
Funding
Institutional Review Board Statement
Informed Consent Statement
Data Availability Statement
Conflicts of Interest
References
- Shang, J.; West, L.; Hencher, S.; Zhao, Z. Geological discontinuity persistence: Implications and quantification. Eng. Geol. 2018, 241, 41–54. [Google Scholar] [CrossRef]
- Wang, Y.; Yang, H.; Song, K.; Chen, C.; Li, H.; Li, X. The influence of joint distribution characteristics on the mechanical properties, fracture mechanisms, and energy characteristics of rock masses under stress conditions. Comput. Geotech. 2025, 178, 106933. [Google Scholar] [CrossRef]
- Lu, J.; Yin, G.; Zhang, D.; Gao, H.; Li, C.; Li, M. True triaxial strength and failure characteristics of cubic coal and sandstone under different loading paths. Int. J. Rock Mech. Min. Sci. 2020, 135, 104439. [Google Scholar] [CrossRef]
- Yang, J.; Yu, T.; Ye, Z.; Luo, Y.; Yao, C.; Zhang, X.; Zhou, C. Dynamic mechanical properties and fracture characteristics of red sandstone under multiaxial confining pressure and impact loading. Eng. Fract. Mech. 2024, 308, 110377. [Google Scholar] [CrossRef]
- Zhang, Q.B.; Zhao, J. A Review of Dynamic Experimental Techniques and Mechanical Behaviour of Rock Materials. Rock Mech. Rock Eng. 2014, 47, 1411–1478. [Google Scholar] [CrossRef]
- He, Z.; Wu, G.; Zhu, J. Mechanical properties of rock under uniaxial compression tests of different control modes and loading rates. Sci. Rep. 2024, 14, 2164. [Google Scholar] [CrossRef] [PubMed]
- Zhao, Y.; Li, X.; Huang, L.; Zhang, Z.; Xu, Z. Characteristic stress variation and microcrack evolution of granite subjected to uniaxial compression using acoustic emission methods. J. Rock Mech. Geotech. Eng. 2024, 16, 3511–3523. [Google Scholar] [CrossRef]
- Luo, Y.; Gong, H.; Xu, K.; Pei, C.; Wei, X.; Li, X. Progressive failure characteristics and energy accumulation of granite with a pre-fabricated fracture during conventional triaxial loading. Theor. Appl. Fract. Mech. 2022, 118, 103219. [Google Scholar] [CrossRef]
- Huang, Y.; Wu, S.; Yang, C. Experimental study on the failure behaviors of sandstone specimens with two fissures under triaxial loading and unloading conditions. Eng. Fract. Mech. 2024, 298, 109933. [Google Scholar] [CrossRef]
- Li, K.; Luan, Y.; Zhang, J.; Liu, C. Experimental study on mechanical behavior, AE response and energy evolution of fissure-filled sandstone from mine roadway under conventional triaxial compression. Theor. Appl. Fract. Mech. 2024, 130, 104334. [Google Scholar] [CrossRef]
- Puller, J.W.; Mills, K.W.; Jeffrey, R.G.; Walker, R.J. In-situ stress measurements and stress change monitoring to monitor overburden caving behaviour and hydraulic fracture pre-conditioning. Int. J. Min. Sci. Technol. 2016, 26, 103–110. [Google Scholar]
- Zhang, Z.; Xie, H.; Zhang, R.; Zhang, Z.; Gao, M.; Jia, Z.; Xie, J. Deformation Damage and Energy Evolution Characteristics of Coal at Different Depths. Rock Mech. Rock Eng. 2019, 52, 1491–1503. [Google Scholar]
- Xie, H.; Lu, J.; Li, C.; Li, M.; Gao, M. Experimental study on the mechanical and failure behaviors of deep rock subjected to true triaxial stress: A review. Int. J. Min. Sci. Technol. 2022, 32, 915–950. [Google Scholar] [CrossRef]
- Yun, X.; Mitri, H.S.; Yang, X.; Wang, Y. Experimental investigation into biaxial compressive strength of granite. Int. J. Rock Mech. Min. Sci. 2010, 47, 334–341. [Google Scholar]
- Feng, F.; Zhang, T.; Chen, S.; Peng, S.; Xie, Z.; Zhao, Y. Analysis of failure properties of red sandstone with structural plane subjected to true triaxial stress paths. Eng. Fract. Mech. 2024, 310, 110490. [Google Scholar]
- Liu, K.; Zhang, Q.B.; Wu, G.; Li, J.C.; Zhao, J. Dynamic Mechanical and Fracture Behaviour of Sandstone Under Multiaxial Loads Using a Triaxial Hopkinson Bar. Rock Mech. Rock Eng. 2019, 52, 2175–2195. [Google Scholar]
- Liu, L.; Li, H.; Li, X.; Wu, R. Full-field strain evolution and characteristic stress levels of rocks containing a single pre-existing flaw under uniaxial compression. Bull. Eng. Geol. Environ. 2020, 79, 3145–3161. [Google Scholar]
- Liu, T.; Ding, L.; Wang, G.; Ma, R.; Li, X. Dynamic properties and failure mechanism of granite with non-persistent joints subjected to impact load. Int. J. Rock Mech. Min. Sci. 2023, 169, 105451. [Google Scholar]
- Shu, P.; Li, H.; Wang, T.; Ueng, T. Dynamic strength of rock with single planar joint under various loading rates at various angles of loads applied. J. Rock Mech. Geotech. Eng. 2018, 10, 545–554. [Google Scholar]
- Xiong, L.X.; Chen, H.J.; Geng, D.X. Uniaxial Compression Study on Mechanical Properties of Artificial Rock Specimens with Cross-Flaws. Geotech. Geol. Eng. 2021, 39, 1667–1681. [Google Scholar]
- Xie, X.; Li, J.; Zheng, Y. Experimental study on dynamic mechanical and failure behavior of a jointed rock mass. Int. J. Rock Mech. Min. Sci. 2023, 168, 105415. [Google Scholar]
- Feng, P.; Xu, Y.; Dai, F. Effects of dynamic strain rate on the energy dissipation and fragment characteristics of cross-fissured rocks. Int. J. Rock Mech. Min. Sci. 2021, 138, 104600. [Google Scholar]
- Zhang, L.; Zhang, Z.; Chen, Y.; Dai, B.; Wang, B. Crack development and damage patterns under combined dynamic-static loading of parallel double fractured rocks based on DIC technique. Acta Geotech. 2023, 18, 877–901. [Google Scholar]
- Hao, Y.; Hao, H. Numerical Investigation of the Dynamic Compressive Behaviour of Rock Materials at High Strain Rate. Rock Mech. Rock Eng. 2013, 46, 373–388. [Google Scholar]
- Zhang, X.; Jiao, Y.; Ma, J. Simulation of rock dynamic failure using discontinuous numerical approach. Comput. Geotech. 2018, 96, 160–166. [Google Scholar]
- Li, X.; Zou, Y.; Zhou, Z. Numerical Simulation of the Rock SHPB Test with a Special Shape Striker Based on the Discrete Element Method. Rock Mech. Rock Eng. 2014, 47, 1693–1709. [Google Scholar]
- Hu, W.; Liu, K.; Potyondy, D.; Zhang, Q. 3D continuum-discrete coupled modelling of triaxial Hopkinson bar tests on rock under multiaxial static-dynamic loads. Int. J. Rock Mech. Min. Sci. 2020, 134, 104448. [Google Scholar]
- ITASCA Consulting Group Inc. PFC3D. User’s Manual; ITASCA Consulting Group Inc.: Minneapolis, MN, USA, 2018. [Google Scholar]
- Potyondy, D.O. A Flat-Jointed Bonded-Particle Model for Rock. In Proceedings of the 52nd U.S. Rock Mechanics/Geomechanics Symposium, Seattle, WA, USA, 17–20 June 2018. [Google Scholar]
- Wang, S.; Potyondy, D.; Chu, W.; Zhang, L.; Zhao, X.; Wang, T. Investigation of meso-mechanical properties of Jinping dolomitic marble based on flat-joint model. J. Rock Mech. Geotech. Eng. 2024; in press. [Google Scholar]
- Hofmann, H.; Babadagli, T.; Zimmermann, G. A grain-based modeling study of fracture branching during compression tests in granites. Int. J. Rock Mech. Min. Sci. 2015, 77, 152–162. [Google Scholar]
- Mehranpour, M.H.; Kulatilake, P.H. Improvements for the smooth joint contact model of the particle flow code and its applications. Comput. Geotech. 2017, 87, 163–177. [Google Scholar]
- Wang, S.; Zhou, J.; Zhang, L.; Han, Z.; Zhang, F. Parameter studies on the mineral boundary strength influencing the fracturing of the crystalline rock based on a novel Grain-Based Model. Eng. Fract. Mech. 2021, 241, 107388. [Google Scholar]
- Du, H.; Dai, F.; Xu, Y.; Liu, Y.; Xu, H. Numerical investigation on the dynamic strength and failure behavior of rocks under hydrostatic confinement in SHPB testing. Int. J. Rock Mech. Min. Sci. 2018, 108, 43–57. [Google Scholar]


| Parameter | Value | Symbol (Unit) |
|---|---|---|
| Particles * | ||
| Minimum particle radius | 0.6 | Rmin (mm) |
| Particle radius ratio | 1.66 | Rmax/Rmin |
| Density | 2700 | ρ (kg/m3) |
| Contacts (FJ Model) * | ||
| Number of elements in radial direction | 1 | Nr |
| Number of elements in circumferential direction | 3 | Nα |
| Installation gap | 0.18 | g (mm) |
| Effective modulus | 43.0 | (GPa) |
| Normal-to-shear stiffness ratio | 3.0 | |
| Tensile strength | 26.0 | σc (MPa) |
| Cohesion | 130.0 | c (MPa) |
| Friction angle | 45 | φ (°) |
| Friction coefficient | 0.45 | μ |
| Bar system (Elastic Model) * | ||
| Young’s modulus | 200.0 | E (GPa) |
| Poisson | 0.27 | ν |
| Density | 7850 | ρs (kg/m3) |
Disclaimer/Publisher’s Note: The statements, opinions and data contained in all publications are solely those of the individual author(s) and contributor(s) and not of MDPI and/or the editor(s). MDPI and/or the editor(s) disclaim responsibility for any injury to people or property resulting from any ideas, methods, instructions or products referred to in the content. |
© 2025 by the authors. Licensee MDPI, Basel, Switzerland. This article is an open access article distributed under the terms and conditions of the Creative Commons Attribution (CC BY) license (https://creativecommons.org/licenses/by/4.0/).
Share and Cite
Liu, T.; Wang, Z.; Wang, X.; Yang, S.; Huang, W.; Ding, L. Effects of Stress States and Joint Configurations on Dynamic Mechanical Properties of Rock Masses. Materials 2025, 18, 1699. https://doi.org/10.3390/ma18081699
Liu T, Wang Z, Wang X, Yang S, Huang W, Ding L. Effects of Stress States and Joint Configurations on Dynamic Mechanical Properties of Rock Masses. Materials. 2025; 18(8):1699. https://doi.org/10.3390/ma18081699
Chicago/Turabian StyleLiu, Tingting, Zi Wang, Xuyi Wang, Shenghao Yang, Wenxu Huang, and Luyang Ding. 2025. "Effects of Stress States and Joint Configurations on Dynamic Mechanical Properties of Rock Masses" Materials 18, no. 8: 1699. https://doi.org/10.3390/ma18081699
APA StyleLiu, T., Wang, Z., Wang, X., Yang, S., Huang, W., & Ding, L. (2025). Effects of Stress States and Joint Configurations on Dynamic Mechanical Properties of Rock Masses. Materials, 18(8), 1699. https://doi.org/10.3390/ma18081699