
Machine-Learning-Assisted Multi-Element Optimization of Mechanical Properties in Spinel Refractory Materials

Abstract
1. Introduction
2. Materials and Methods
2.1. Sample Preparation and Basic Performance Test Methods
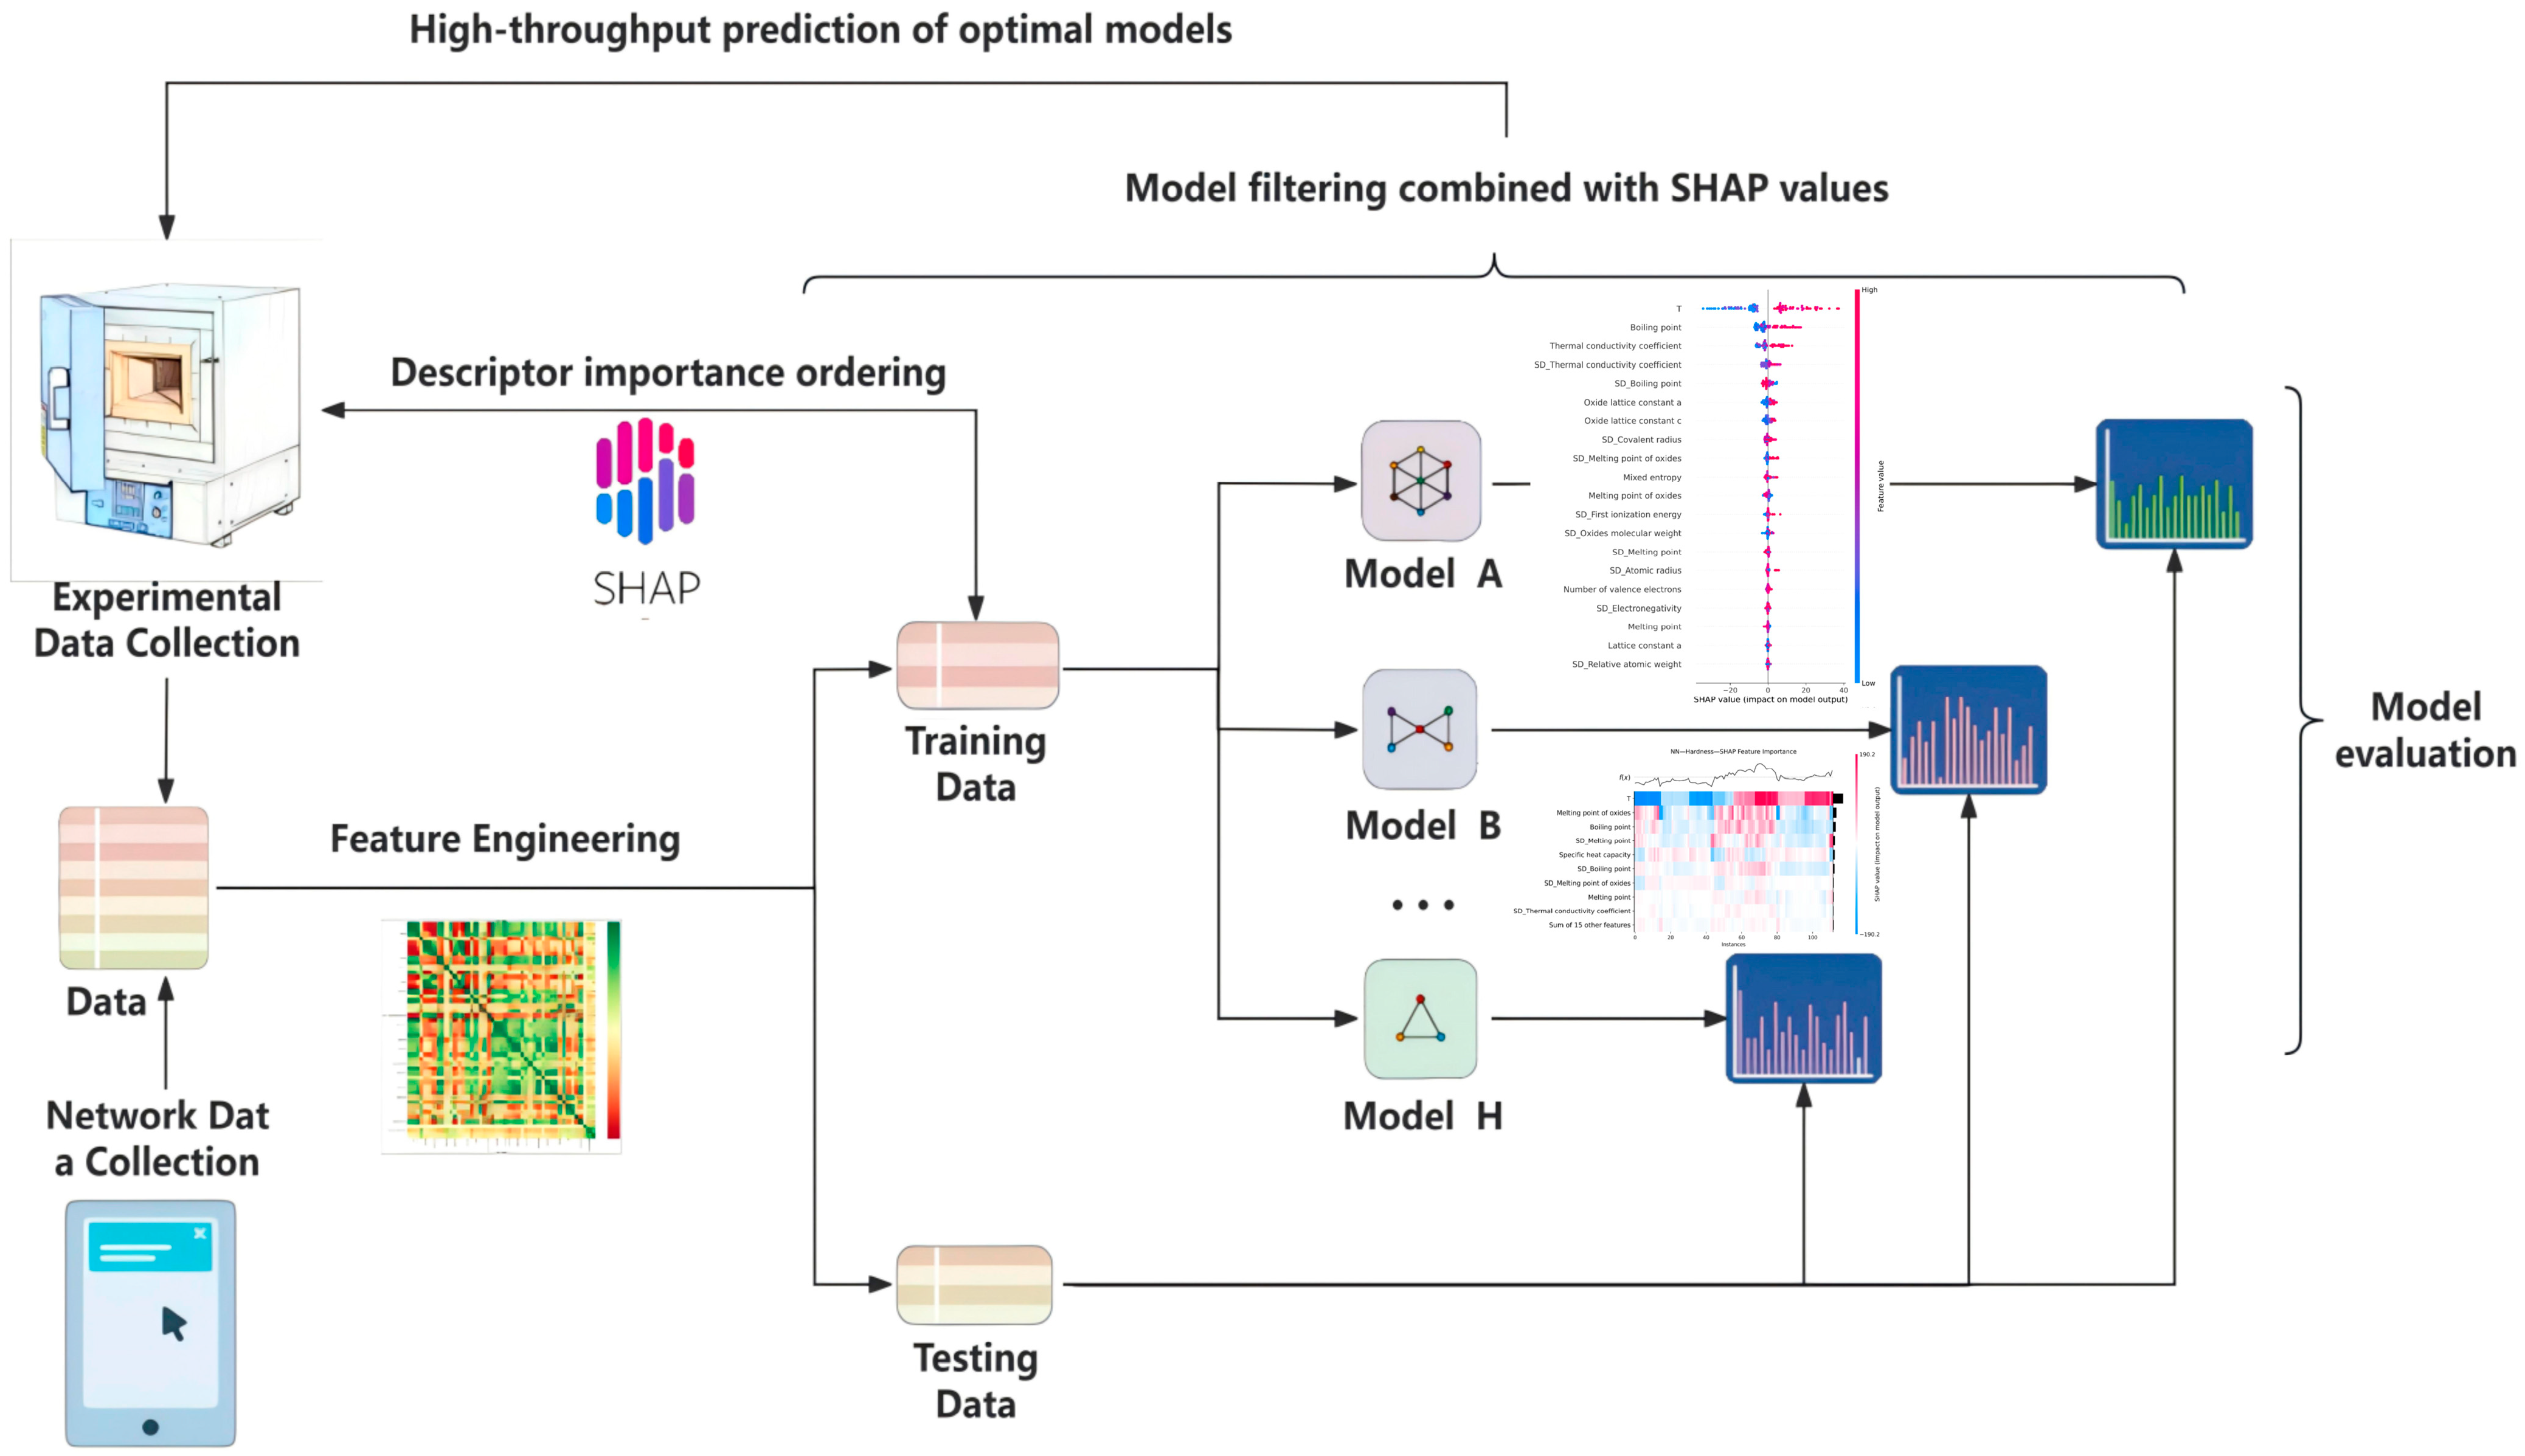
2.2. Machine Learning Methods
2.2.1. Database Construction
2.2.2. Descriptor Selection
2.2.3. Model Evaluation
3. Results
3.1. Experimental Results
3.2. Machine Learning Process
3.2.1. Selected Descriptors
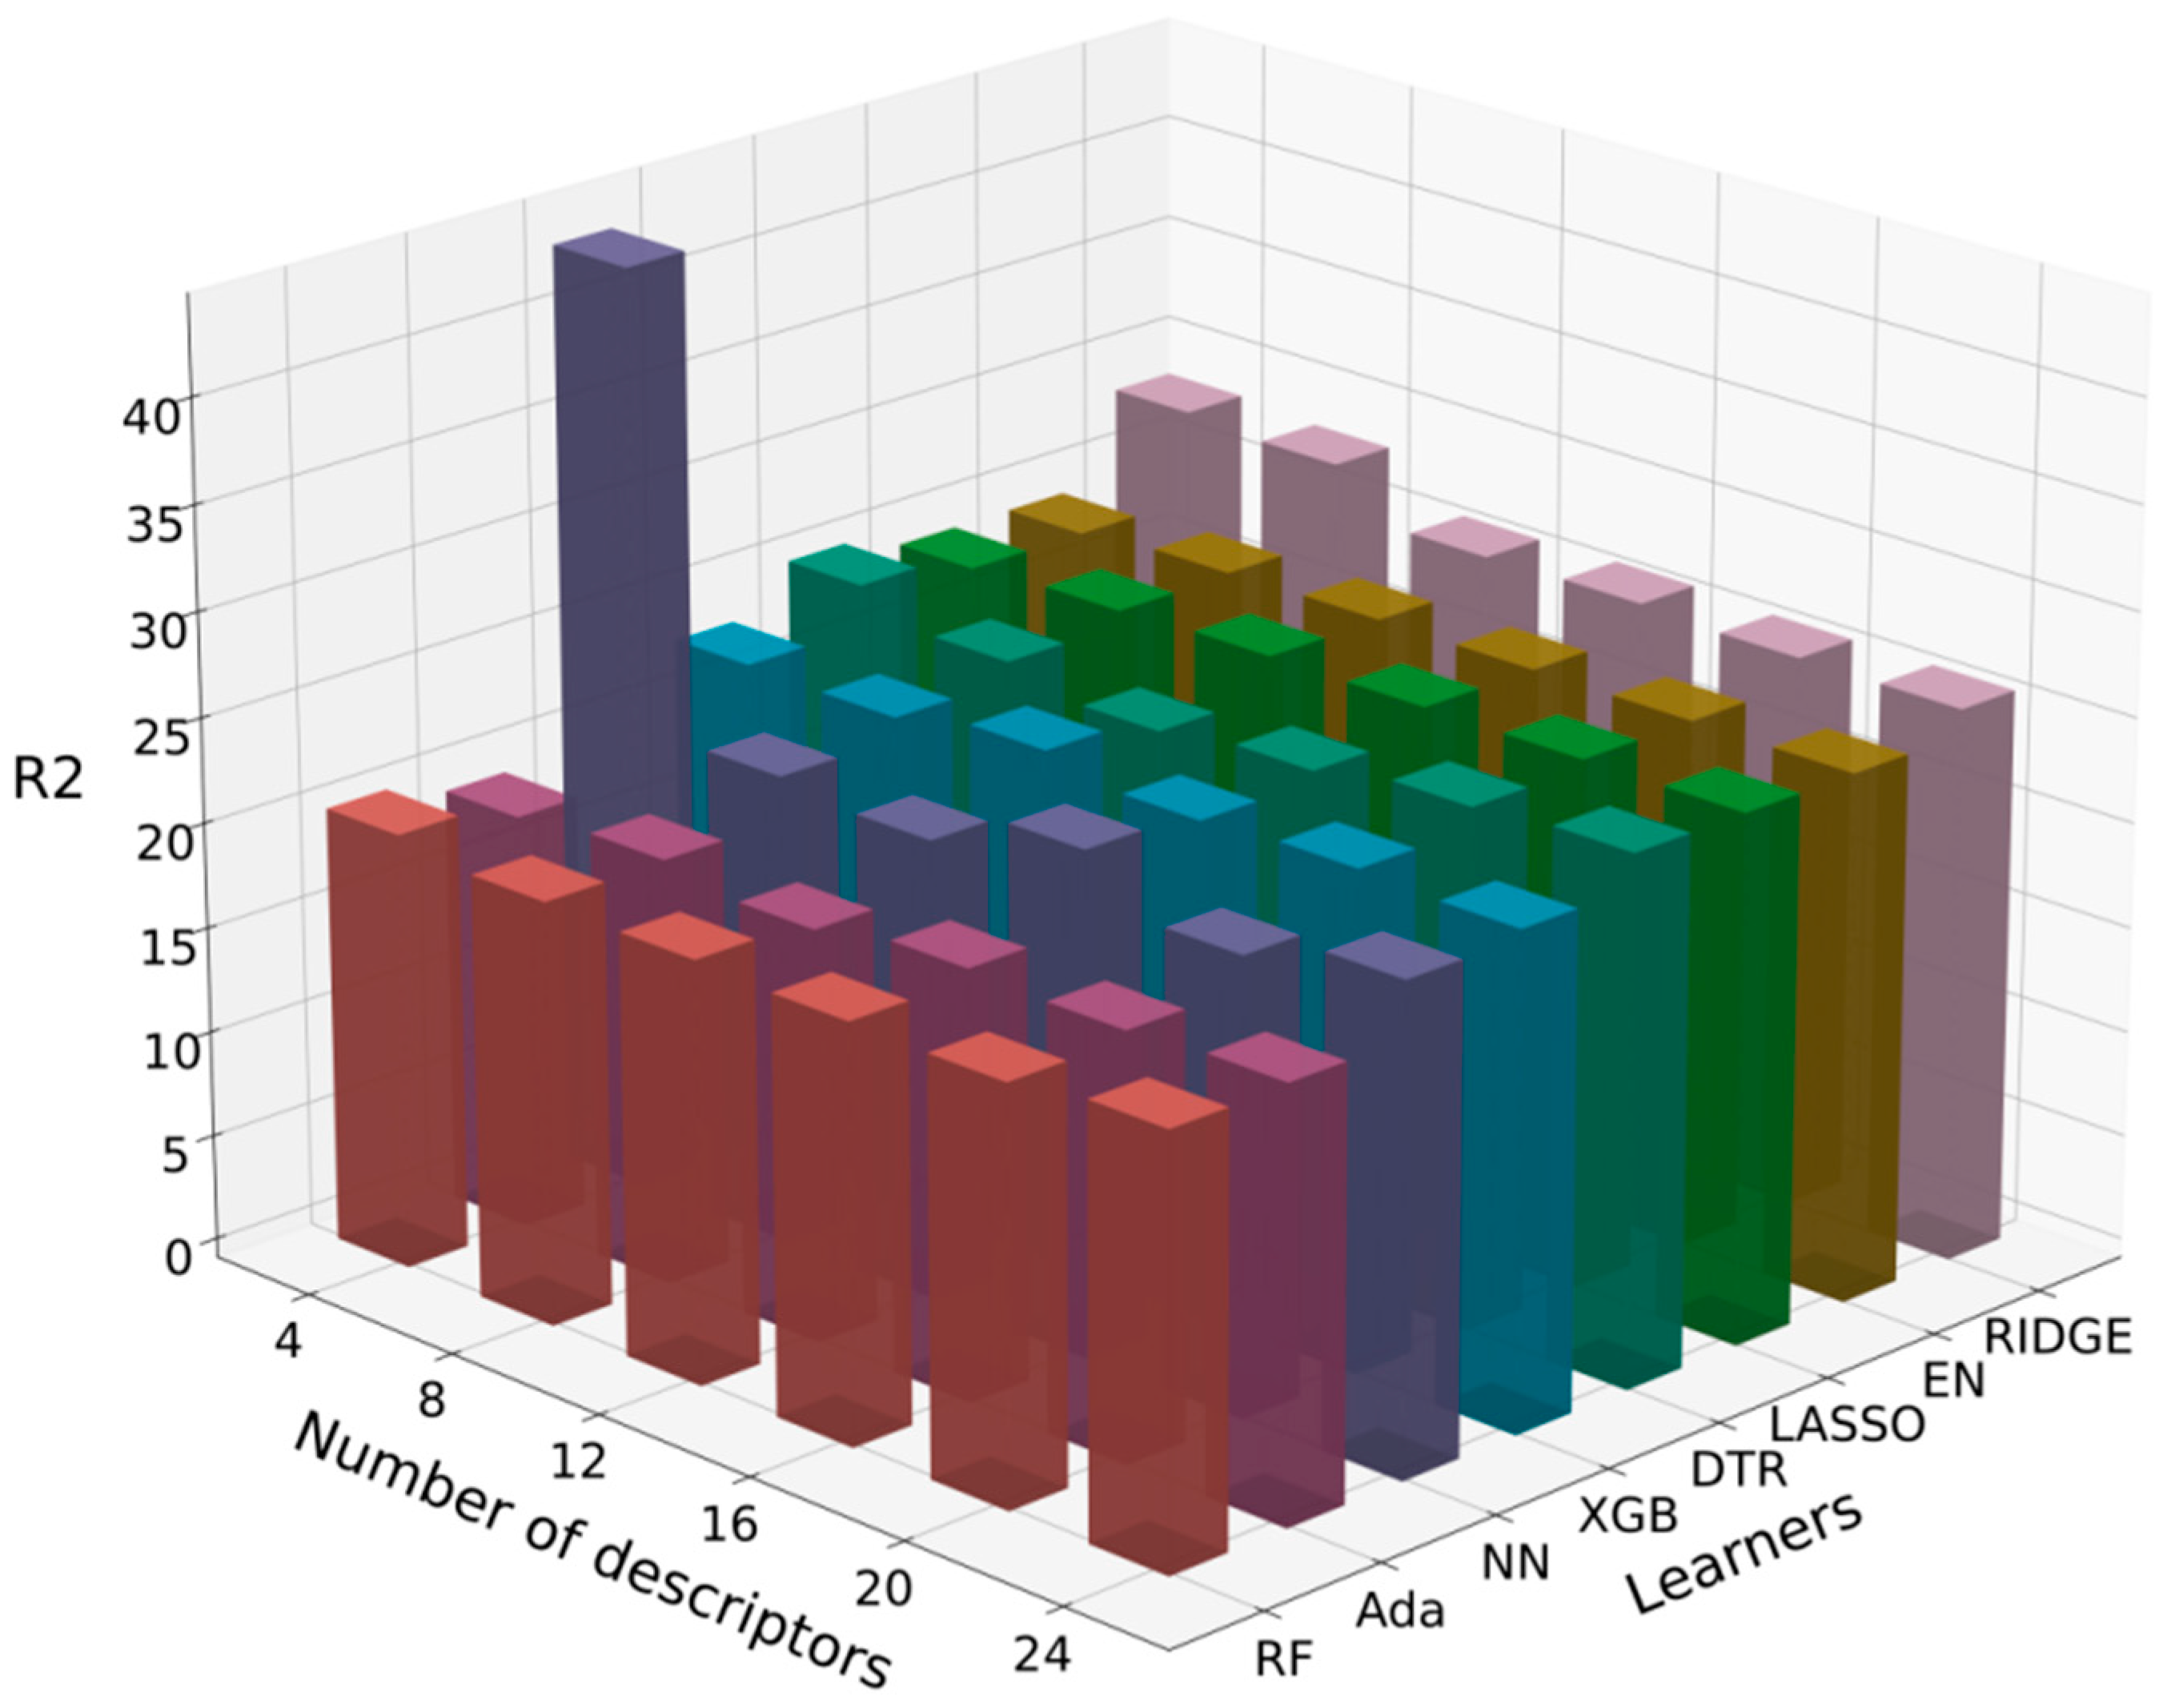
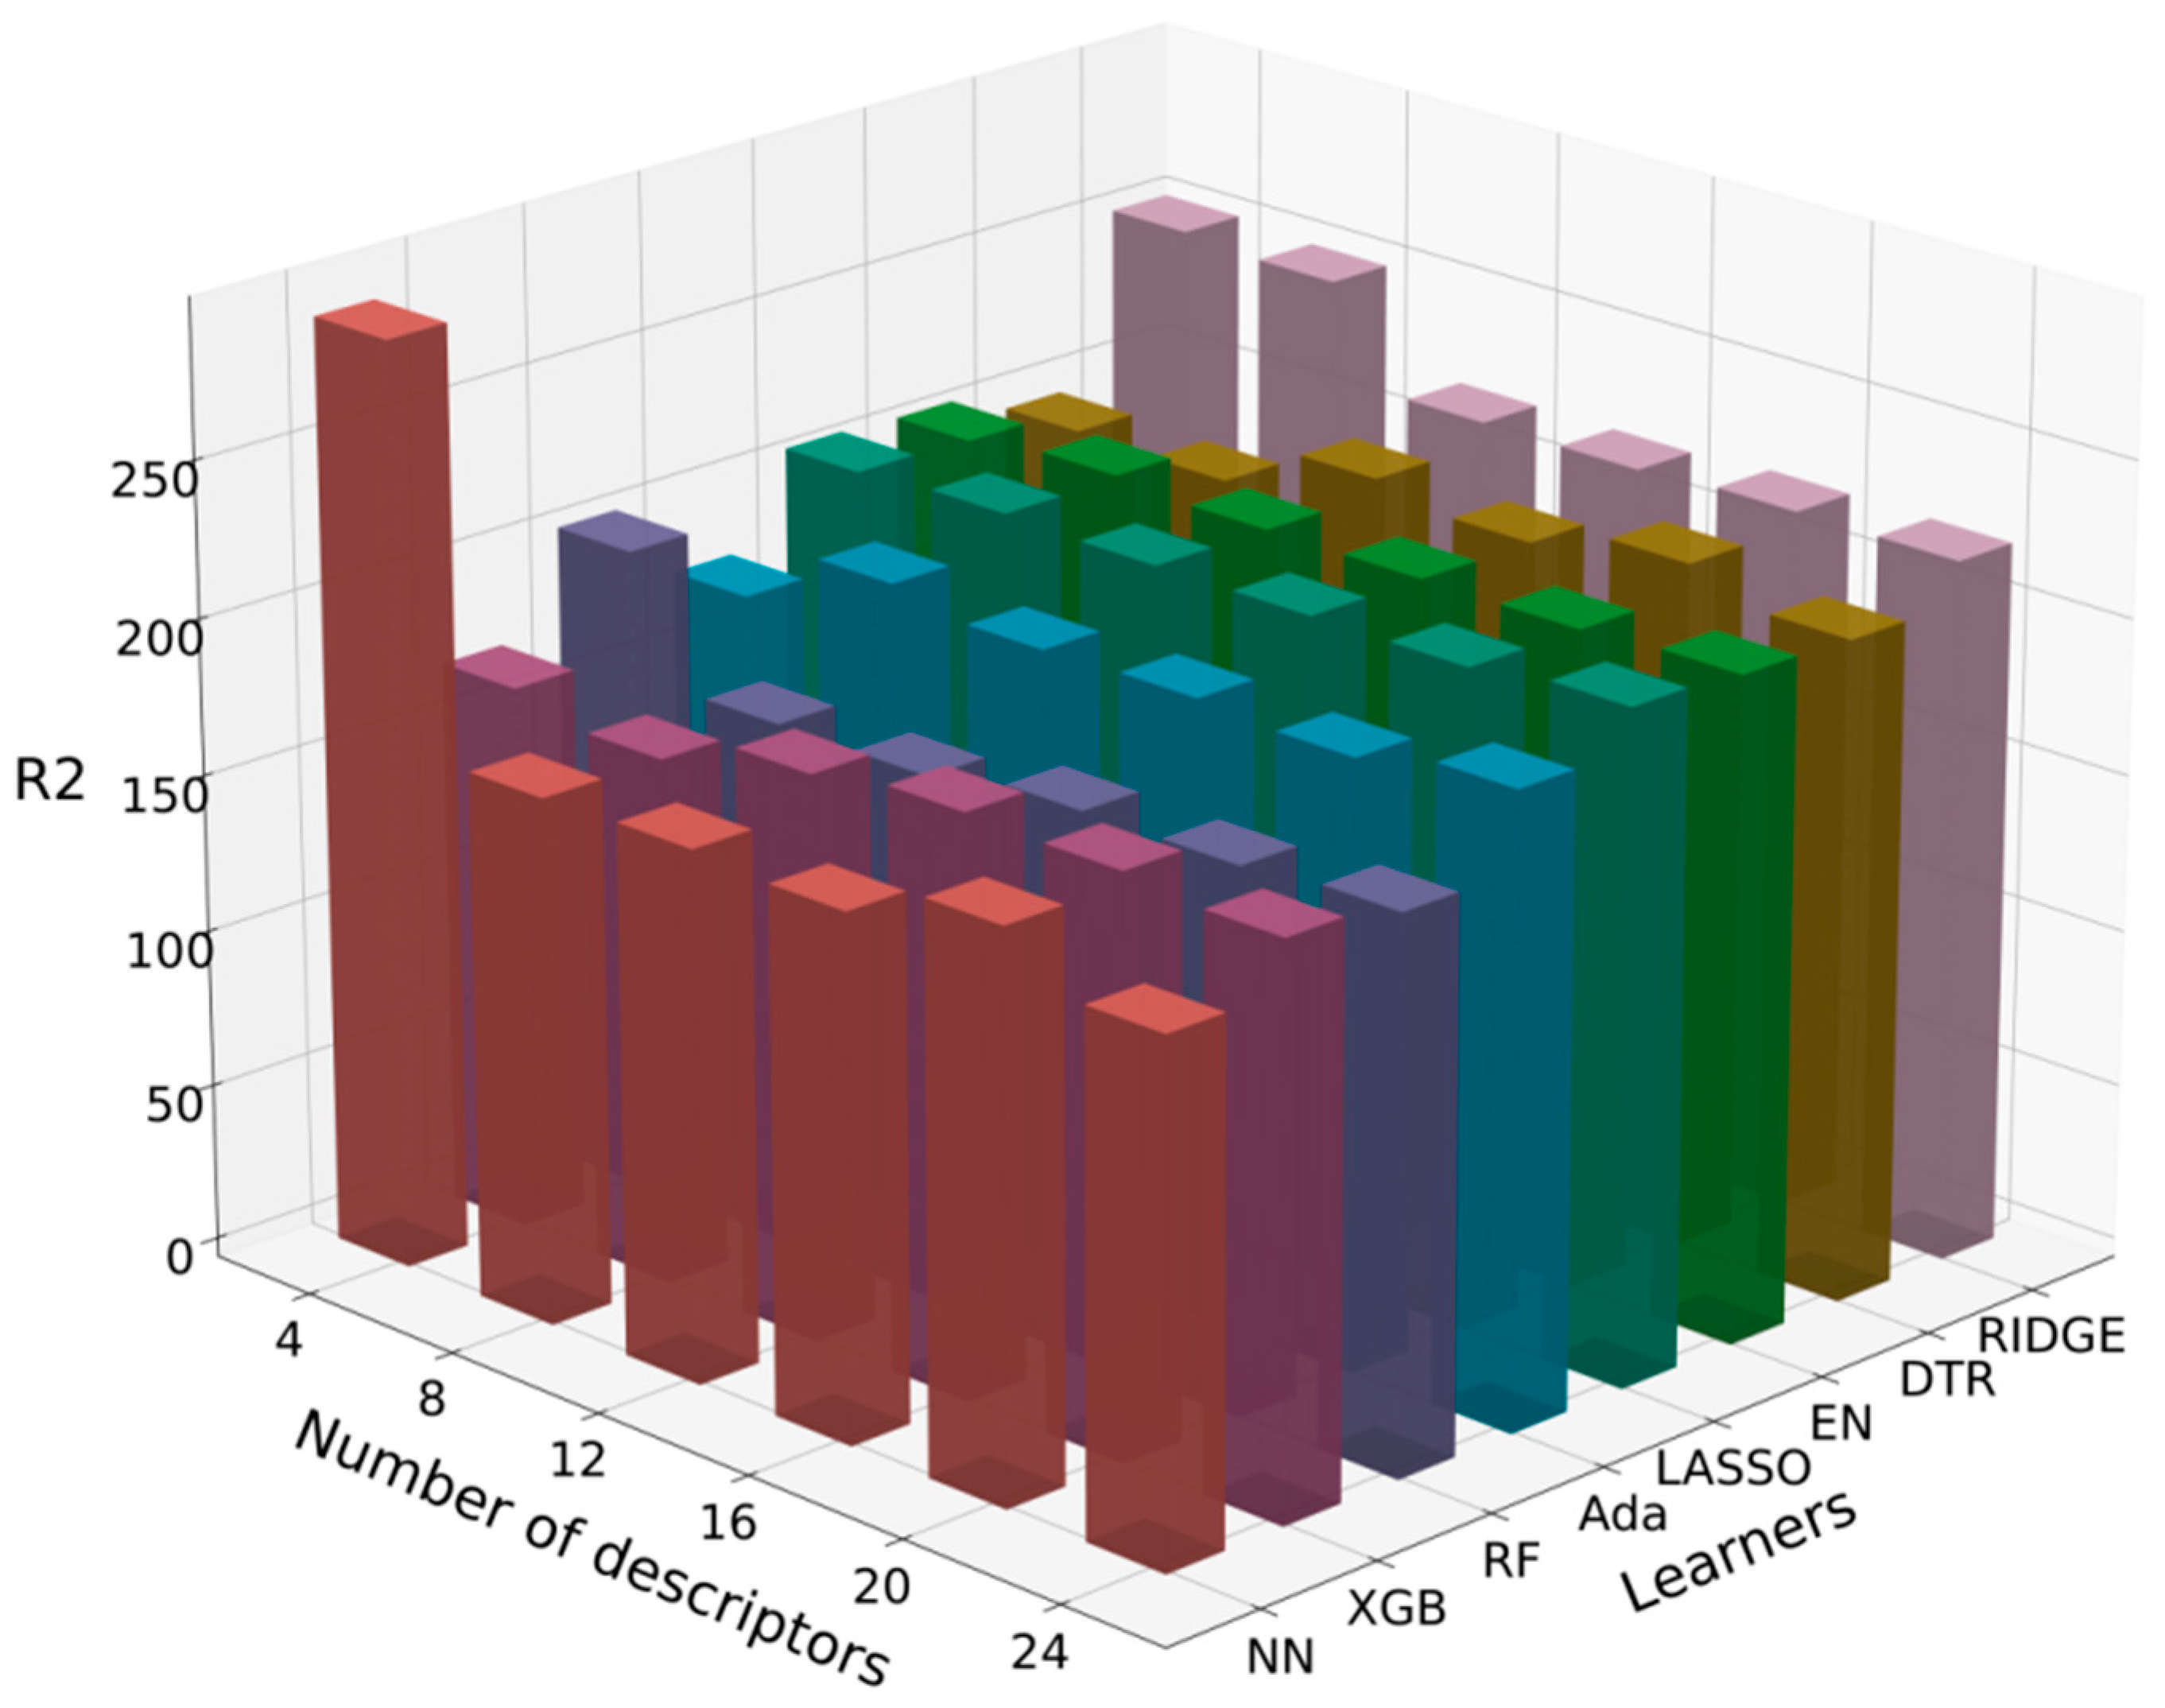
3.2.2. Selected Algorithms
3.2.3. High-Performance Predictive Models
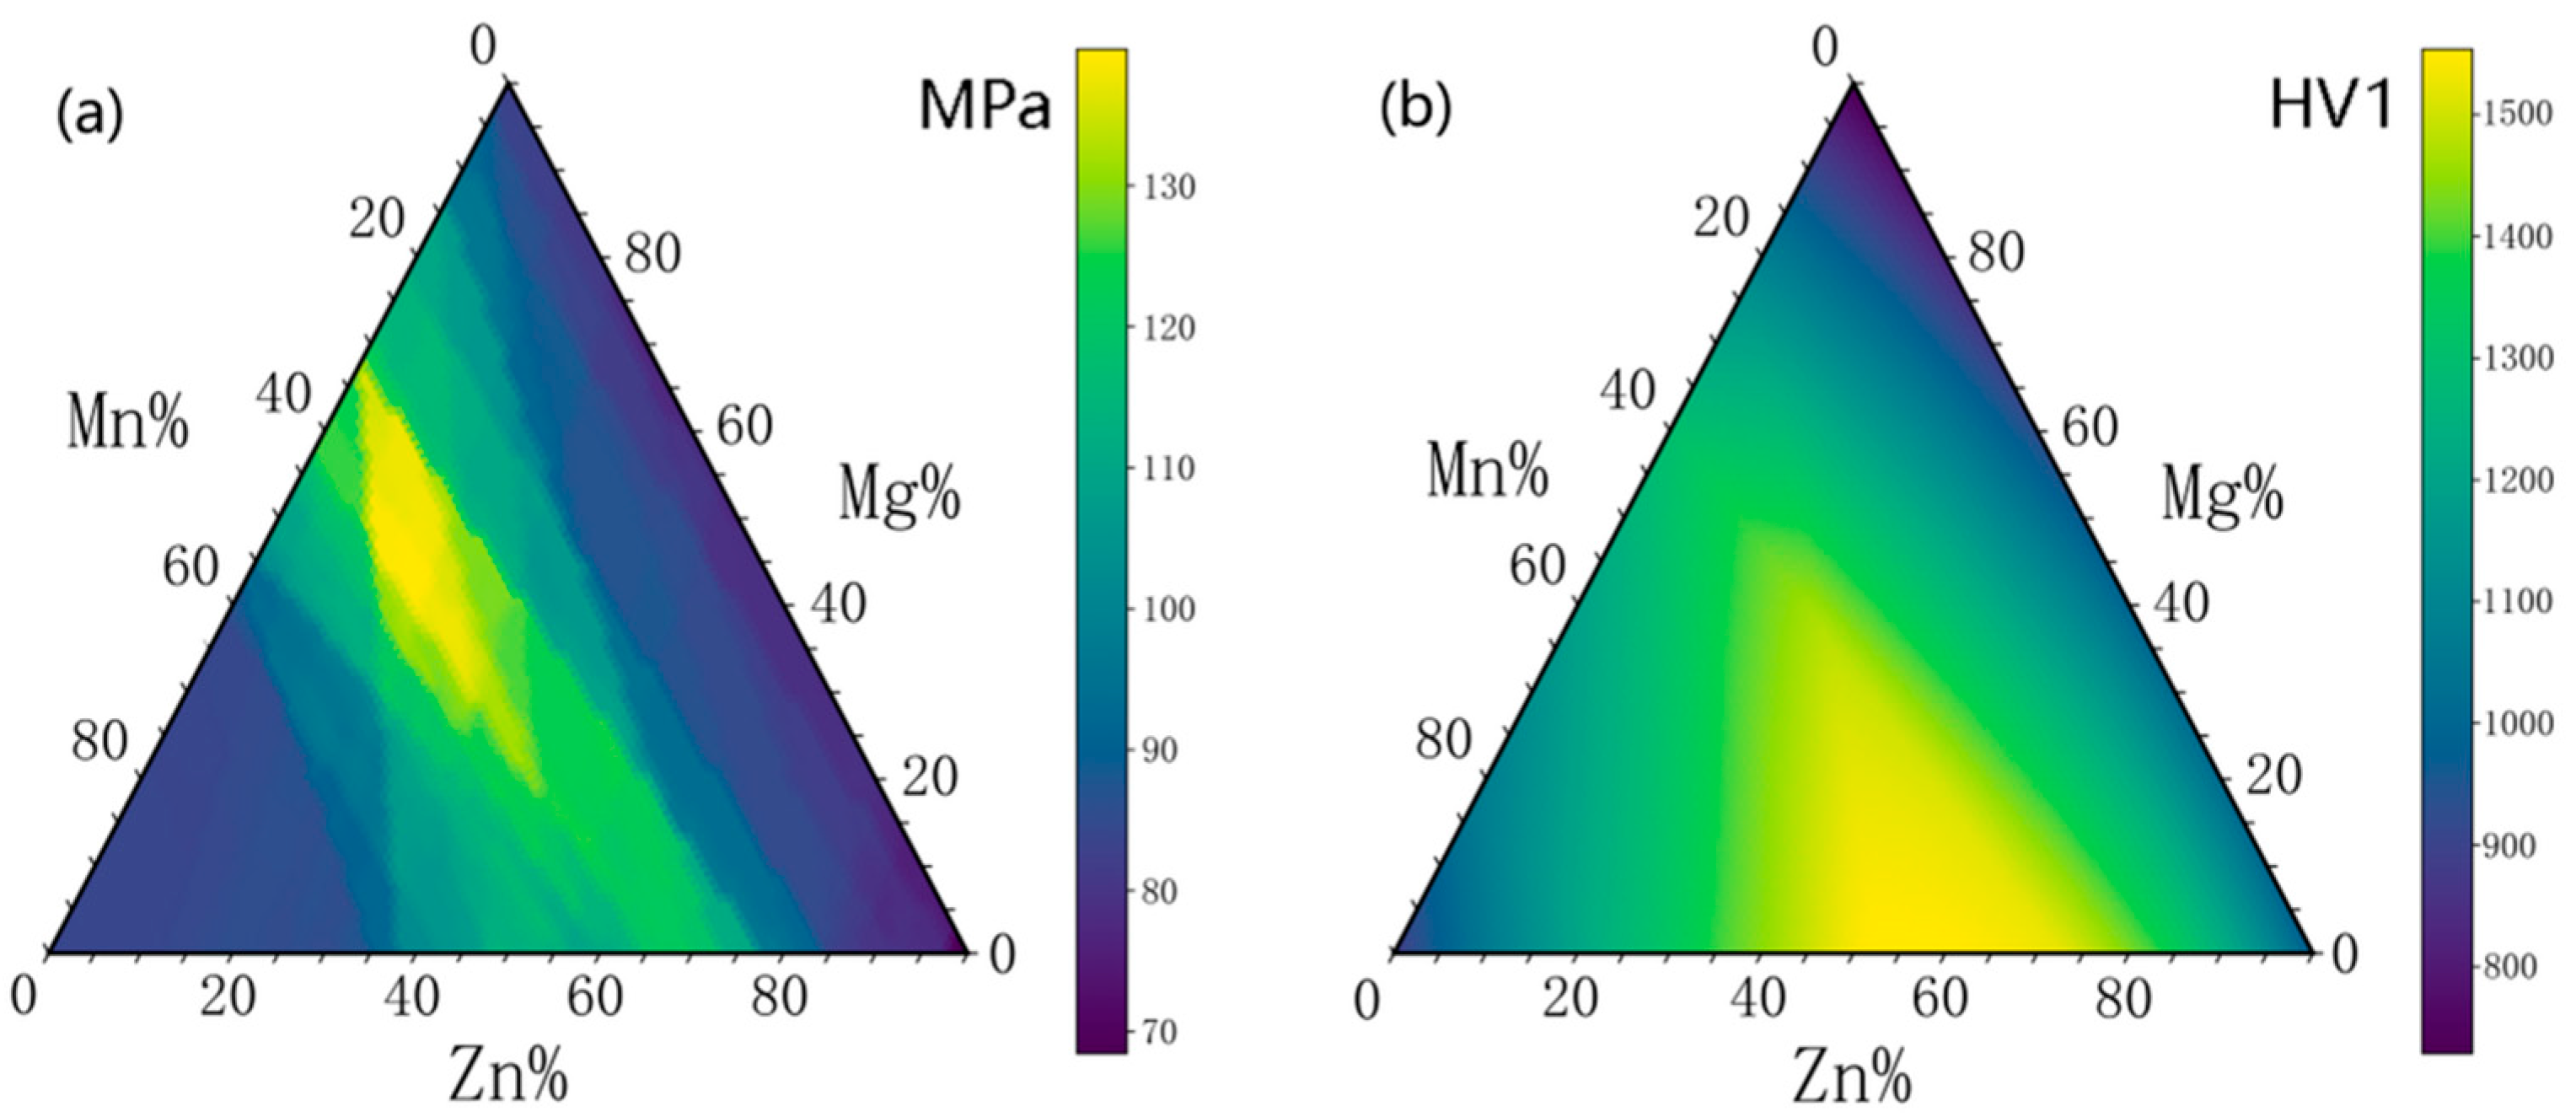
3.3. High-Throughput Prediction of Optimal Mechanical Properties Compositions
3.4. Experimental Verification of Prediction Results
4. Mechanism of Flexural Strength or Hardness Improvement
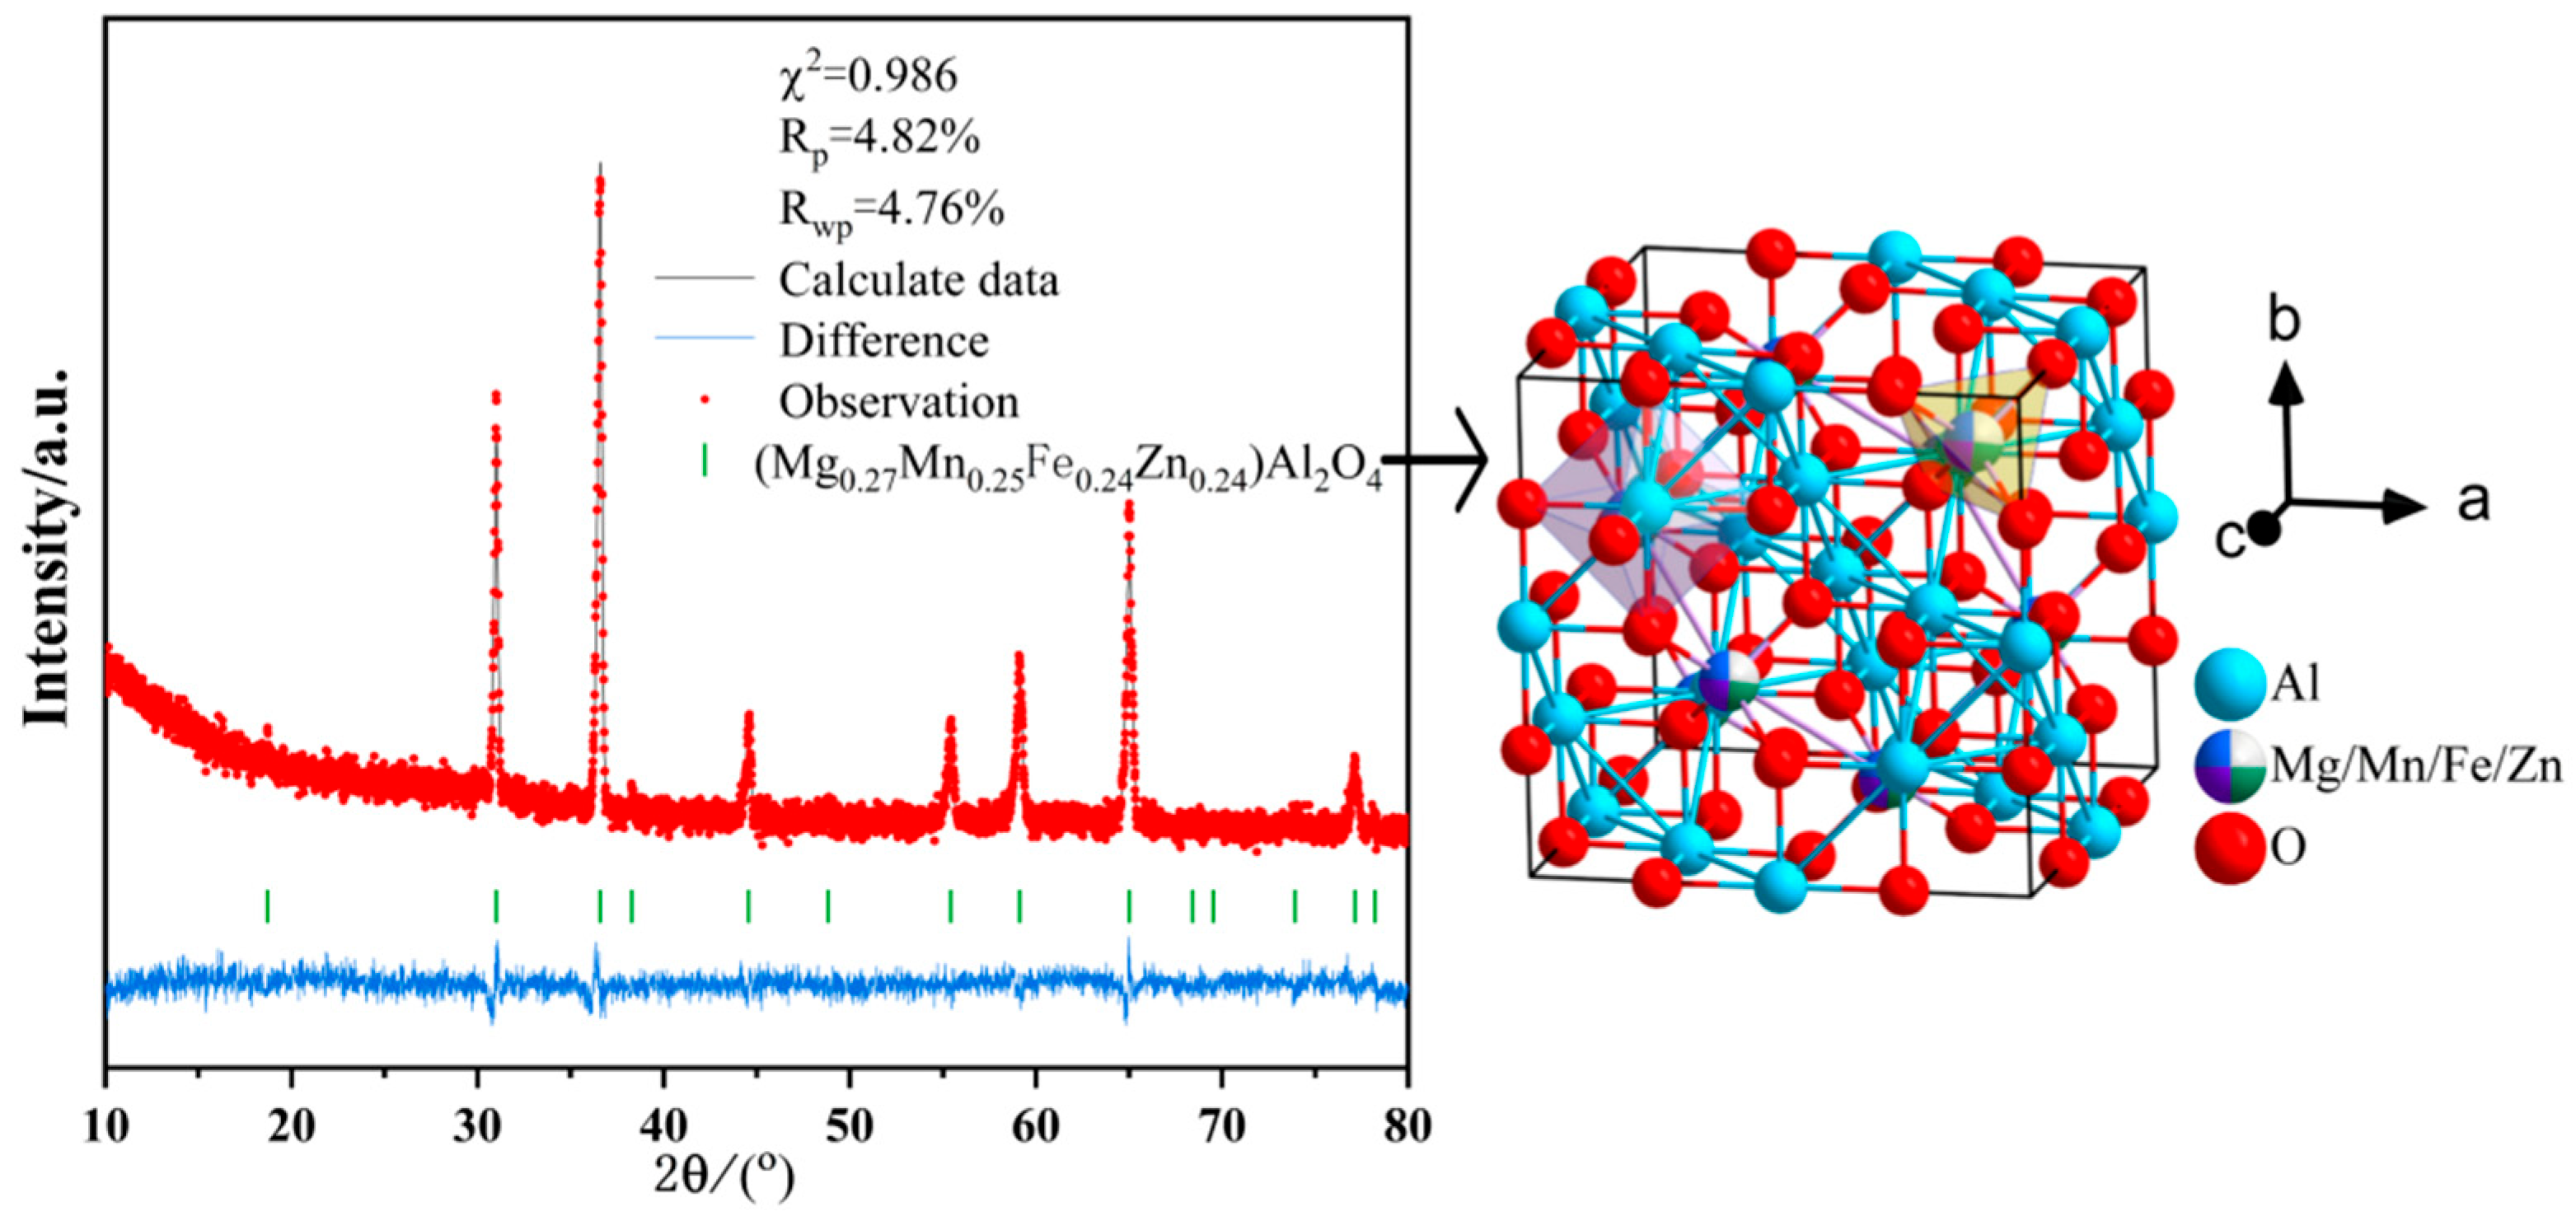
4.1. Mechanism of Hardness Improvement in Samples (Al2Fe0.25Zn0.25Mg0.25Mn0.25)O4
4.1.1. Solid Solution Strengthening Mechanism of Dopant Elements
4.1.2. Energy Dissipation and Crack-Resistance Mechanism of the Spiral-Grown Layered Structure
4.1.3. Strengthening Mechanism Induced by the Complexity of Layered Edge Interfaces
4.1.4. Internal Strengthening of Large Grains and the Uniform Stress Distribution Mechanism of a Dense Structure
4.2. Mechanism of Flexural Strength Improvement in Samples (Al2Cr0.5Zn0.1Mg0.2Mn0.2)O4
4.2.1. Solid Solution Strengthening in Both Phases
4.2.2. Low-Porosity Structure
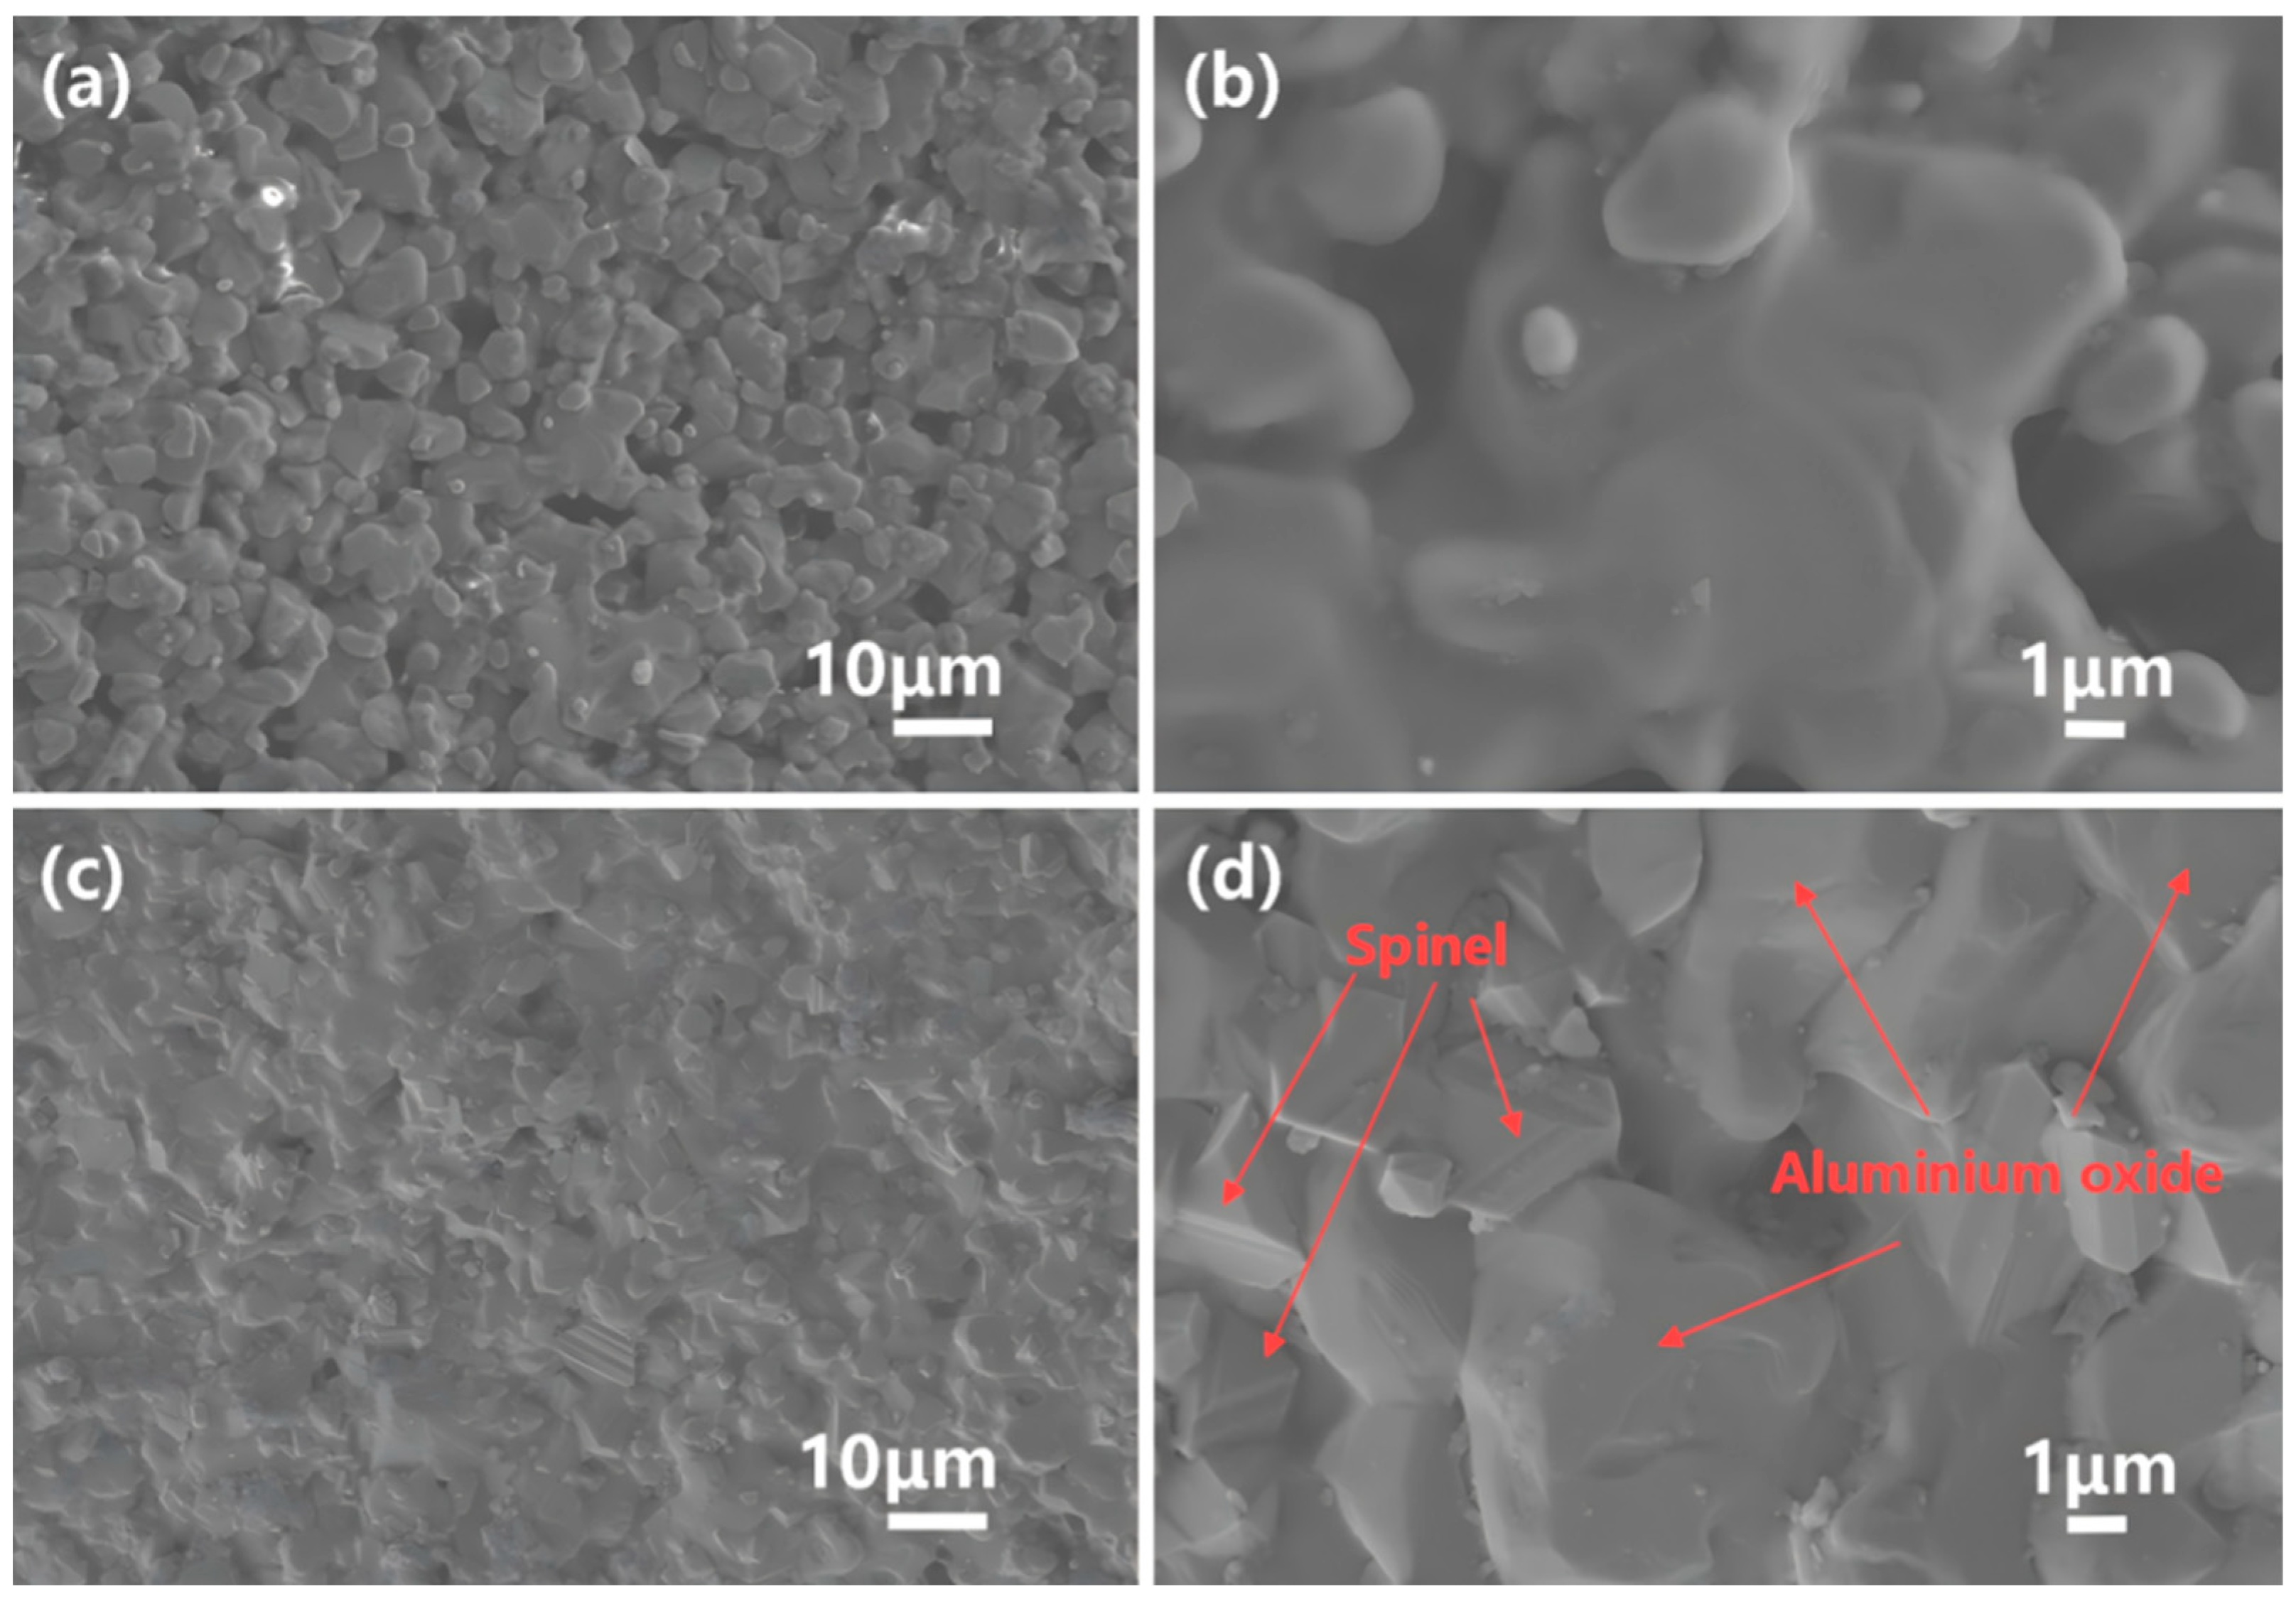
4.2.3. The Dense Distribution of the Internal Spinel Phase and Al-Cr Solid Solution Phase
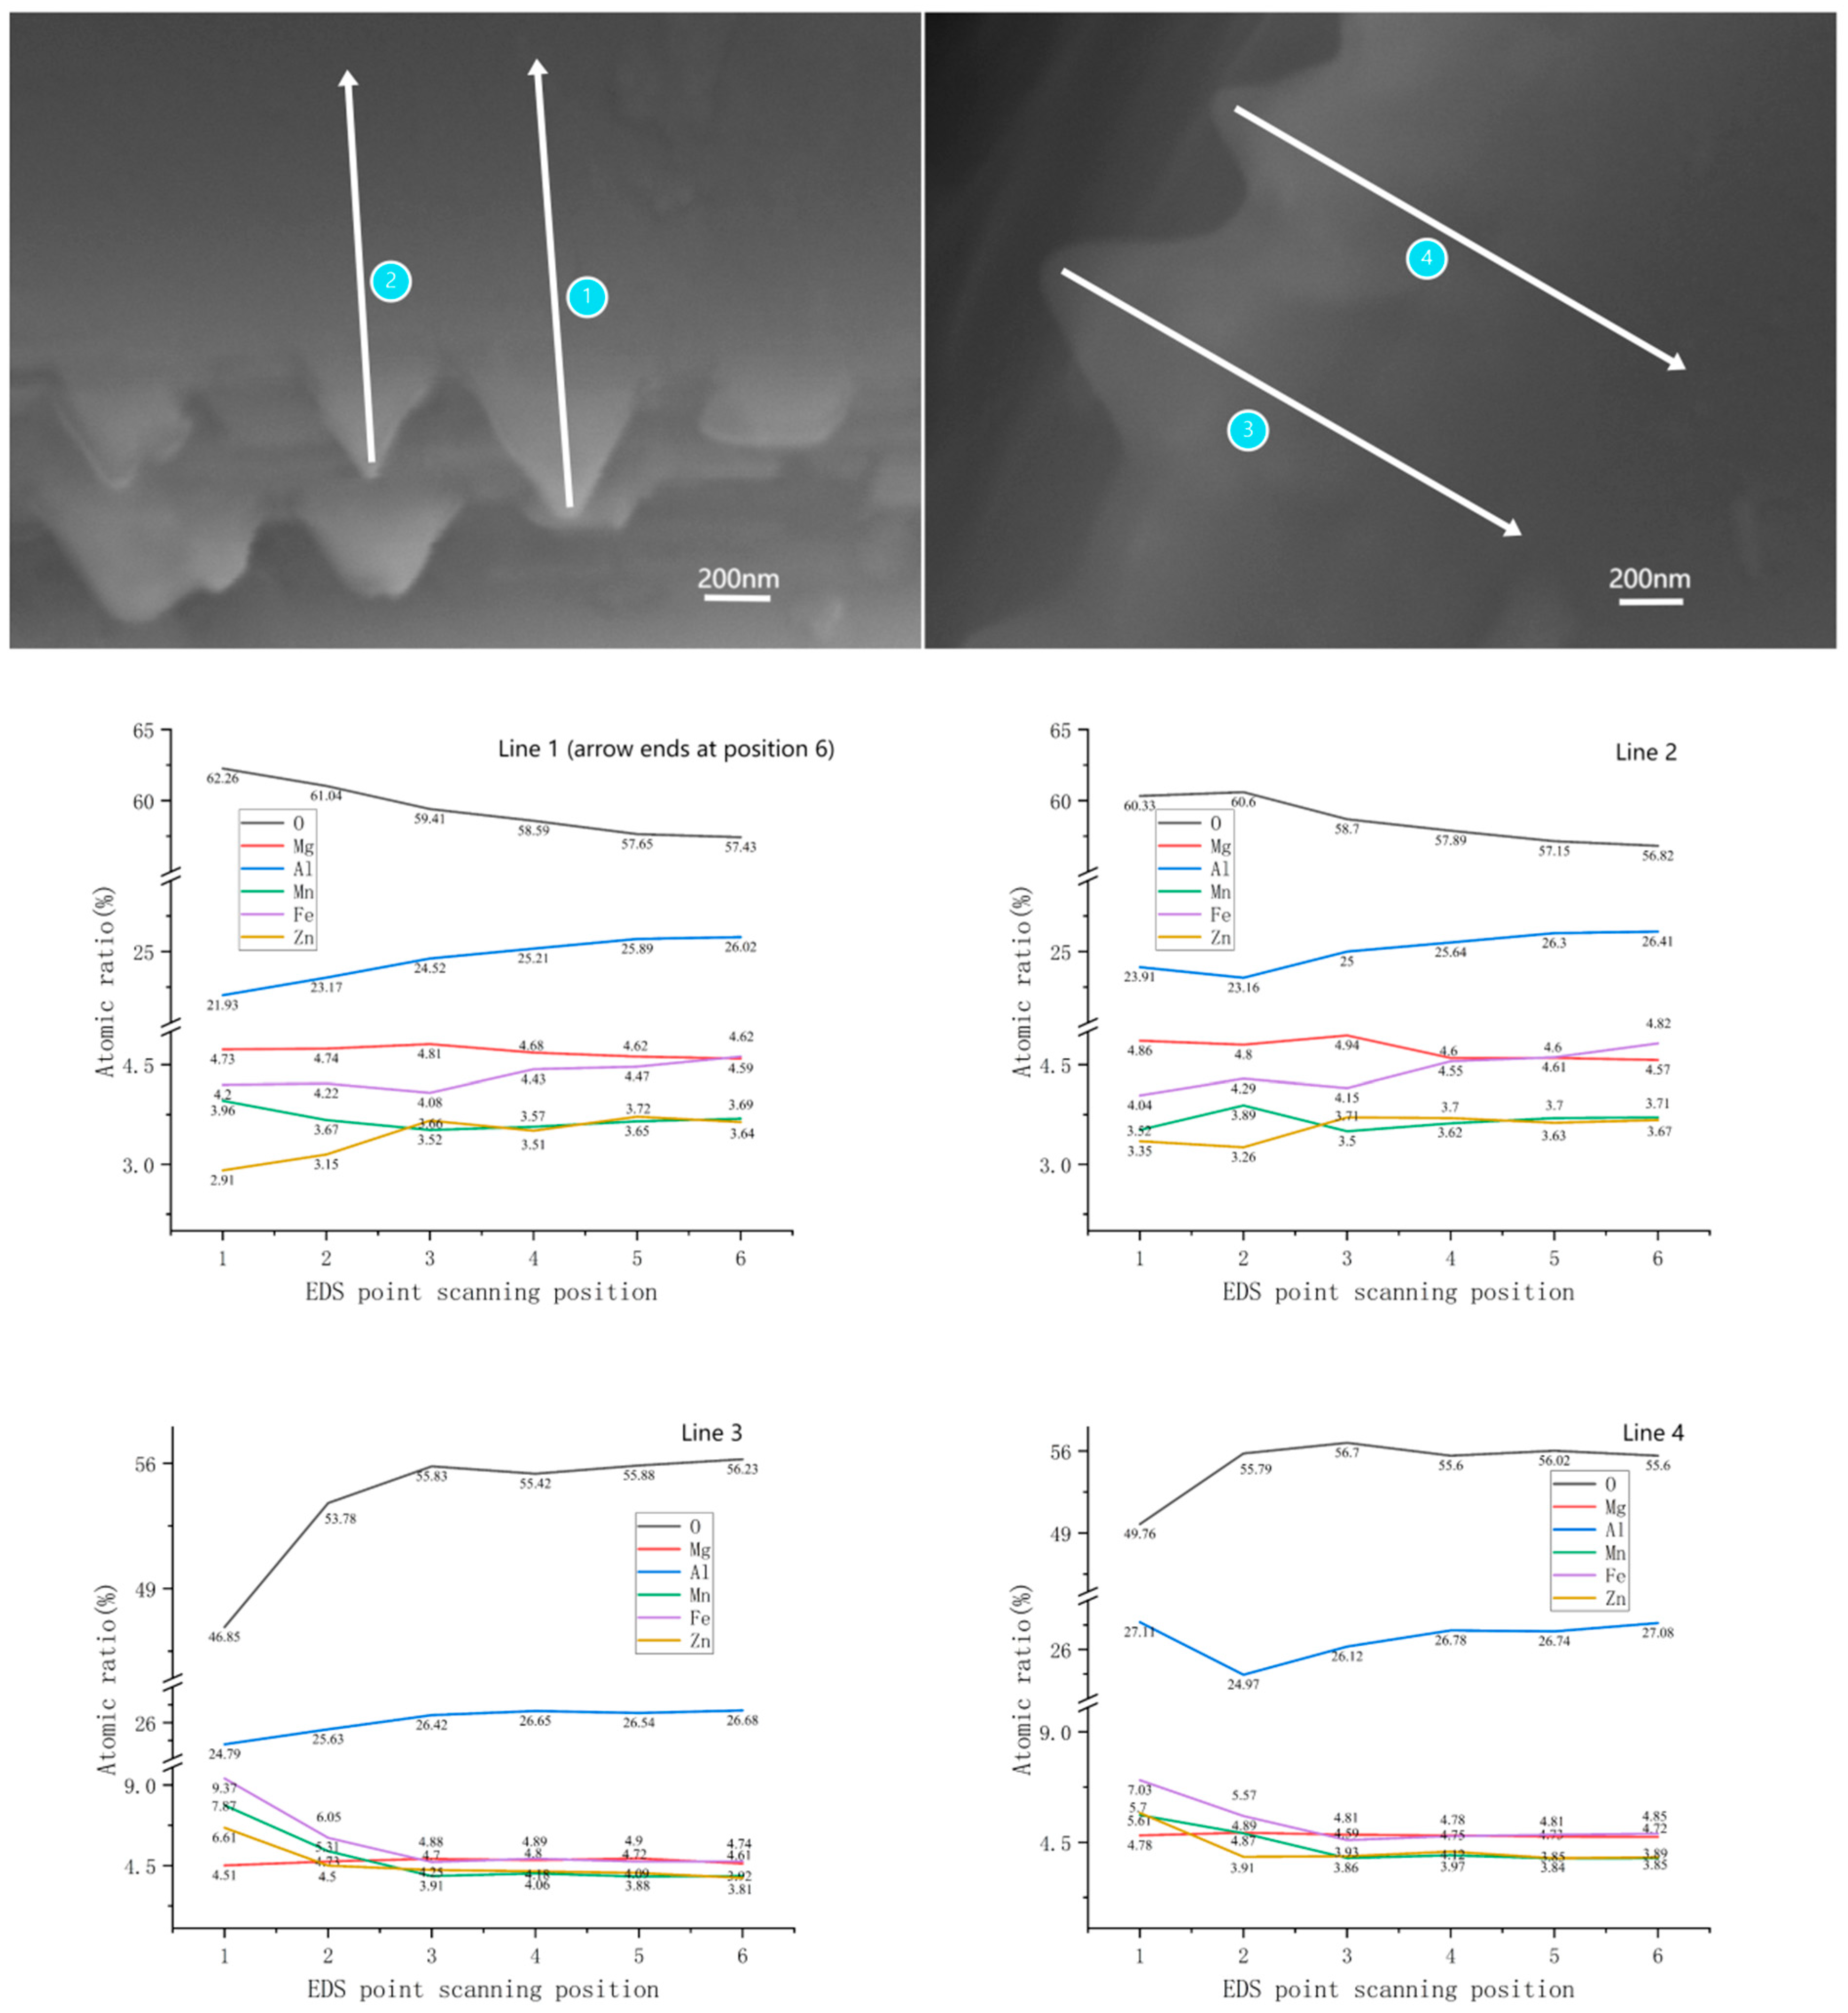
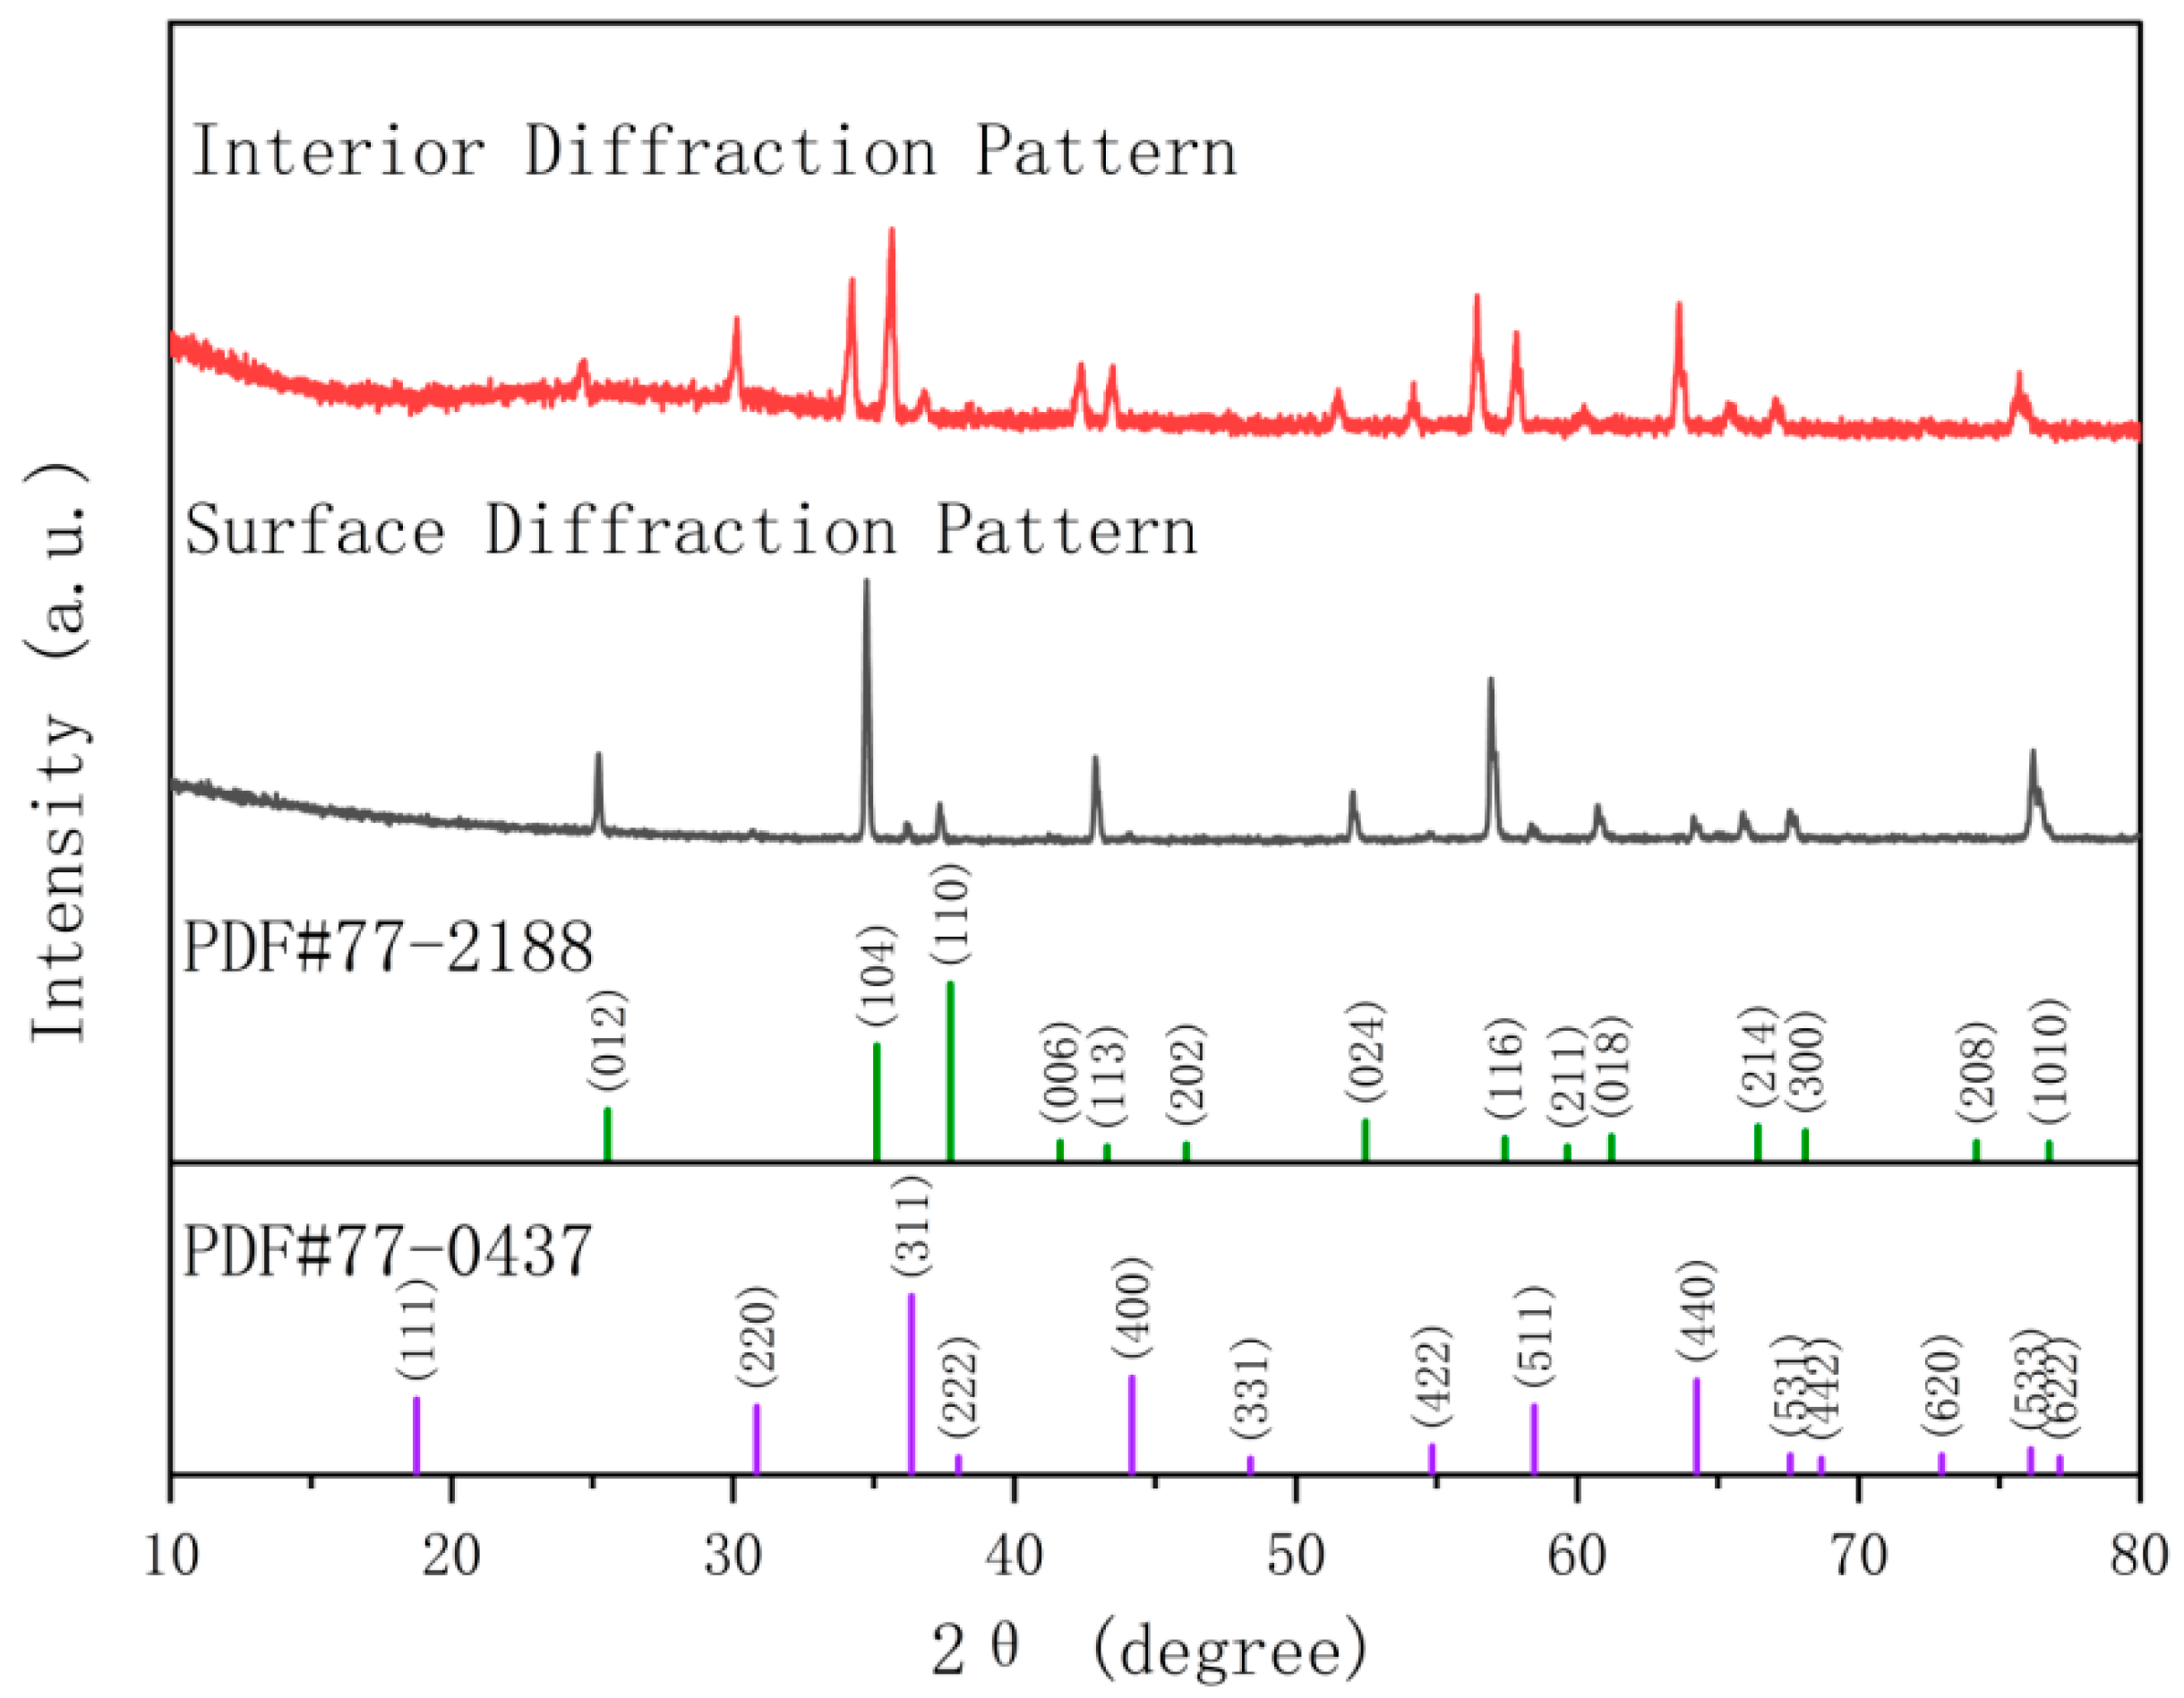
4.2.4. Phase Concentration Gradient from the Surface to the Interior
5. Conclusions
- The successful development of multi-element spinel refractories with significantly enhanced hardness and flexural strength.
- Identification of the key strengthening mechanisms, including solid solution strengthening, second-phase strengthening, and phase concentration gradients.
- The effective use of machine learning algorithms for high-throughput material property prediction, enabling the precise optimization of the refractories’ performance.
- Expanding the dataset for more accurate prediction models: By increasing the volume and diversity of the data used for training machine learning models, we aim to enhance the accuracy and reliability of predictions related to refractory performance. This will ensure the better optimization and customization of material properties for specific applications.
- Customizing refractory materials to meet industry-specific needs: The next step will be to integrate the diverse and evolving demands of the refractory industry into the development process, creating functionalized, tailor-made refractories for specific application scenarios. By focusing on additional performance indicators, such as high-temperature wear resistance and thermal shock resistance, we aim to provide targeted solutions that better address the complex requirements of refractory materials in different industrial sectors.
Author Contributions
Funding
Institutional Review Board Statement
Informed Consent Statement
Data Availability Statement
Acknowledgments
Conflicts of Interest
Abbreviations
| ADA | Adaptive Boosting |
| CCCs | Compositionally complex ceramics |
| DAGAN | Data augmentation generative adversarial network |
| DFT | Density functional theory |
| DTR | Decision Tree Regression |
| EDS | Energy Dispersive Spectroscopy |
| EN | Elastic Net |
| HECs | High-entropy ceramics |
| HEOs | High-entropy oxides |
| HENs | High-entropy nitrides |
| HV1 | Vickers hardness (1 kgf load) |
| ISO | International Organization for Standardization |
| KNN | K-nearest neighbors |
| LASSO | Least Absolute Shrinkage and Selection Operator |
| ML | Machine learning |
| MPCCs | Multi-principal cation ceramics |
| NN | Neural Network |
| RF | Random Forest |
| R2 | Coefficient of Determination |
| Ridge | Ridge Regression |
| RMSE | Root Mean Square Error |
| SEM | Scanning Electron Microscopy |
| SHAP | Shapley Additive Explanations |
| XGB | Extreme Gradient Boosting |
| XRD | X-ray diffraction |
Appendix A


Appendix B

| The Weighted Average of the Properties of Elements | Element Property Weighted Standard Deviation | The Weighted Average of Oxide Properties | Oxide Properties Weighted Standard Deviation | Other Descriptors |
|---|---|---|---|---|
| Relative atomic weight | SD_Relative atomic weight | Oxide molecular weight | SD_Oxides molecular weight | Mixed entropy |
| Density | SD_Density | Melting point of oxides | SD_Melting point of oxides | Firing T |
| Melting point | SD_Melting point | Oxide density | SD_Oxide density | |
| Boiling point | SD_Boiling point | Oxide lattice constant a | SD_Oxide lattice constant a | |
| Covalent radius | SD_Covalent radius | Oxide lattice constant c | SD_Oxide lattice constant c | |
| First ionization energy | SD_First ionization energy | Standard Enthalpy of Formation | SD_Standard Enthalpy of Formation | |
| Electronegativity | SD_Electronegativity | Standard Molar Entropy | SD_Standard Molar Entropy | |
| Number of valence electrons | SD_Number of valence electrons | Standard Gibbs free energy | SD_Standard Gibbs free energy | |
| Lattice constant a | SD_Lattice constant a | Predicted formation energy | SD_Predicted formation energy | |
| Atomic radius | SD_Atomic radius | |||
| Melting enthalpy | SD_Melting enthalpy | |||
| Enthalpy of vaporization | SD_Enthalpy of vaporization | |||
| Specific heat capacity | SD_Specific heat capacity | |||
| Thermal conductivity coefficient | SD_Thermal conductivity coefficient |
| Cell Parameters | a (Å) | b (Å) | c (Å) | Alpha (°) | Volume (Å3) |
|---|---|---|---|---|---|
| (Al2Fe0.25Zn0.25Mg0.25Mn0.25)O4 | 8.08169 | 8.08169 | 8.08169 | 90 | 527.8459 |
| Atomic coordinates and occupancy rates | X | Y | Z | Occupancy | B isotropic |
| O1 | 0.252776 | 0.252776 | 0.252776 | 1 | 0.615073 |
| Al1 | 0.5 | 0.5 | 0.5 | 1 | 0.36478 |
| Fe1 | 0.125 | 0.125 | 0.125 | 0.245584 | 0.355306 |
| Zn1 | 0.125 | 0.125 | 0.125 | 0.240822 | 0.355306 |
| Mg1 | 0.125 | 0.125 | 0.125 | 0.266758 | 0.355306 |
| Mn1 | 0.125 | 0.125 | 0.125 | 0.246837 | 0.355306 |
| Cell Parameters | a (Å) | b (Å) | c (Å) | Alpha (°) | Volume (Å3) |
|---|---|---|---|---|---|
| (Al1.66Cr0.34Zn0.2Mg0.4Mn0.4)O4 | 8.18423 | 8.18423 | 8.18423 | 90/90/90 | 548.193 |
| Al1.44Cr0.56O3 | 4.78885 | 4.78885 | 13.06658 | 90/90/120 | 259.5105 |
| (Al1.66Cr0.34Zn0.2Mg0.4Mn0.4)O4 Atomic coordinates and occupancy rates | X | Y | Z | Occupancy | B isotropic |
| O1 | 0.235234 | 0.235234 | 0.235234 | 1 | 0.5 |
| Al1 | 0 | 0 | 0 | 0.830134 | 0.2 |
| Cr1 | 0 | 0 | 0 | 0.169866 | 0.2 |
| Zn1 | 0.375 | 0.375 | 0.375 | 0.200602 | 0.3 |
| Mg1 | 0.375 | 0.375 | 0.375 | 0.400982 | 0.3 |
| Mn1 | 0.375 | 0.375 | 0.375 | 0.398416 | 0.3 |
| Al1.44Cr0.56O3 Atomic coordinates and occupancy rates | X | Y | Z | Occupancy | B isotropic |
| O1 | 0.317371 | 0 | 0.25 | 1 | 0.13 |
| Al1 | 0 | 0 | 0.148512 | 0.721197 | 0.25 |
| Cr1 | 0 | 0 | 0.148512 | 0.278803 | 0.25 |
| Cell Parameters | a (Å) | b (Å) | c (Å) | Alpha (°) | Volume (Å3) |
|---|---|---|---|---|---|
| (Al1.6Cr0.4Zn0.2Mg0.4Mn0.4)O4 | 8.19618 | 8.19618 | 8.19618 | 90/90/90 | 550.5986 |
| Al1.4Cr0.6O3 | 4.79338 | 4.79338 | 13.07707 | 90/90/120 | 260.2102 |
| (Al1.6Cr0.4Zn0.2Mg0.4Mn0.4)O4 Atomic coordinates and occupancy rates | X | Y | Z | Occupancy | B isotropic |
| O1 | 0.2395 | 0.2395 | 0.2395 | 1 | 0.5 |
| Al1 | 0 | 0 | 0 | 0.830727 | 0.2 |
| Cr1 | 0 | 0 | 0 | 0.169273 | 0.2 |
| Zn1 | 0.375 | 0.375 | 0.375 | 0.215831 | 0.3 |
| Mg1 | 0.375 | 0.375 | 0.375 | 0.443262 | 0.3 |
| Mn1 | 0.375 | 0.375 | 0.375 | 0.340907 | 0.3 |
| Al1.4Cr0.6O3 Atomic coordinates and occupancy rates | X | Y | Z | Occupancy | B isotropic |
| O1 | 0.304534 | 0 | 0.25 | 1 | 0 |
| Al1 | 0 | 0 | 0.147805 | 0.72151 | 0.98 |
| Cr1 | 0 | 0 | 0.147805 | 0.27849 | 0.98 |
References
- Meng, J.X.; Chen, W.Q.; Zhao, J.Z.; Liu, L. Study of the High-temperature Synthesis of MgAl2O4 Spinel Refractory Raw Materials from Chromium Slag. High Temp. Mater. Process. 2016, 37, 581–586. [Google Scholar] [CrossRef]
- Kumar, S.; Sarkar, R. Alumina-spinel castable for steel ladles: An overview. Int. J. Appl. Ceram. Technol. 2023, 20, 410–423. [Google Scholar] [CrossRef]
- Pinto, V.S.; Luz, A.P.; Borges, O.H.; Pandolfelli, V.C. Binder effect on ZnAl2O4-containing high-alumina refractory castables. Ceram. Int. 2022, 48, 11401–11409. [Google Scholar] [CrossRef]
- Lin, X.L.; Yan, W.; Ma, S.B.; Chen, Q.J.; Li, N.; Han, B.Q.; Wei, Y.W. Corrosion and adherence properties of cement clinker on porous periclasespinel refractory aggregates with varying spinel content. Ceram. Int. 2017, 43, 4984–4991. [Google Scholar] [CrossRef]
- Resende, W.S.; Stoll, R.M.; Pallone, E.M.J.A.; Cunha, F.N.; Bradt, R.C. Spinel refractory aggregates from natural raw materials. Miner. Metall. Process. 2001, 18, 68–74. [Google Scholar] [CrossRef]
- Kumar, S.; Sarkar, R. Use of alumina dispersant in alumina-spinel castable: Comparison between in situ and preformed spinels. Int. J. Appl. Ceram. Technol. 2024, 21, 1527–1542. [Google Scholar] [CrossRef]
- Sako, E.Y.; Braulio, M.A.L.; Brant, P.O.; Pandolfelli, V.C. The impact of pre-formed and spinel formation on the physical properties of cement-bonded high alumina refractory castables. Ceram. Int. 2010, 36, 2079–2085. [Google Scholar] [CrossRef]
- Oses, C.; Toher, C.; Curtarolo, S. High-entropy ceramics. Nat. Rev. Mater. 2020, 5, 295–309. [Google Scholar] [CrossRef]
- An, Y.; Wan, K.; Song, M.; Zhao, L. Thermal insulating and mechanical properties of high entropy pyrochlore oxide ceramic with hierarchical porous structures. Ceram. Int. 2024, 50, 4699–4707. [Google Scholar] [CrossRef]
- Lan, Q.; Ma, J.; Li, S.; Chen, K.; Li, C.; An, L. Design and preparation of high-entropy fluorite oxides based on R‾-S diagram. Ceram. Int. 2023, 49, 21091–21095. [Google Scholar] [CrossRef]
- Ye, S.; Zhu, J.; Zhu, S.; Zhao, Y.; Li, M.; Huang, Z.; Wang, H.; He, J. Design strategies for perovskite-type high-entropy oxides with applications in optics. ACS Appl. Mater. Interfaces 2023, 15, 47475–47486. [Google Scholar] [CrossRef] [PubMed]
- Liu, X.; Lu, Y.; Xu, Q.; Yang, L.; Shen, H.; Sun, W.; Zhang, X.; Wang, Y. Synthesis of (HfZrTiNbTa) N powders via nitride thermal reduction with soft mechano-chemical assistance. J. Adv. Ceram. 2023, 12, 565–577. [Google Scholar] [CrossRef]
- Zhao, L.; Sun, X.; Zeng, X.; Li, Y.; Fang, W.; Du, X.; He, X.; Wang, D.; Li, W.; Chen, H. Synthesis of a new class of high-entropy nitride ceramics and the effects of nitrogen vacancies on their magnetic properties. Appl. Surf. Sci. 2023, 618, 156543. [Google Scholar] [CrossRef]
- Tan, Y.; Liao, W.; Teng, Z.; Zhang, H. Synthesis, mechanical, and thermophysical properties of high-entropy (Zr, Ti, Nb, Ta, Hf) C0. 8 ceramic. J. Am. Ceram. Soc. 2023, 106, 4382–4389. [Google Scholar] [CrossRef]
- Li, J.; Zhang, Q.; Chen, S.; Fan, H.; Song, J.; Su, Y.; Hu, L.; Zhou, Y.; Zhang, Y. Carbon-deficient high-entropy (Zr0.17Nb0.2Ta0.2Mo0.2W0.2)C0.89: A potential high temperature and vacuum wear-resistant material. Mater. Des. 2023, 226, 111680. [Google Scholar] [CrossRef]
- Smith II, S.M.; Fahrenholtz, W.G.; Hilmas, G.E. Pressureless sintering of high-entropy boride ceramics. J. Eur. Ceram. Soc. 2023, 43, 5168–5173. [Google Scholar] [CrossRef]
- Liu, B.; Yang, W.; Xiao, G.; Zhu, Q.; Song, S.; Cao, G.-H.; Ren, Z. High-entropy silicide superconductors with W5Si3-type structure. Phys. Rev. Mater. 2023, 7, 014805. [Google Scholar] [CrossRef]
- Chen, J.; Mei, B.; Li, W.; Zhang, Y. Fabrication and spectral performance of Ndx:(La0.05Lu0.05Gd0.05Y0.05)Ca0.8−xF2.2+x High-entropy transparent fluoride ceramics. Ceram. Int. 2024, 50, 6128–6134. [Google Scholar] [CrossRef]
- Rost, C.M.; Rak, Z.; Brenner, D.W.; Maria, J.P. Local structure of the MgxNixCoxCuxZnxO (x= 0.2) entropy-stabilized oxide: An EXAFS study. J. Am. Ceram. Soc. 2017, 100, 2732–2738. [Google Scholar] [CrossRef]
- Johnstone, G.H.; González-Rivas, M.U.; Taddei, K.M.; Sutarto, R.; Sawatzky, G.A.; Green, R.J.; Oudah, M.; Hallas, A.M. Entropy engineering and tunable magnetic order in the spinel high-entropy oxide. J. Am. Chem. Soc. 2022, 144, 20590–20600. [Google Scholar] [CrossRef]
- Wang, Z.; Liu, C.; Dou, P. Thermodynamics of vacancies and clusters in high-entropy alloys. Phys. Rev. Mater. 2017, 1, 043601. [Google Scholar] [CrossRef]
- Aamlid, S.S.; Oudah, M.; Rottler, J.r.; Hallas, A.M. Understanding the role of entropy in high entropy oxides. J. Am. Chem. Soc. 2023, 145, 5991–6006. [Google Scholar] [CrossRef]
- Wright, A.J.; Wang, Q.Y.; Huang, C.Y.; Nieto, A.; Chen, R.K.; Luo, J. From high-entropy ceramics to compositionally-complex ceramics: A case study of fluorite oxides. J. Eur. Ceram. Soc. 2020, 40, 2120–2129. [Google Scholar] [CrossRef]
- Yang, Q.Q.; Wang, X.G.; Bao, W.C.; Wu, P.; Wang, X.F.; Guo, X.J.; Zhang, C.; Zhang, G.J.; Jiang, D.Y. Influence of equiatomic Zr/(Ti,Nb) substitution on microstructure and ultra-high strength of (Ti,Zr,Nb)C medium-entropy ceramics at 1900 °C. J. Adv. Ceram. 2022, 11, 1457–1465. [Google Scholar] [CrossRef]
- Wei, M.Y.; Xu, J.; Zhu, J.T.; Yang, R.W.; Meng, X.Y.; Zhang, P.; Yang, J.L.; Gao, F. Influence of size disorder parameter on the thermophysical properties of rare-earth-zirconate medium-entropy ceramics. J. Am. Ceram. Soc. 2023, 106, 2037–2048. [Google Scholar] [CrossRef]
- Borges, O.H.; Coury, F.G.; Muche, D.N.F.; Pandolfelli, V.C. Eco-friendly design of complex refractory aggregates as alternatives to the magnesia-chromite ones. J. Eur. Ceram. Soc. 2023, 43, 6536–6549. [Google Scholar] [CrossRef]
- Jastrzebska, I.; Przystas, J.; Pajak, O.; Van Ende, M.A.; Jung, I.H.; Mandal, S. ZnO and Fe2O3 doped Al2O3-rich MgAl2O4 as Cr-free refractory matrix for copper industry: Sintering, phase evolution and slag corrosion. J. Eur. Ceram. Soc. 2025, 45, 117070. [Google Scholar] [CrossRef]
- Zhao, X.; Yu, S.; Zheng, J.; Reece, M.J.; Zhang, R.-Z. Machine learning of carbon vacancy formation energy in high-entropy carbides. J. Eur. Ceram. Soc. 2023, 43, 1315–1321. [Google Scholar] [CrossRef]
- Zhou, Q.; Xu, F.; Gao, C.Z.; Zhao, W.X.; Shu, L.; Shi, X.Q.; Yuen, M.F.; Zuo, D.W. Design of high-performance high-entropy nitride ceramics via machine learning-driven strategy. Ceram. Int. 2023, 49, 25964–25979. [Google Scholar] [CrossRef]
- Meng, H.; Yu, R.; Tang, Z.; Wen, Z.; Yu, H.; Chu, Y. Formation ability descriptors for high-entropy diborides established through high-throughput experiments and machine learning. Acta Mater. 2023, 256, 119132. [Google Scholar] [CrossRef]
- Zhou, Q.; Xu, F.; Gao, C.; Zhang, D.; Shi, X.; Yuen, M.-F.; Zuo, D. Machine learning-assisted mechanical property prediction and descriptor-property correlation analysis of high-entropy ceramics. Ceram. Int. 2023, 49, 5760–5769. [Google Scholar] [CrossRef]
- Zhang, J.; Xu, B.; Xiong, Y.; Ma, S.; Wang, Z.; Wu, Z.; Zhao, S. Design high-entropy carbide ceramics from machine learning. NPJ Comput. Mater. 2022, 8, 5. [Google Scholar] [CrossRef]
- Mastropietro, D.G.; Moya, J.A. Design of Fe-based bulk metallic glasses for maximum amorphous diameter (Dmax) using machine learning models. Comput. Mater. Sci. 2021, 188, 110230. [Google Scholar] [CrossRef]
- Li, X.; Shan, G.; Shek, C. Machine learning prediction of magnetic properties of Fe-based metallic glasses considering glass forming ability. J. Mater. Sci. Technol. 2022, 103, 113–120. [Google Scholar] [CrossRef]
- Yan, Y.; Pei, Z.; Gao, M.C.; Misture, S.; Wang, K. Data-driven discovery of a formation prediction rule on high-entropy ceramics. Acta Mater. 2023, 253, 118955. [Google Scholar] [CrossRef]
- ISO 14704:2016(E); Fine Ceramics (Advanced Ceramics, Advanced Technical Ceramics)—Test Method for Flexural Strength of Monolithic Ceramics at Room Temperature. International Organization for Standardization (ISO): Geneva, Switzerland, 2016.
- ISO 6507-1; Metallic Materials—Vickers Hardness Test—Part 1: Test Method. International Organization for Standardization (ISO): Geneva, Switzerland, 2023.
- ISO 5017:2013; Dense Shaped Refractory Products—Determination of Bulk Density, Apparent Porosity and True Porosity. International Organization for Standardization (ISO): Geneva, Switzerland, 2013.
- McCormack, S.J.; Navrotsky, A. Thermodynamics of high entropy oxides. Acta Mater. 2021, 202, 1–21. [Google Scholar] [CrossRef]
- Miracle, D.B.; Miller, J.D.; Senkov, O.N.; Woodward, C.; Uchic, M.D.; Tiley, J. Exploration and Development of High Entropy Alloys for Structural Applications. Entropy 2014, 16, 494–525. [Google Scholar] [CrossRef]
- Tang, M.; Zhang, D.; Wang, D.; Deng, J.; Kong, D.; Zhang, H. Performance prediction of 2D vertically stacked MoS2-WS2 heterostructures base on first-principles theory and Pearson correlation coefficient. Appl. Surf. Sci. 2022, 596, 153498. [Google Scholar] [CrossRef]
- Yang, C.; Ren, C.; Jia, Y.; Wang, G.; Li, M.; Lu, W. A machine learning-based alloy design system to facilitate the rational design of high entropy alloys with enhanced hardness. Acta Mater. 2022, 222, 117431. [Google Scholar] [CrossRef]
- Lipovetsky, S.; Conklin, M. Analysis of regression in game theory approach. Appl. Stoch. Models Bus. Ind. 2001, 17, 319–330. [Google Scholar] [CrossRef]
- Zheng, X.; Xie, Y.; Yang, X.; Amin, M.N.; Nazar, S.; Khan, S.A.; Althoey, F.; Deifalla, A.F. A data-driven approach to predict the compressive strength of alkali-activated materials and correlation of influencing parameters using SHapley Additive exPlanations (SHAP) analysis. J. Mater. Res. Technol. 2023, 25, 4074–4093. [Google Scholar] [CrossRef]
- Heiba, Z.K.; Mohamed, M.B.; El-naggar, A.M.; Ahmed, M.A. Improved photocatalytic performance of nano (Mg1−xZnx)[Fe2−2x Mn2x]O4 solid solution. J. Mater. Res. Technol. JMRT 2021, 11, 1480–1489. [Google Scholar] [CrossRef]
- Wang, D.; Yang, Q.L.; Yang, G.P.; Xiong, S.C.; Li, X.S.; Peng, Y.; Li, J.H.; Crittenden, J. Rational tuning towards A/B-sites double-occupying cobalt on tri-metallic spinel: Insights into its catalytic activity on toluene catalytic oxidation. Chem. Eng. J. 2020, 399, 125792. [Google Scholar] [CrossRef]
- Zhang, Z.X.; Wang, W.L.; Li, Y.X.; Zhang, J.T.; Zhang, Z.Y.; Zhang, Q.; Liu, H.; Han, G.F.; Zhang, W.B. Preparation, mechanical properties, and corrosion resistance behavior of (Zr, Mo, Cr)-doped Ti3AlC2 ceramics. Ceram. Int. 2024, 50, 20694–20705. [Google Scholar] [CrossRef]
- Shirsath, S.E.; Liu, X.X.; Yasukawa, Y.; Li, S.; Morisako, A. Switching of magnetic easy-axis using crystal orientation for large perpendicular coercivity in CoFe2O4 thin film. Sci. Rep. 2016, 6, 30074. [Google Scholar] [CrossRef]
- Cheng, R.Q.; Yin, L.; Wen, Y.; Zhai, B.X.; Guo, Y.Z.; Zhang, Z.F.; Liao, W.T.; Xiong, W.Q.; Wang, H.; Yuan, S.J.; et al. Ultrathin ferrite nanosheets for room-temperature two-dimensional magnetic semiconductors. Nat. Commun. 2022, 13, 5241. [Google Scholar] [CrossRef]
- Cunha, D.M.; Gauquelin, N.; Xia, R.; Verbeeck, J.; Huijben, M. Self-Assembled Epitaxial Cathode-Electrolyte Nanocomposites for 3D Microbatteries. ACS Appl. Mater. Interfaces 2022, 14, 42208–42214. [Google Scholar] [CrossRef]
- Gao, L.N.; Li, S.F.; Han, T.; Liu, L.; Pan, D.; Zhang, X.; Zhang, Y.K.; Zhang, Y.M.; He, Y.Y.; Chen, W.G.; et al. Microstructure, properties and fracture mechanism of MAX phase Ti3AlC2 ceramics with Si doping via Ti-Al-C system by powder metallurgy. J. Mater. Res. Technol. 2021, 15, 3663–3672. [Google Scholar] [CrossRef]
- Du, X.W.; Zhang, Z.X.; Wang, W.M.; Wang, H.; Fu, Z.Y. Microstructure and properties of B4C-SiC composites prepared by polycarbosilane-coating/B4C powder route. J. Eur. Ceram. Soc. 2014, 34, 1123–1129. [Google Scholar] [CrossRef]
- Neuman, E.W.; Hilmas, G.E.; Fahrenholtz, W.G. Processing, microstructure, and mechanical properties of large-grained zirconium diboride ceramics. Mater. Sci. Eng. A-Struct. Mater. Prop. Microstruct. Process. 2016, 670, 196–204. [Google Scholar] [CrossRef]
- Salem, M.N.; Ding, K.; Rödel, J.; Fang, X.F. Thermally enhanced dislocation density improves both hardness and fracture toughness in single-crystal SrTiO3. J. Am. Ceram. Soc. 2023, 106, 1344–1355. [Google Scholar] [CrossRef]
- Xu, H.Y.; Ji, W.; Guo, W.M.; Li, Y.L.; Zou, J.; Wang, W.M.; Fu, Z.Y. Enhanced Mechanical Properties and Oxidation Resistance of Zirconium Diboride Ceramics via Grain-Refining and Dislocation Regulation. Adv. Sci. 2022, 9, 2104532. [Google Scholar] [CrossRef]
- Ito, Y.; Edalati, K.; Horita, Z. High-pressure torsion of aluminum with ultrahigh purity (99.9999%) and occurrence of inverse Hall-Petch relationship. Mater. Sci. Eng. A-Struct. Mater. Prop. Microstruct. Process. 2017, 679, 428–434. [Google Scholar] [CrossRef]
- Zaiemyekeh, Z.; Sayahlatifi, S.; Romanyk, D.L.; Hogan, J.D. Understanding the effect of microstructure on the failure behavior of additively manufactured Al2O3 ceramics: 3D micromechanical modeling. Mater. Des. 2024, 244, 113167. [Google Scholar] [CrossRef]
- Du, P.P.; Huo, D.; Xi, H.Q.; Kang, Y.; Sun, X.D.; Xiao, D.Y. Fabrication of nanocrystalline Sc2O3-Y2O3 solid solution ceramics by spark plasma sintering. Ceram. Int. 2017, 43, 9854–9859. [Google Scholar] [CrossRef]
- Zhang, Y.L.; Shao, D.Y.; Feng, G.H.; Fu, Y.Q.; Li, J. Ablation-resistant Ta0.78Hf0.22C solid solution ceramic modified C/C composites for oxidizing environments over 2200 °C. J. Eur. Ceram. Soc. 2021, 41, 6181–6188. [Google Scholar] [CrossRef]
- Rice, R.W. Pores as Fracture Origins in Ceramics. J. Mater. Sci. 1984, 19, 895–914. [Google Scholar] [CrossRef]

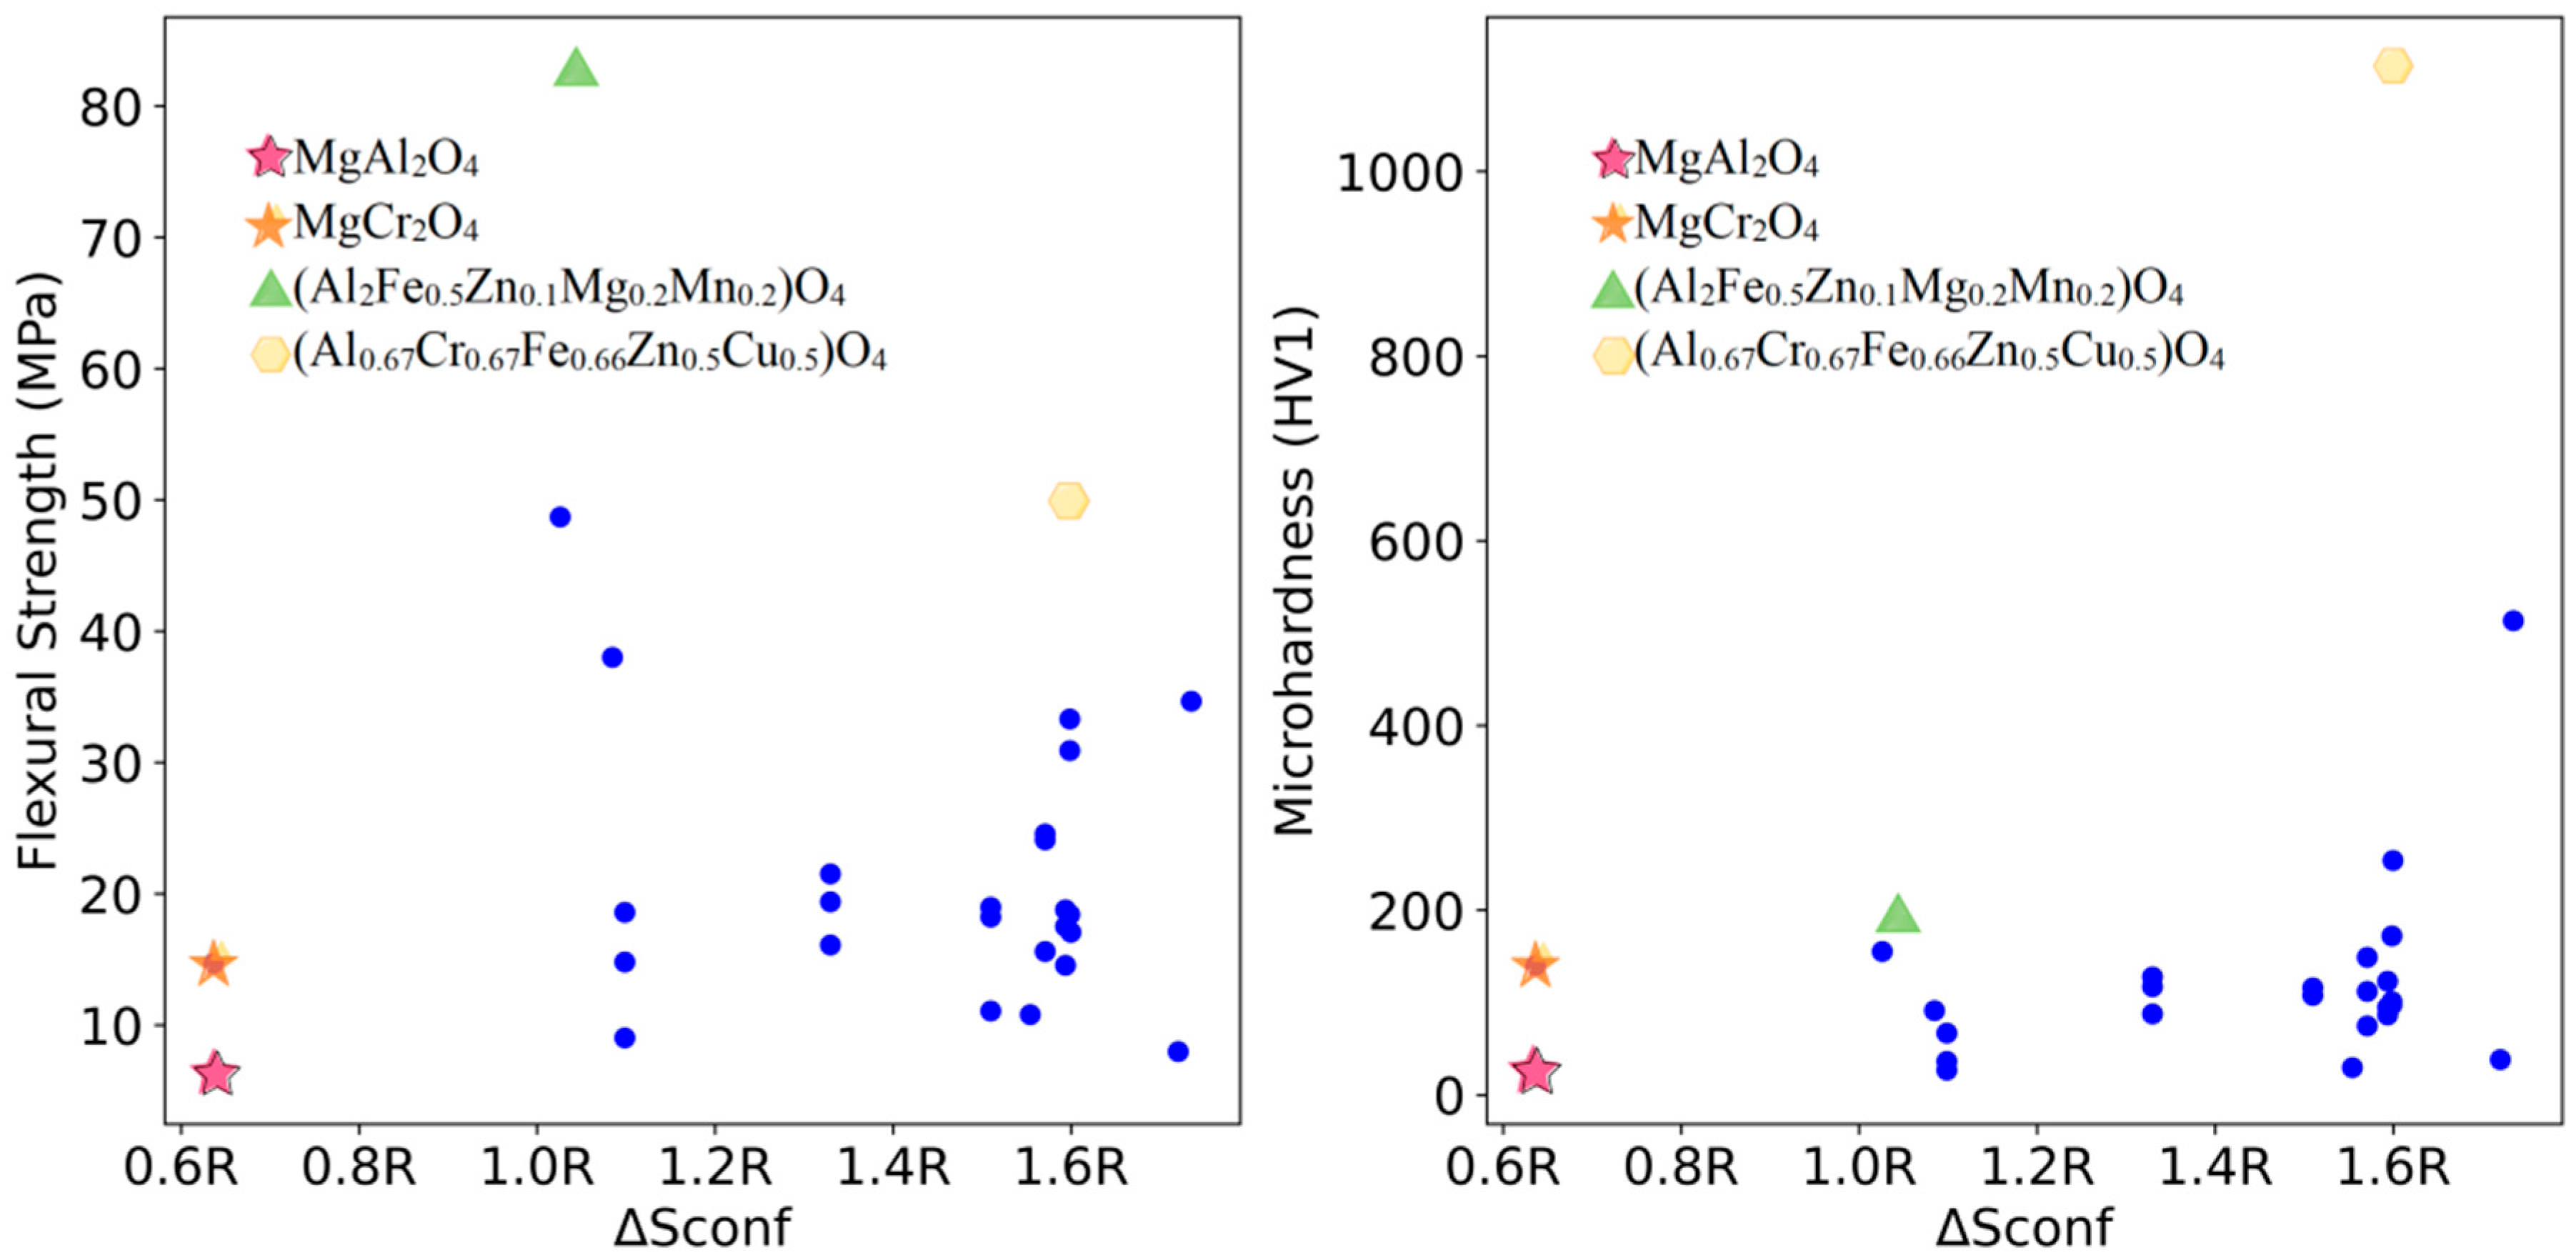


| Formula | Flexural Strength (MPa) | Microhardness (HV1) |
|---|---|---|
| (Al2Fe0.5Zn0.1Mg0.2Mn0.2)O4 | 82.9 ± 4.1 | 196.7 ± 10.9 |
| (Al0.67Cr0.67Fe0.66Zn0.5Cu0.5)O4 | 50.0 ± 2.7 | 1112.6 ± 44.9 |
| MgAl2O4 | 6.3 ± 1.9 | 22.8 ± 3.6 |
| MgCr2O4 | 14.7 ± 0.47 | 139.9 ± 8.5 |
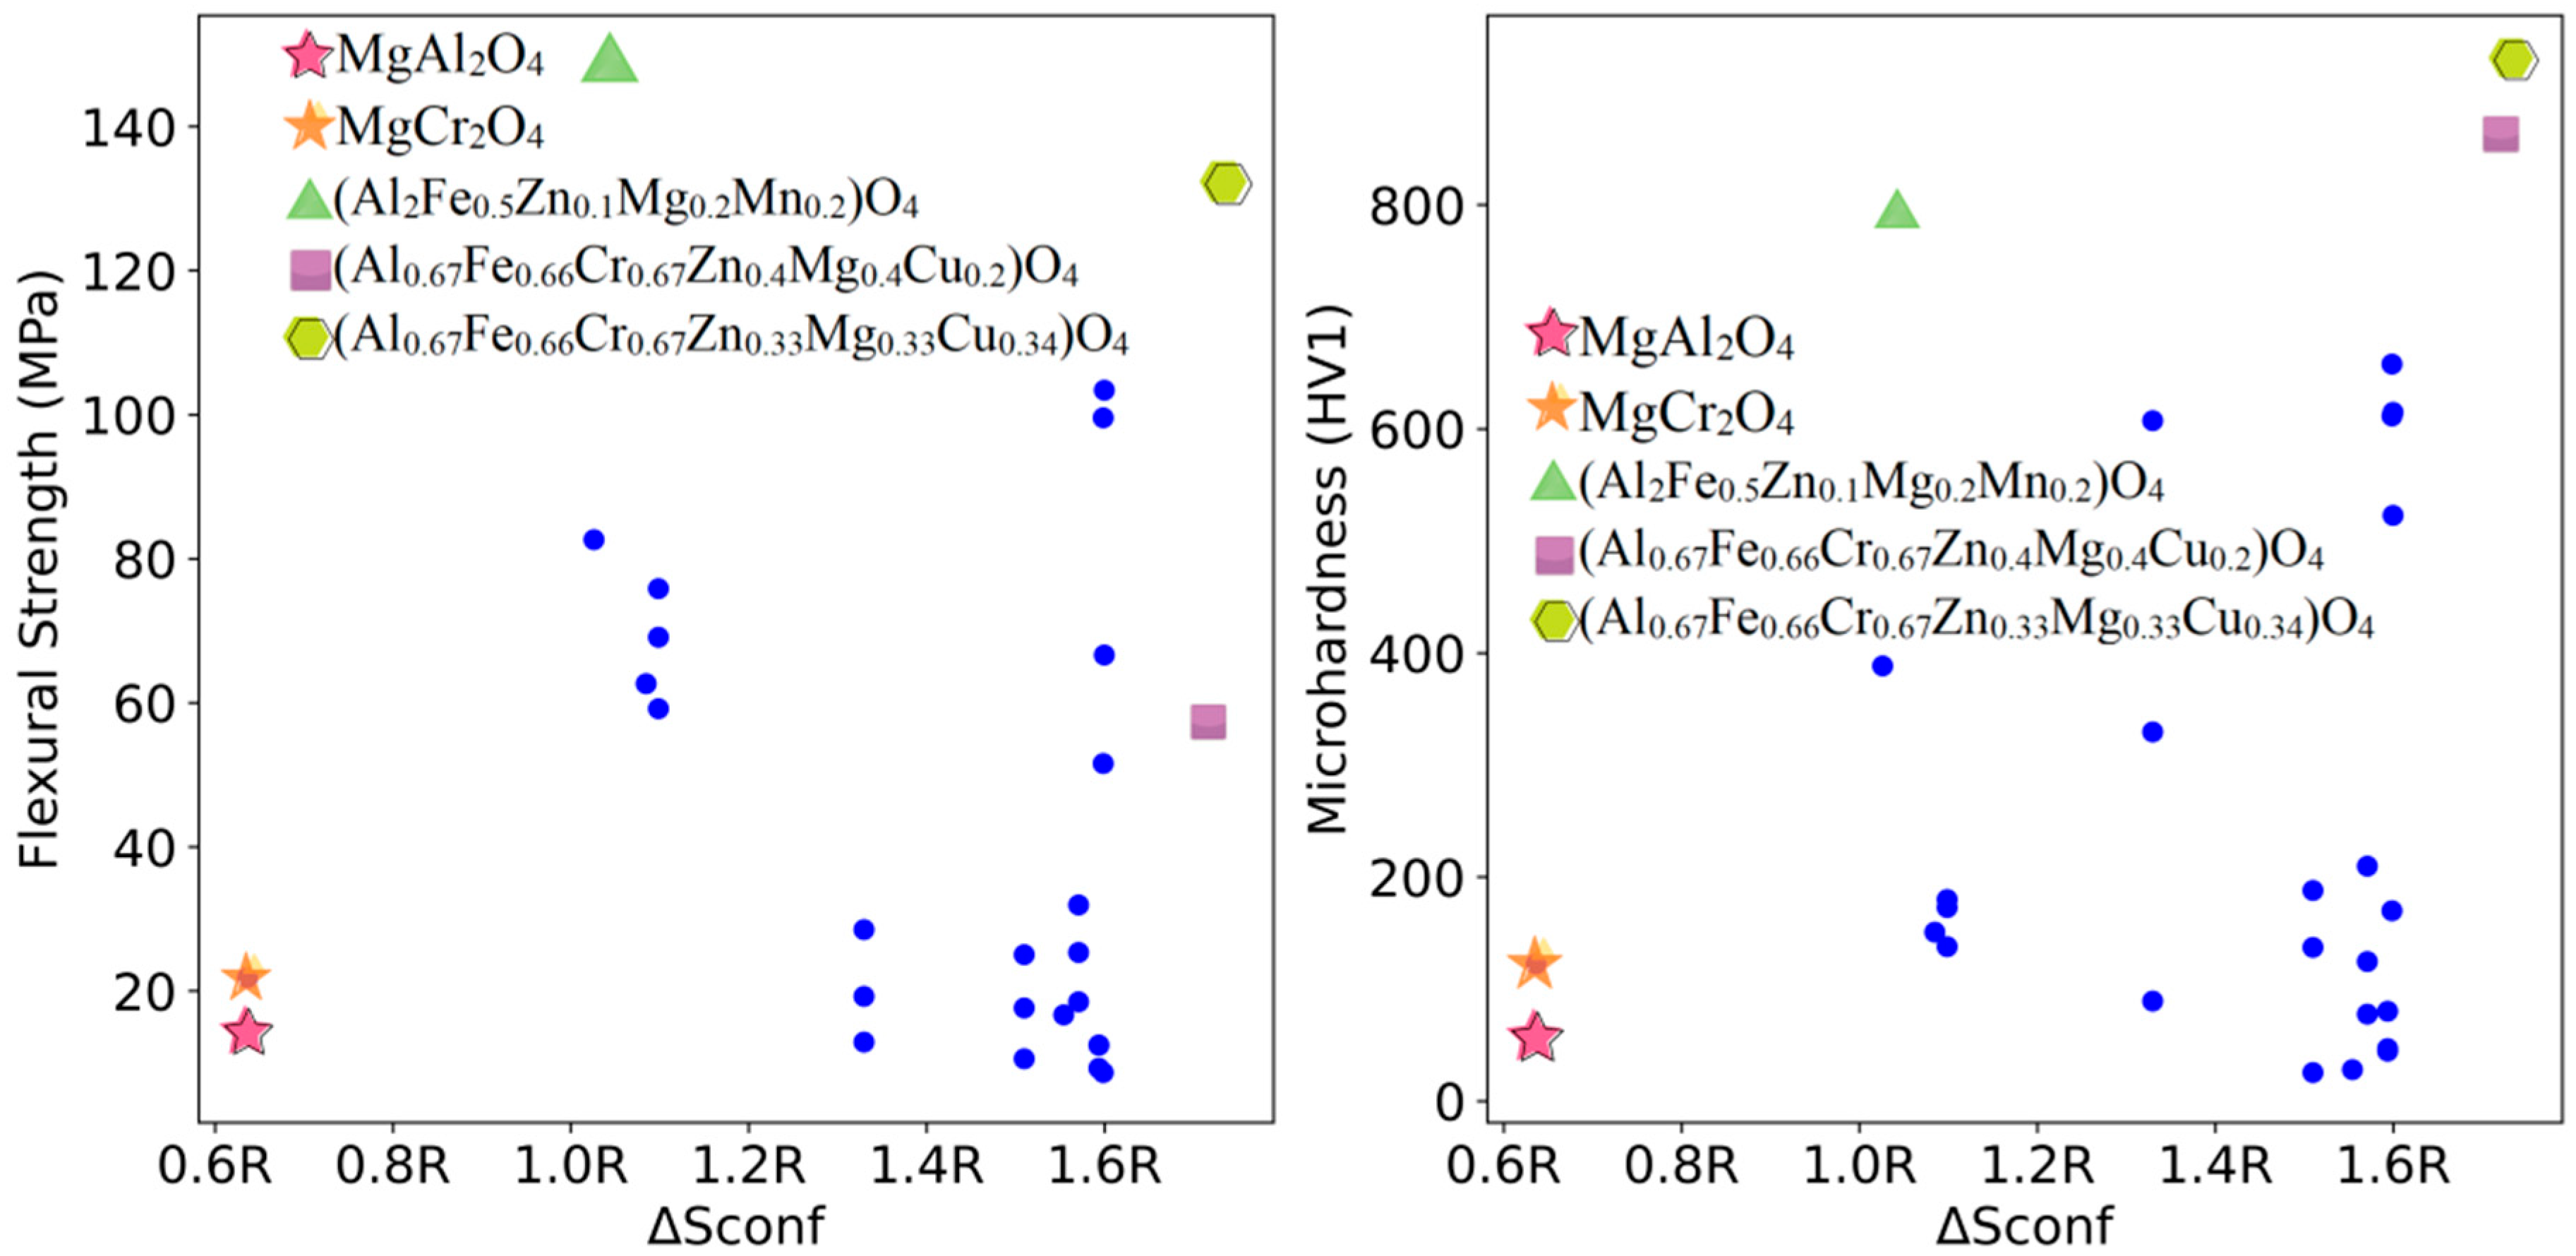
| Formula | Flexural Strength (MPa) | Microhardness (HV1) |
|---|---|---|
| (Al2Fe0.5Zn0.1Mg0.2Mn0.2)O4 | 148.4 ± 8.7 | 791.1 ± 36.3 |
| (Al0.67Fe0.66Cr0.67Zn0.4Mg0.4Cu0.2)O4 | 58.1 ± 3.9 | 863.4 ± 25.4 |
| (Al0.67Fe0.66Cr0.67Zn0.33Mg0.33Cu0.34)O4 | 132.0 ± 5.9 | 924.2 ± 36.9 |
| MgAl2O4 | 14.3 ± 2.8 | 58.1 ± 5.2 |
| MgCr2O4 | 21.9 ± 2.9 | 122.4 ± 5.0 |
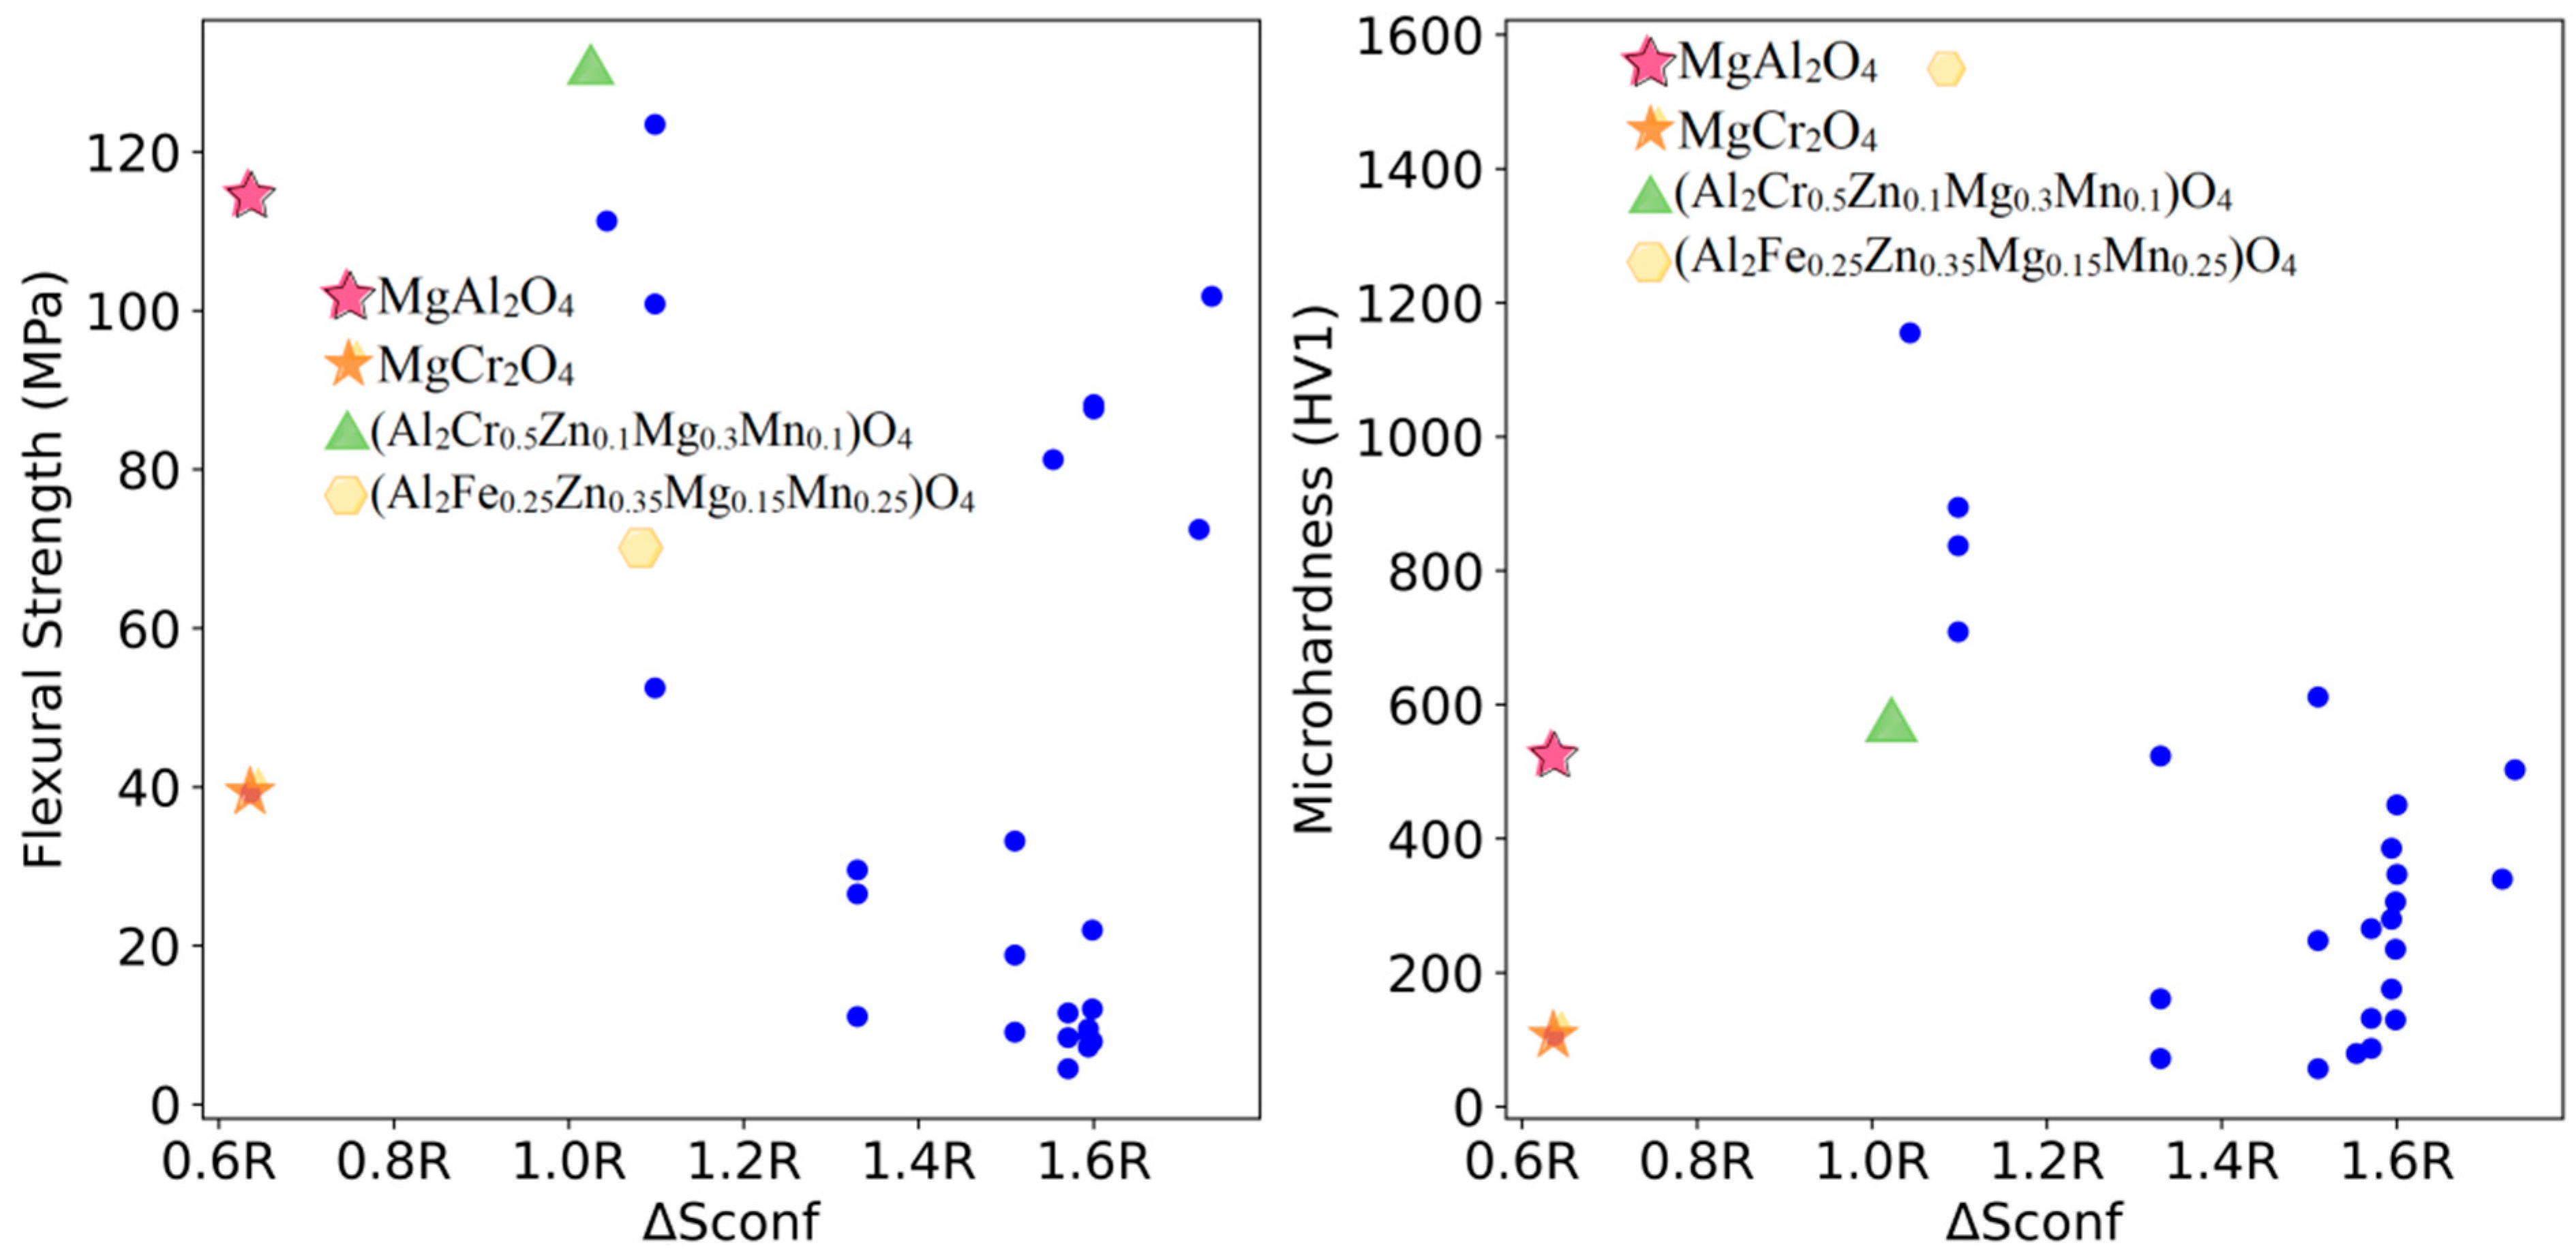
| Formula | Flexural Strength (MPa) | Microhardness (HV1) |
|---|---|---|
| (Al2Cr0.5Zn0.1Mg0.3Mn0.1)O4 | 130.3 ± 8.1 | 567.7 ± 19.3 |
| (Al2Fe0.25Zn0.35Mg0.15Mn0.25)O4 | 70.6 ± 6.0 | 1547.1 ± 80.2 |
| MgAl2O4 | 114.7 ± 4.7 | 528.4 ± 17.3 |
| MgCr2O4 | 39.2 ± 3.2 | 105.6 ± 4.7 |
| Weighted Average | Weighted Standard Deviation |
|---|---|
| 1. Relative atomic weight 2. Melting point 3. Boiling point 4. Electronegativity 5. Number of valence electrons 6. Lattice constant a 7. Specific heat capacity 8. Thermal conductivity coefficient 9. Melting point of oxides 10. Oxide lattice constant a 11. Oxide lattice constant c 12. Configurational entropy 13. Firing temperature of the sample (T) | 14. SD_Relative atomic weight 15. SD_Melting point 16. SD_Boiling point 17. SD_Covalent radius 18. SD_First ionization energy 19. SD_Electronegativity 20. SD_Number of valence electrons 21. SD_Atomic radius 22. SD_Thermal conductivity coefficient 23. SD_Oxides molecular weight 24. SD_Melting point of oxides |
| Algorithm | ADA | DTR | EN | LASSO | NN | RF | RIDGE | XGB | |
|---|---|---|---|---|---|---|---|---|---|
| Number of Descriptors | |||||||||
| 4 | 0.566 | 0.263 | 0.413 | 0.413 | −3.090 | 0.560 | 0.185 | 0.451 | |
| 8 | 0.563 | 0.295 | 0.391 | 0.390 | 0.471 | 0.571 | 0.216 | 0.410 | |
| 12 | 0.570 | 0.366 | 0.392 | 0.391 | 0.532 | 0.568 | 0.321 | 0.404 | |
| 16 | 0.550 | 0.298 | 0.392 | 0.391 | 0.431 | 0.567 | 0.327 | 0.414 | |
| 20 | 0.566 | 0.318 | 0.395 | 0.394 | 0.533 | 0.555 | 0.327 | 0.401 | |
| 24 | 0.501 | 0.311 | 0.395 | 0.394 | 0.460 | 0.557 | 0.327 | 0.395 | |
| Algorithm | ADA | DTR | EN | LASSO | NN | RF | RIDGE | XGB | |
|---|---|---|---|---|---|---|---|---|---|
| Number of Descriptors | |||||||||
| 4 | 0.440 | 0.193 | 0.362 | 0.361 | −0.282 | 0.322 | 0.050 | 0.519 | |
| 8 | 0.444 | 0.293 | 0.348 | 0.346 | 0.574 | 0.541 | 0.052 | 0.503 | |
| 12 | 0.422 | 0.147 | 0.374 | 0.367 | −0.082 | 0.549 | 0.285 | 0.489 | |
| 16 | 0.390 | 0.181 | 0.374 | 0.367 | 0.571 | 0.532 | 0.284 | 0.433 | |
| 20 | 0.356 | 0.184 | 0.378 | 0.367 | 0.514 | 0.515 | 0.266 | 0.453 | |
| 24 | 0.391 | 0.222 | 0.356 | 0.350 | 0.561 | 0.509 | 0.266 | 0.482 | |
| Random Forest Hyperparameters | Neural Network Hyperparameters |
|---|---|
| n_estimators = 54 (number of trees in the forest) | hidden_layer_sizes = (148,148) (number of neurons in each hidden layer) |
| max_depth = 8 (maximum depth of each tree) | activation = ‘relu’ (activation function for hidden layers) |
| min_samples_split = 2 (minimum number of samples required to split an internal node) | alpha = 0.061 (L2 regularization term) |
| min_samples_leaf = 1 (minimum number of samples required to be at a leaf node) | learning_rate = ‘constant’ (learning rate schedule) |
| max_features = ‘log2’ (number of features to consider when looking for the best split) | learning_rate_init = 0.001 (initial learning rate) |
| criterion = ‘friedman_mse’ (function to measure the quality of a split) | max_iter = 1026 (maximum number of iterations) |
Disclaimer/Publisher’s Note: The statements, opinions and data contained in all publications are solely those of the individual author(s) and contributor(s) and not of MDPI and/or the editor(s). MDPI and/or the editor(s) disclaim responsibility for any injury to people or property resulting from any ideas, methods, instructions or products referred to in the content. |
© 2025 by the authors. Licensee MDPI, Basel, Switzerland. This article is an open access article distributed under the terms and conditions of the Creative Commons Attribution (CC BY) license (https://creativecommons.org/licenses/by/4.0/).
Share and Cite
Chen, Z.; Yang, D.; Li, X.; Li, J.; Yuan, H.; Cui, J. Machine-Learning-Assisted Multi-Element Optimization of Mechanical Properties in Spinel Refractory Materials. Materials 2025, 18, 1719. https://doi.org/10.3390/ma18081719
Chen Z, Yang D, Li X, Li J, Yuan H, Cui J. Machine-Learning-Assisted Multi-Element Optimization of Mechanical Properties in Spinel Refractory Materials. Materials. 2025; 18(8):1719. https://doi.org/10.3390/ma18081719
Chicago/Turabian StyleChen, Zhiyuan, Daoyuan Yang, Xianghui Li, Jinfeng Li, Huiyu Yuan, and Junyan Cui. 2025. "Machine-Learning-Assisted Multi-Element Optimization of Mechanical Properties in Spinel Refractory Materials" Materials 18, no. 8: 1719. https://doi.org/10.3390/ma18081719
APA StyleChen, Z., Yang, D., Li, X., Li, J., Yuan, H., & Cui, J. (2025). Machine-Learning-Assisted Multi-Element Optimization of Mechanical Properties in Spinel Refractory Materials. Materials, 18(8), 1719. https://doi.org/10.3390/ma18081719