


The Impact of Cyclic Oxidation in Dissociated Air on the Mechanical Properties of Freeze-Cast ZrB2/MoSi2 Ceramics


Abstract
1. Introduction
2. Materials and Methods
3. Results
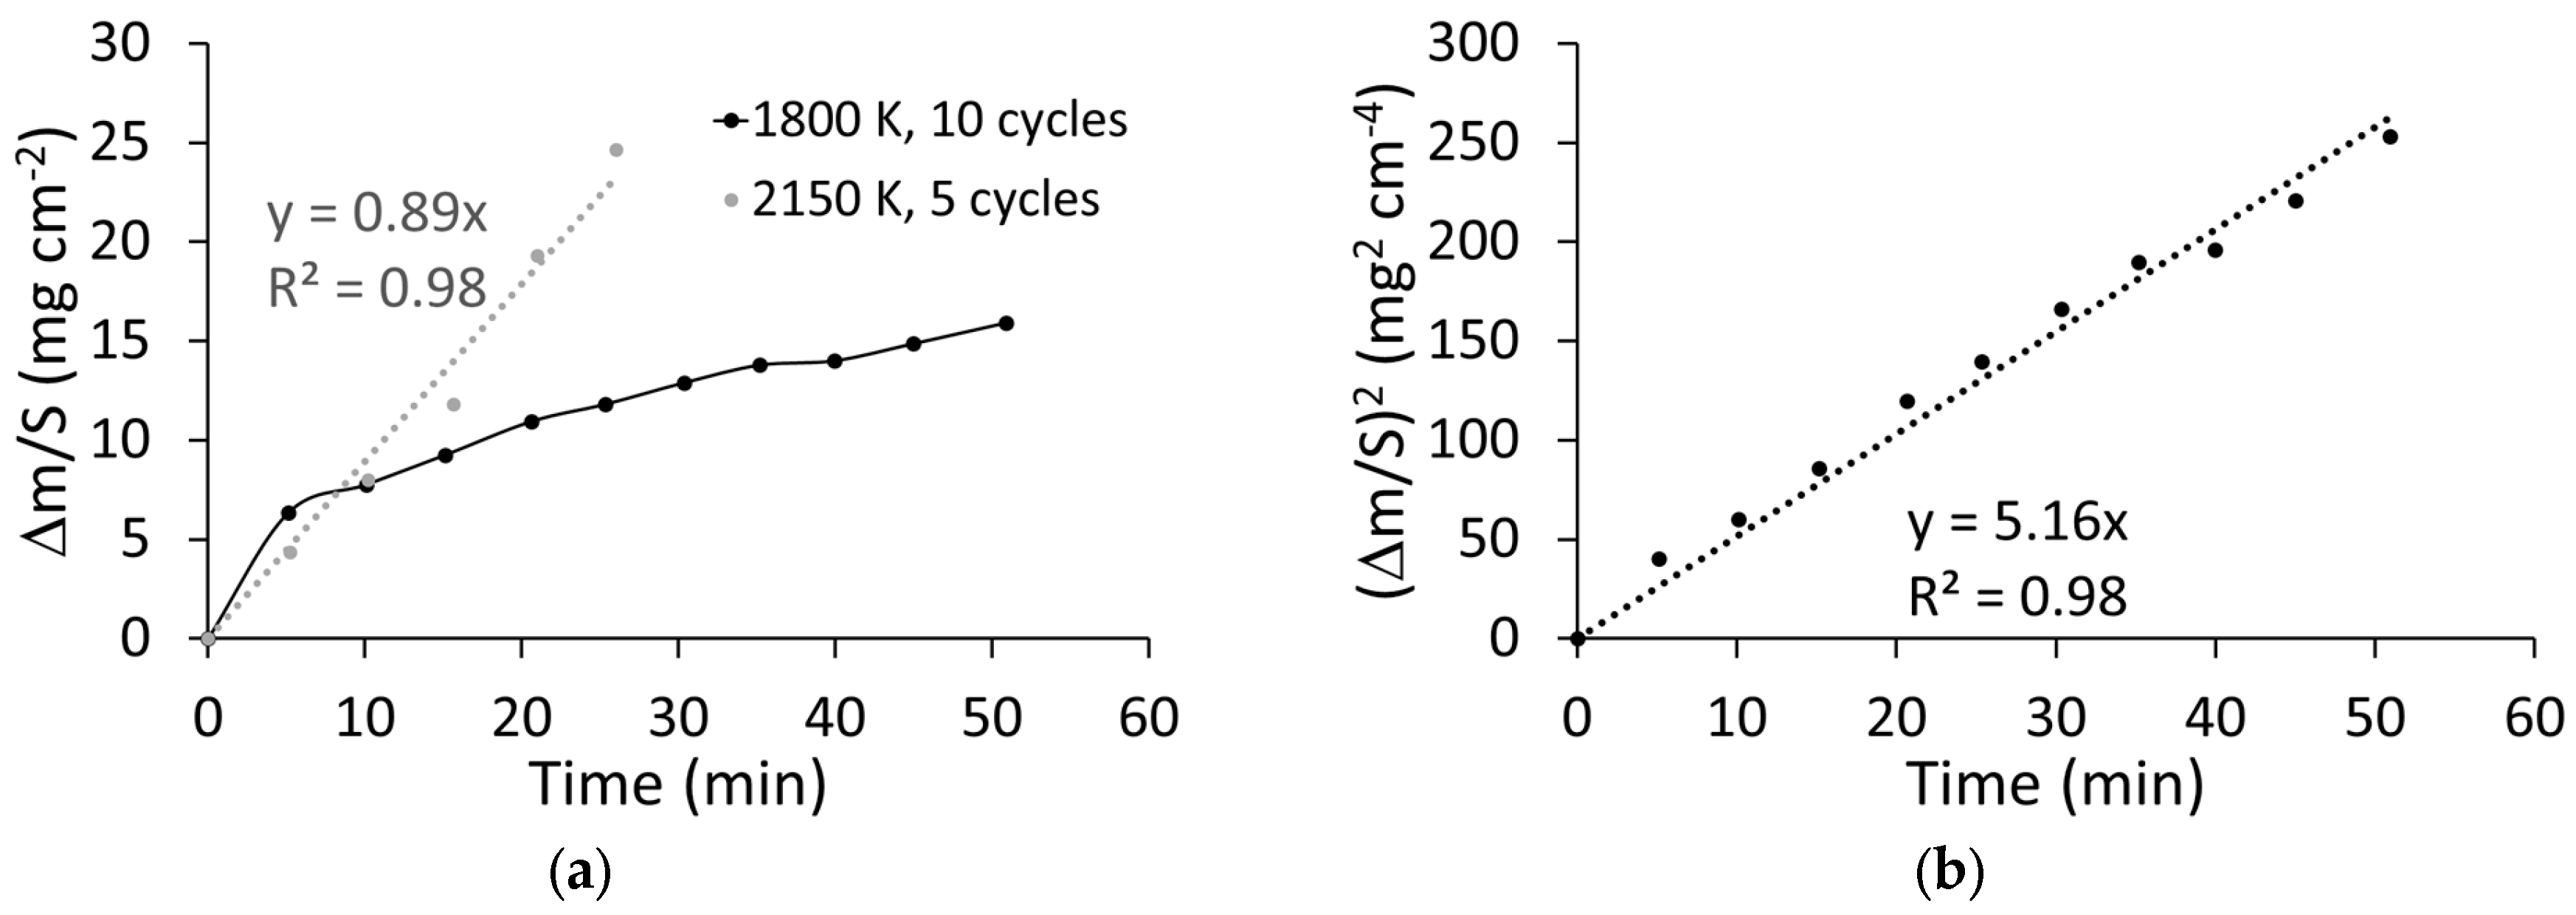
3.1. Oxidation Kinetics
3.2. Post-Experimental Characterizations
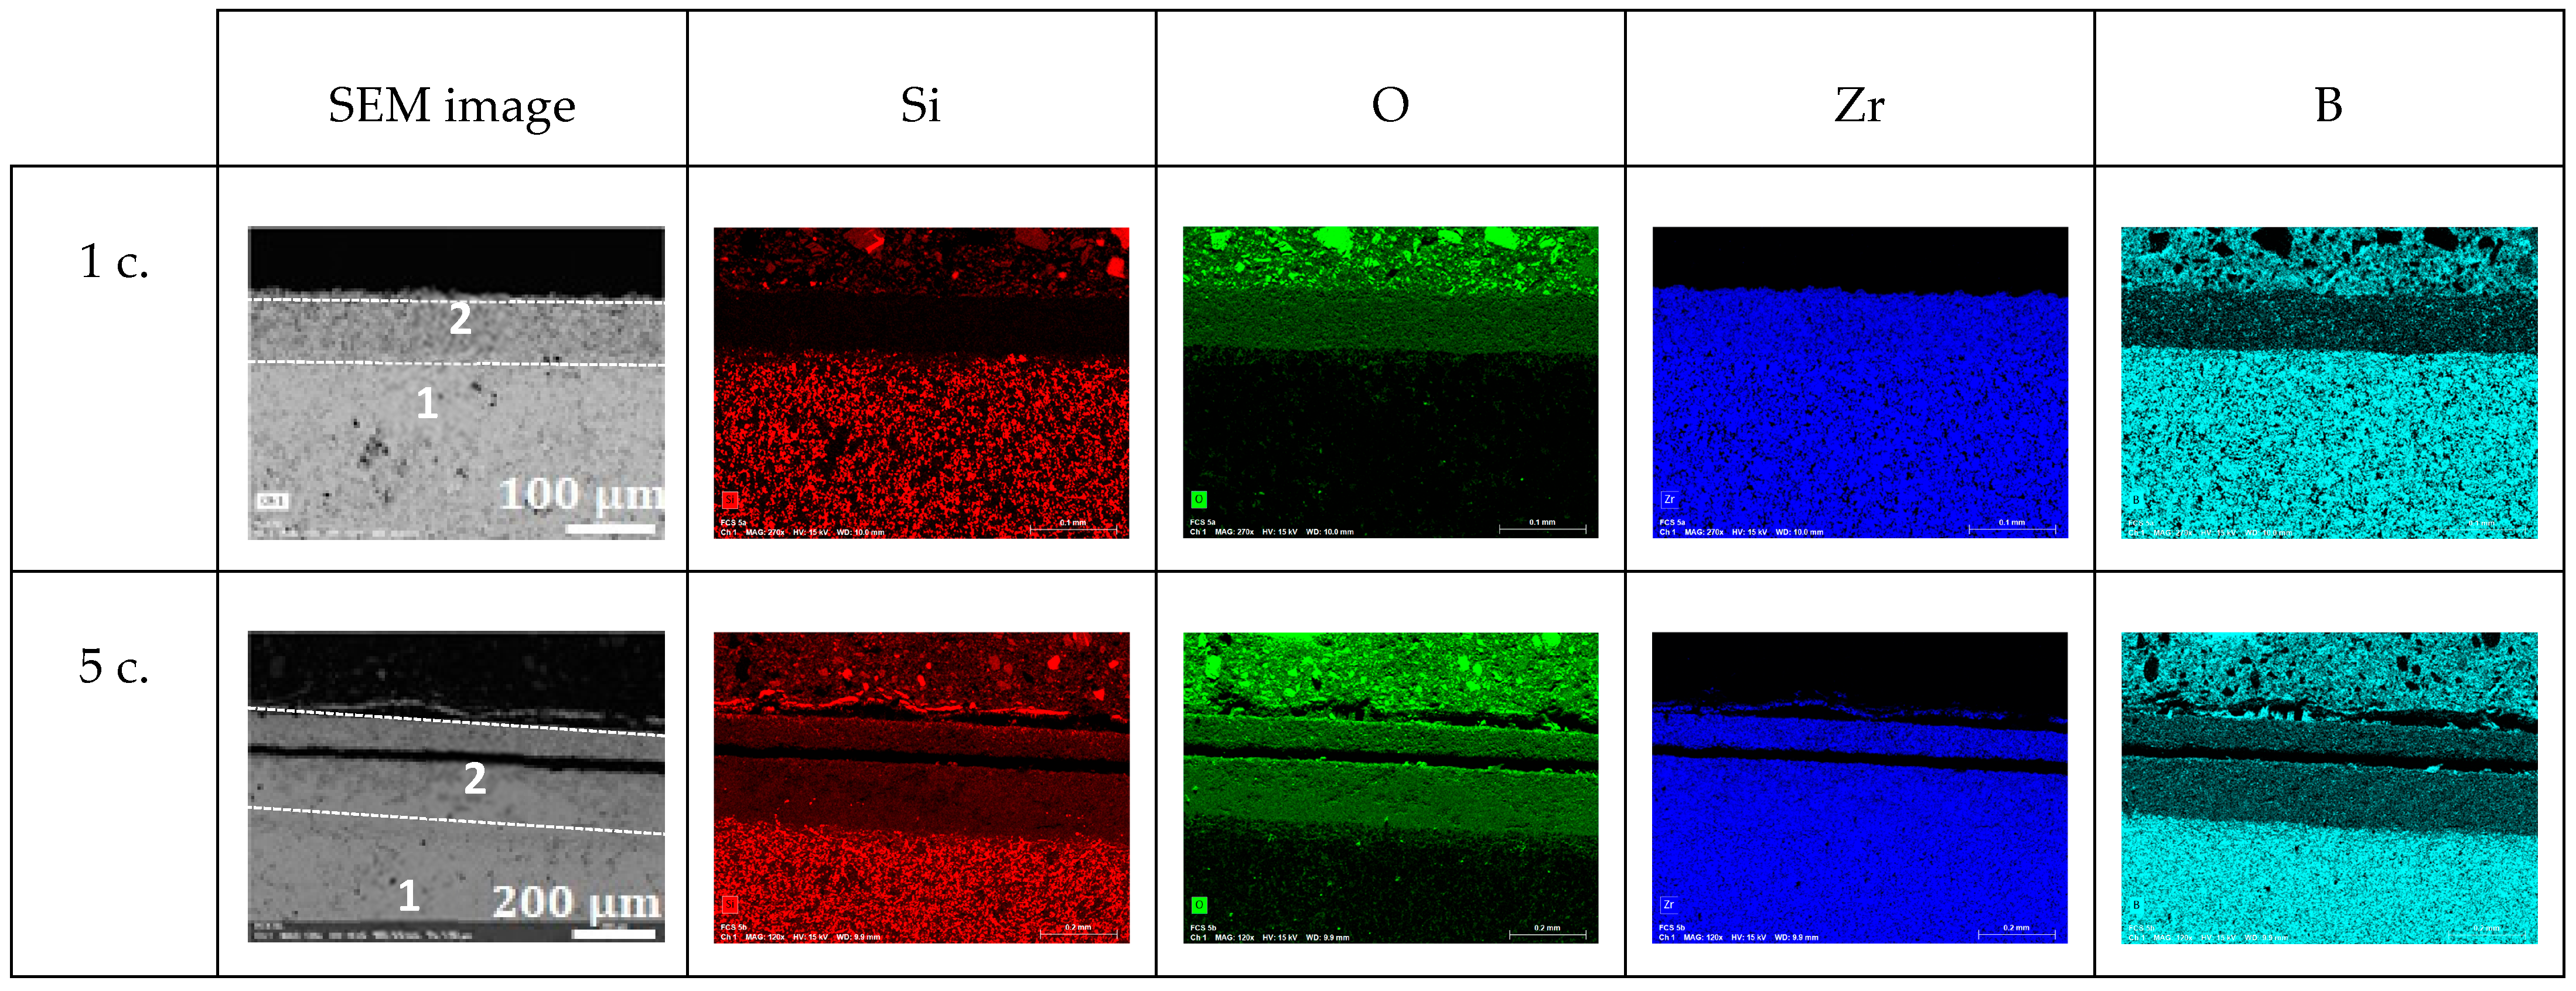
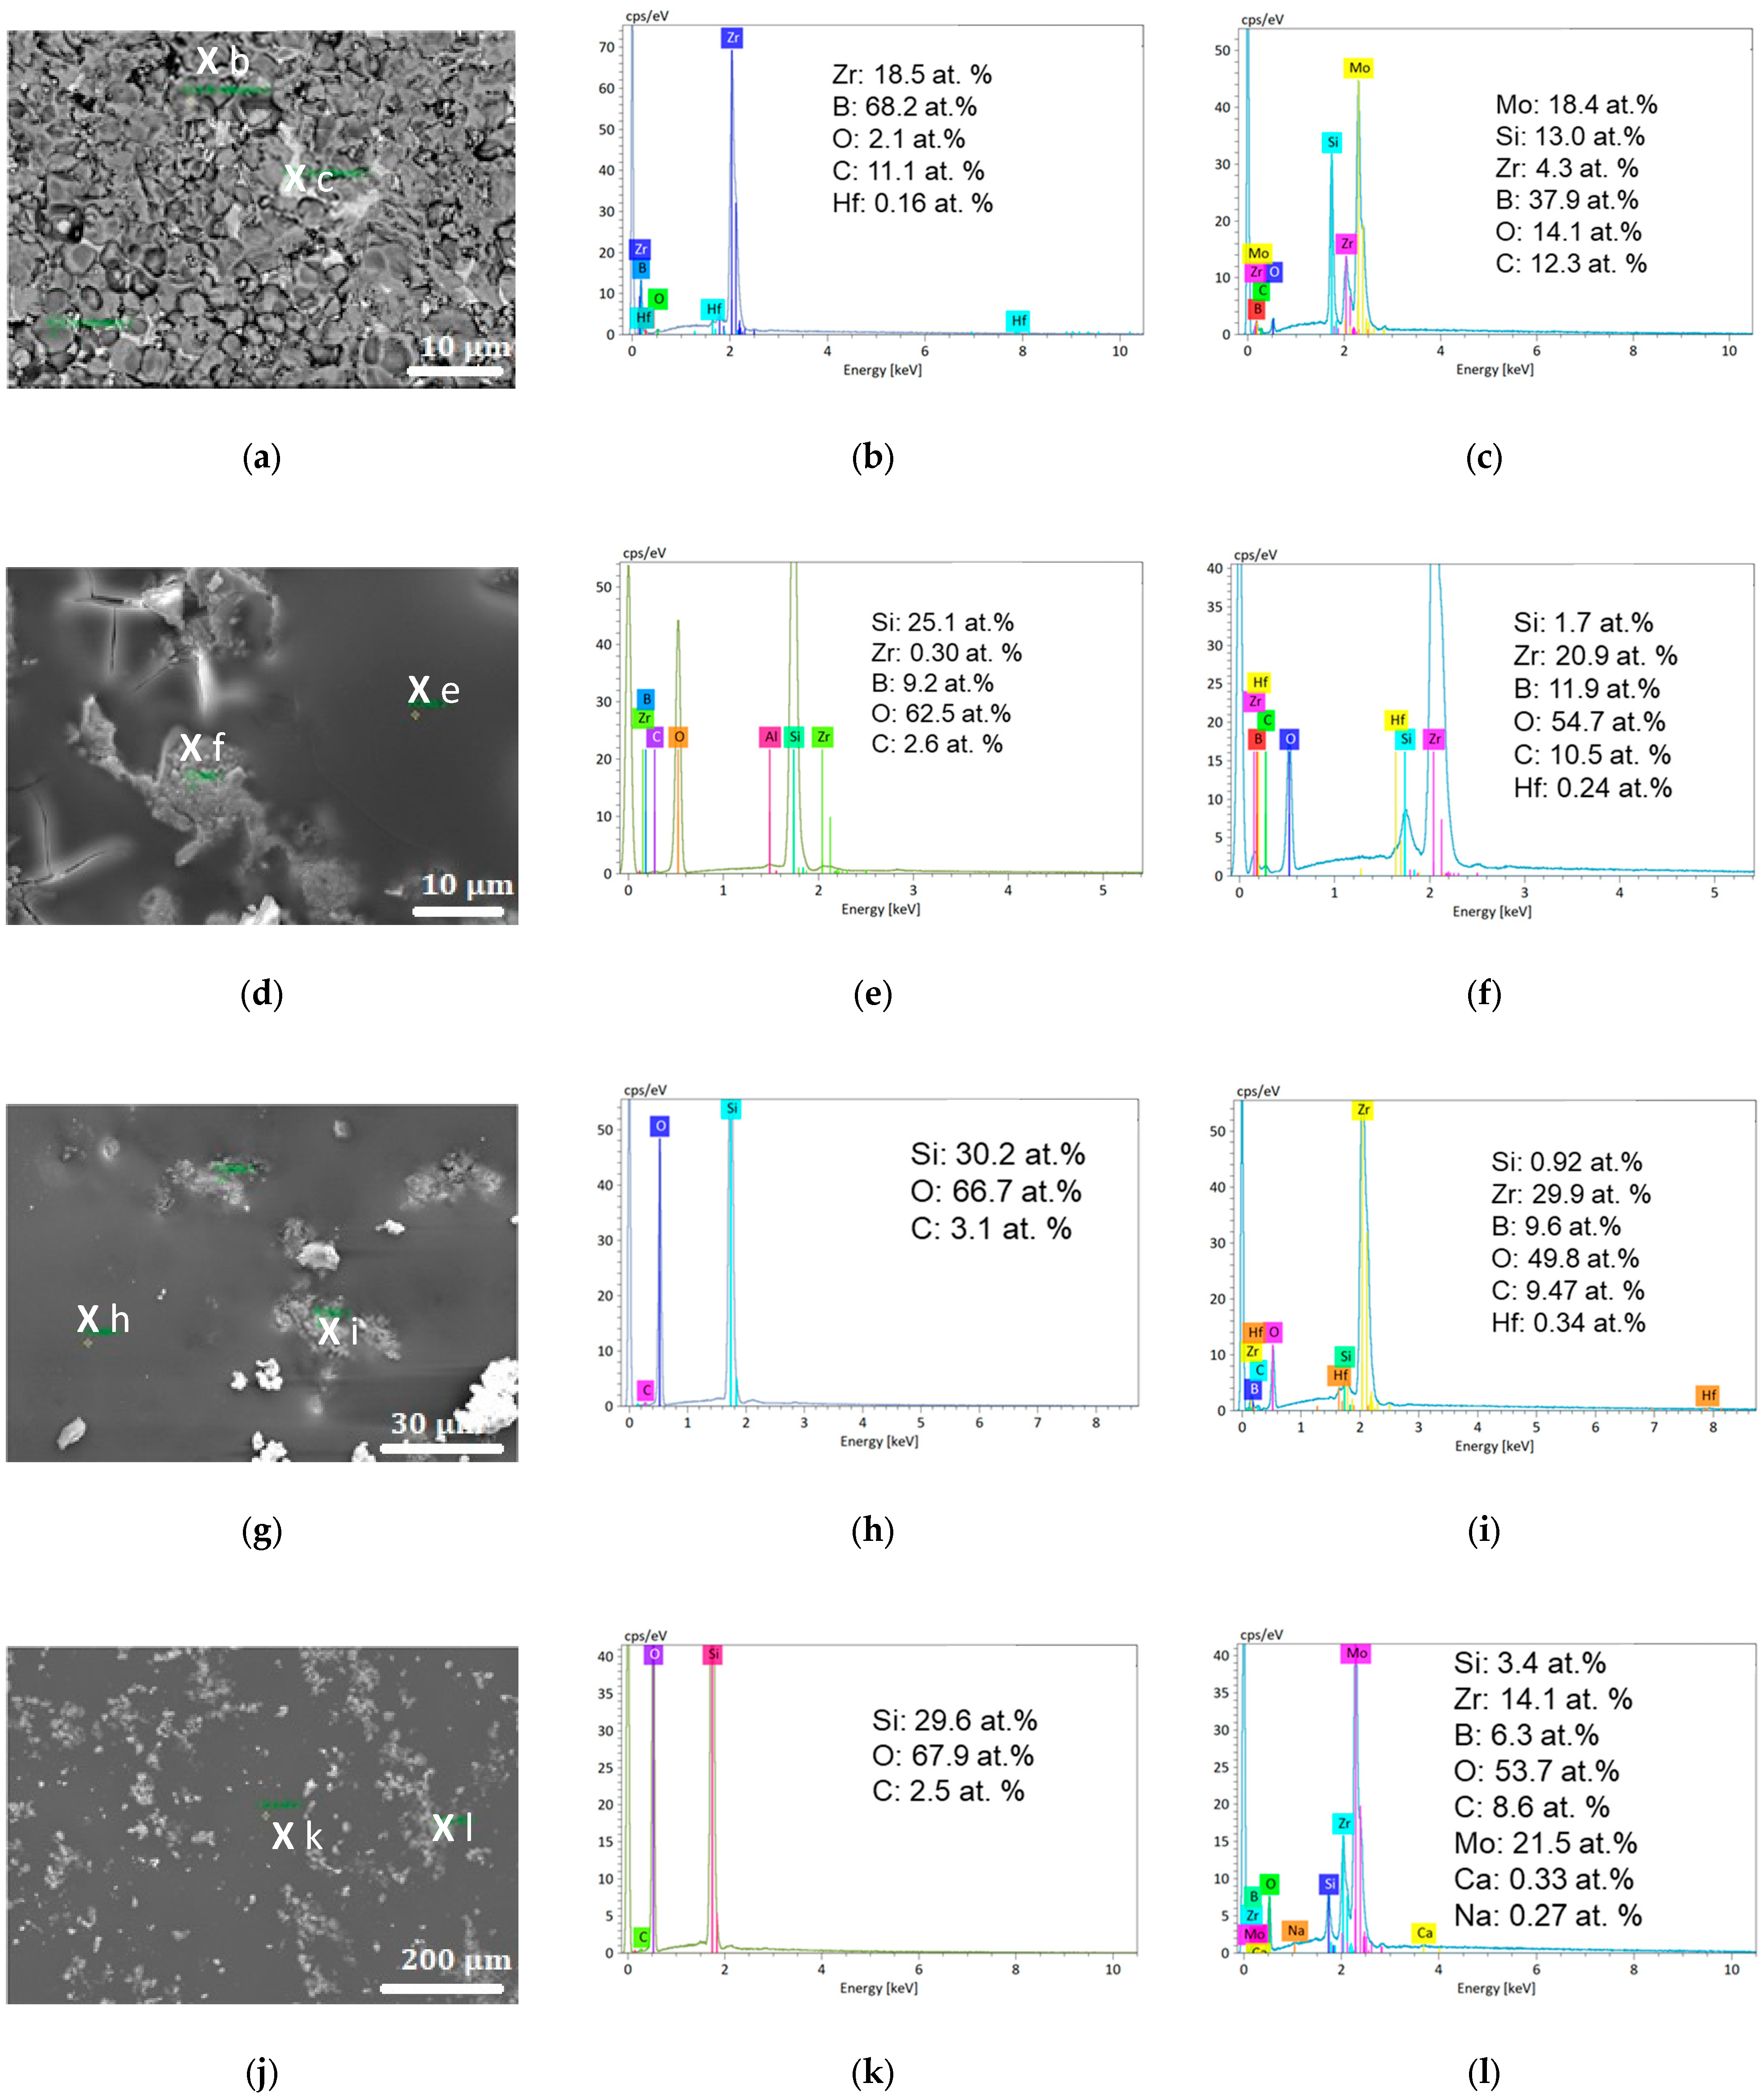
3.2.1. Oxidation at 1800 K
- An unaltered substrate (with the presence of boron and absence of oxygen) in the deeper part of the sample;
- An intermediate oxide layer (as evidenced by the presence of oxygen) covering the substrate, which is characterized by a reduced amount of silicon and boron. This phase grows with the oxidation time: its thickness was 25, 30, and 65 µm after one, five, and ten oxidation cycles, respectively;
- A thin outer region rich in silicon and oxygen at the surface of the samples. We observed that this amorphous phase forms as a few separated droplets after one oxidation cycle, a discontinuous thin layer after five oxidation cycles, and a 20 µm-thick continuous outer crust after ten oxidation cycles.

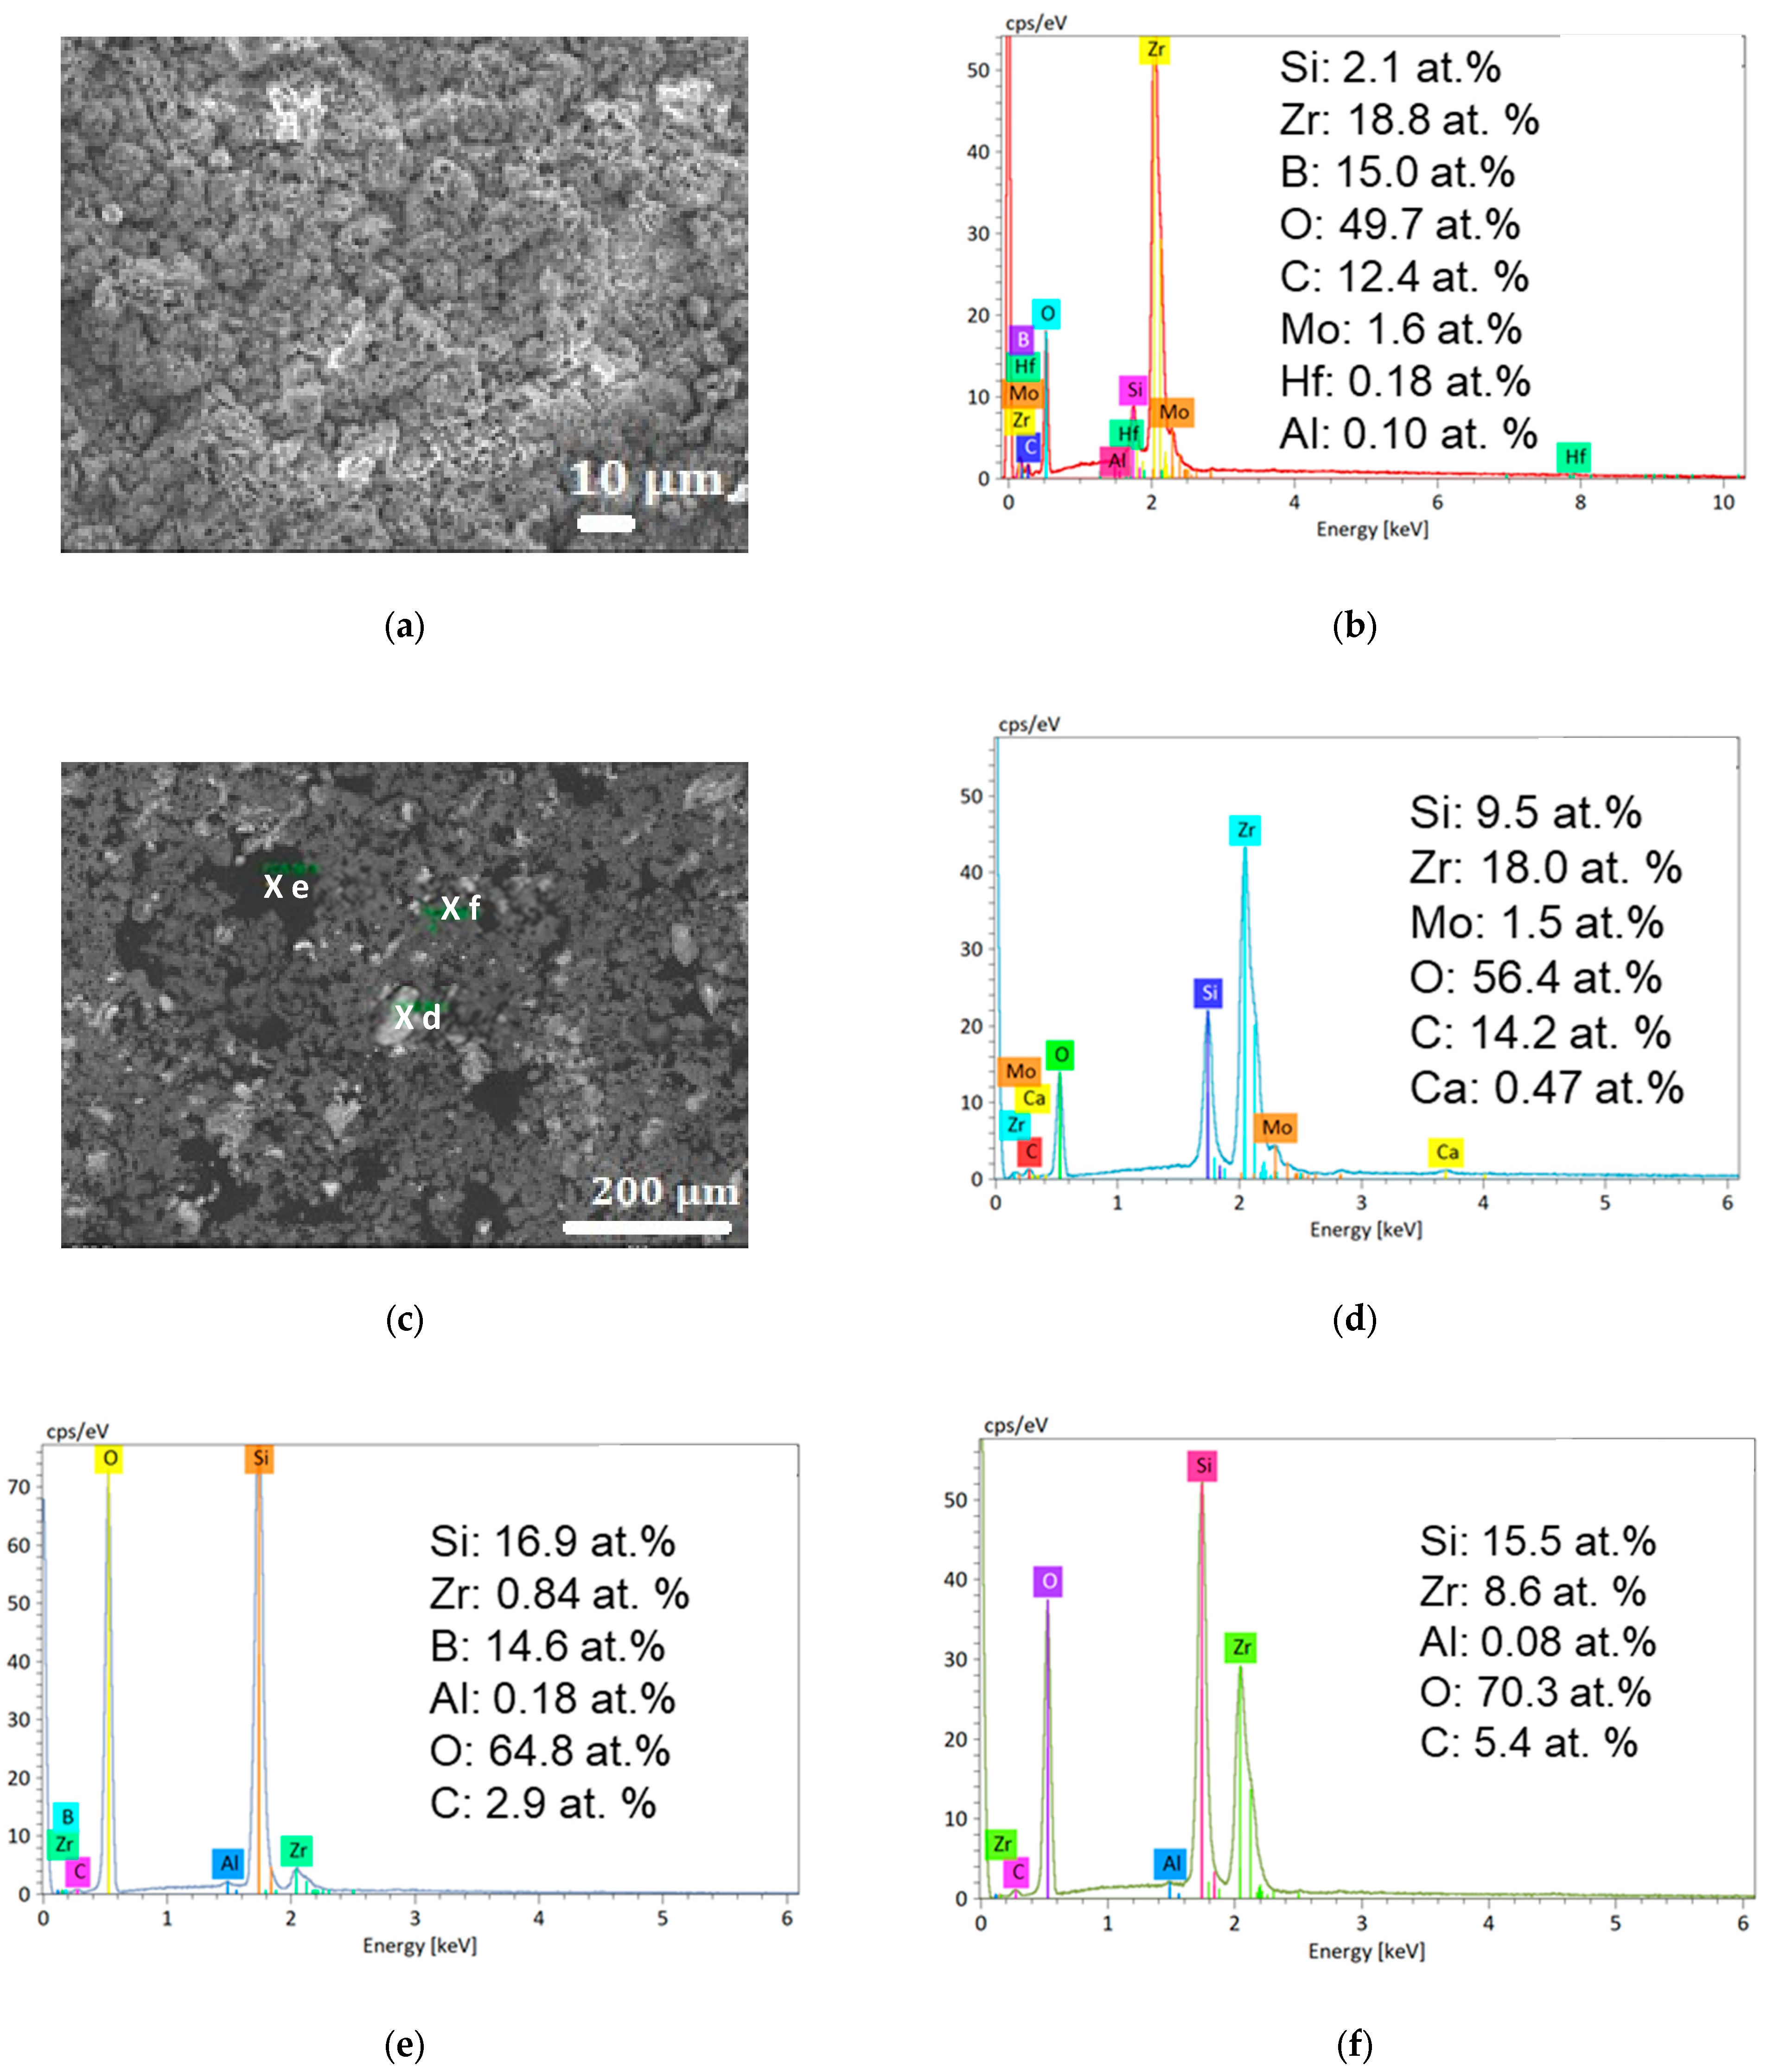
3.2.2. Oxidation at 2150 K
- The substrate (containing Zr, B, and Si) at the bottom of the SEM images.
- An oxide layer that only contains O and Zr. After one oxidation cycle, this layer is already ap. 65 µm thick. After five oxidation cycles, this thickness has increased to ap. 275 µm. There is also a fissure crossing the sample, parallel to the external surface and the interface with the substrate, in this layer, which probably appeared during sample cutting and/or polishing. After five oxidation cycles, there is a thin Si-rich layer peeling off the sample with B-rich grains on its external surface.
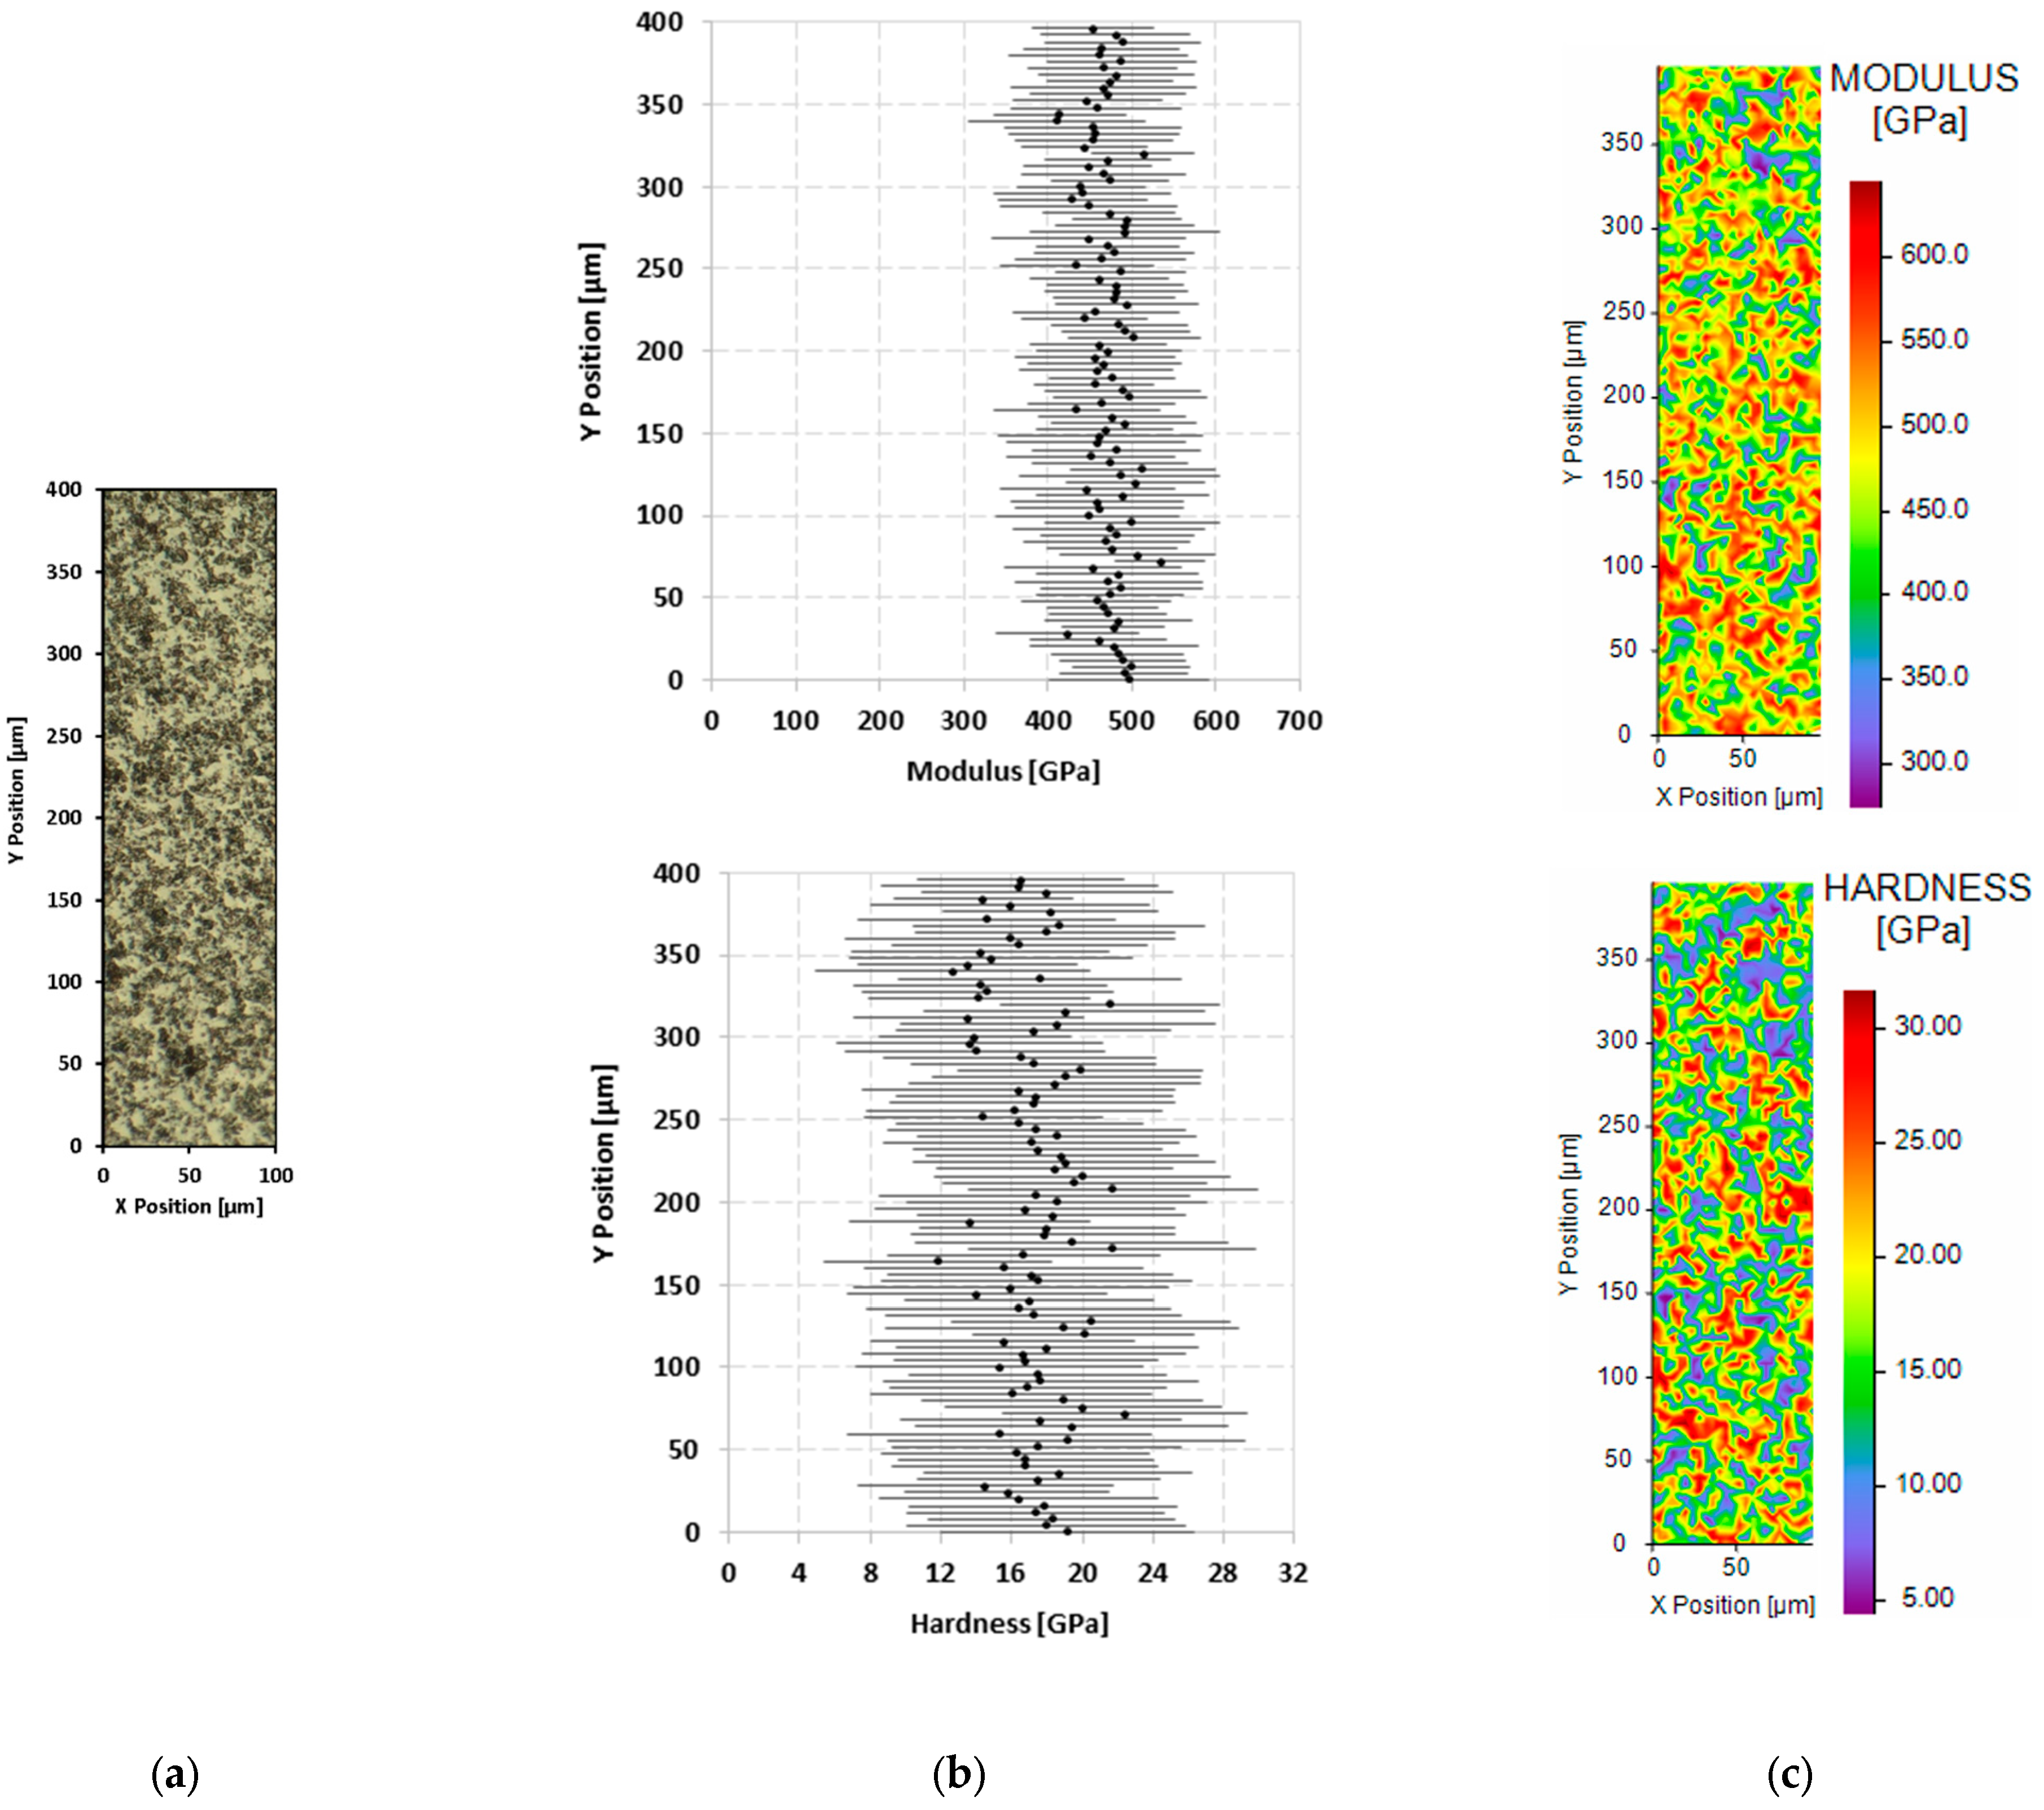
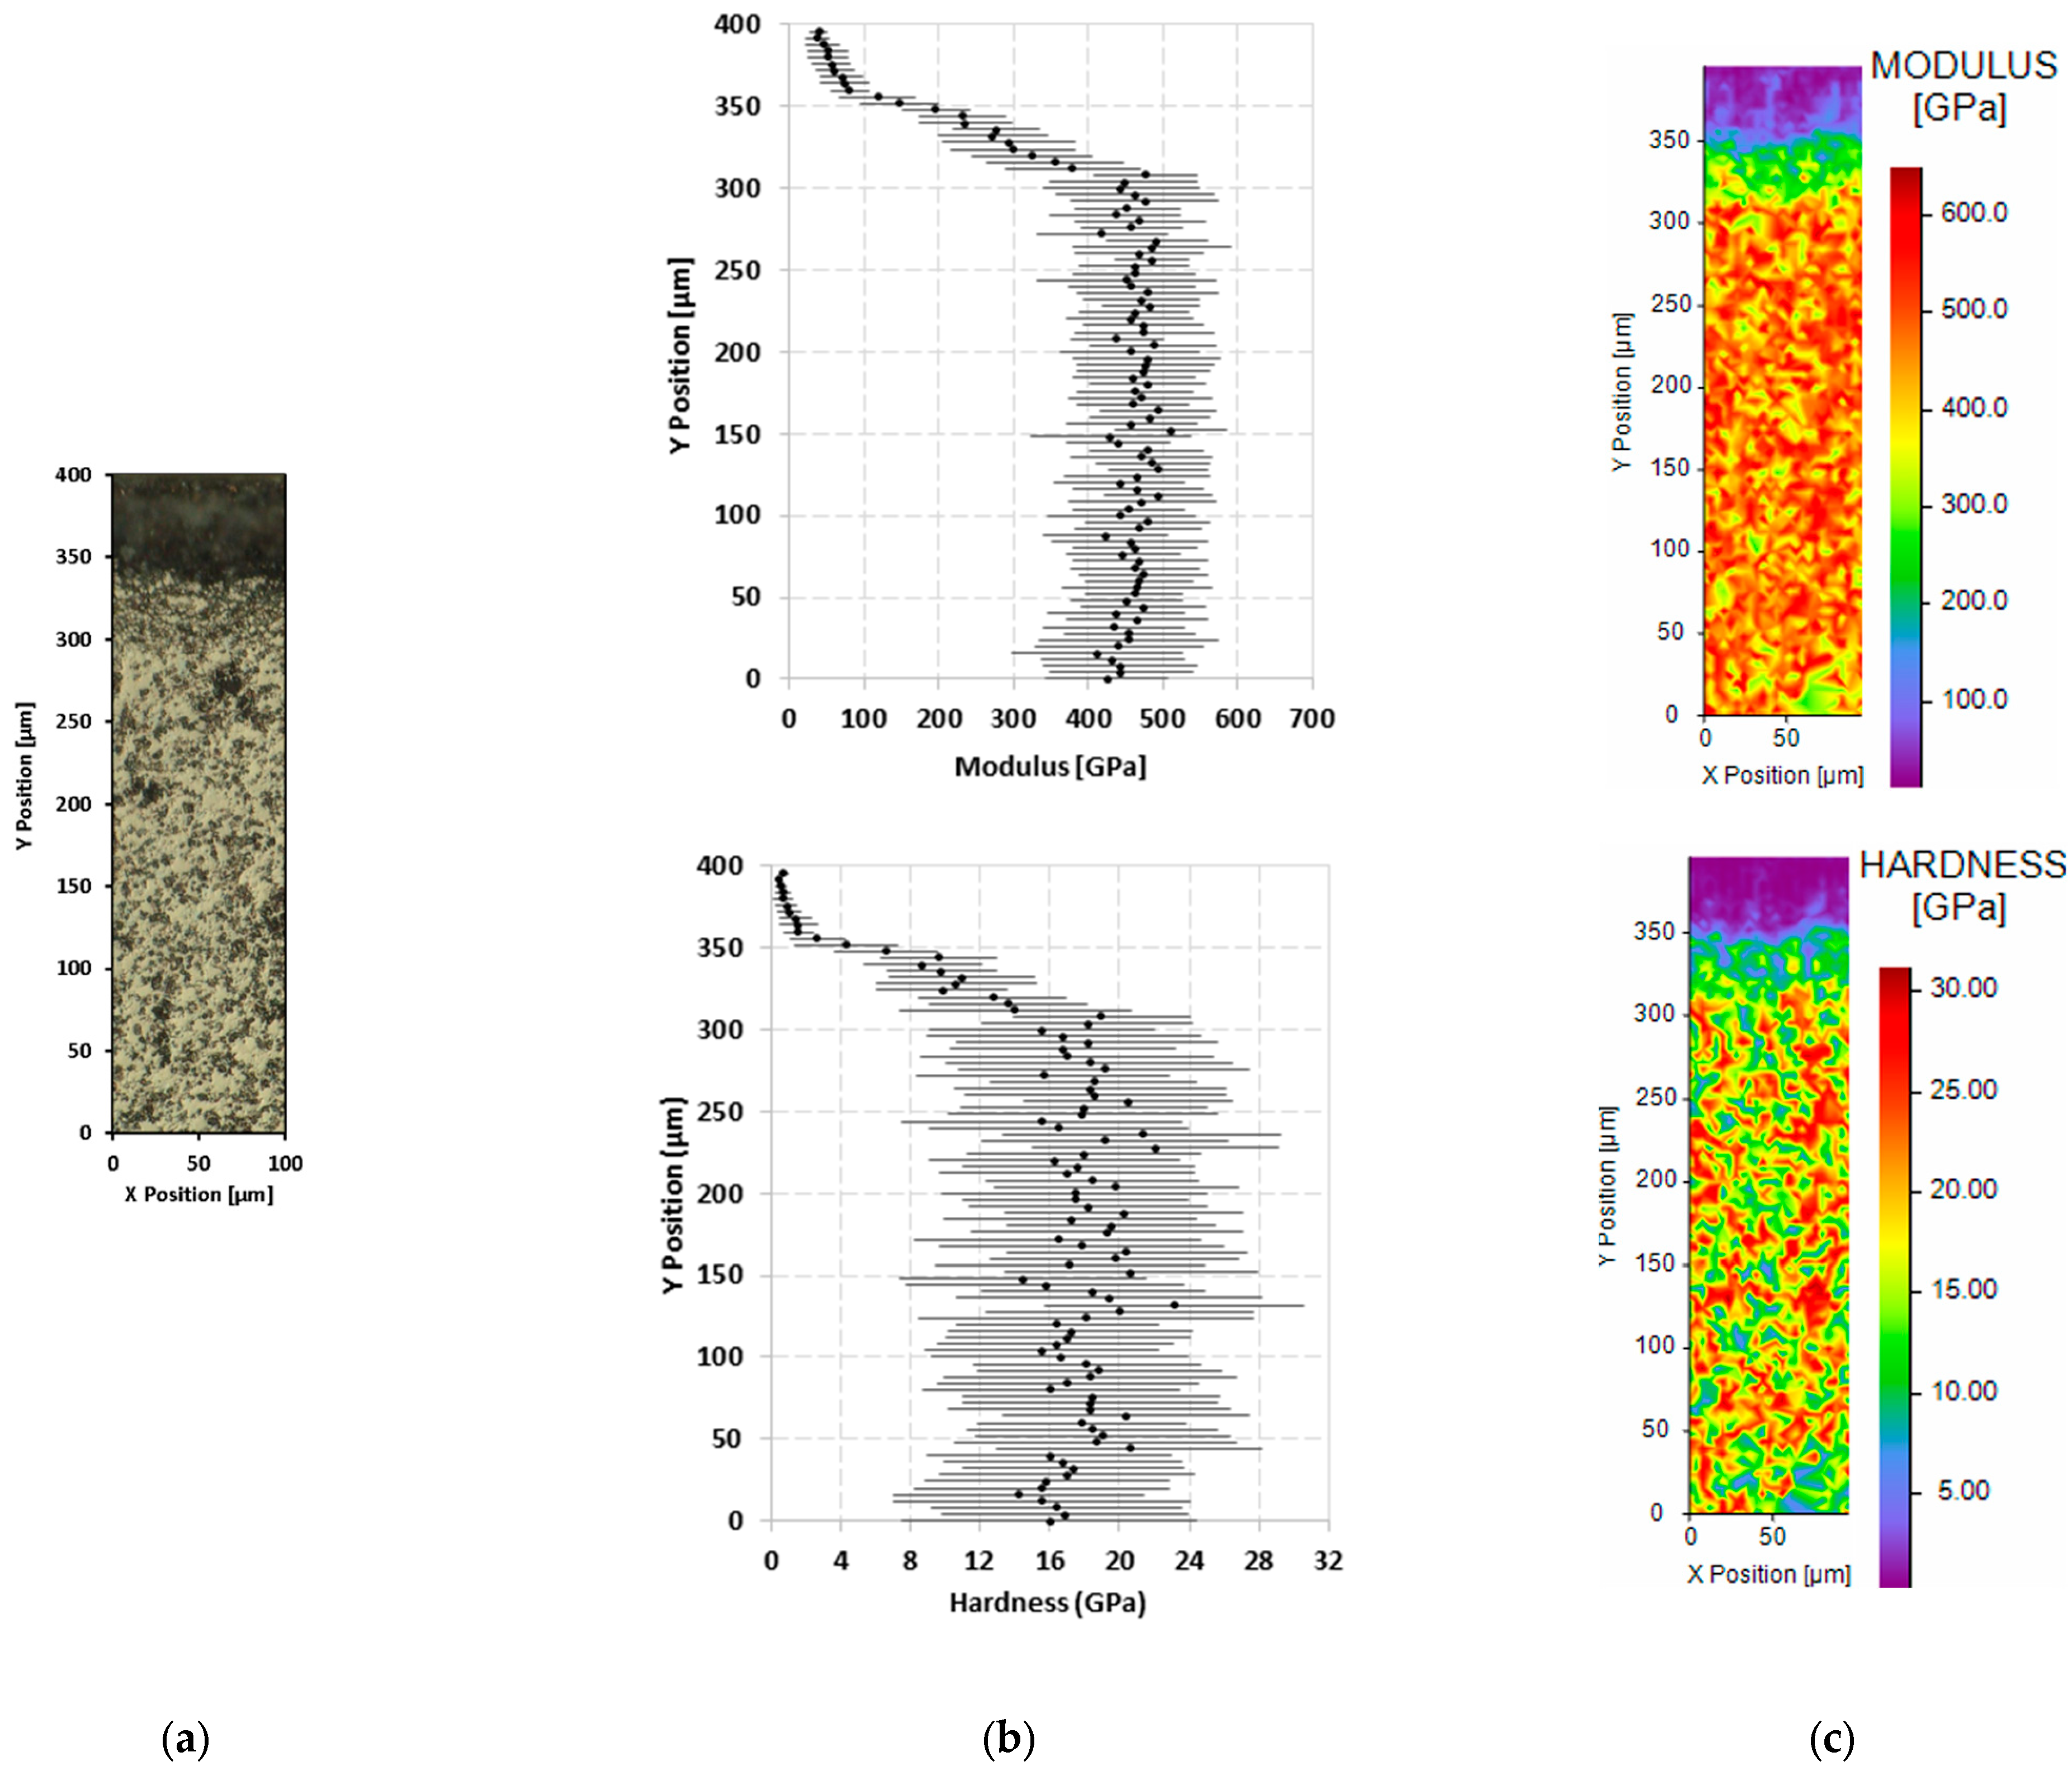
3.3. Mechanical Properties
4. Discussion
5. Conclusions
Author Contributions
Funding
Institutional Review Board Statement
Informed Consent Statement
Data Availability Statement
Acknowledgments
Conflicts of Interest
References
- Hu, P.; Wang, Z. Flexural strength and fracture behavior of ZrB2–SiC ultra-high temperature ceramic composites at 1800 °C. J. Eur. Ceram. Soc. 2010, 30, 1021–1026. [Google Scholar] [CrossRef]
- Ma, X.; Wei, C.; Liu, R.; Li, S.; Zhang, Z.; Liu, L.; Wang, P.; Wang, Y. Ablative properties of laminated ZrB2-SiC ceramic modified by SiC whisker in oxyacetylene environment. Corros. Sci. 2021, 182, 109283. [Google Scholar] [CrossRef]
- Charpentier, L.; Miranda, P.; Tallaron, H.; Nogales, F.M.; Sández-Gómez, Á.; Bêche, E.; Balat-Pichelin, M. The Oxidation of ZrB2/MoSi2 Ceramics in Dissociated Air: The Influence of the Elaboration Technique. Materials 2024, 17, 3818. [Google Scholar] [CrossRef] [PubMed]
- Deal, B.E.; Grove, A.S. General relationship for the thermal oxidation of silicon. J. Appl. Phys. 1965, 36, 3770–3778. [Google Scholar] [CrossRef]
- Website of the AM-ACTS Project. Available online: https://am-acts.eu/ (accessed on 17 January 2025).
- Sández-Gómez, Á.; Ortiz, A.L.; Miranda, P. Production of complex microchanneled parts of ZrB2-MoSi2 ultra-high temperature ceramics by freeze casting and pressureless spark plasma sintering. J. Eur. Ceram. Soc. 2025, 45, 116966. [Google Scholar] [CrossRef]
- Balat-Pichelin, M.; Vesel, A. Neutral oxygen atom density in the MESOX air plasma solar furnace facility. Chem. Phys. 2006, 327, 112–118. [Google Scholar] [CrossRef]
- Balat-Pichelin, M.; Czerniak, M.; Badie, J.P. Thermal and chemical approaches for oxygen catalytic recombination evaluation on ceramic materials at high temperature. Appl. Surf. Sci. 1997, 120, 225–238. [Google Scholar] [CrossRef]
- Balat-Pichelin, M.; Badie, J.P.; Berjoan, R.; Boubert, P. Recombination coefficient of atomic oxygen on ceramic materials under earth re-entry conditions by optical emission spectroscopy. Chem. Phys. 2003, 291, 181–194. [Google Scholar] [CrossRef]
- Balat-Pichelin, M.; Hernandez, D.; Olalde, G.; Rivoire, B.; Robert, J.F. Concentrated solar energy as a diagnostic tool to study materials under extreme conditions. J. Sol. Energy Eng. 2002, 124, 215–222. [Google Scholar] [CrossRef]
- Rachinger, W.A. A Correction for the α1 α2 Doublet in the Measurement of Widths of X-ray Diffraction Lines. J. Sci. Instrum. 1948, 25, 254. [Google Scholar] [CrossRef]
- Beche, E.; Peraudeau, G.; Flaud, V.; Perarnau, D. An XPS investigation of (La2O3)1−x (CeO2)2x (ZrO2)2 compounds. Surf. Interface Anal. 2012, 44, 1045–1050. [Google Scholar] [CrossRef]
- Oliver, W.C.; Pharr, G.M. An improved technique for determining hardness and elastic modulus using load and displacement sensing indentation experiments. J. Mater. Res. 1992, 7, 1564–1583. [Google Scholar] [CrossRef]
- Oliver, W.C.; Pharr, G.M. Measurement of hardness and elastic modulus by instrumented indentation: Advances in understanding and refinements to methodology. J. Mater. Res. 2004, 19, 3–20. [Google Scholar] [CrossRef]
- Greenwood, J.A.; Tripp, J.H. The Contact of Two Nominally Flat Rough Surfaces. Proc. Inst. Mech. Eng. 1970, 185, 625–633. [Google Scholar] [CrossRef]
- Lugovy, M.; Slyunyayev, V.; Orlovskaya, N.; Mitrentsis, E.; Aneziris, C.G.; Graule, T.; Kuebler, J. Temperature dependence of elastic properties of ZrB2–SiC composites. Ceram. Int. 2016, 42, 2439–2445. [Google Scholar] [CrossRef]
- Grohsmeyer, R.J.; Silvestroni, L.; Hilmas, G.E.; Monteverde, F.; Fahrenholtz, W.G.; D’Angió, A.; Sciti, D. ZrB2-MoSi2 ceramics: A comprehensive overview of microstructure and properties relationships. Part II: Mechanical properties. J. Eur. Ceram. Soc. 2019, 39, 1948–1954. [Google Scholar] [CrossRef]
- Silvestroni, L.; Stricker, K.; Sciti, D.; Kleebe, H.J. Understanding the oxidation behavior of a ZrB2–MoSi2 composite at ultra-high temperatures. Acta Mater. 2018, 151, 216–228. [Google Scholar] [CrossRef]
- Alfano, D.; Scatteia, L.; Monteverde, E.; Bêche, E.; Balat-Pichelin, M. Microstructural characterization of ZrB2–SiC based UHTC tested in the MESOX plasma facility. J. Eur. Ceram. Soc. 2010, 30, 2345–2355. [Google Scholar] [CrossRef]
- Campos, T.M.B.; Ramos, N.C.; Matos, J.D.M.; Thim, G.P.; Souza, R.O.A.; Bottino, M.A.; Valandro, L.F.; Melo, R.M. Silica infiltration in partially stabilized zirconia: Effect of hydrothermal aging on mechanical properties. J. Mech. Behav. Biomed. Mater. 2020, 109, 103774. [Google Scholar] [CrossRef] [PubMed]
 : ZrB2;
  : MoSi2.
: ZrB2; : MoSi2.
: MoSi2.
: ZrB2; : MoSi2.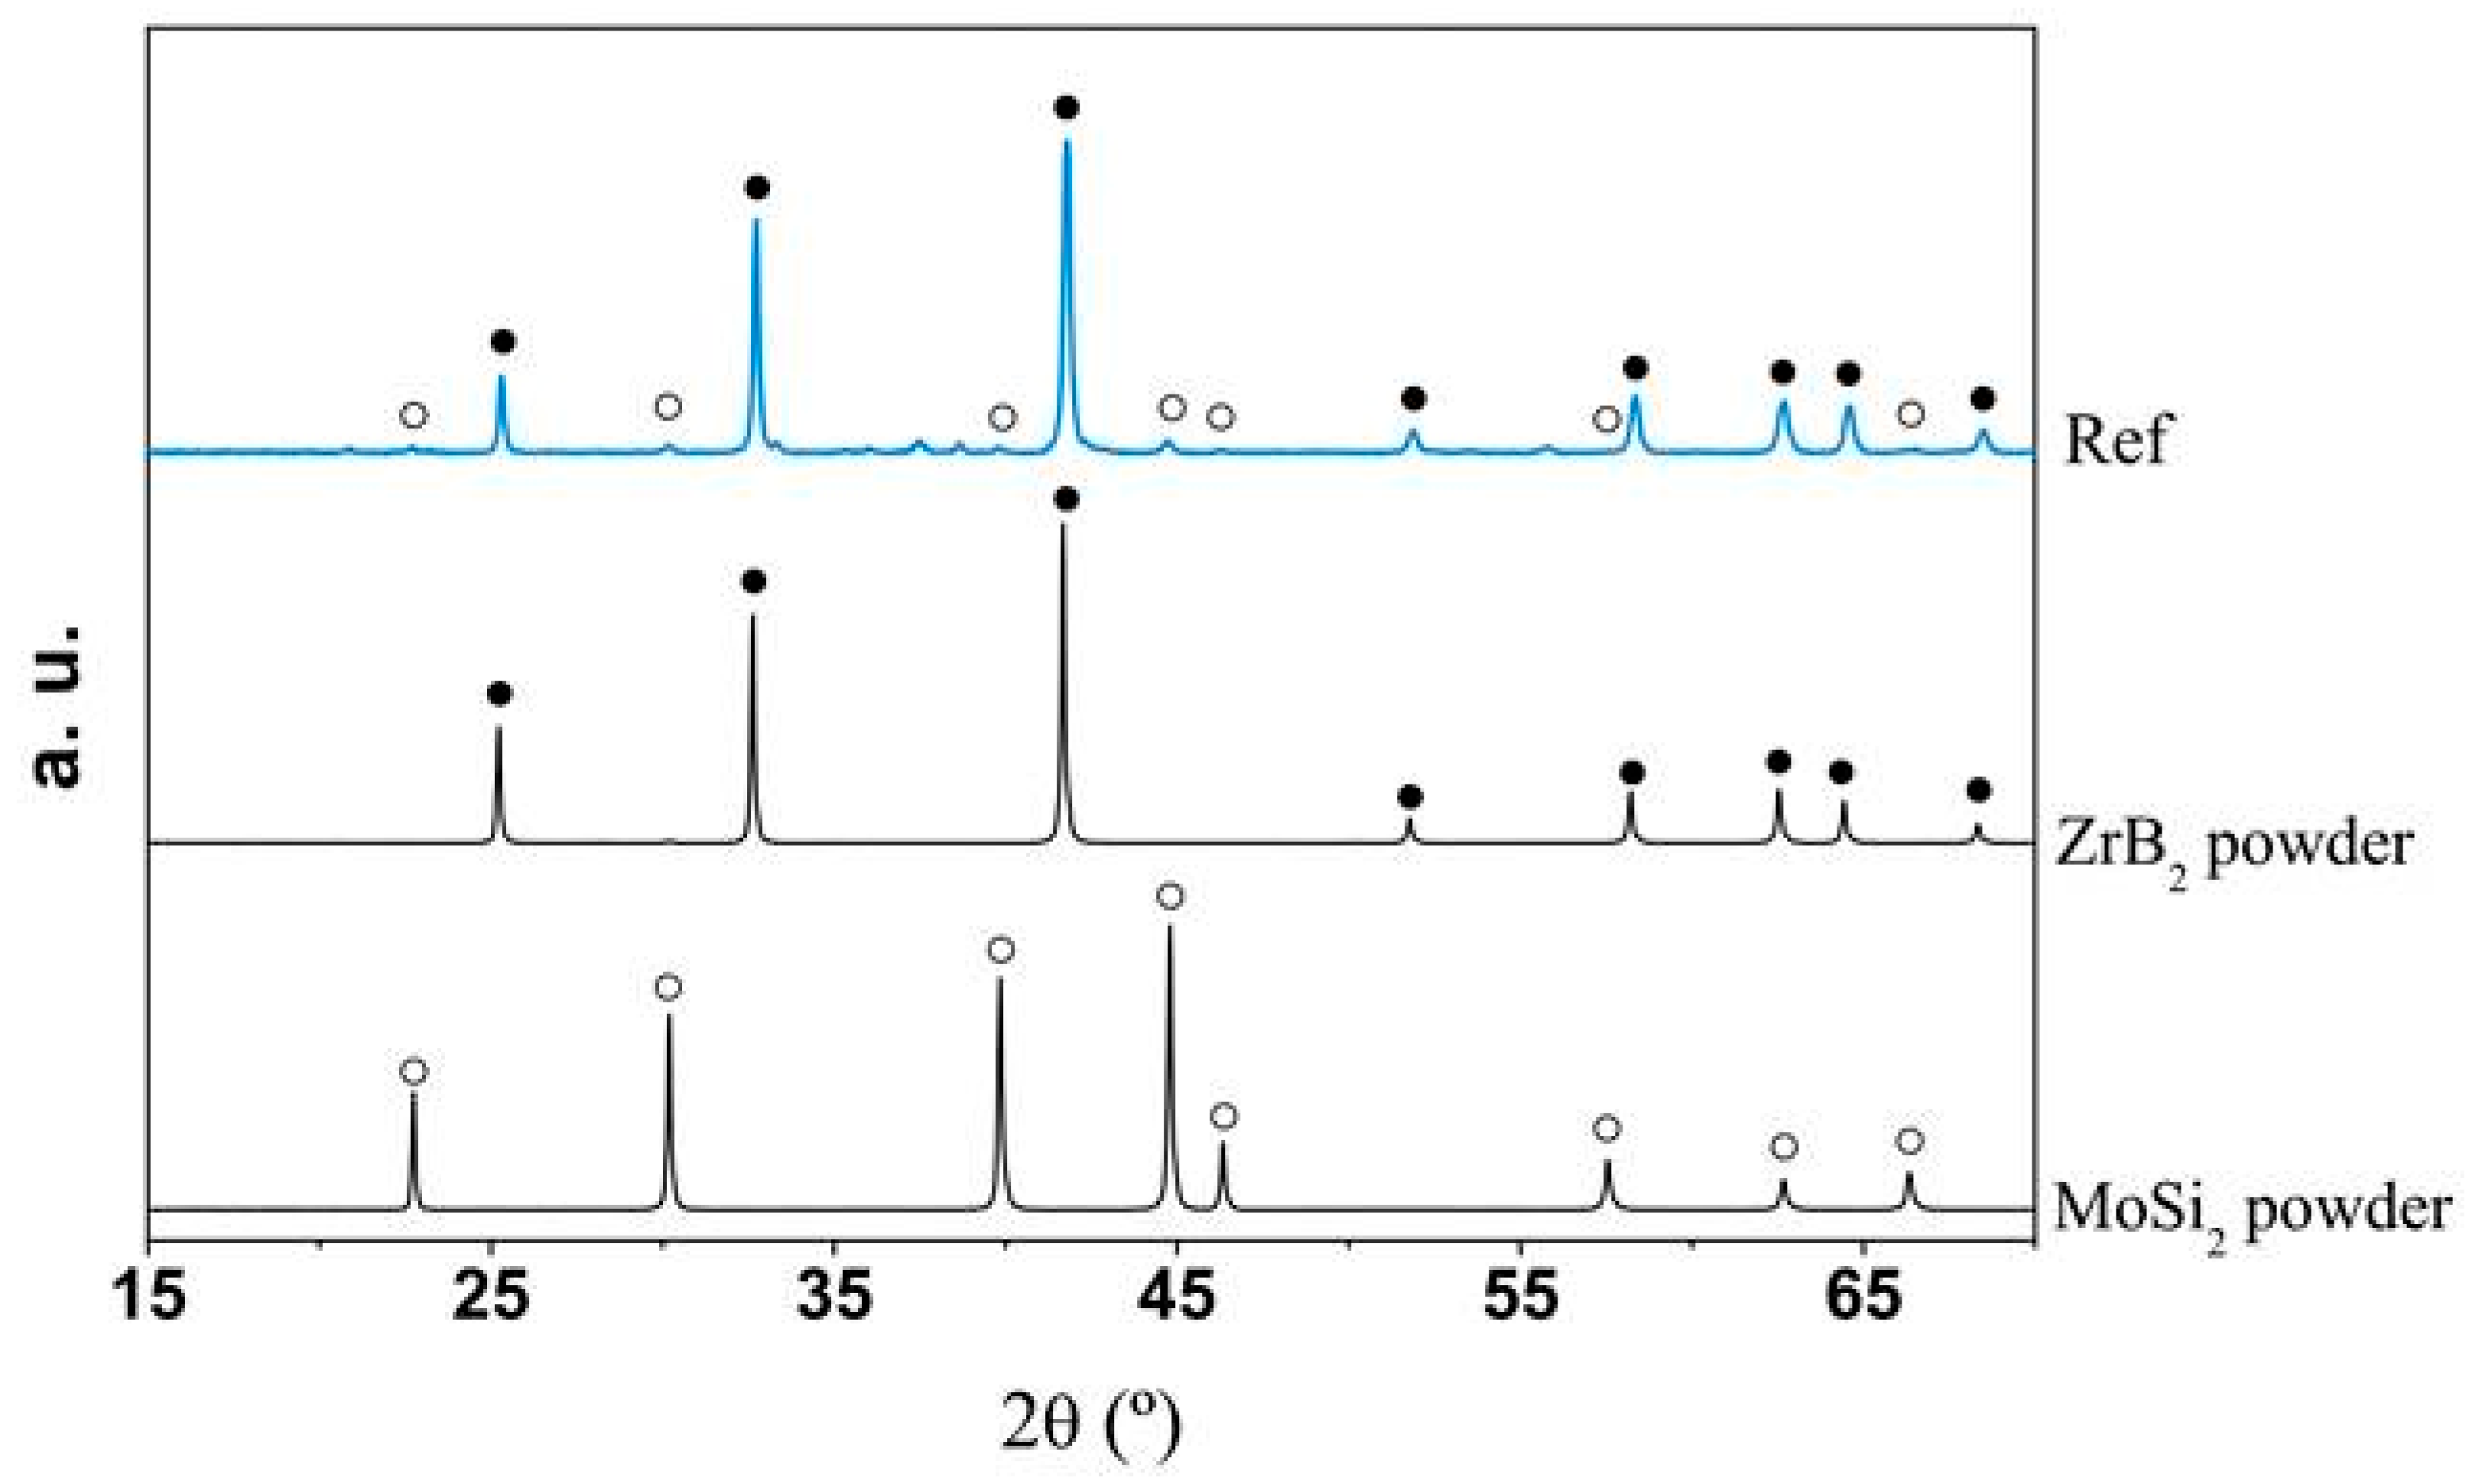
 : m-ZrO2;
  : t-ZrO2;
  : MoB.
: m-ZrO2; : t-ZrO2; : MoB.
: MoB.
: m-ZrO2; : t-ZrO2; : MoB.
 : m-ZrO2;
  : t-ZrO2.
: m-ZrO2; : t-ZrO2.
: t-ZrO2.
: m-ZrO2; : t-ZrO2.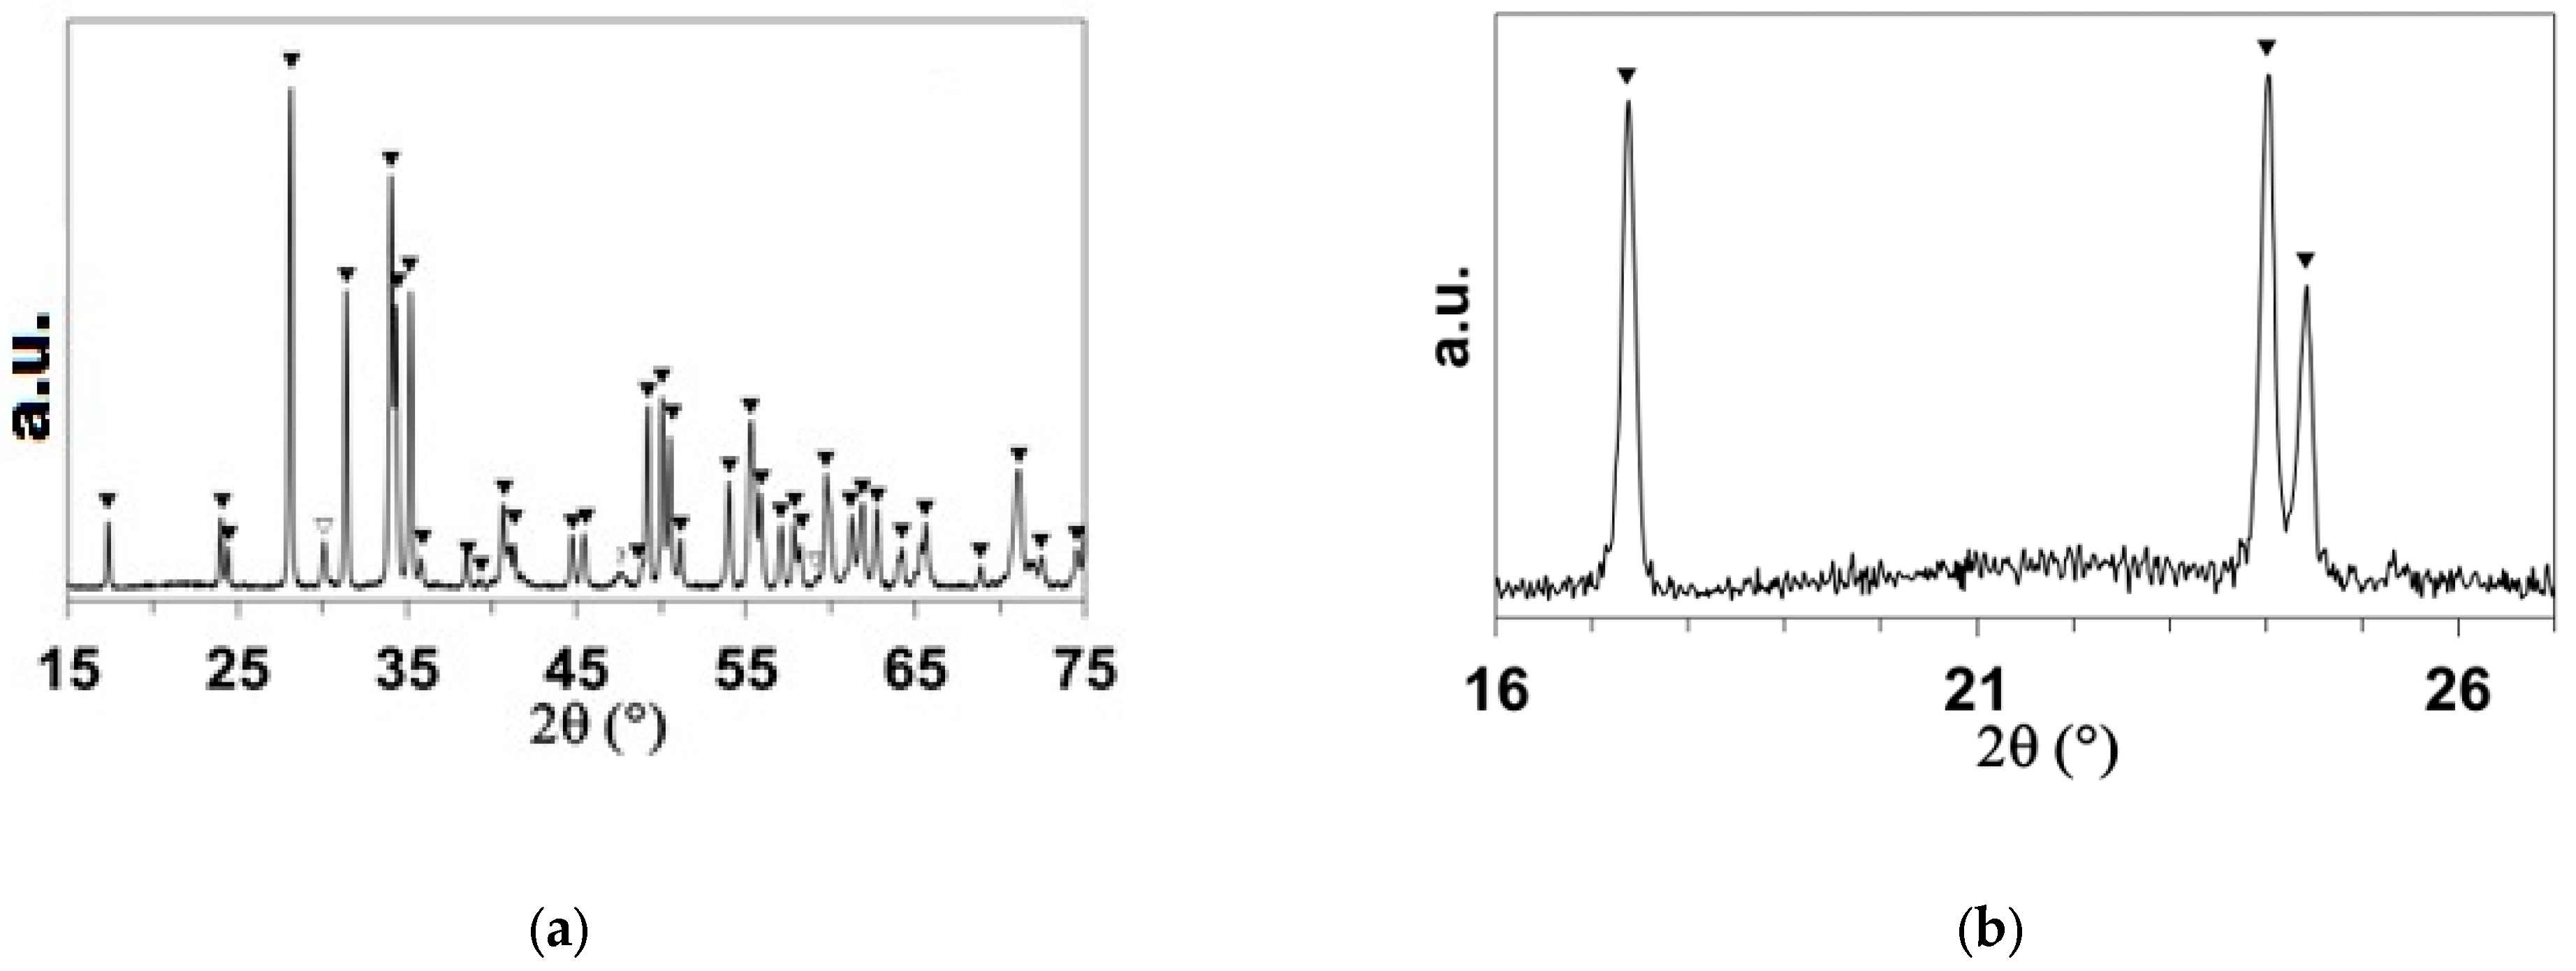

Disclaimer/Publisher’s Note: The statements, opinions and data contained in all publications are solely those of the individual author(s) and contributor(s) and not of MDPI and/or the editor(s). MDPI and/or the editor(s) disclaim responsibility for any injury to people or property resulting from any ideas, methods, instructions or products referred to in the content. |
© 2025 by the authors. Licensee MDPI, Basel, Switzerland. This article is an open access article distributed under the terms and conditions of the Creative Commons Attribution (CC BY) license (https://creativecommons.org/licenses/by/4.0/).
Share and Cite
Charpentier, L.; Bêche, E.; Glénat, H.; Sández-Gómez, Á.; Miranda, P. The Impact of Cyclic Oxidation in Dissociated Air on the Mechanical Properties of Freeze-Cast ZrB2/MoSi2 Ceramics. Materials 2025, 18, 1815. https://doi.org/10.3390/ma18081815
Charpentier L, Bêche E, Glénat H, Sández-Gómez Á, Miranda P. The Impact of Cyclic Oxidation in Dissociated Air on the Mechanical Properties of Freeze-Cast ZrB2/MoSi2 Ceramics. Materials. 2025; 18(8):1815. https://doi.org/10.3390/ma18081815
Chicago/Turabian StyleCharpentier, Ludovic, Eric Bêche, Hervé Glénat, Álvaro Sández-Gómez, and Pedro Miranda. 2025. "The Impact of Cyclic Oxidation in Dissociated Air on the Mechanical Properties of Freeze-Cast ZrB2/MoSi2 Ceramics" Materials 18, no. 8: 1815. https://doi.org/10.3390/ma18081815
APA StyleCharpentier, L., Bêche, E., Glénat, H., Sández-Gómez, Á., & Miranda, P. (2025). The Impact of Cyclic Oxidation in Dissociated Air on the Mechanical Properties of Freeze-Cast ZrB2/MoSi2 Ceramics. Materials, 18(8), 1815. https://doi.org/10.3390/ma18081815