Chemical derivatization of chitin and chitosan have used starting materials of varying molecular weights under heterogeneous as well as homogeneous reaction conditions. As a rule higher molecular weights and heterogeneous reactions tend to give products that are diverse in properties and difficult to characterize. Lower molecular weights and homogeneous reactions give more consistent products as the biopolymer nature permits. In this work, we have elected to utilize shrimp shells as the source of chitin from a reliable supplier. Shrimp shell chitin has typical molecular weights <500 KDa and a lower inorganic content compared to crab or lobster shells. Therefore, the isolation of chitin is normally milder and a better quality raw material is expected.
2.1. Preparation and Characterization of Low Molecular Weight Chitin
The solubility of chitin in DMAc/LiCl improves dramatically with decreasing molecular weight that greatly facilitates chemical modifications compared to high molecular weight chitin solutions that have high viscosities that do not readily enable chemical modifications [
11]. Chitin is readily depolymerized to lower molecular weight chitin, oligmers or a monomer mixture of glucosamine and N-acetyl-glucosamine by either enzymatic or mineral acids hydrolysis. Hydrochloric acid has been shown effective in hydrolyzing chitin in a short time without significant deacetylation [
12]. In addition, there are no side reactions with HCl, compared to H
2SO
4 where O-sulfation has been found [
13].
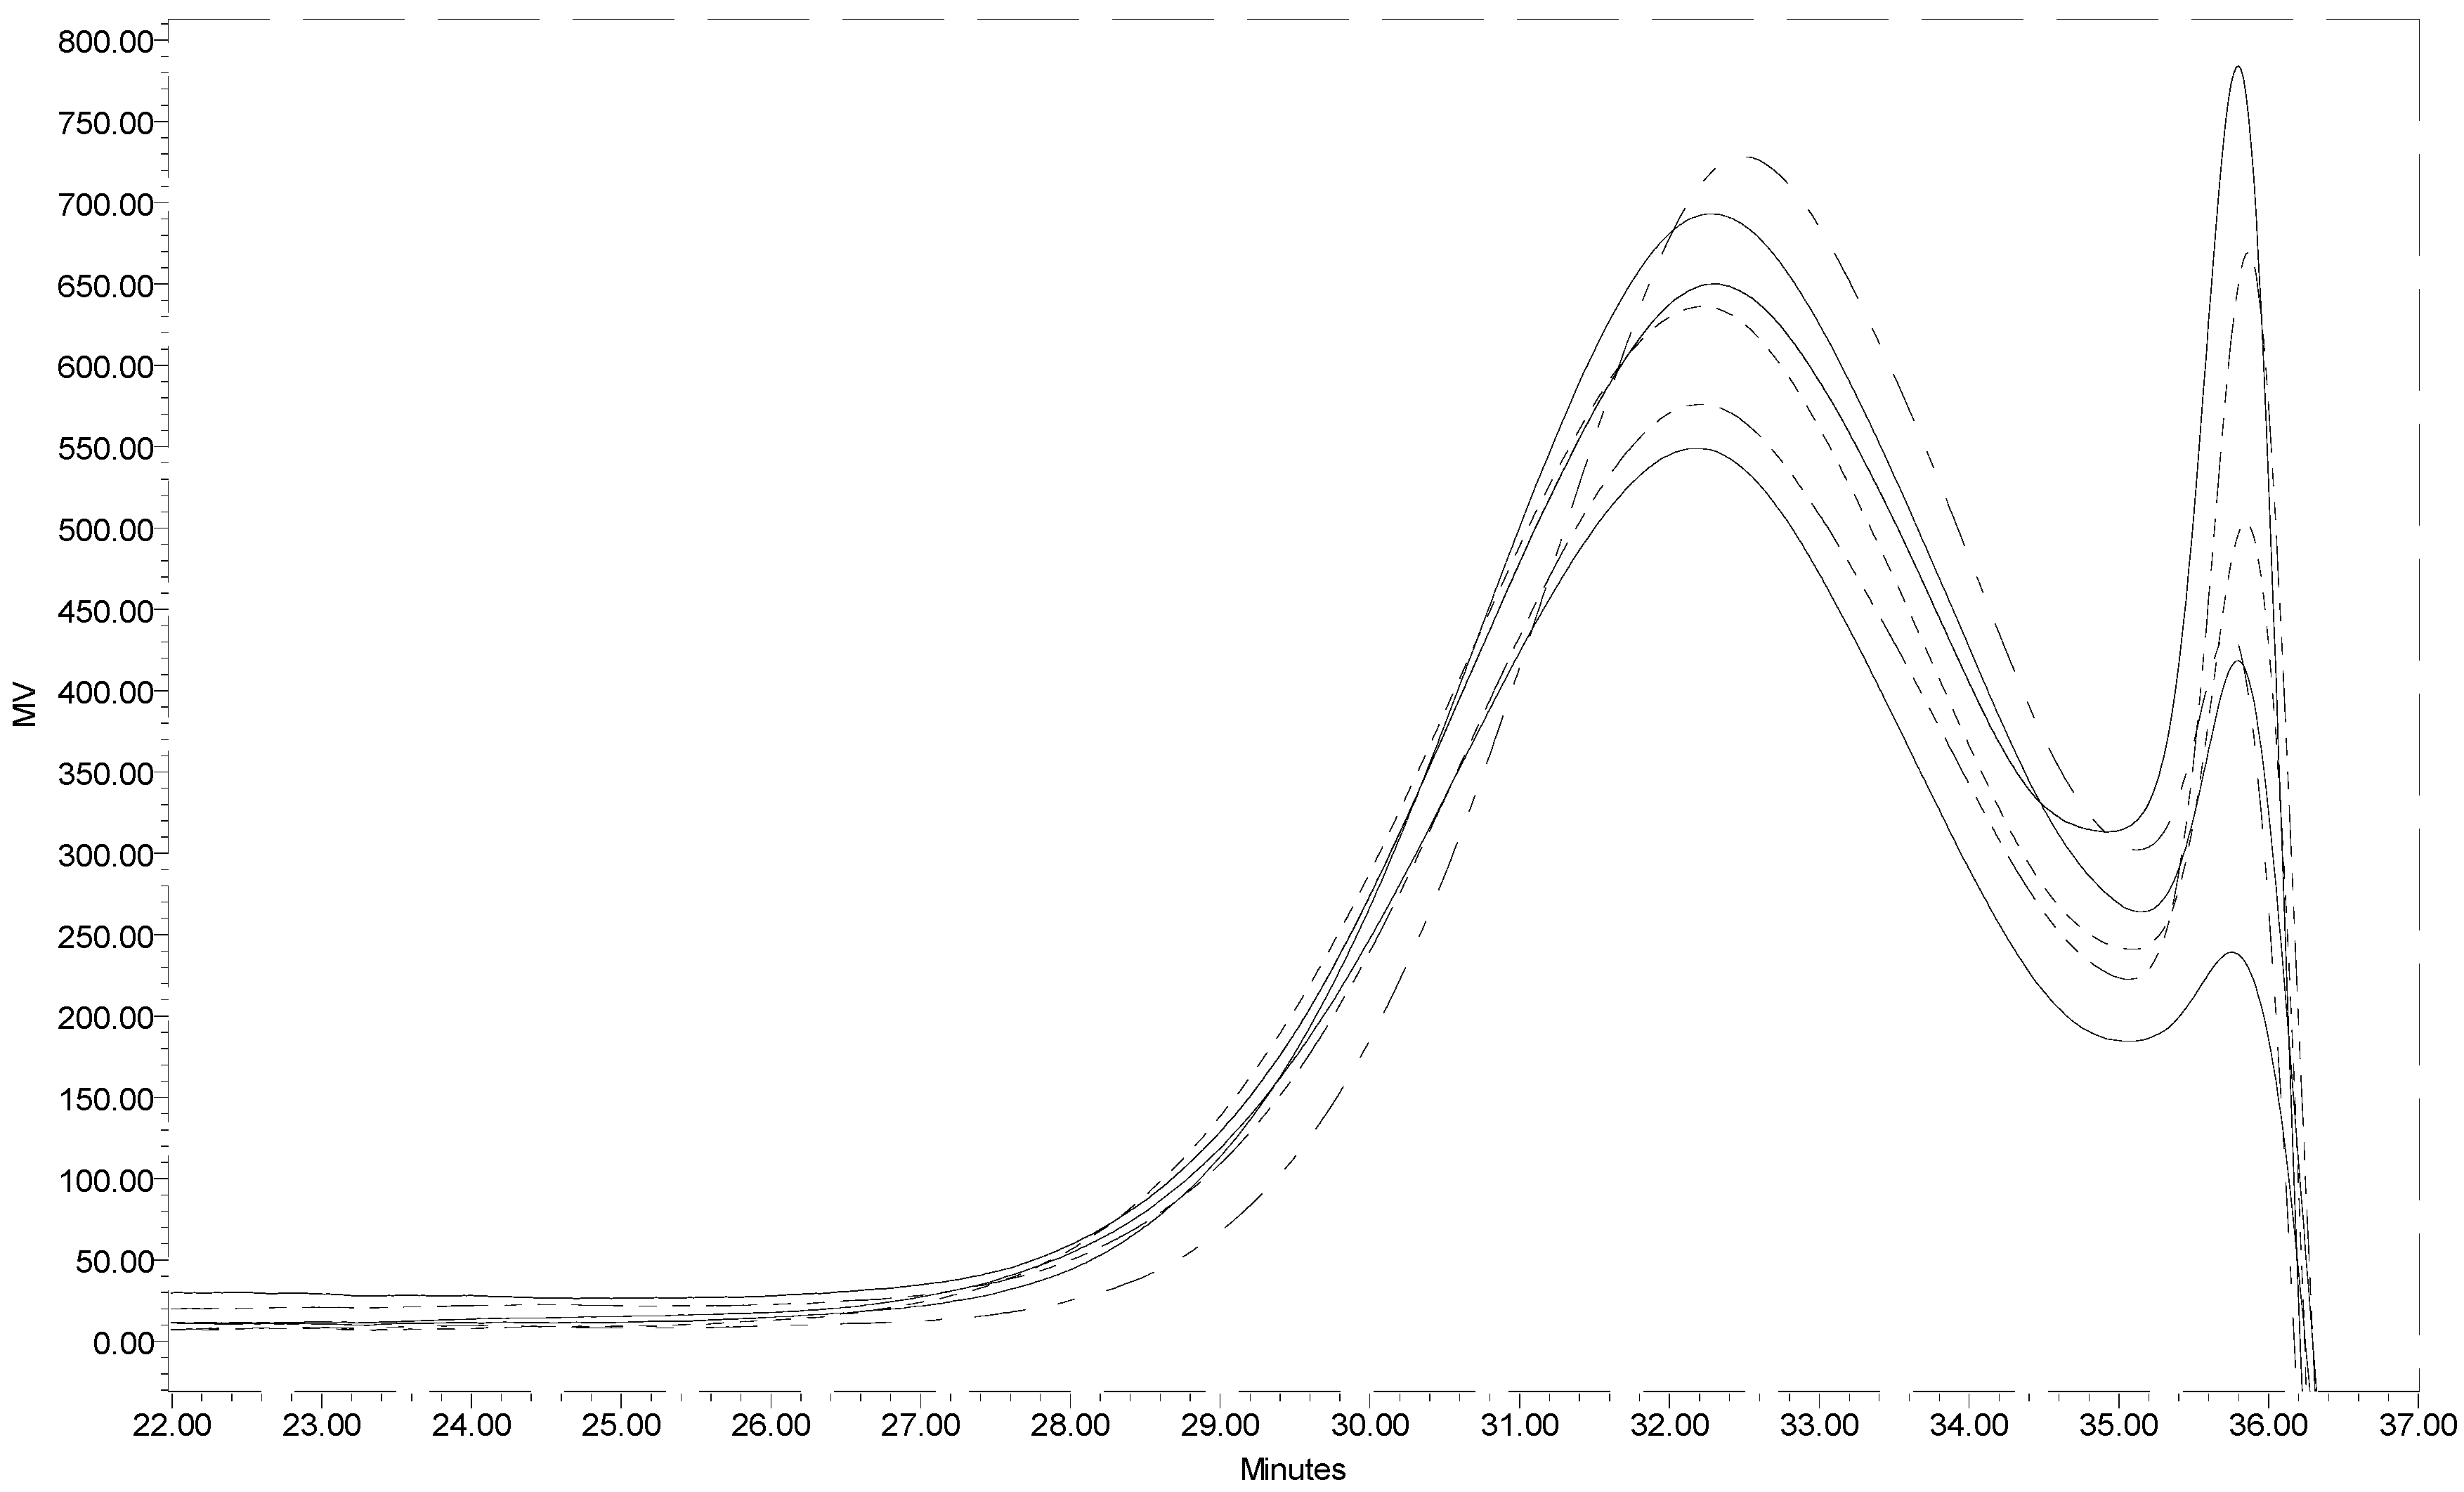
Figure 1 presents the GPC profiles of six individual batches of low molecular weight chitin prepared under the same hydrolysis conditions. The closeness of the GPC profiles for the six samples warrants that reproducibility is acceptable. The weight average molecular weight for the low molecular weight chitin prepared in this work based on an average of the six samples was determined to be 10KDa. This means that concentrated HCl was able to depolymerize high molecular weight chitin (in this work estimated to be ~240 KDa) in a short time (15 min). Utilization of a 12 KDa mw cut-off dialysis membrane in this instance was permissible because chitin even at 10KDa is water insoluble and is retained in the dialysis membrane. The dialysis membrane permits the separation of water-soluble small molecular weight oligomers considered as by-products of chitin hydrolysis, giving a narrower molecular weight distribution.
The degree of N-acetylation was estimated from FTIR to be 88% and is high enough to satisfy the hydrolysis product as chitin. The average yield of low molecular weight chitin from the acid hydrolysis was approximately 60%, suggesting that the acid hydrolyzed the remainder component to even smaller oligomers of N-acetylglucosamine and N-glucosamine.
Figure 1.
Segments of the GPC profiles of six low molecular weight chitin samples.
Figure 1.
Segments of the GPC profiles of six low molecular weight chitin samples.
2.2. Preparation and Characterization of Chitin-Methacrylate
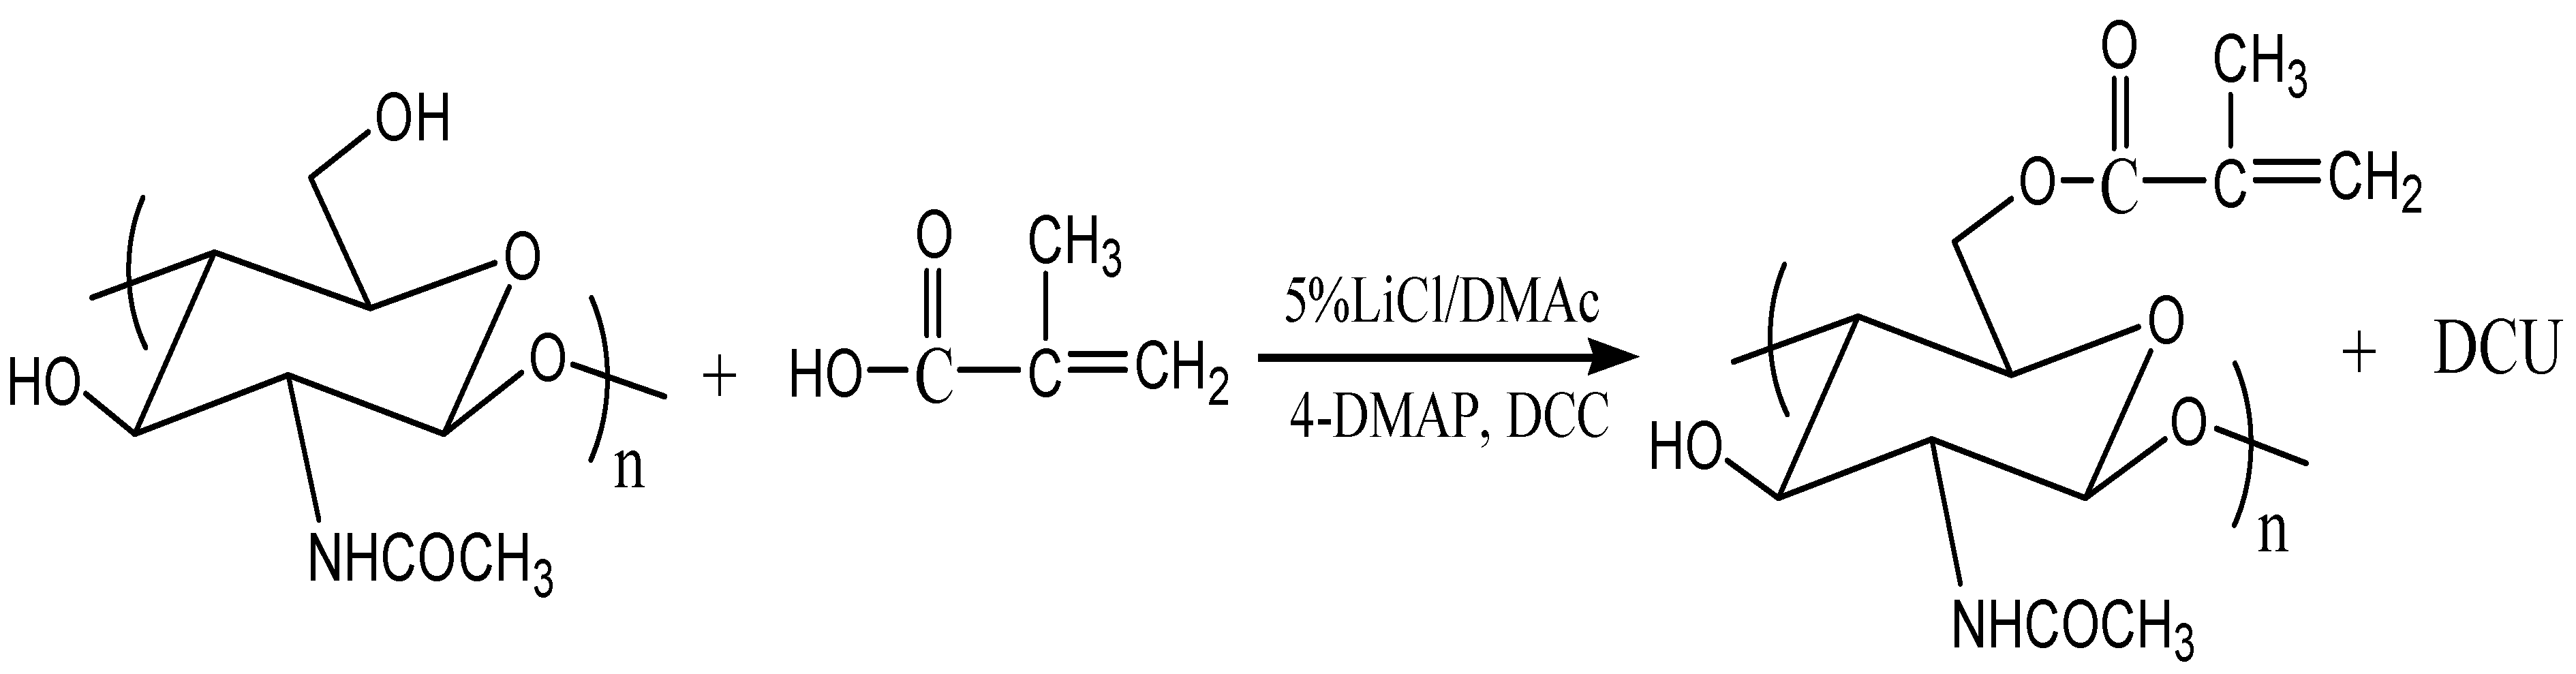
The chemical derivatization of chitin with methacrylic acid, in the presence of N,N'-dicyclocarbodiimide (DCC) as coupling agent and 4-dimethylaminopyridine (DMAP) as co-catalyst, to give chitin-methacrylate was straightforward. The FT-IR and NMR spectra shown in
Figure 2,
Figure 3, and
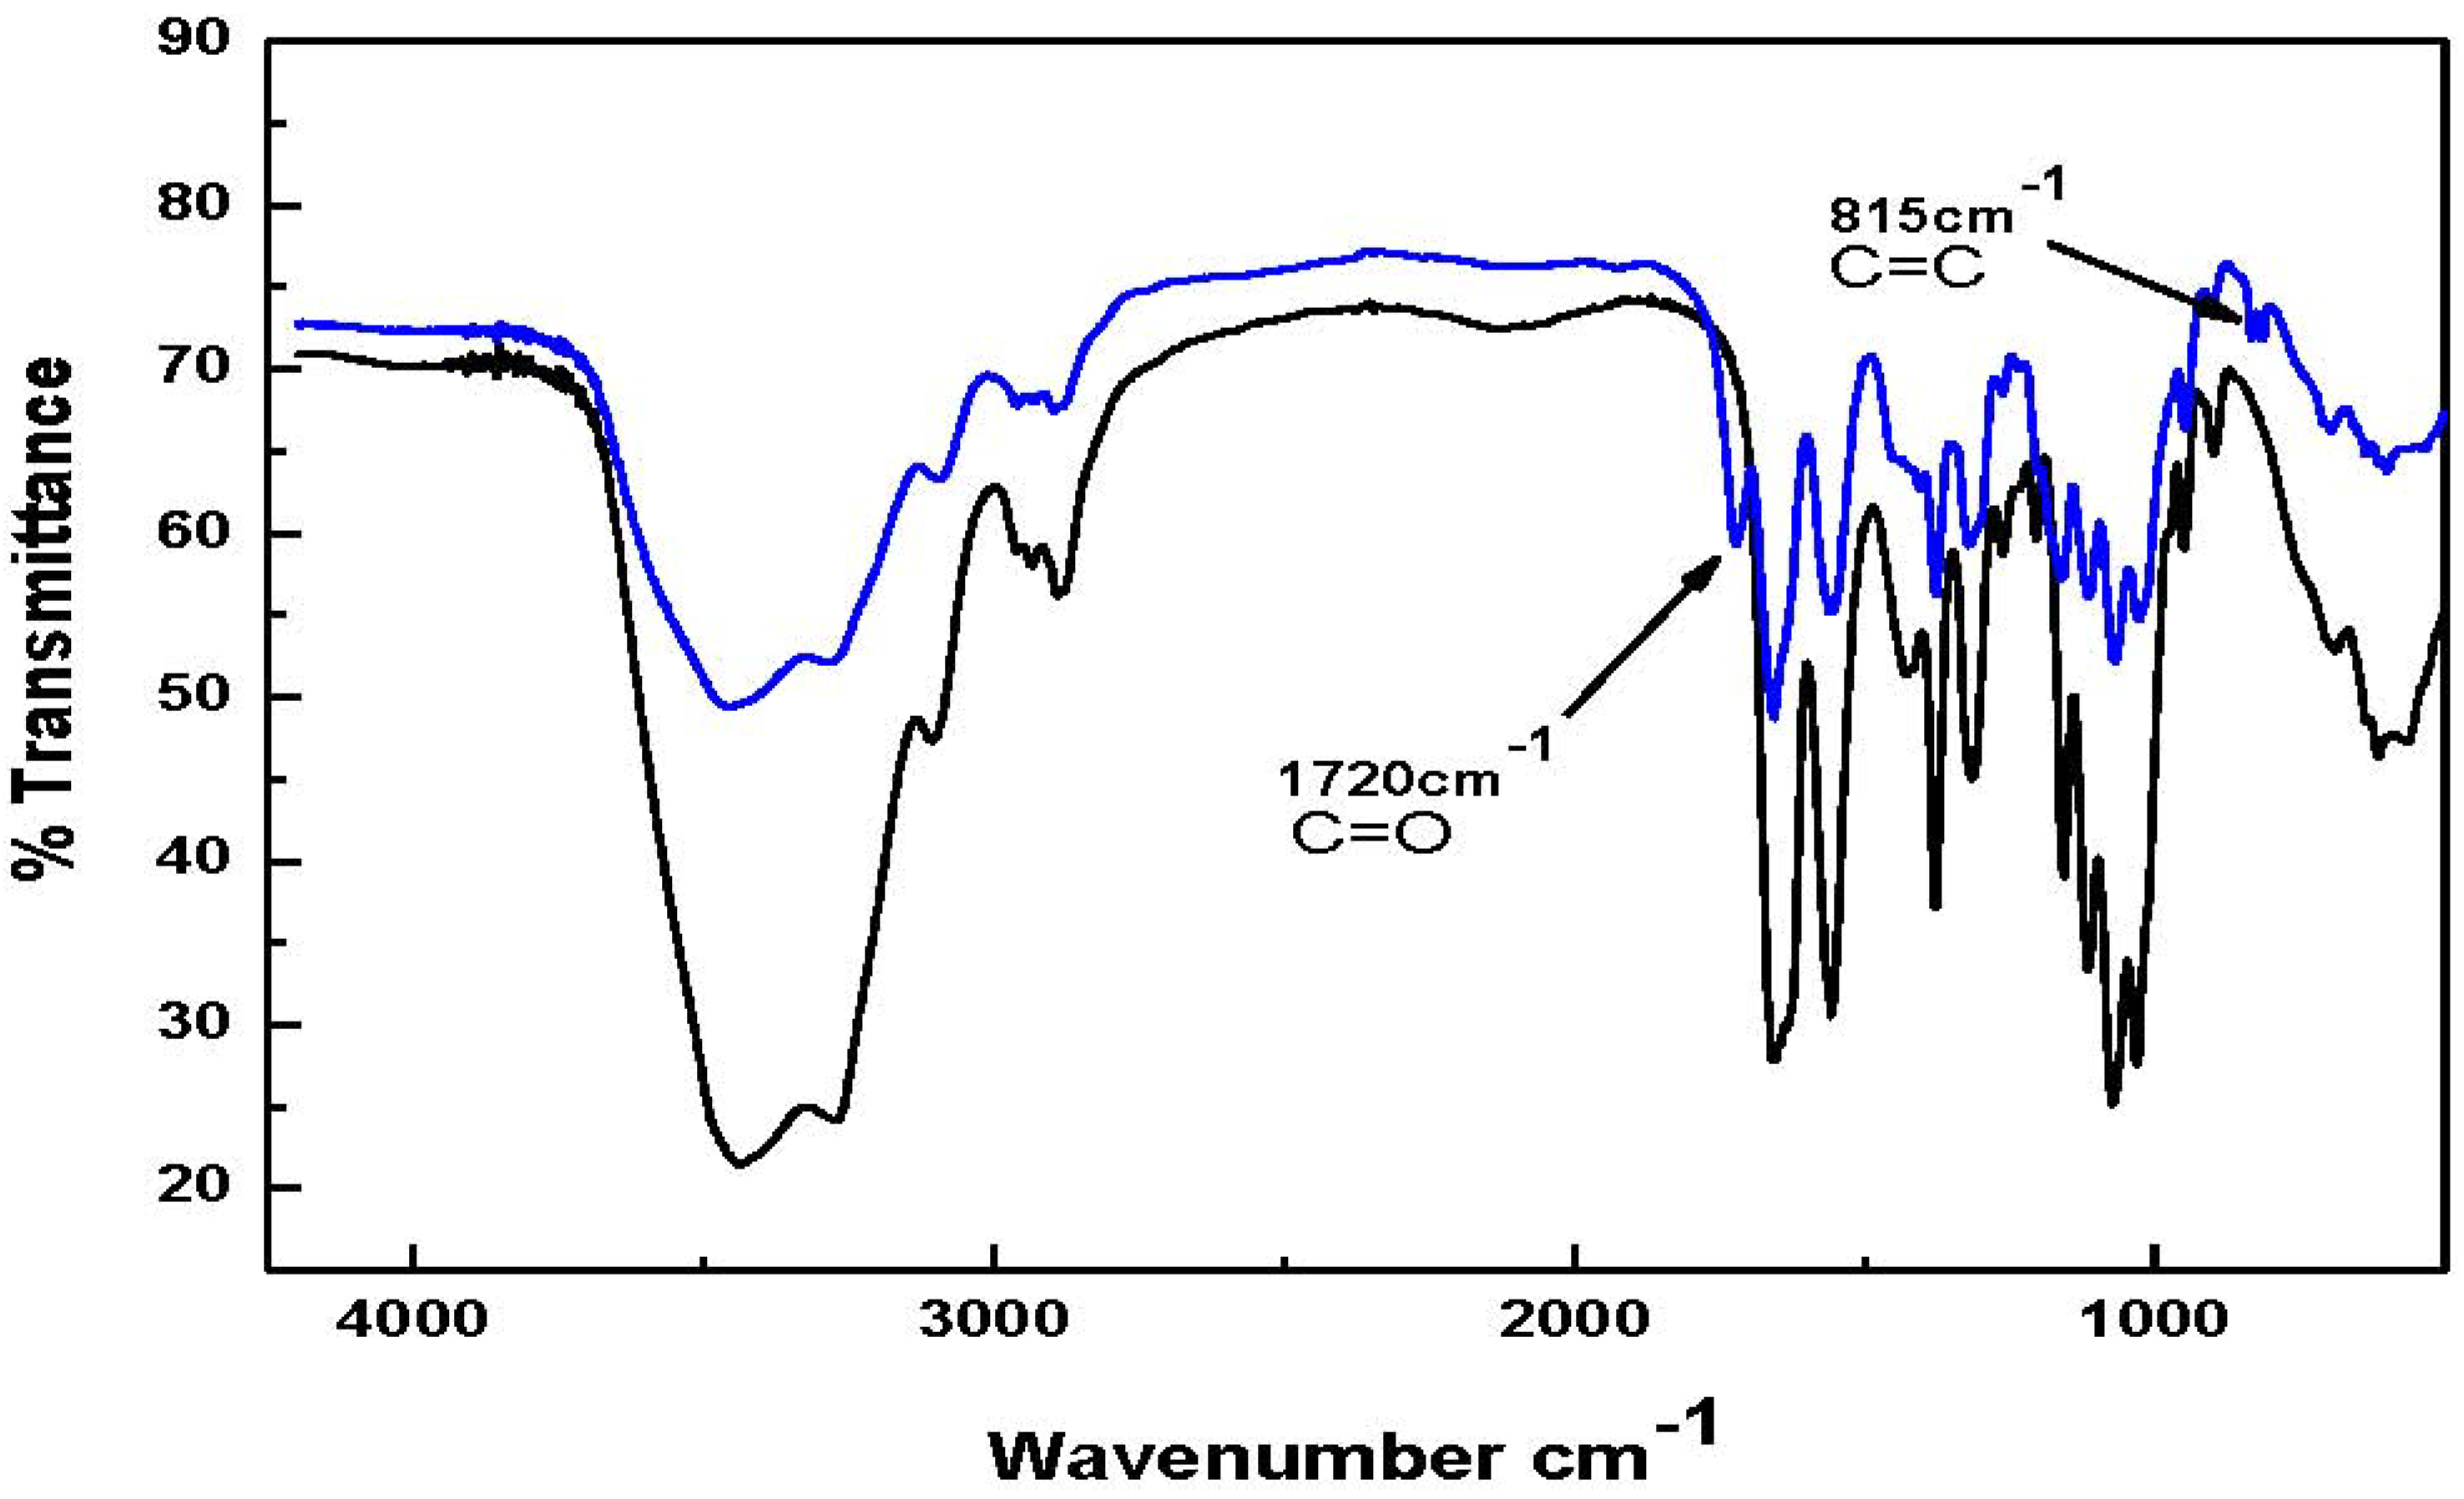
Figure 4 were used to elucidate the structure. In
Figure 2, the FT-IR spectrum for chitin-methacrylate show the additional band at 1720 cm
−1 attributed to the stretching of the methacrylate carbonyl group together with another band at 815 cm
−1 ascribed to the pendant vinyl group of methacrylate on the chitin backbone [
14]. Both absorbances are absent in the low molecular weight chitin spectrum.
In the
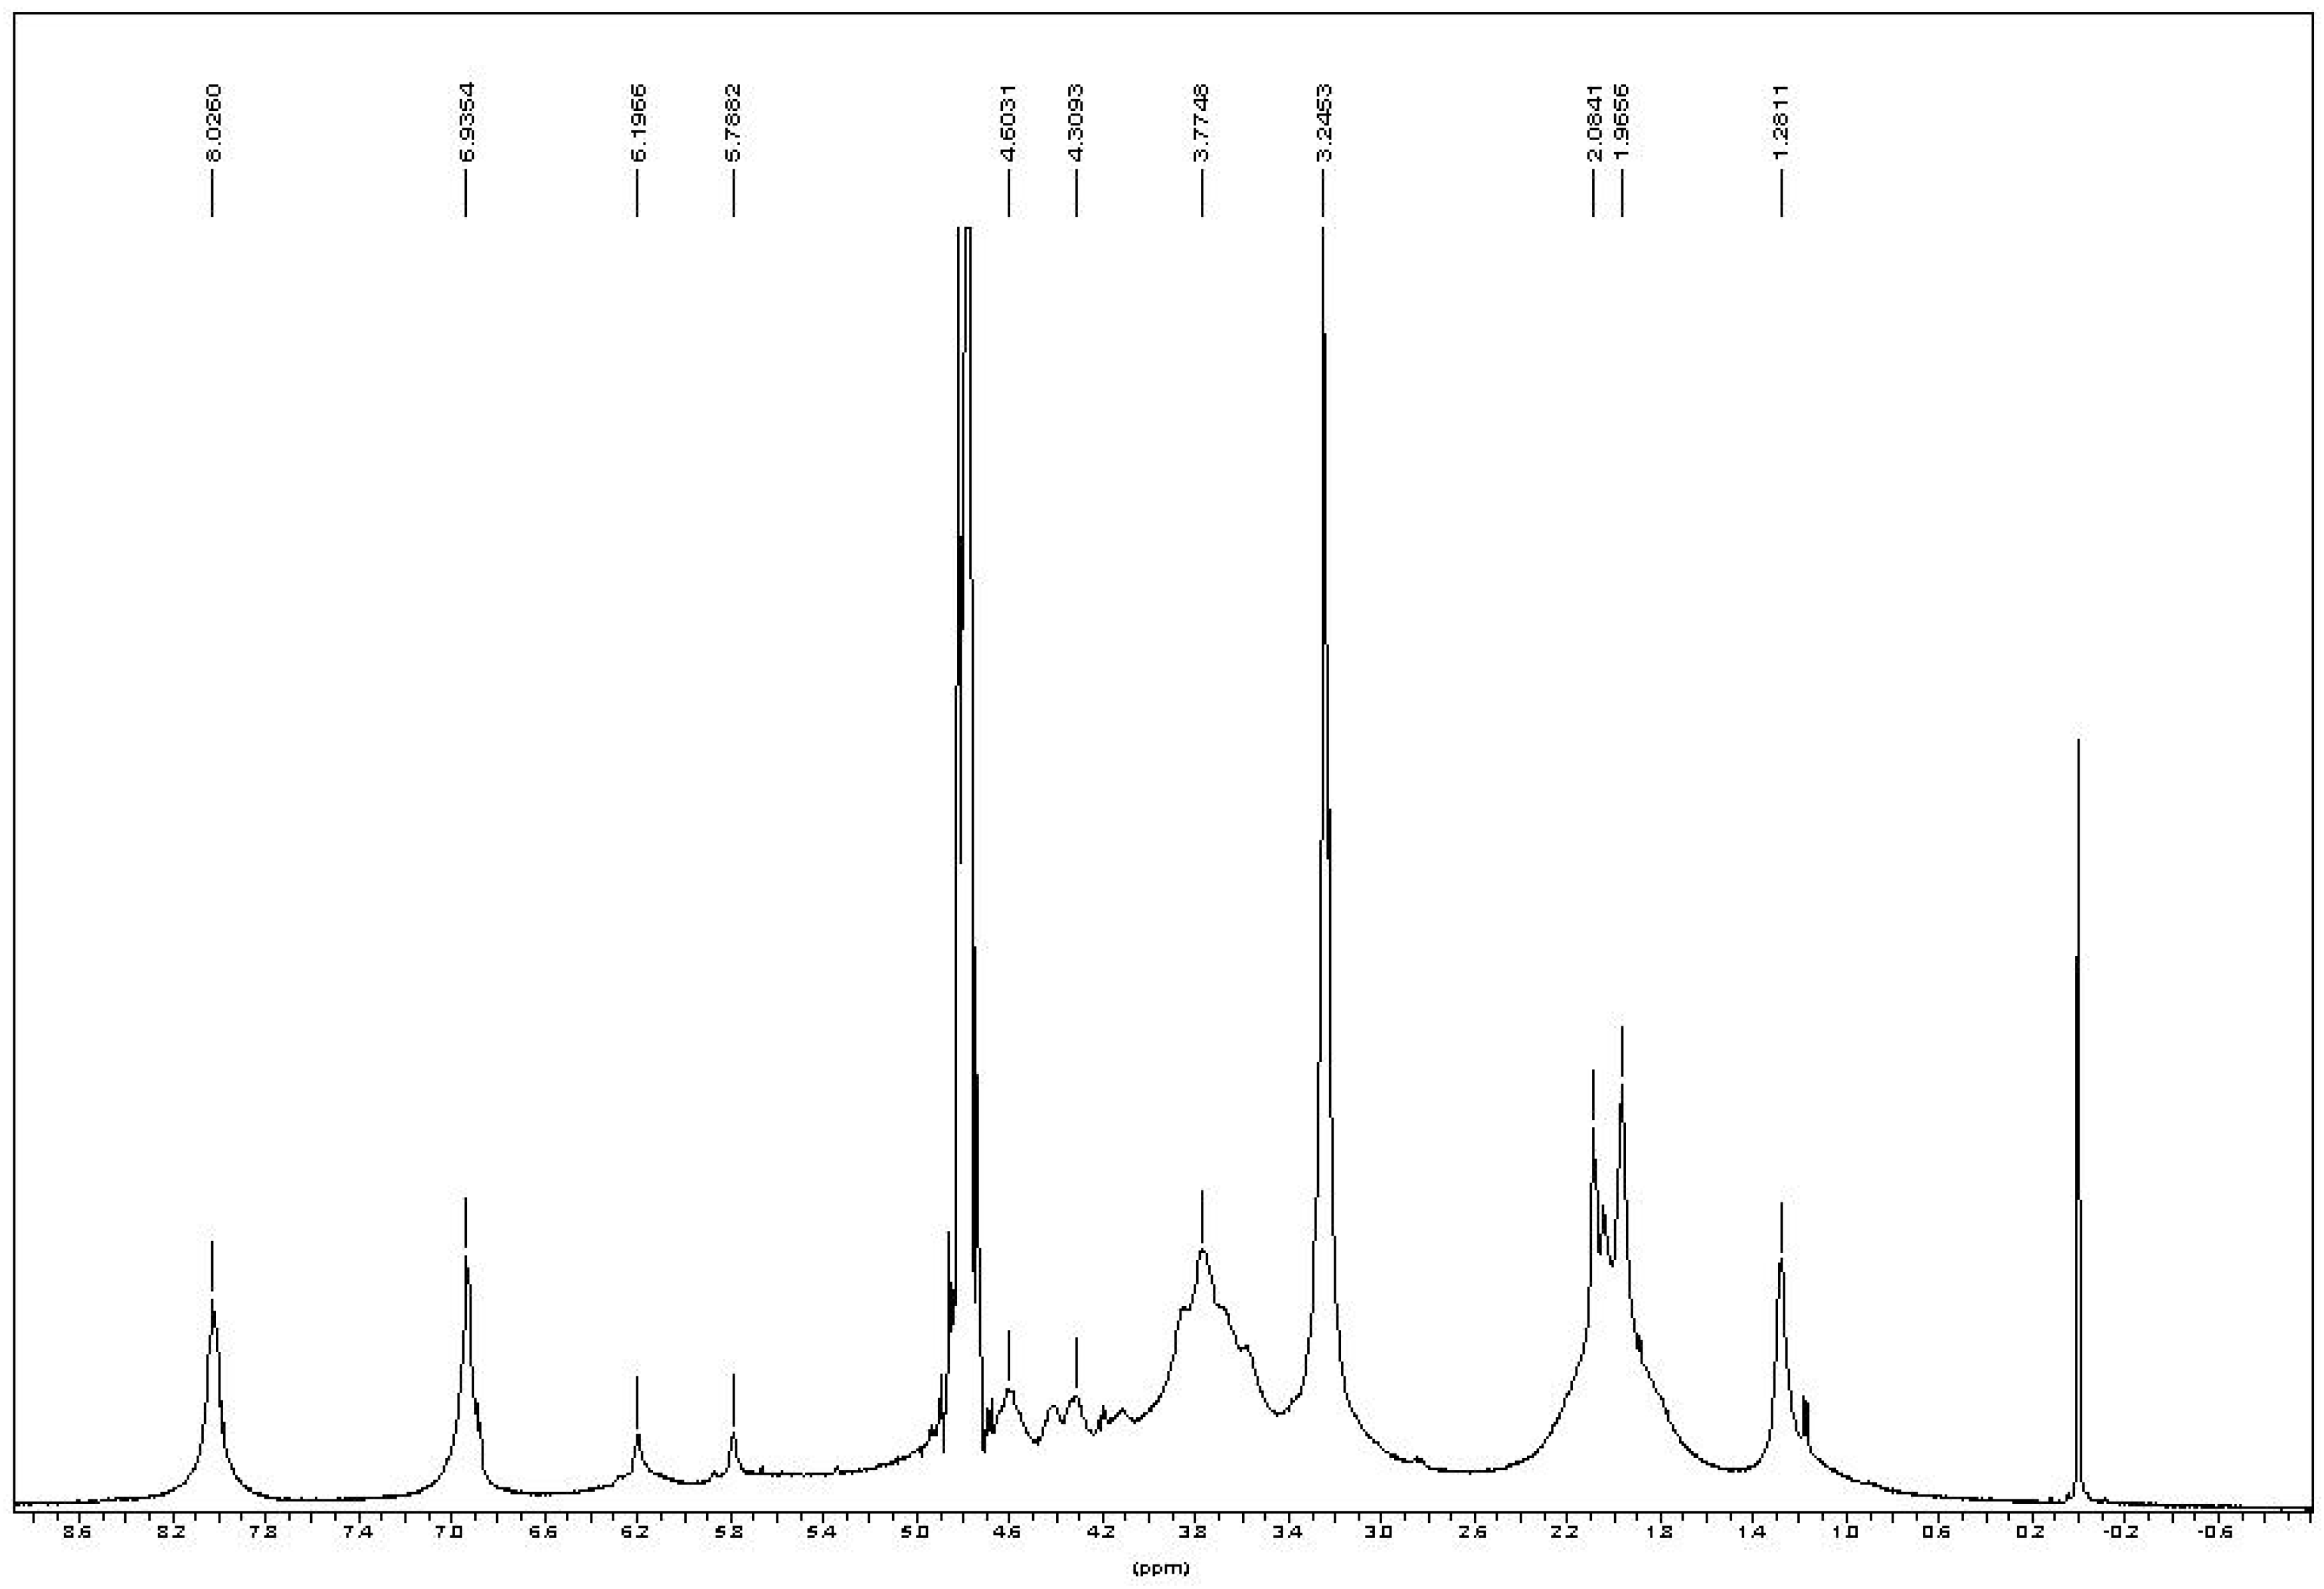
1H-NMR spectrum of chitin-methacrylate (
Figure 3), there are two peaks at 5.18 and 5.77 ppm corresponding to the two the protons of –C=CH
2 of the methacrylate group, while the 1.96 ppm peak is attributed to the -CH
3 group on methacrylate. Other chemical shifts are assigned to the chitin backbone protons,
i.e., 4.6 ppm at C1, the broad peaks between 3.4–4.2 ppm are the C2–C5, and the typical chemical shift at 2.08 ppm to the -CH
3 on the N-acetyl group of chitin.
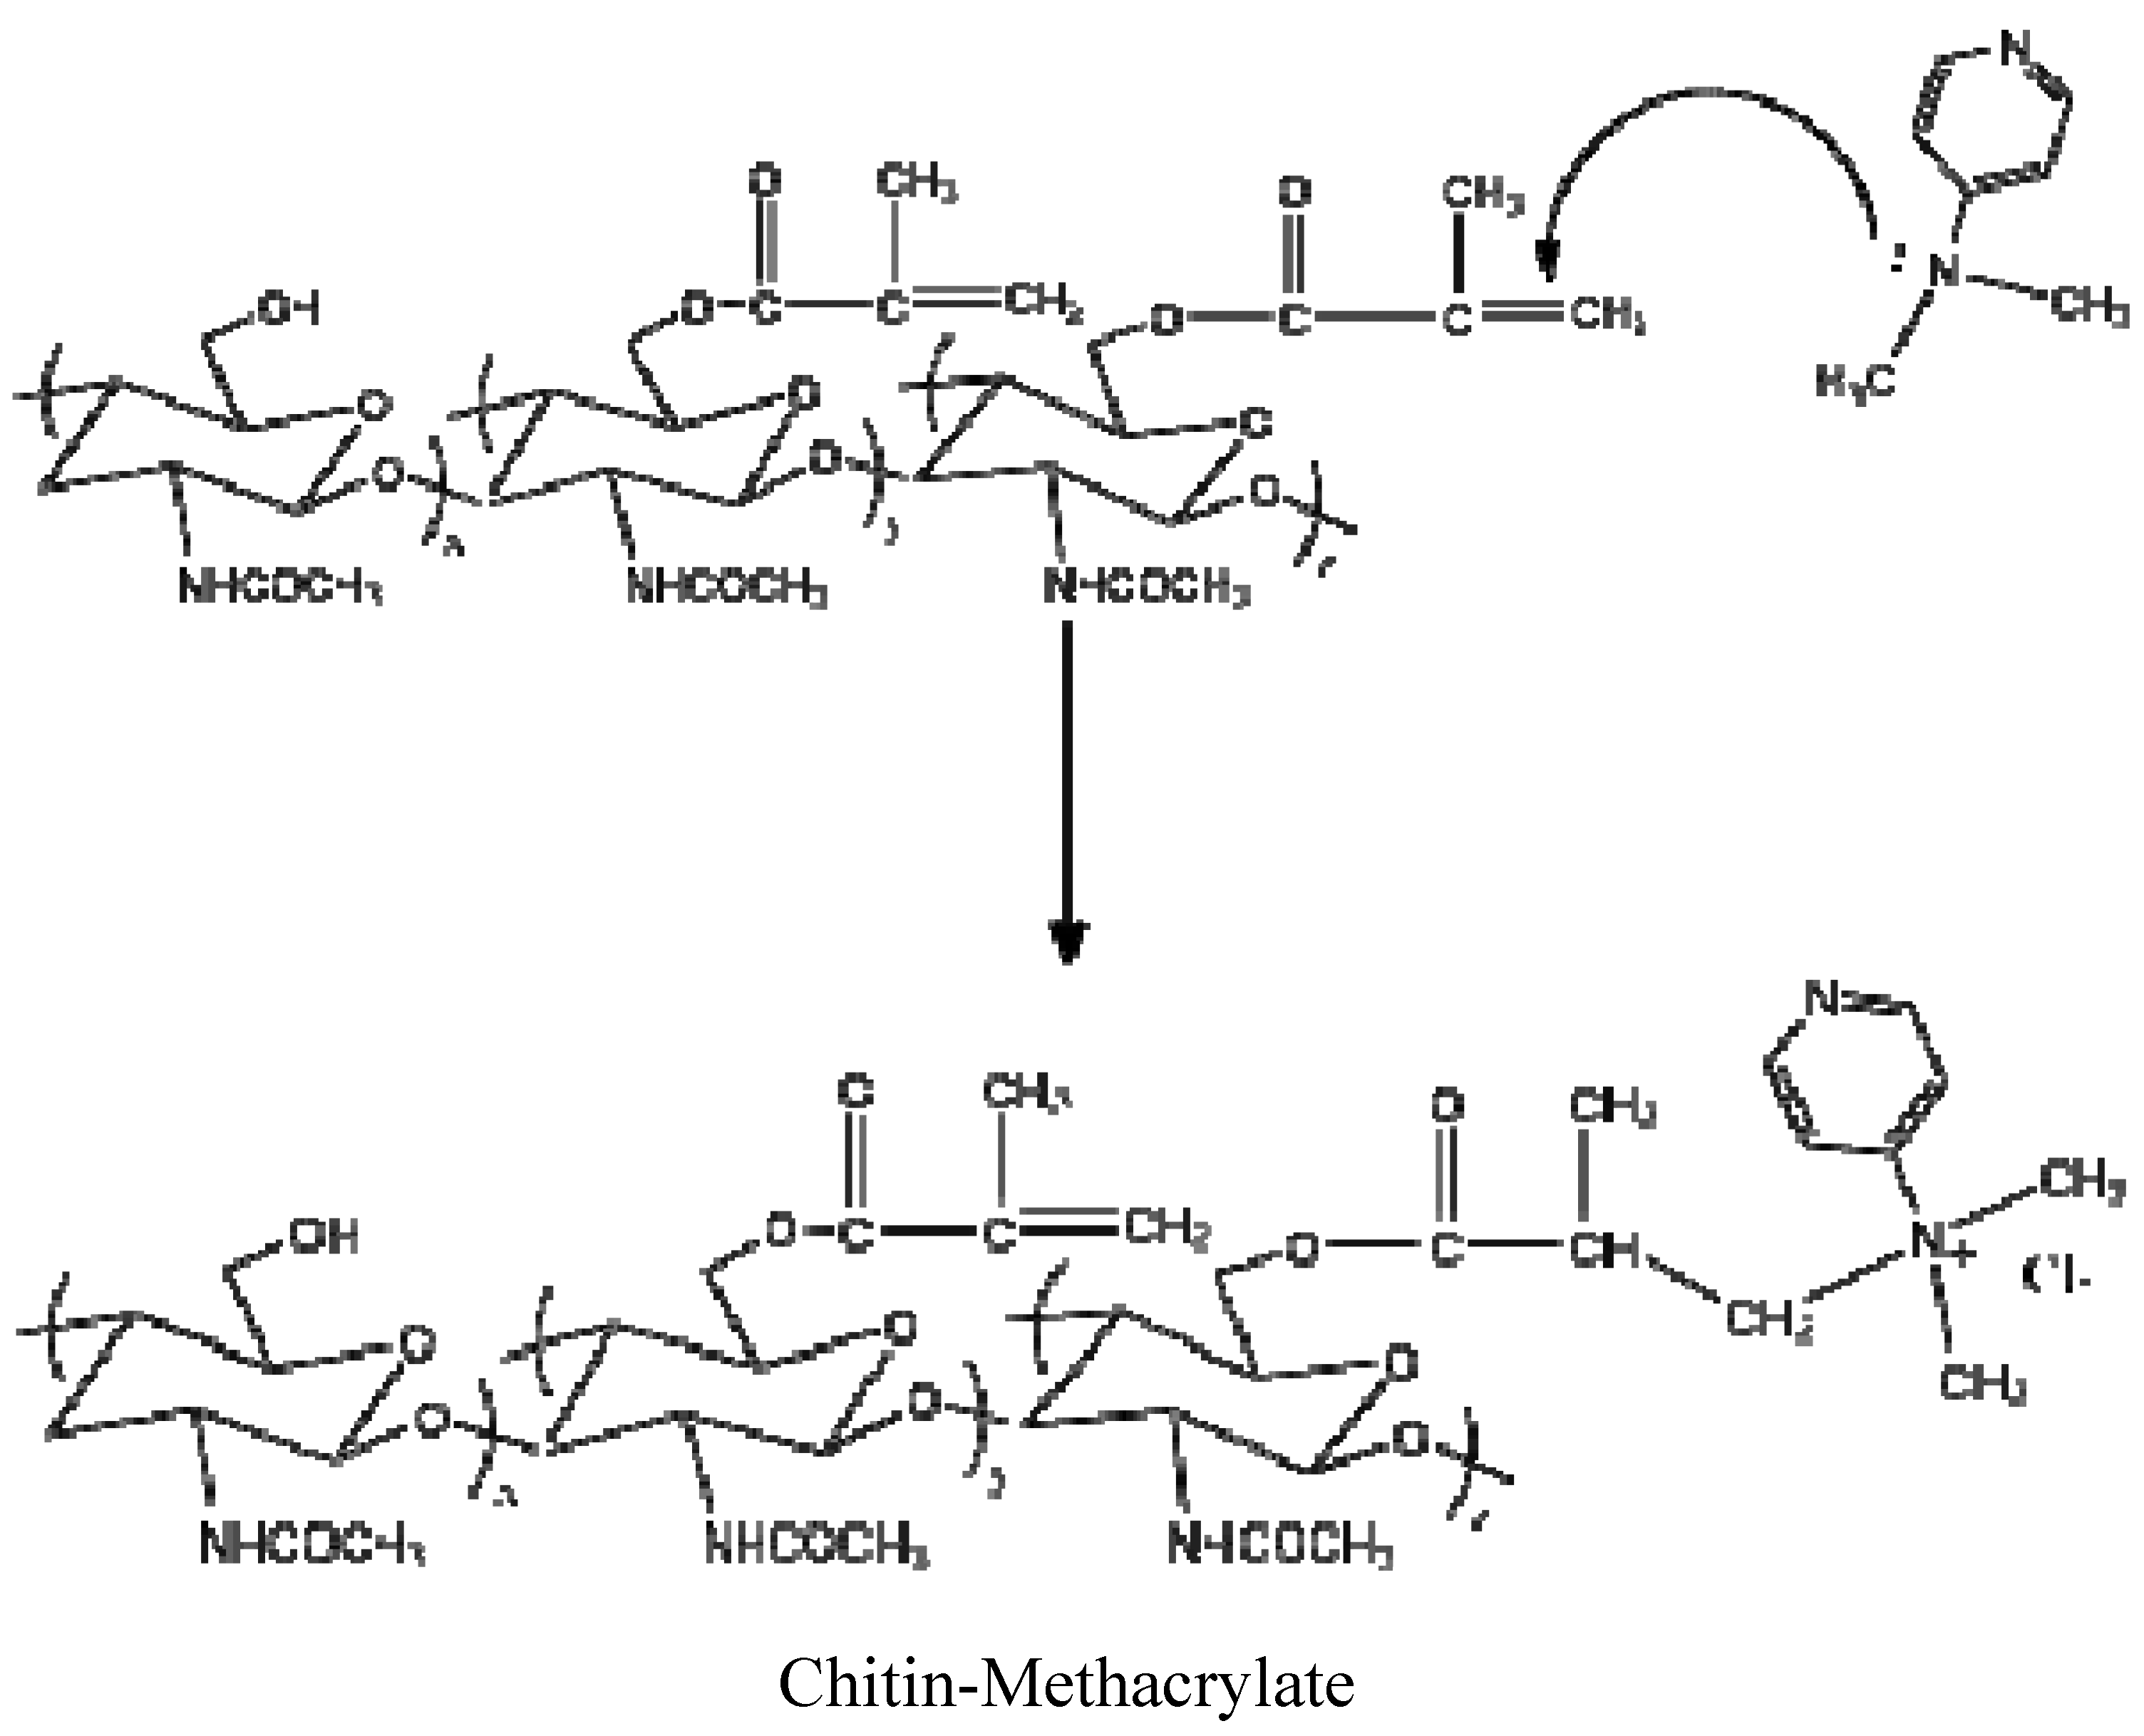
There were three additional peaks located at 8.21, 6.93 and 3.24 ppm assigned to DMAP [
15]. Persistent washing of chitin-methacrylate (CM) with base, acid and various other solvent combinations did not remove the DMAP contributions in the NMR spectrum and it was concluded that the DMAP moiety was covalently bonded to the chitin backbone. This presence of DMAP on the chitin backbone was rationalized in terms of the occurrence of a further reaction between the grafted methacrylate groups in the presence of excess DMAP as shown in
Scheme 1. The result is the presence of a cation centered on the DMAP base rendering CM water-soluble. The existence of the double bond suggests that the complete CM structure is a mixture of pure methacrylate and methacrylate-dimethylamino complex grafted onto the chitin backbone.
Figure 2.
FT-IR spectra of low molecular weight chitin and chitin-methacrylate Top spectrum: Chitin-Methacrylate (CM); Bottom spectrum: Low molecular weight chitin.
Figure 2.
FT-IR spectra of low molecular weight chitin and chitin-methacrylate Top spectrum: Chitin-Methacrylate (CM); Bottom spectrum: Low molecular weight chitin.
Figure 3.
1H-NMR of chitin-methacrylate in D2O.
Figure 3.
1H-NMR of chitin-methacrylate in D2O.
Figure 4.
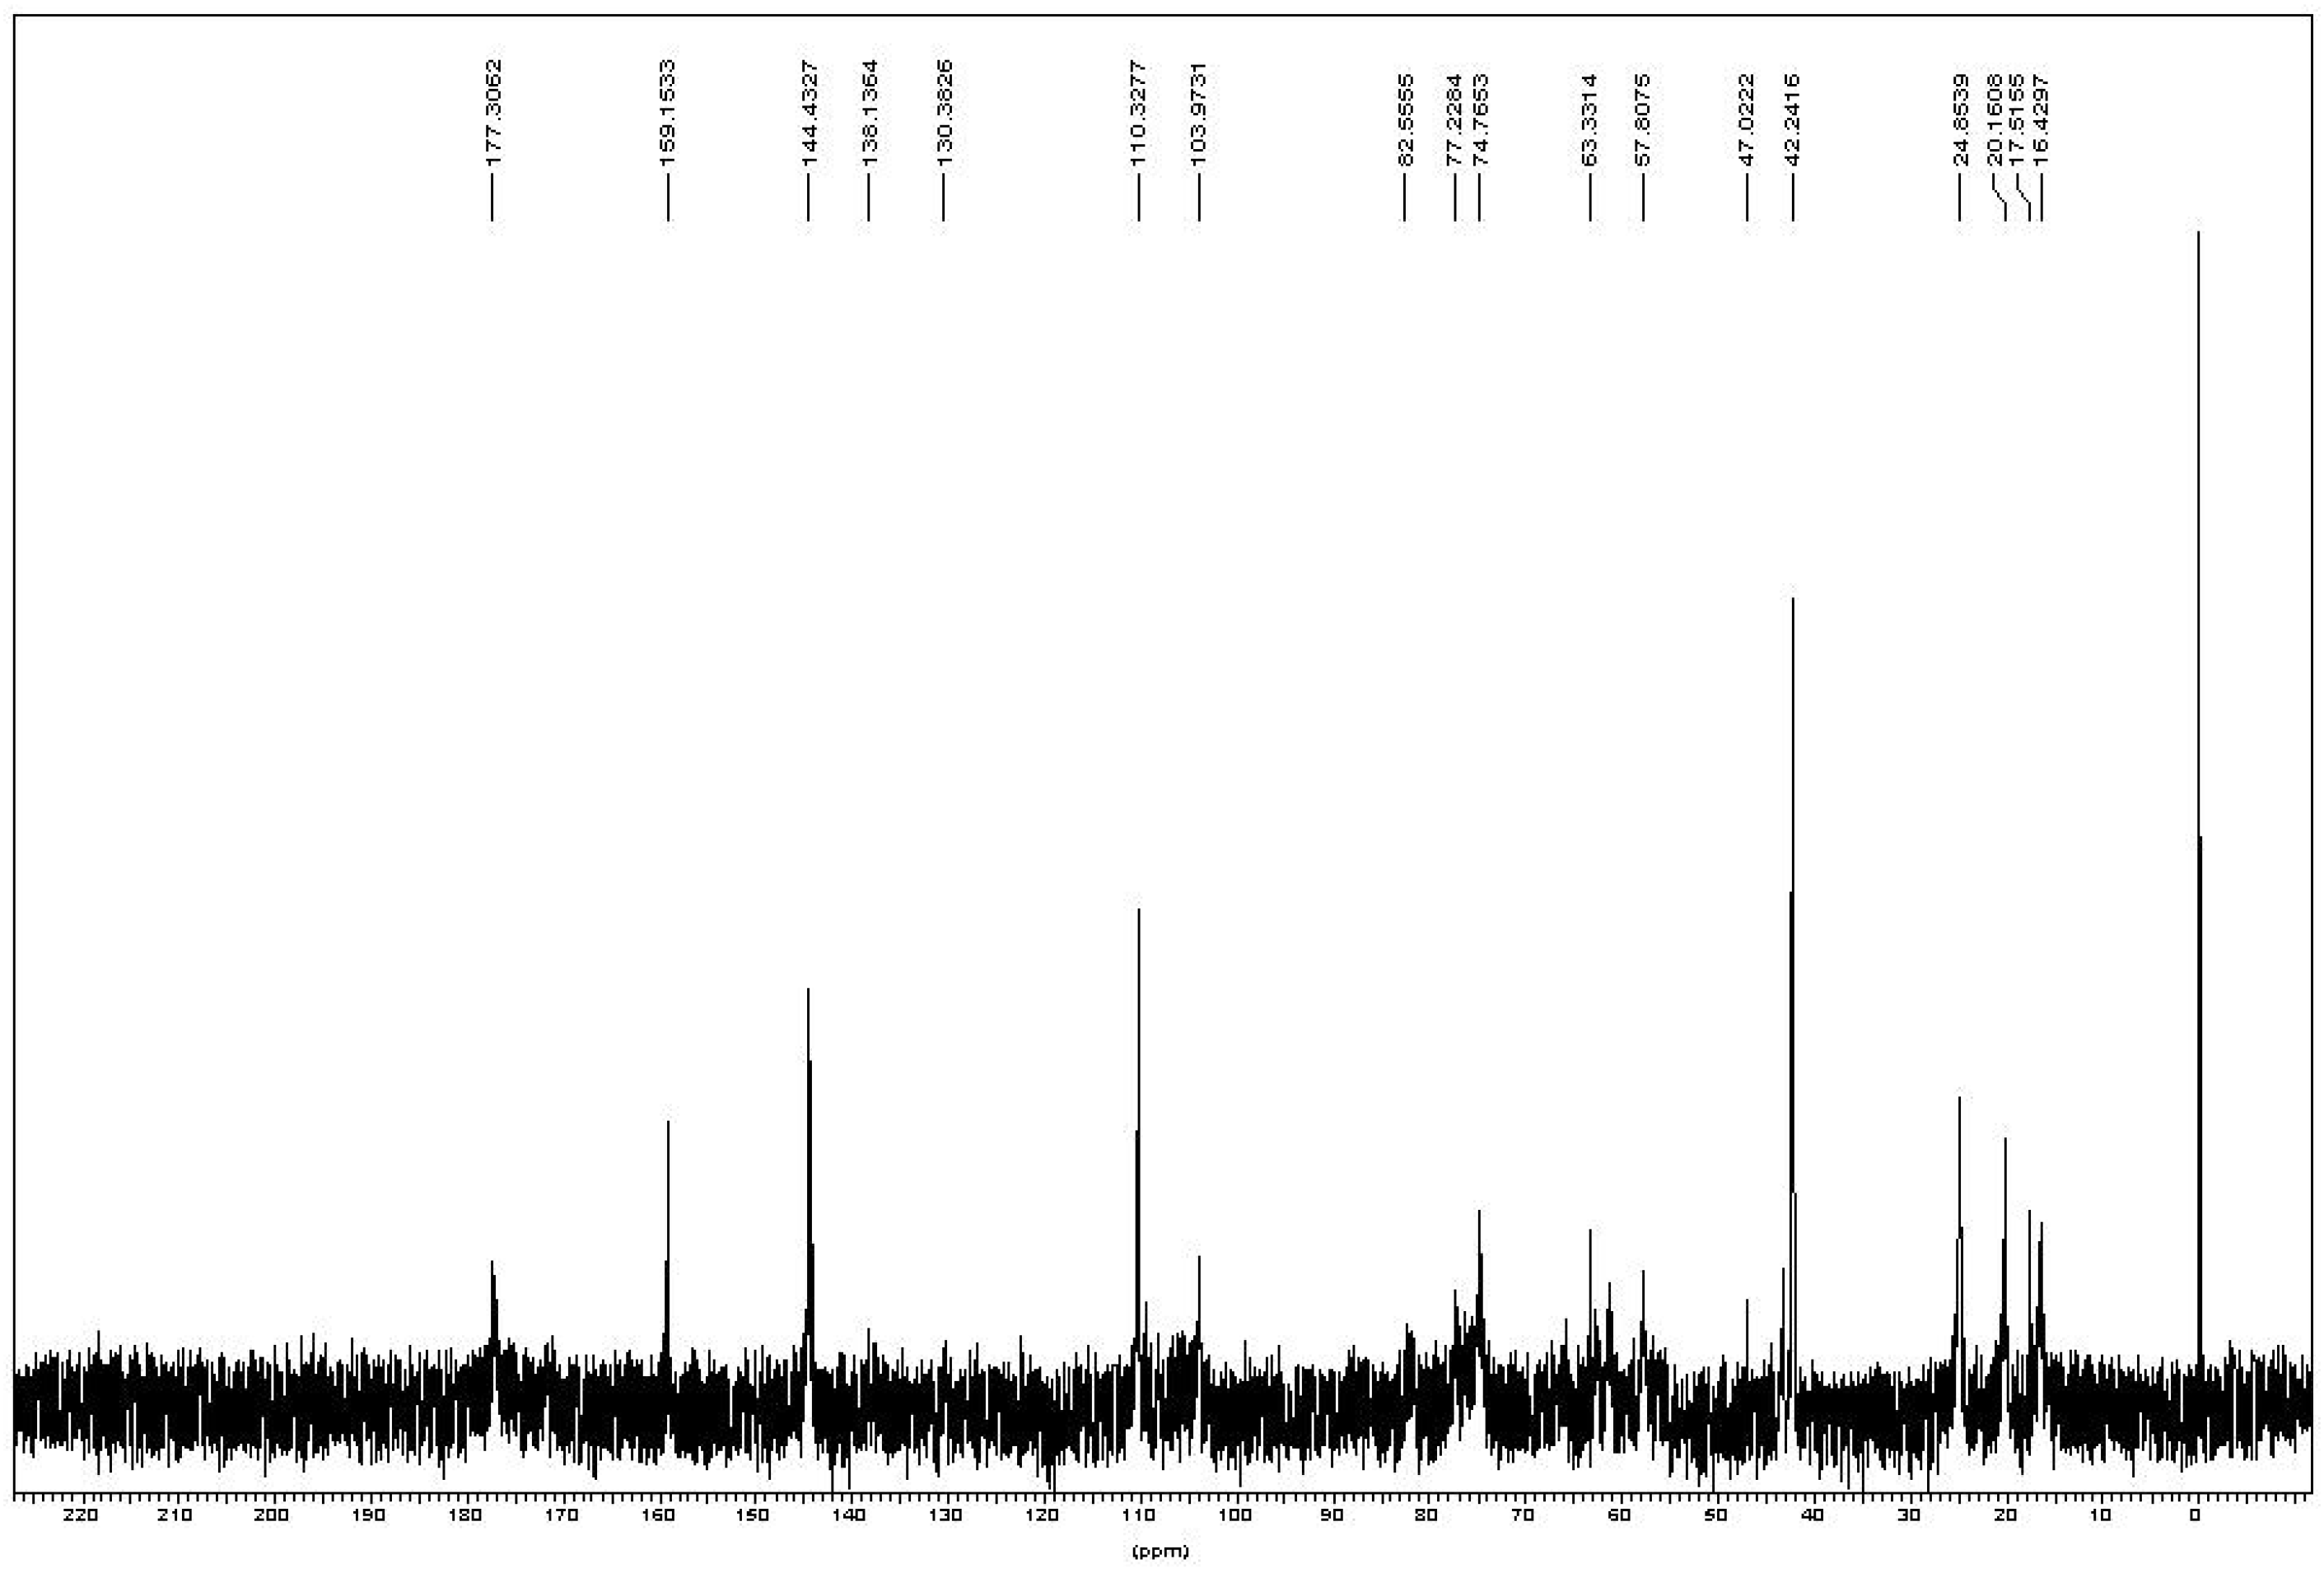
13C-NMR of chitin-methacrylate in D2O.
Figure 4.
13C-NMR of chitin-methacrylate in D2O.
In the
13C-NMR spectrum (
Figure 4), two weak peaks at 130.3 and 138.1 ppm were assigned to the two carbons at the unsaturated (–C(CH
3)=CH
2) of methacrylate group. There were two peaks near 20 ppm assigned to the methyl group on chitin’s N-acetyl group (24 ppm, –NHCOCH
3) and methacrylate group (20 ppm, –C(CH
3)=CH
2). Another two peaks near 16 ppm were probably due to the carbons on the methacrylate group in the additional reaction at 17.5 ppm and 16.5 ppm. The obvious strong chemical shifts at 42.2, 110.3, 144.4 and 159.1 ppm were assigned to DMAP. Other chemical shifts corresponded to the chitin backbone found in the spectrum and summarized as
Table 1.
Table 1.
Chemical shifts of carbon belonging to the chitin backbone structure.
Table 1.
Chemical shifts of carbon belonging to the chitin backbone structure.
| C1 | C2 | C3 | C4 | C5 | C6 | NHCOCH3 |
|---|
| 13C chemical shifts | 103.9 | 57.8 | 74.7 | 82.5 | 77.2 | 63.6 | 177.3 |
From the characterization of CM, we conclude that the attachment of the methacrylate group onto chitin was achieved with a final chemical structure depicted in
Scheme 1. Unfortunately, the degree of substitution of the methacrylate group on the chitin backbone could not be obtained from
1H-NMR by comparing the integration of protons on –C=CH
2 to –CH
3 on chitin. This was because the chemical shifts on either chitin’s repeat unit or the methyl group of the N-acetyl group could not be clearly distinguished in spite of the distinct chemical shifts of the unsaturated group were distinct.
CM was found to be soluble in polar organic solvents and water. For DMSO and DMAC (containing 5% LiCl w/v), CM was soluble up to about 20% (w/v) in both solvents. In pure water, CM dissolved to a maximum concentration of around 7% (w/v), which was a very viscous solution.
Scheme 1.
Reaction of methacrylate group with 4-dimethylaminopyridine (DMAP).
Scheme 1.
Reaction of methacrylate group with 4-dimethylaminopyridine (DMAP).
2.3. Thermogravimetric Analysis (TGA) Profile of CM
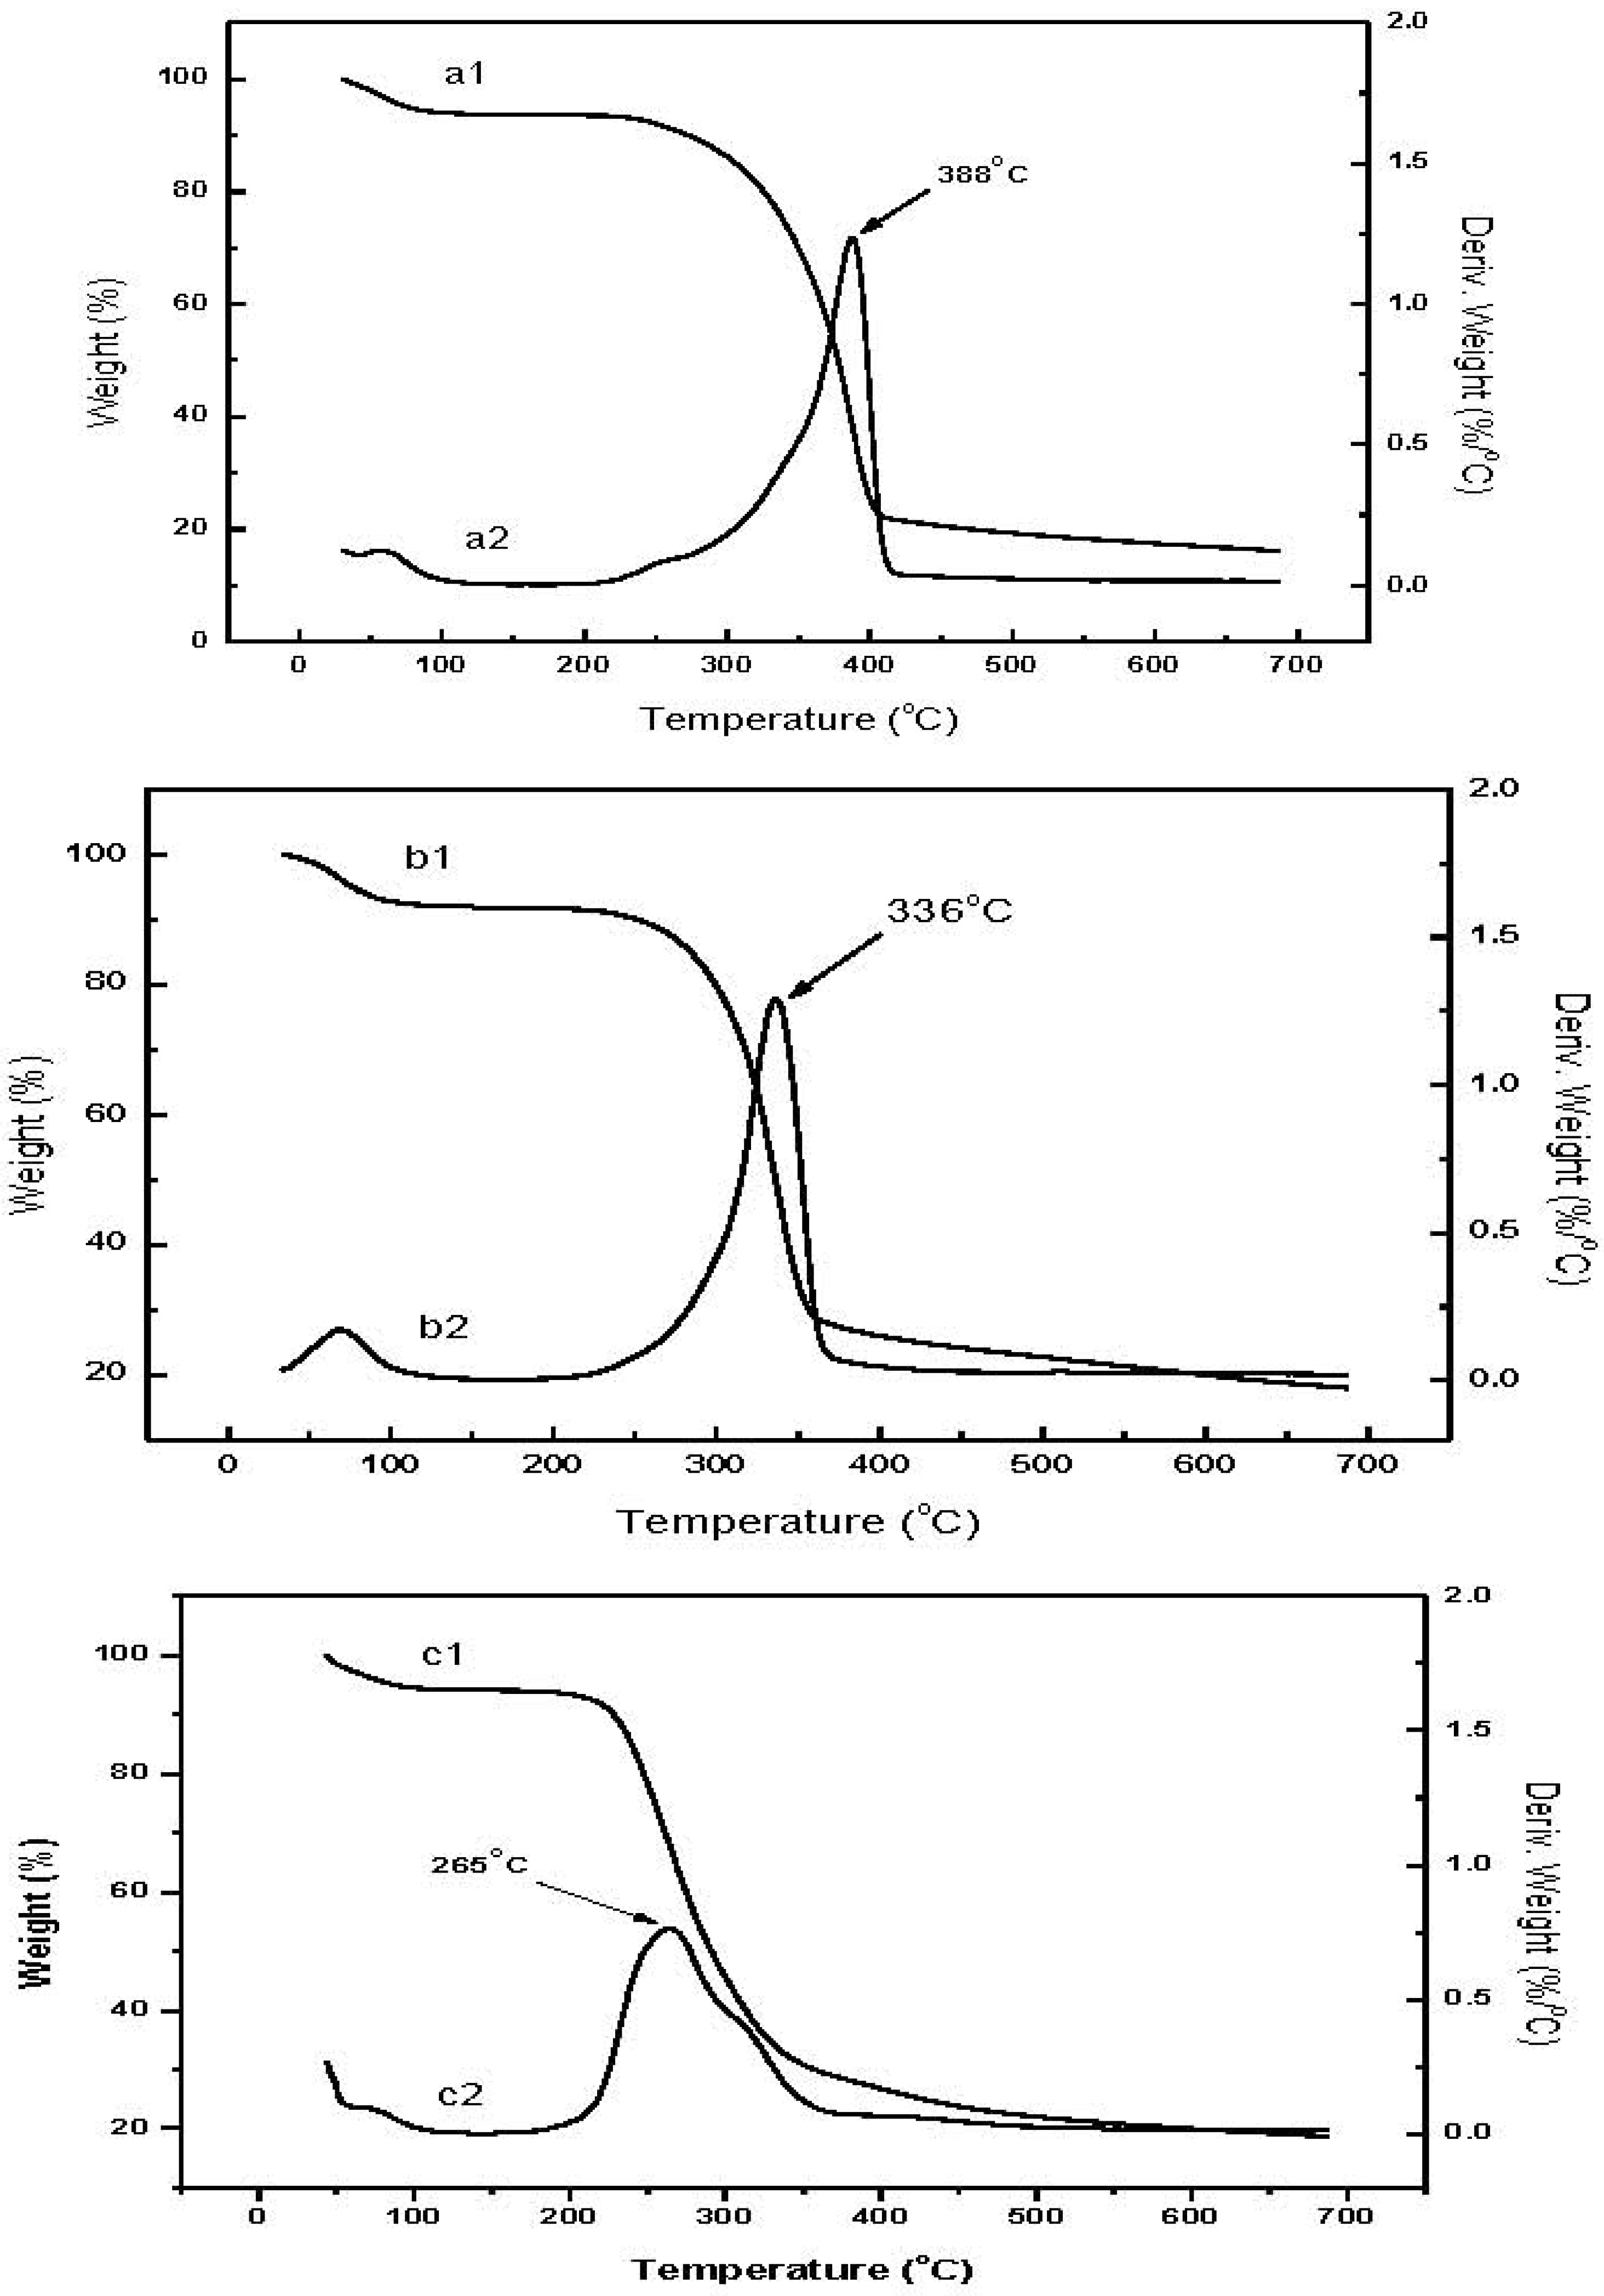
Figure 5 shows the TGA profiles of raw chitin, low molecular weight chitin, and CM. Weight loss curves for the raw chitin (a1) and low molecular weight chitin (b1) have two decomposition stages: the first, around 50–100 °C, is attributed to the loss of residual water; the second stage thermal decomposition of the biopolymer, is a little different for the two chitin thermograms, 240–410 °C for raw chitin and 220–370 °C for low molecular weight chitin. The lower onset of decomposition for the low molecular weight chitin is probably a consequence of the lower degree of polymerization [
16]. From the derivative curves, the temperature of maximum weight loss (T
max) is 388 °C for raw chitin (a2), higher than that of low molecular weight chitin at 336 °C (b2).
The decomposition profile for CM (c1) appears more elaborate compared to the chitin profiles. The first stage from 50–100 °C is again attributed to the loss of residual water. The primary stage spans from 190–380 °C. The derivative curve profile (c2) suggests the existence of 2 overlapping components, the lower probably contributed by the less stable methacrylate component while the higher is attributed to the stabler methacrylate-dimethylaminopyrine complex component. Based on the derivative curves, we conclude that the ratio of methacrylate to dimethylaminopyrine complex is approximately equal. These results are similar to the acrylate-chitin consistent with accepted findings that chemical modification results in lower thermal stability of the chitin derivative compared to the starting chitin material [
9,
16].
Figure 5.
Thermograms of raw chitin, low molecular weight chitin and CM: a1, b1, c1, correspond to the weight loss curve; a2, b2, c2, correspond to the derivative weight loss curve.
Figure 5.
Thermograms of raw chitin, low molecular weight chitin and CM: a1, b1, c1, correspond to the weight loss curve; a2, b2, c2, correspond to the derivative weight loss curve.
2.6. In Vitro Lysozymal Degradation of CM-Hydrogel in Vitro by Lysozyme
Chitin and its derivatives in film or gel forms readily hydrolyze in the presence of lysozyme [
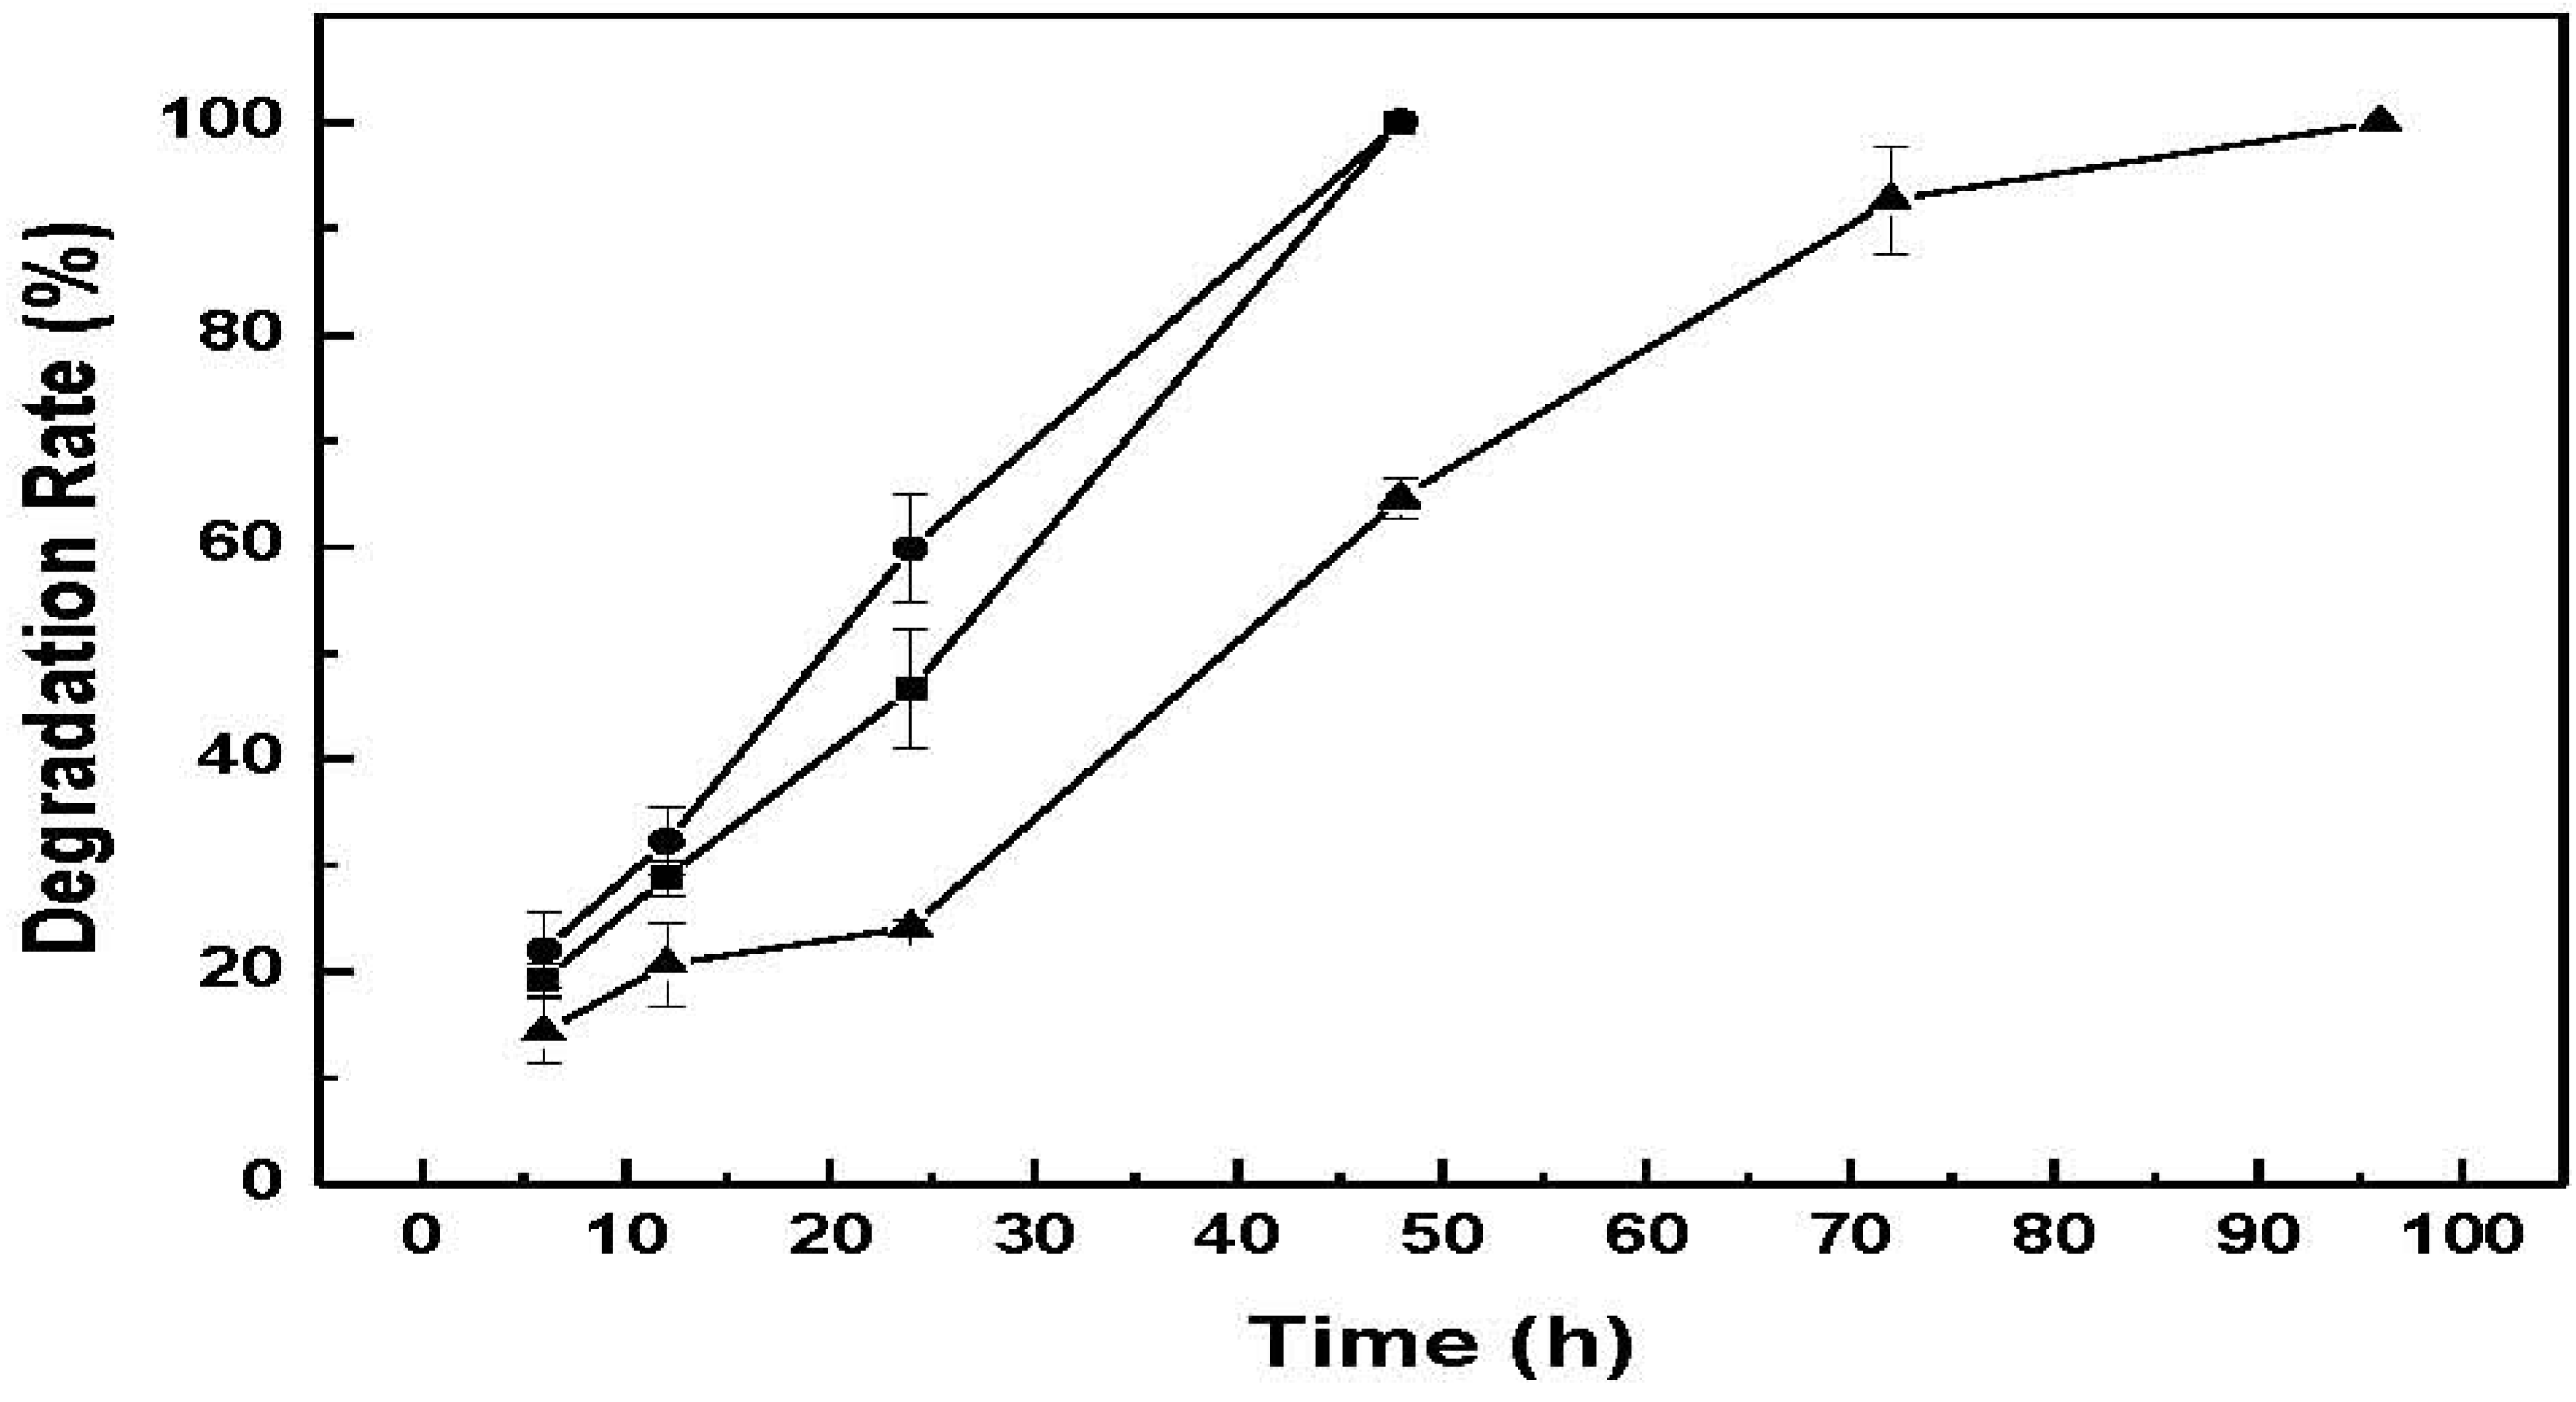
18]. As chitin-based hydrogels have potential in biomedical applications, one fundamental aspect to ascertain is hydrogel biodegradability susceptibility. The lysozyme degradation of CM-hydrogel was carried out with different lysozyme concentrations in 0.01 M pH 7.0 PBS at 1.0 mg/mL, 2.0 mg/mL, and 4.0 mg/mL in 37 °C water bath.
Figure 8 shows the degradation rate of CM-hydrogel using these lysozyme concentrations. The results indicate that the photo-crosslinked CM-hydrogel can be totally degraded within 48 h by 2 mg/mL or 4 mg/mL of lysozyme solution, while a longer time of 96 h was required for the 1 mg/mL lysozyme solution for the complete dissolution of hydrogel. Therefore the amount of enzyme present is critical for the steady degradation of hydrogel. In addition, the effective enzymatic degradation by lysozyme indicates that the contiguous N-acetyl groups on chitin that serves as the active site of lysozyme still exist in the low molecular weight chitin-methacrylate after acid hydrolysis and chemical modification [
15]. While it is noted that the utility of a hydrogel that degrades within 48h is nomimal, the susceptibility to biodegrade in the presence of enzymes is demonstrated. In perceived use, the amount of enzymes would be expected to be much less and therefore a longer “
in situ” lifetime would be expected. Furthermore, CM can be combined with other photo-crosslinkable materials that would further alter the degradation profile. This ability to biodegrade augurs well for CM-hydrogel, and in general, chitin-methacrylate, for biomedical applications.
Figure 8.
Enzymatic degradation of CM-hydrogel in different concentrations of lysozyme solutions. ―●―: 4 mg/mL, ―■―: 2 mg/mL, ―▲―: 1 mg/mL.
Figure 8.
Enzymatic degradation of CM-hydrogel in different concentrations of lysozyme solutions. ―●―: 4 mg/mL, ―■―: 2 mg/mL, ―▲―: 1 mg/mL.
2.7. In Vitro Cytotoxicity
The
in vitro cytotoxicity evaluation of biomedical materials at the research stage is a good tool for identifying potential safety issues of newly prepared materials as it utilizes only cell culture and is relatively fast and straightforward to perform. The results give useful indications of the new material’s suitability for further product development. Three types of cell lines were used for assessing the cytotoxicity of CM-hydrogel directly or indirectly using its extract in culture medium. The percent cells viability is shown in
Figure 9 and
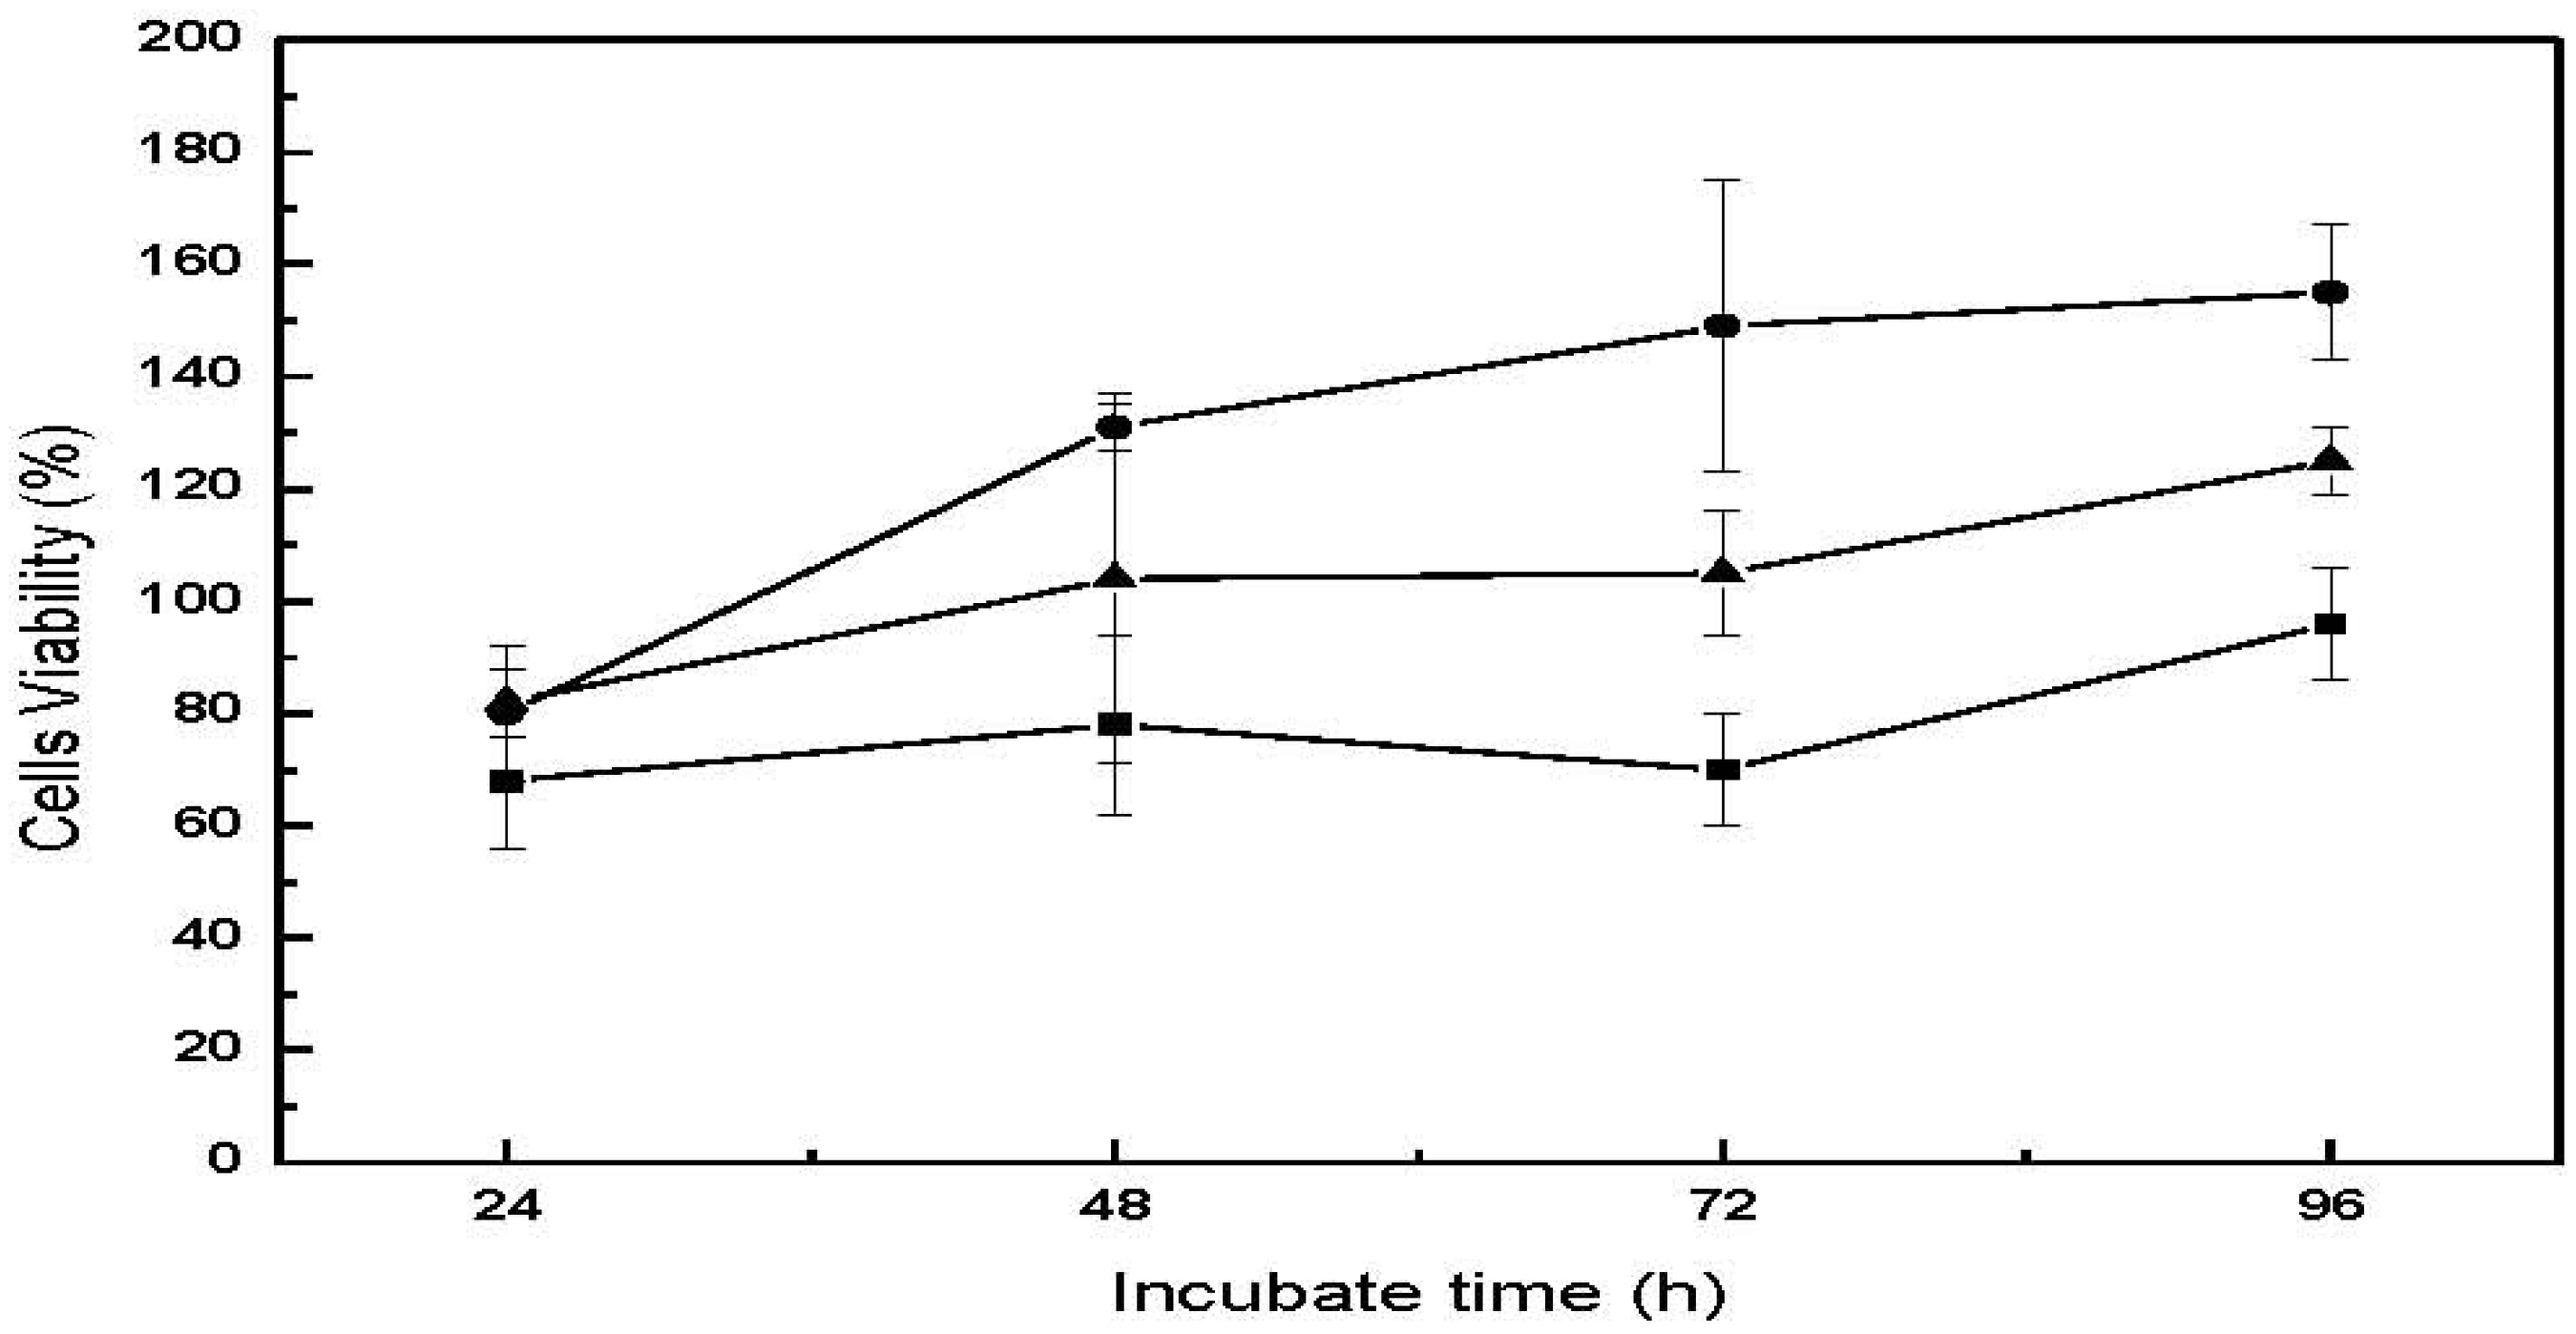
Table 2. Cell viability for all three cell lines following direct contact with the CM-hydrogel were approximately 70% at 24 h, and increasing to 150% for human fibroblast (CCL-186), 125% for osteoblast (CRL-142) and 96% for mouse fibroblast (CCL-1) after 96 h incubation. In particular, the cell viability for the two human cell lines were found to be above 100% after 48 h, probably because the larger size of the human fibroblasts and osteoblasts compared to the mouse fibroblasts facilitated their easier attachment and proliferation on the hydrogel surface. These values remained more or less constant up to 96 h. This result is similar to that reported by Chow
et al. who also found that the cell viability of CCL-1 mouse fibroblast cells following incubation with chitin-fluorinated derivatives was 20% lower than that of CCL-186 human fibroblast cell line [
19]. In addition, the CM-hydrogel would be expected to be uneven compared to polystyrene, a situation that will favor easier attachment and growth of the human osteoblast and fibroblasts on the hydrogel leading to higher cell viability [
20].
Figure 9.
Cell viability as a function of incubation time for the direct contact cytotoxicity assay of CM-hydrogel. ―●―: CCL-186, ―▲―: CRL-1427, ―■―: CCL-1.
Figure 9.
Cell viability as a function of incubation time for the direct contact cytotoxicity assay of CM-hydrogel. ―●―: CCL-186, ―▲―: CRL-1427, ―■―: CCL-1.
Table 2.
Viability of CCL-1, CCL-186 and CRL-1427 cells following incubation for 24 and 48 h with the CM-hydrogel extract.
Table 2.
Viability of CCL-1, CCL-186 and CRL-1427 cells following incubation for 24 and 48 h with the CM-hydrogel extract.
| Incubation Time | Cells Viability (%) (Mean ± SD) |
|---|
| CCL-1 | CCL-186 | CRL-1427 |
|---|
| 24 h | 78 ± 3 | 98 ± 7 | 77 ± 9 |
| 48 h | 62 ± 2 | 98 ± 3 | 92 ± 8 |
Similarly, cells exposed to the undiluted hydrogel extract showed comparable viability profiles relative to control (
Table 2). The two human cell lines exhibited viabilities of more than 90% compared to the control, while the mouse cell line, although lagging behind the human cell types, was 60% viable after 48 h of incubation with the extract. From the material safety aspect, therefore, the CM-hydrogel can be regarded as potentially non-toxic, holding out promise for biomedical applications such as wound healing, tissue engineering and orthopedic implants.
2.8. Morphology of Cells Cultured on CM-Hydrogel Surface
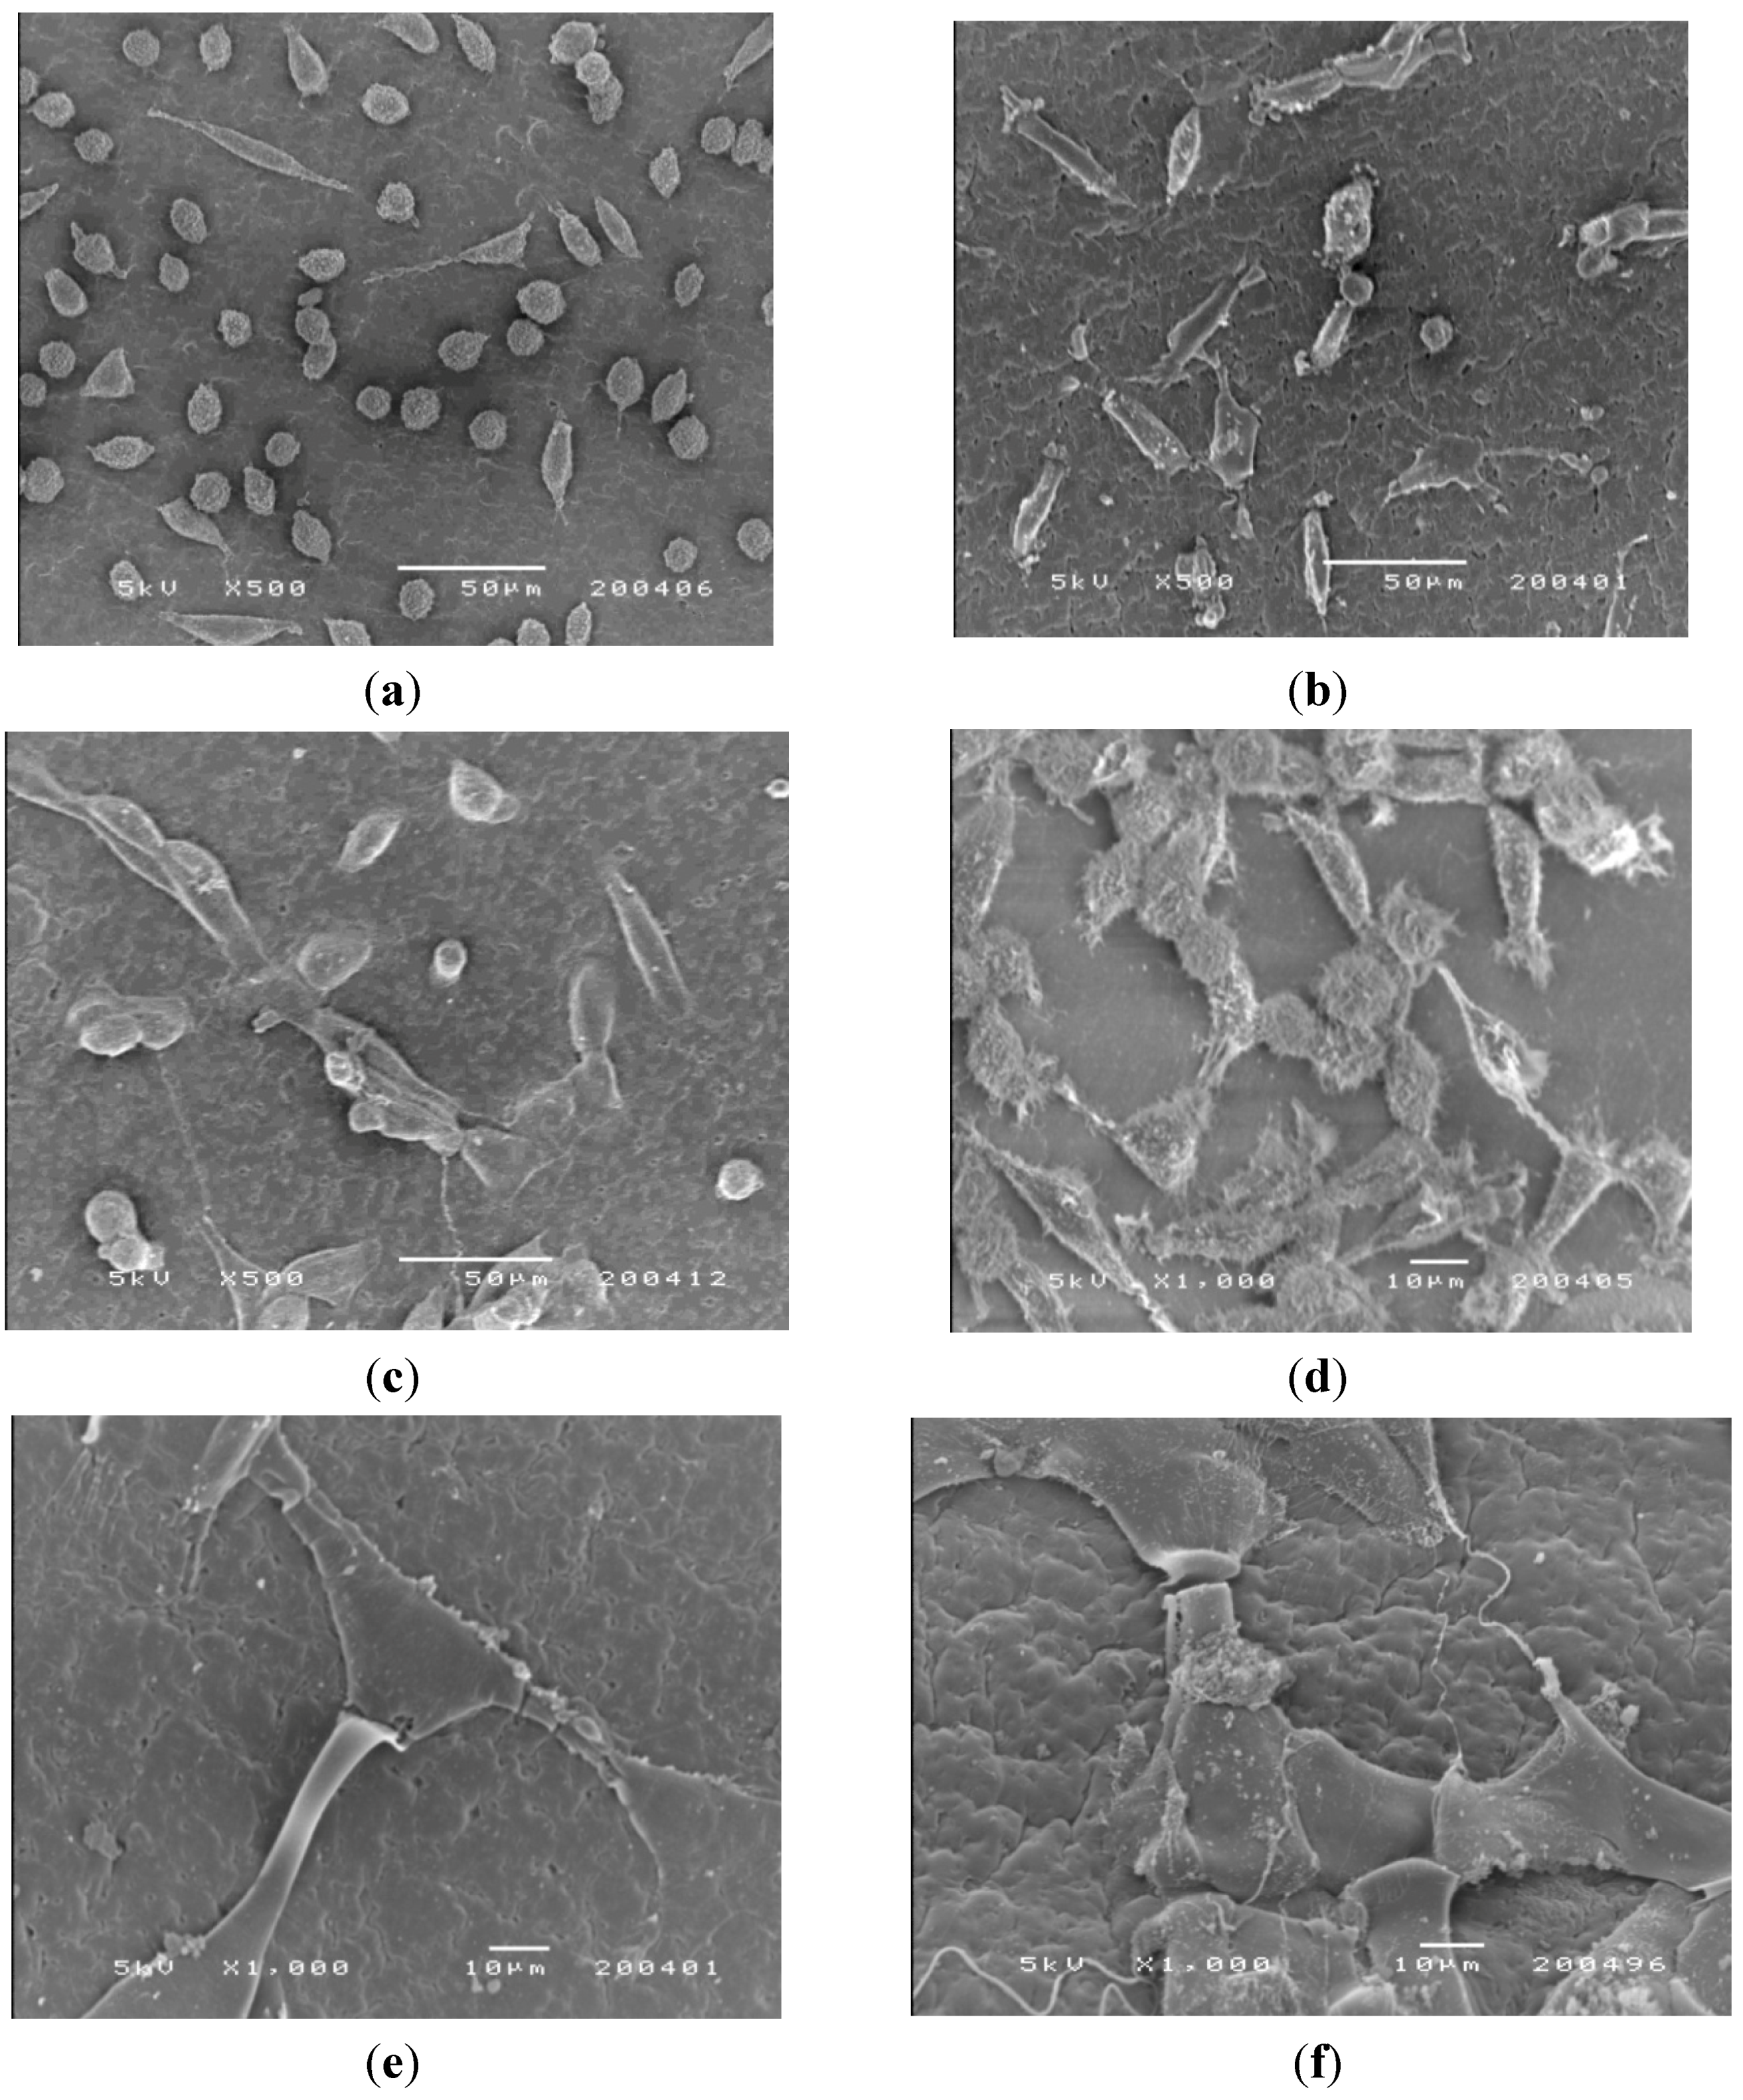
SEM was used to examine the adhesion, spread and proliferation of the three cell lines on the surface of CM-hydrogel after incubation at 37 °C for 2 and 5 days. Representative SEM micrographs (
Figure 10a–c) taken on day 2 show unequivocal adhesion of all cell types on the surface of the CM-hydrogels. The mouse fibroblasts (CCL-1) were mainly round-shaped with a few cells exhibiting the spindle shape. In contrast, both the CCL-186 and CRL-1427 cells were spindle-shaped, and they were widely spread out on the surface of the CM-hydrogel. This observation supports the cytotoxicity data in showing that the mouse fibroblasts indeed grew much slower, and with delayed colonization, compared to the human fibroblasts and osteoblasts on the CM-hydrogel. The SEM micrographs of the mouse fibroblasts on day 2 was similar to that reported by Muzzarelli
et al. that showed only a few spindle shaped mouse fibroblasts cells just starting to spread on a di-butyryl chitin film.
Figure 10.
SEM photomicrographs of the morphology of CCL-1, CCL-186 and CRL-1427 cells cultured on the CM-hydrogel. Day 2: (a) CCL-1; (b) CCL-186; (c) CRL-1427. Day 5: (d) CCL-1; (e) CCL-186; (f) CRL-1427.
Figure 10.
SEM photomicrographs of the morphology of CCL-1, CCL-186 and CRL-1427 cells cultured on the CM-hydrogel. Day 2: (a) CCL-1; (b) CCL-186; (c) CRL-1427. Day 5: (d) CCL-1; (e) CCL-186; (f) CRL-1427.
Photomicrographs of the cell-hydrogel surface on day 5 (
Figure 10d–f) show extensive cell proliferation that spread across the material surface. The fibrils of the cells (white arrows) extended on the surfaces of the CM-hydrogel, showing evidence of cell-cell connection, indicating good cell adherence.


