Fractional Factorial Design Study on the Performance of GAC-Enhanced Electrocoagulation Process Involved in Color Removal from Dye Solutions

 ,
, 
Abstract
:
1. Introduction
2. Experimental
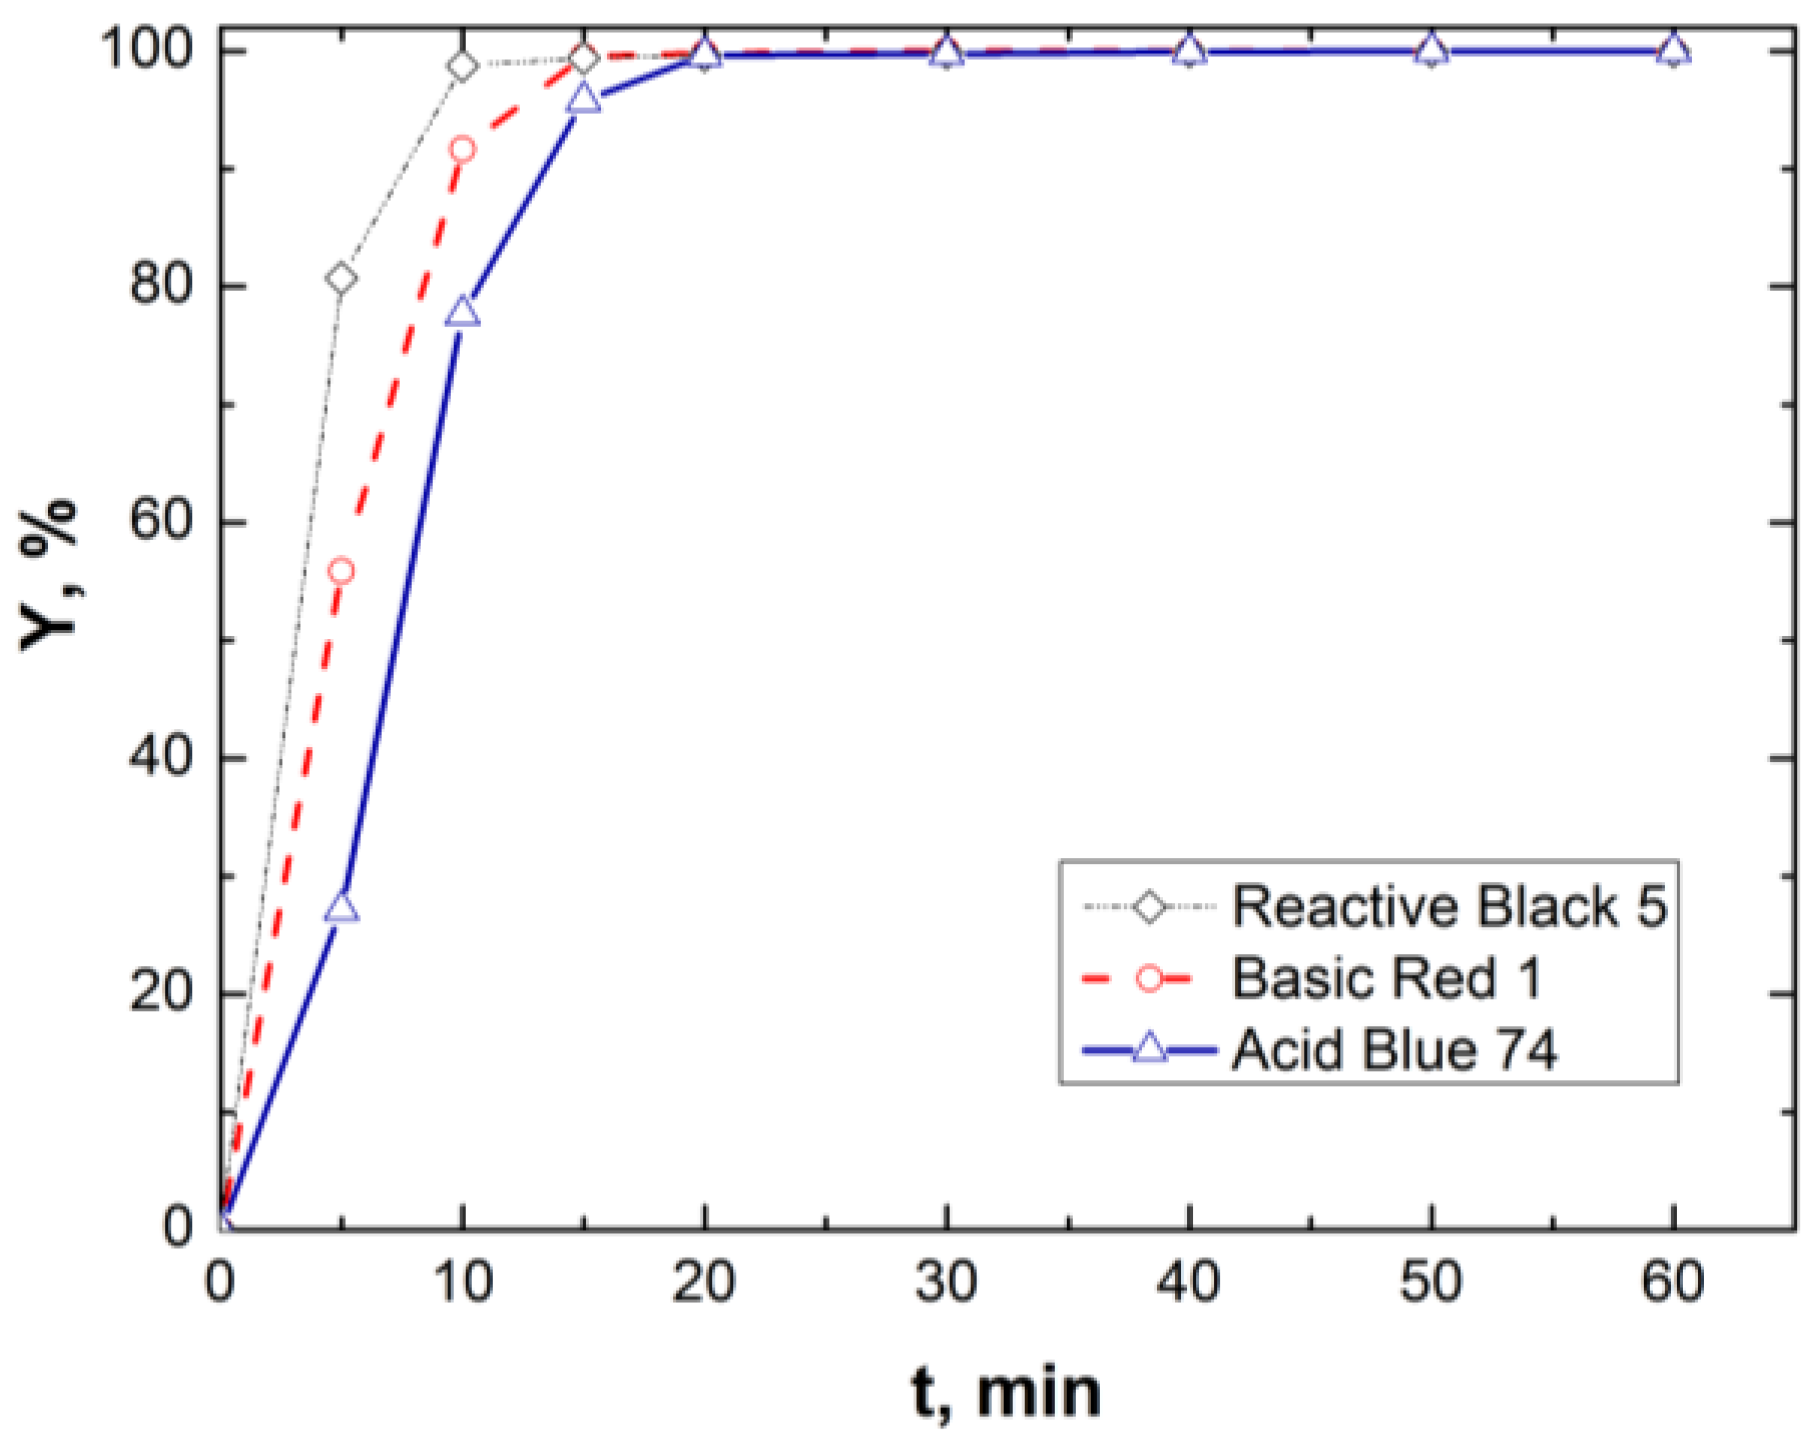
2.1. Materials

| Color index | Structural formula | λmax, nm | M, g/mol |
|---|---|---|---|
| Acid Blue 74 |  | 612 | 466.34 |
| Basic Red 1 |  | 535 | 436.94 |
| Reactive Black 5 |  | 598 | 991.82 |
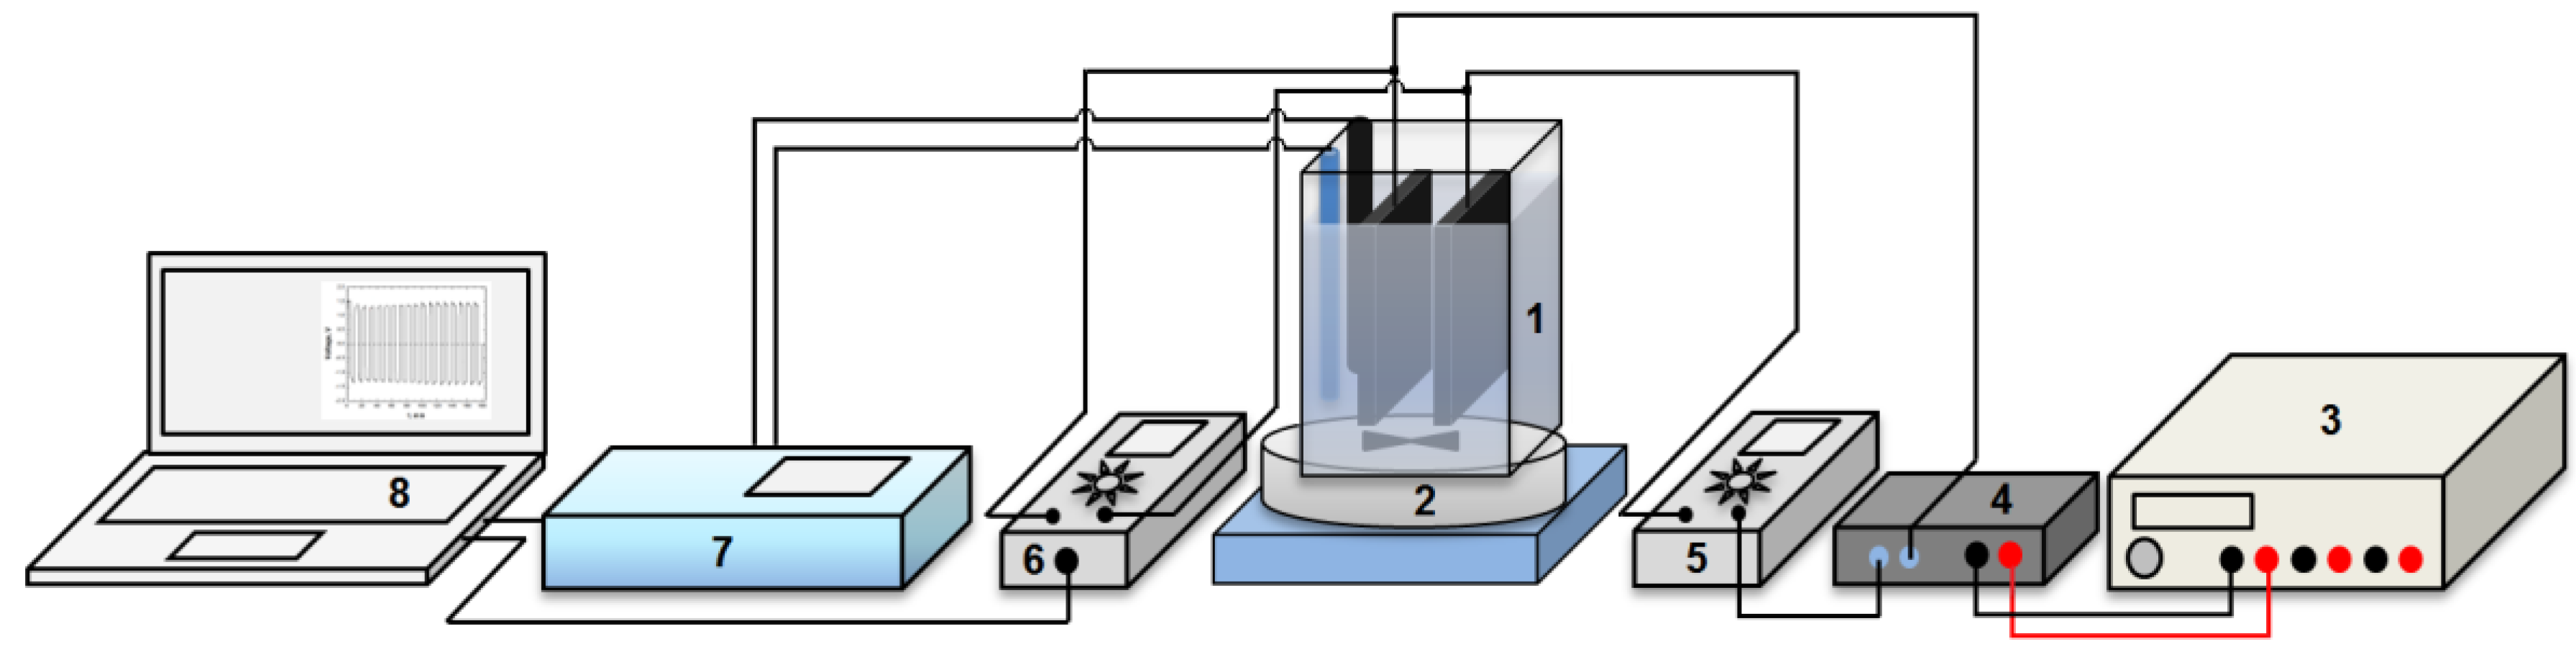
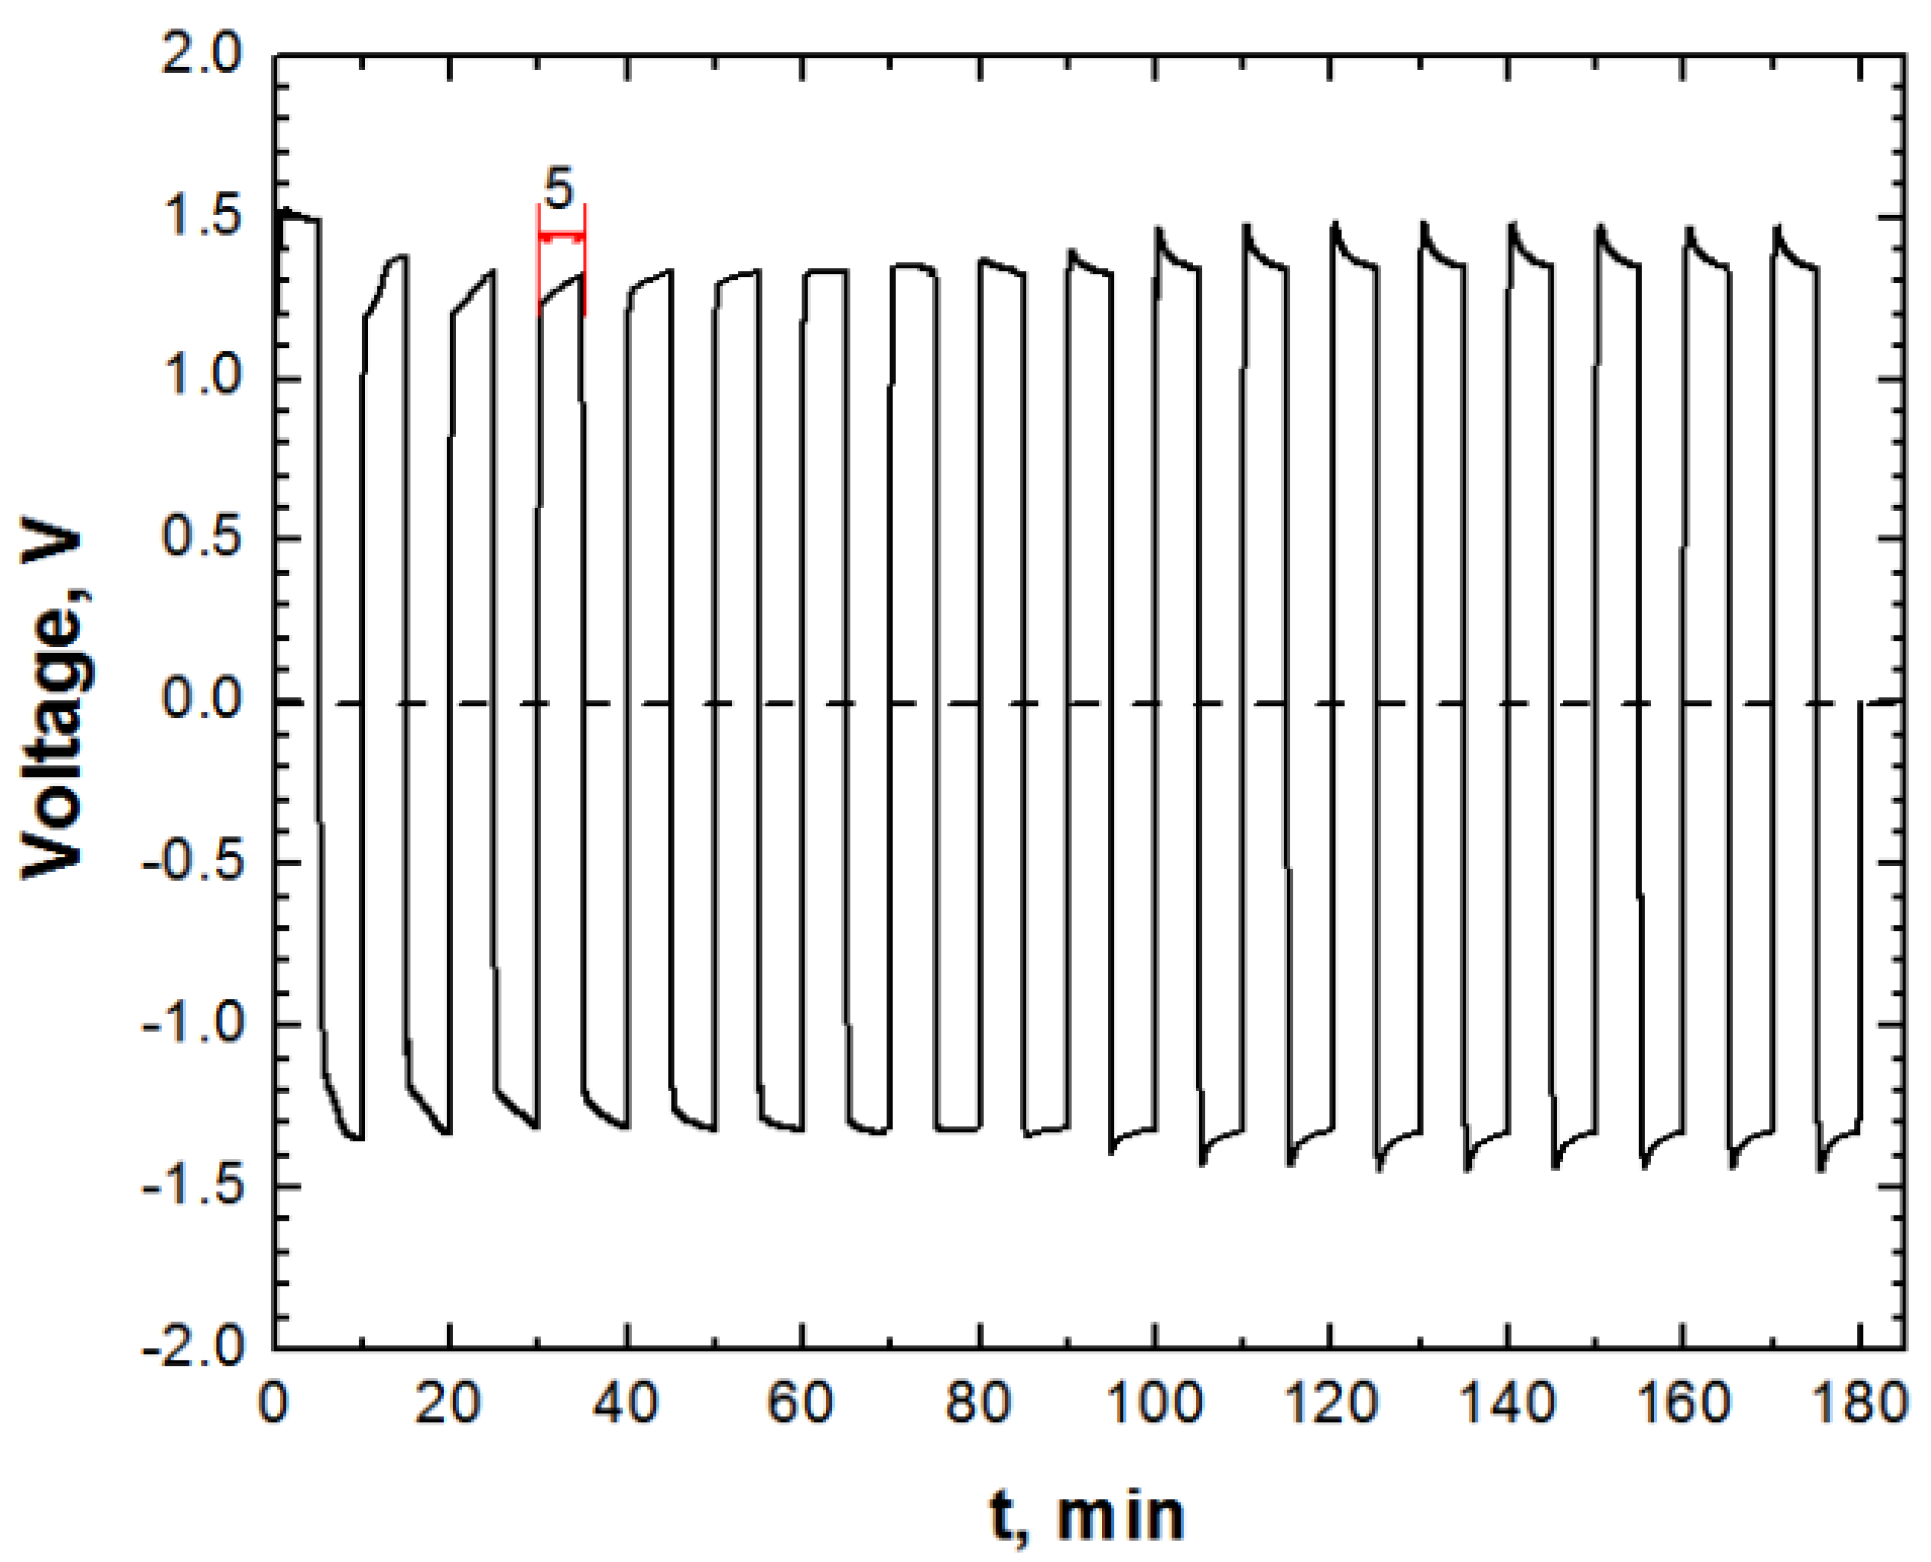
2.2. Electrocoagulation Experiments


2.3. Energy and Electrode Material Consumptions and Costs
2.4. Fractional Factorial Design
| Level | i (A/m2) | pH | t (min) | GAC dose (g/L) | CNaCl,(mM) | Ci(mg/L) | Current type |
|---|---|---|---|---|---|---|---|
| −1 | 2.73 | 3 | 20 | 0.1 | 2 | 50 | DC |
| 0 | 15.025 | 6 | 100 | 0.3 | 26 | 150 | – |
| +1 | 27.32 | 9 | 180 | 0.5 | 50 | 250 | APC |
| Run No. | A | B | C | D | E = ABC | F = BCD | G = ACD |
|---|---|---|---|---|---|---|---|
| i, A/m2 | pH | t, min | GAC dose, g/L | [NaCl] mM | Ci, mg/L | Current type | |
| 1 | − | − | − | − | − | − | DC |
| 2 | + | − | − | − | + | − | APC |
| 3 | − | + | − | − | + | + | DC |
| 4 | + | + | − | − | − | + | APC |
| 5 | − | − | + | − | + | + | APC |
| 6 | + | − | + | − | − | + | DC |
| 7 | − | + | + | − | − | − | APC |
| 8 | + | + | + | − | + | − | DC |
| 9 | − | − | − | + | - | + | APC |
| 10 | + | − | − | + | + | + | DC |
| 11 | − | + | − | + | + | − | APC |
| 12 | + | + | − | + | − | − | DC |
| 13 | − | − | + | + | + | − | DC |
| 14 | + | − | + | + | − | − | APC |
| 15 | − | + | + | + | − | + | DC |
| 16 | + | + | + | + | + | + | APC |
| 17 | 0 | 0 | 0 | 0 | 0 | 0 | DC |
| 18 | 0 | 0 | 0 | 0 | 0 | 0 | APC |
| 19 | 0 | 0 | 0 | 0 | 0 | 0 | DC |
| 20 | 0 | 0 | 0 | 0 | 0 | 0 | APC |
| 21 | 0 | 0 | 0 | 0 | 0 | 0 | DC |
| 22 | 0 | 0 | 0 | 0 | 0 | 0 | APC |
3. Results and Discussion


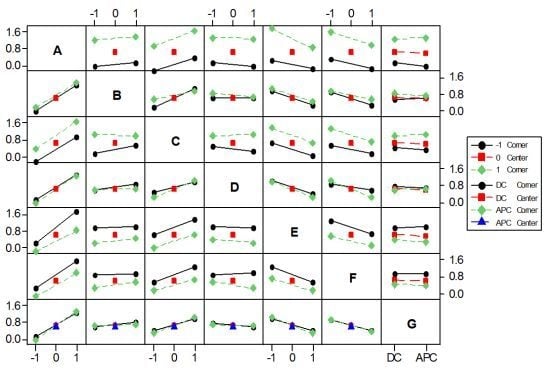
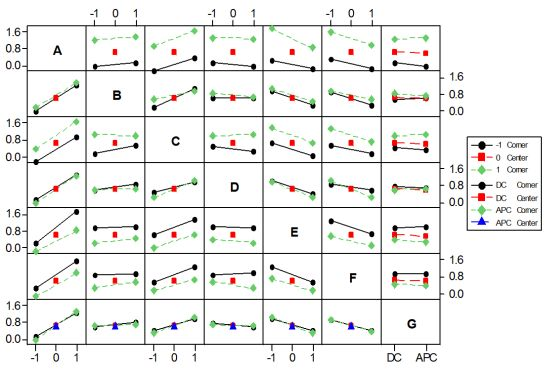
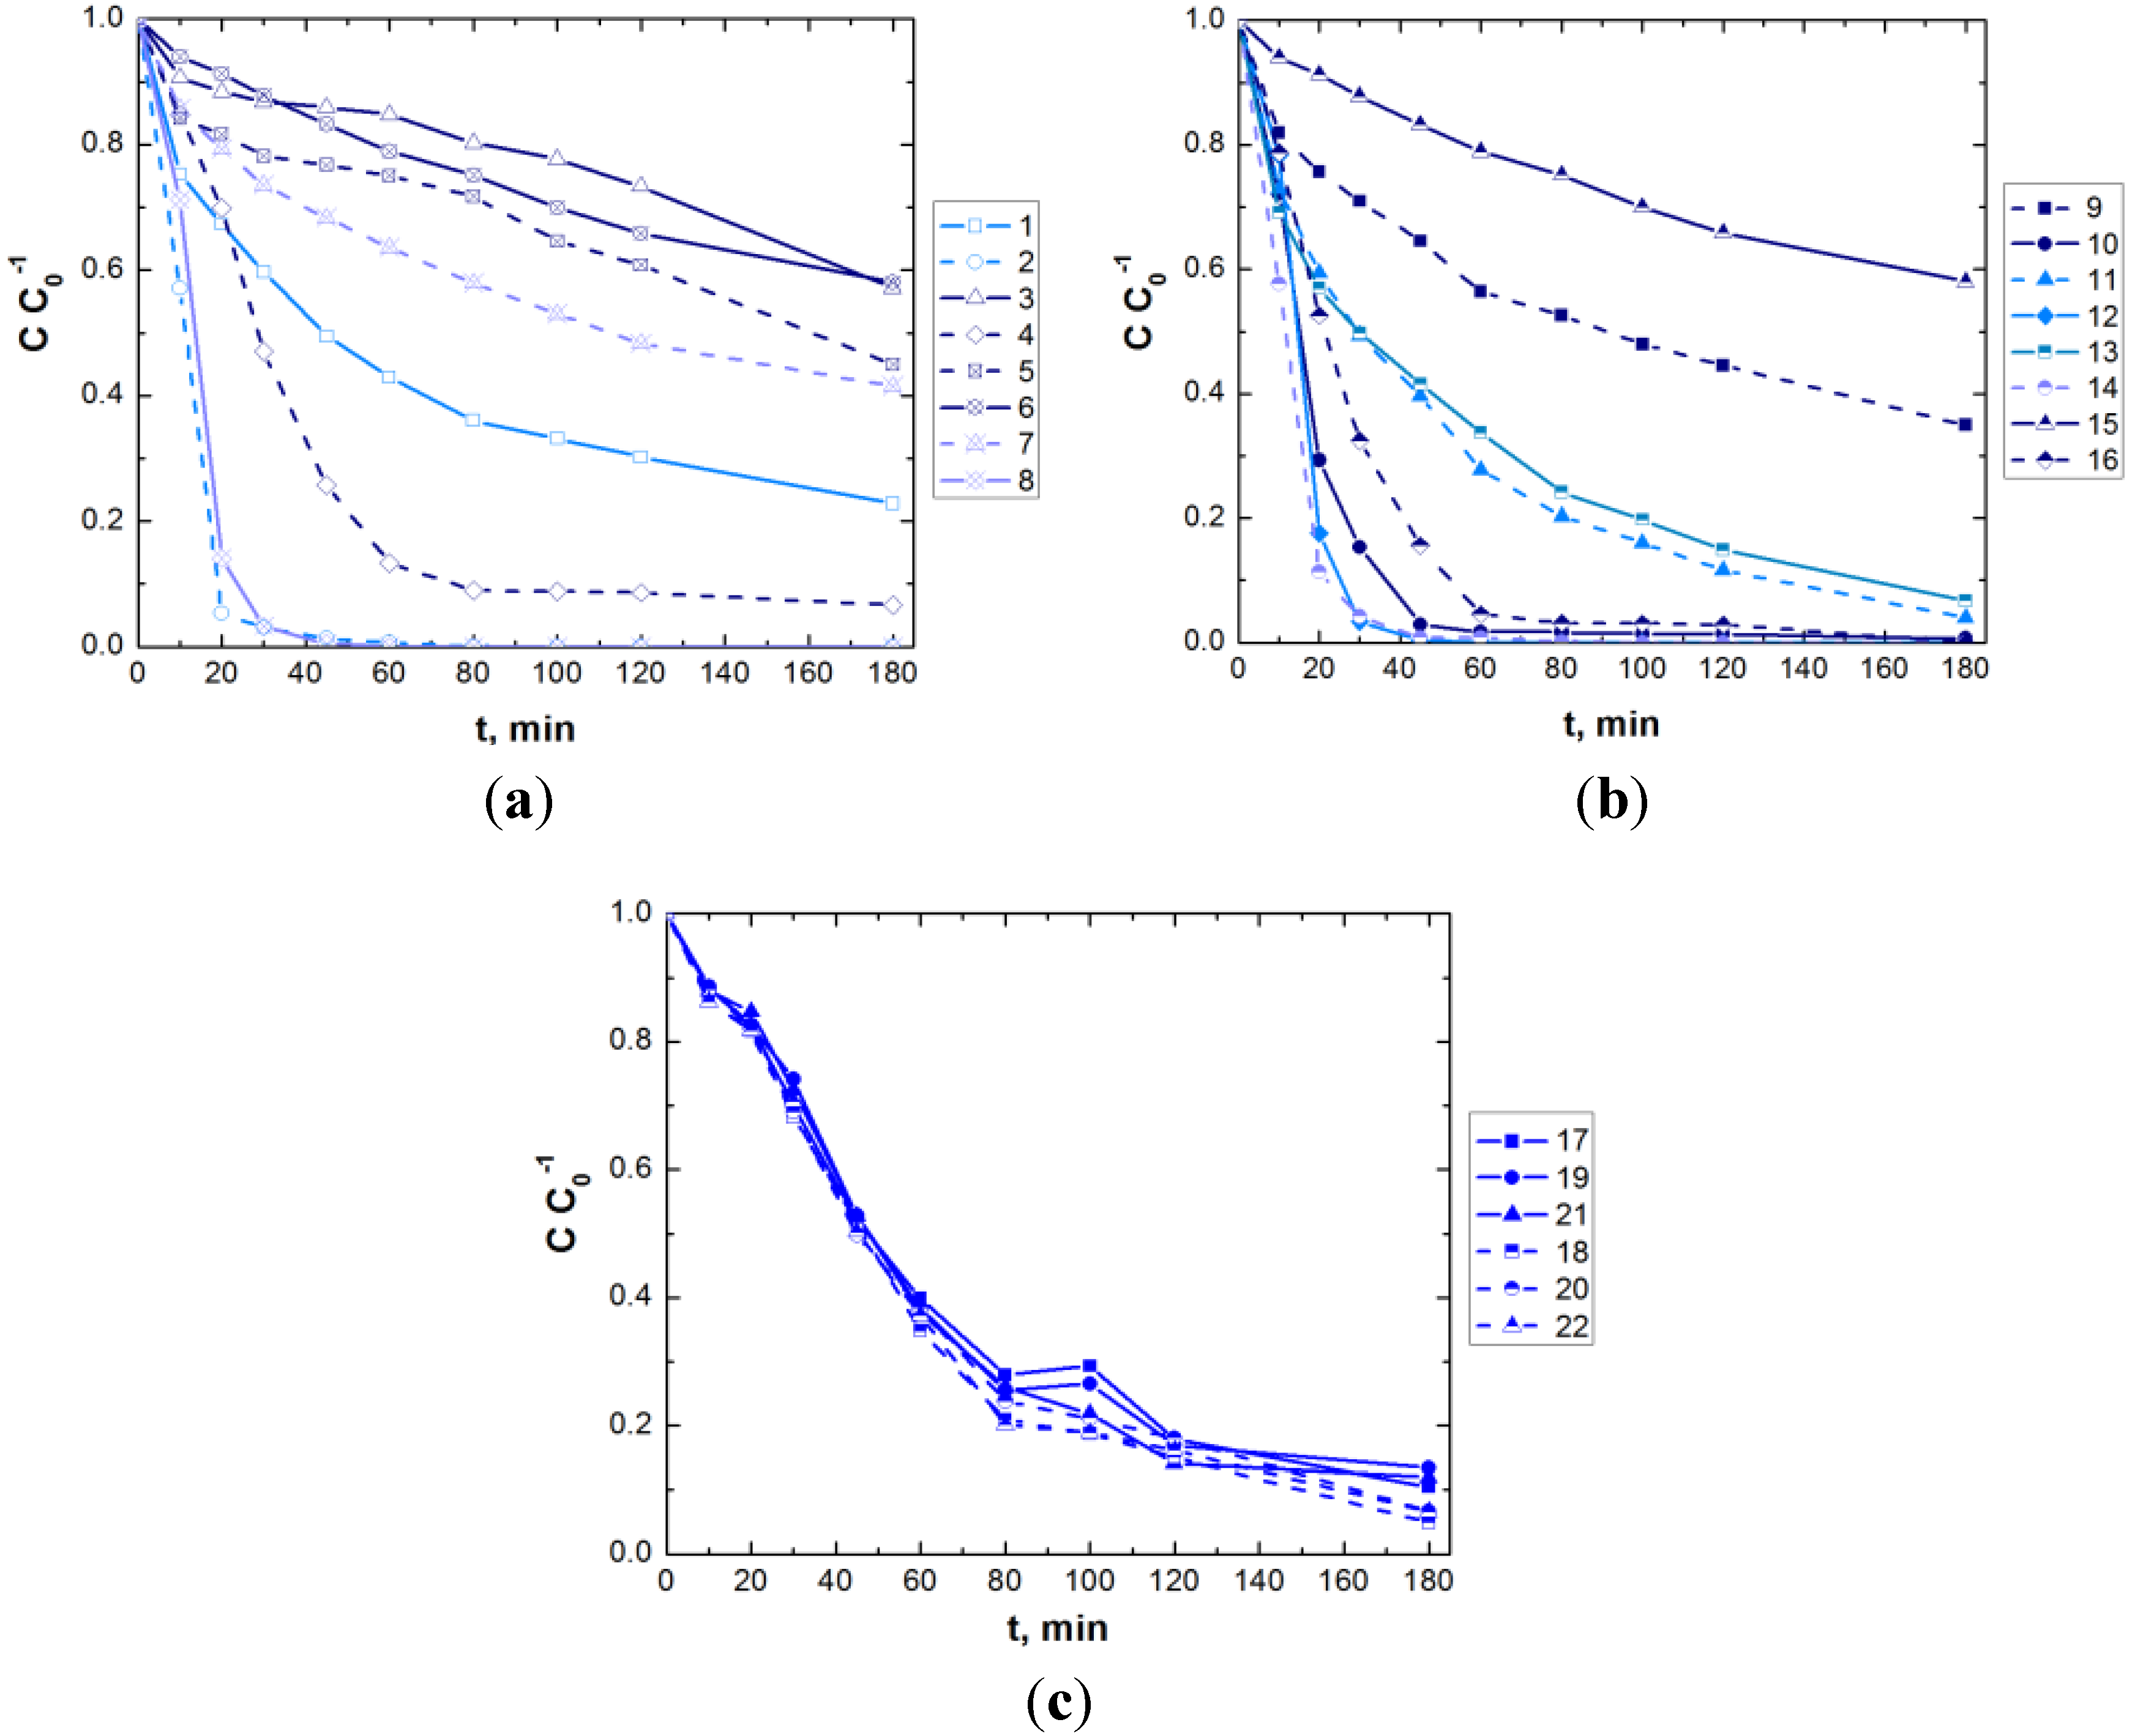
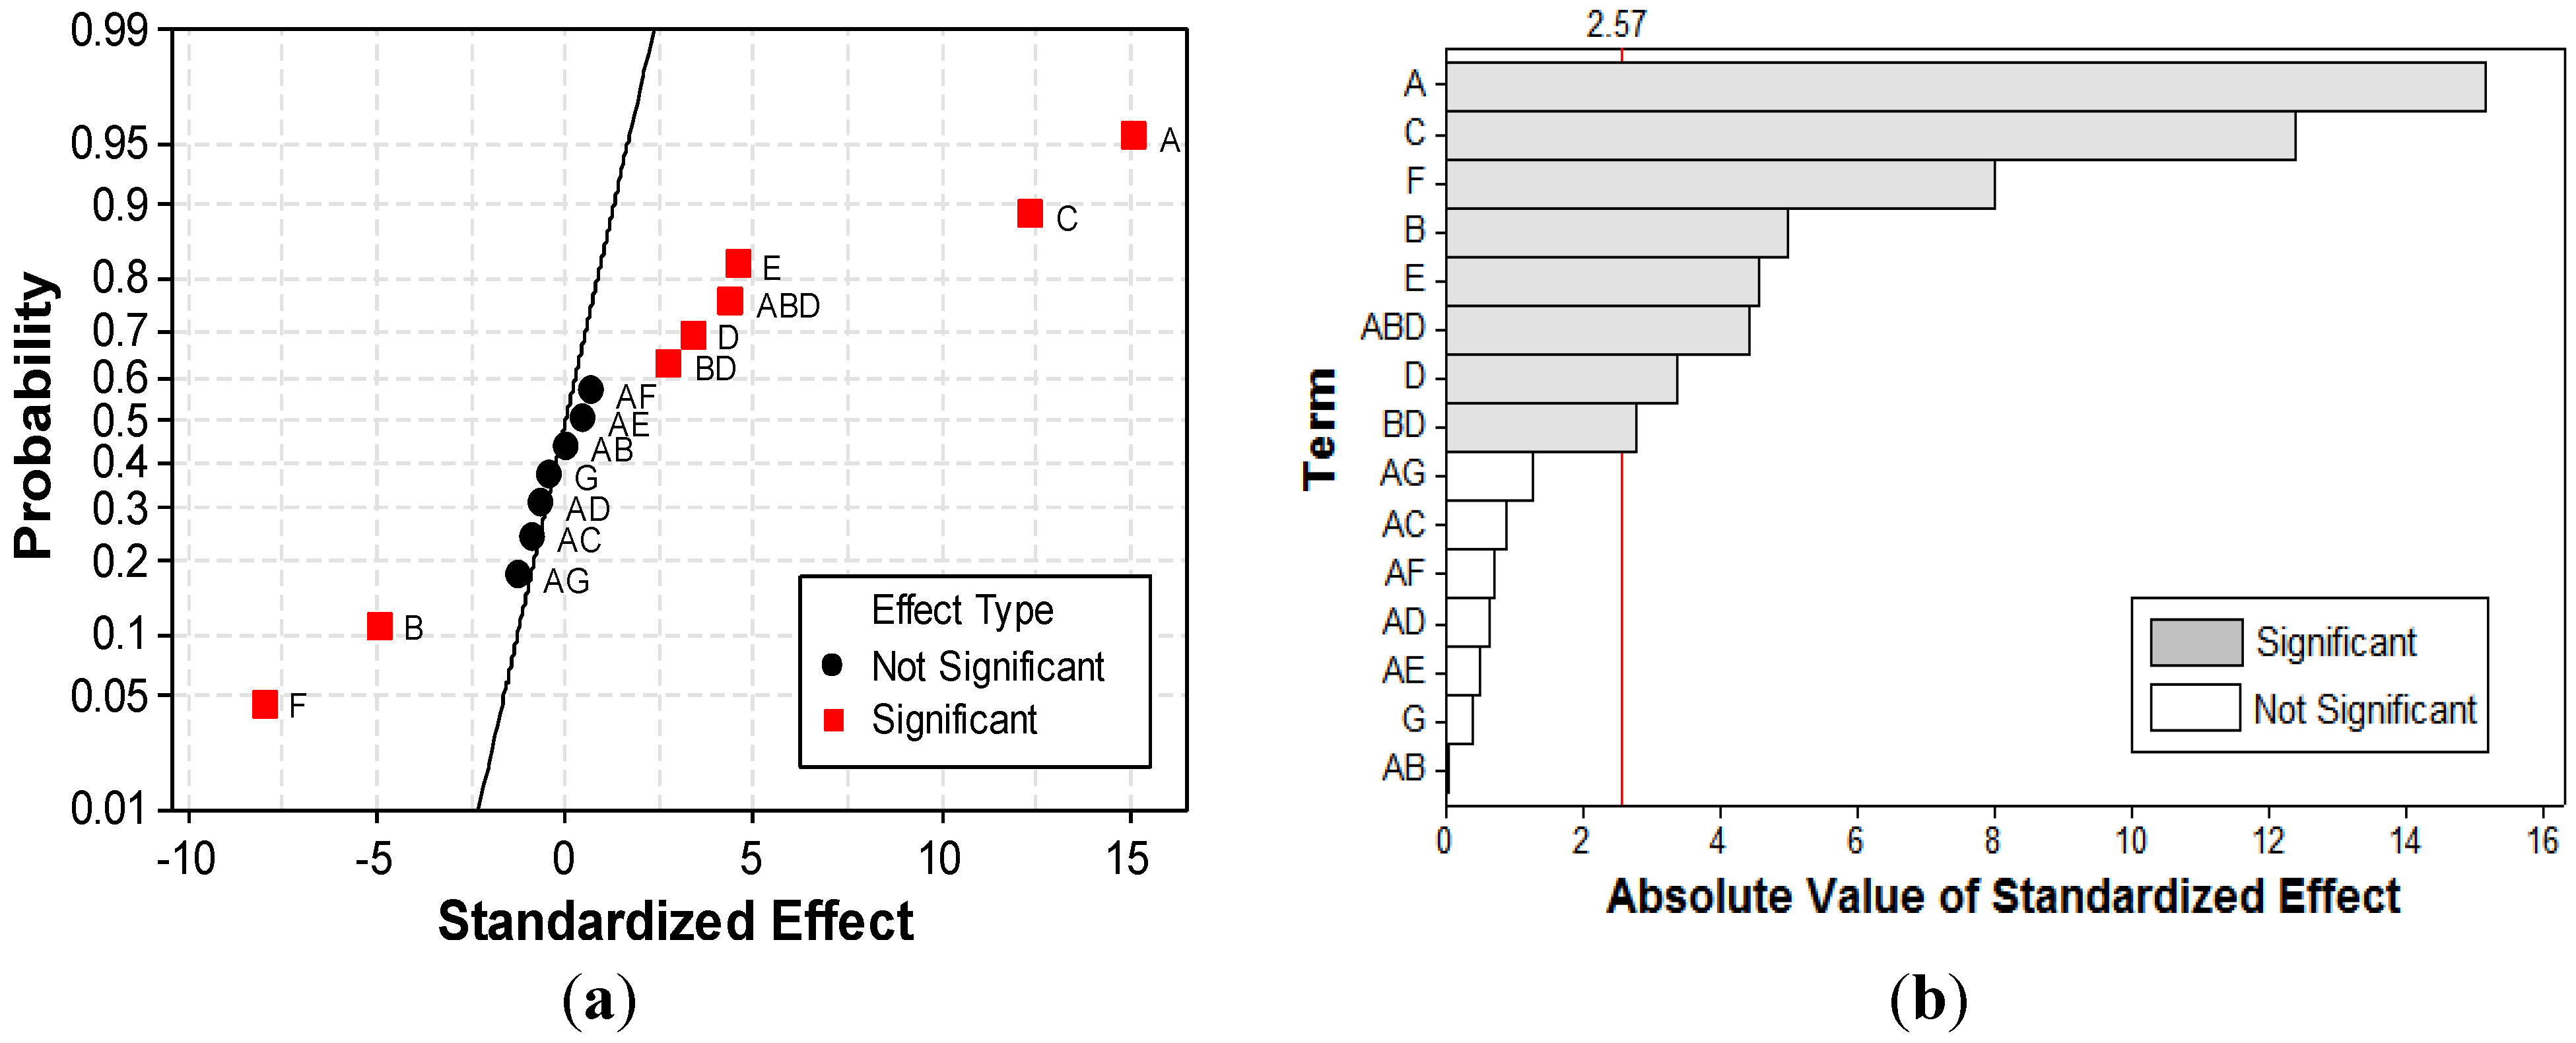
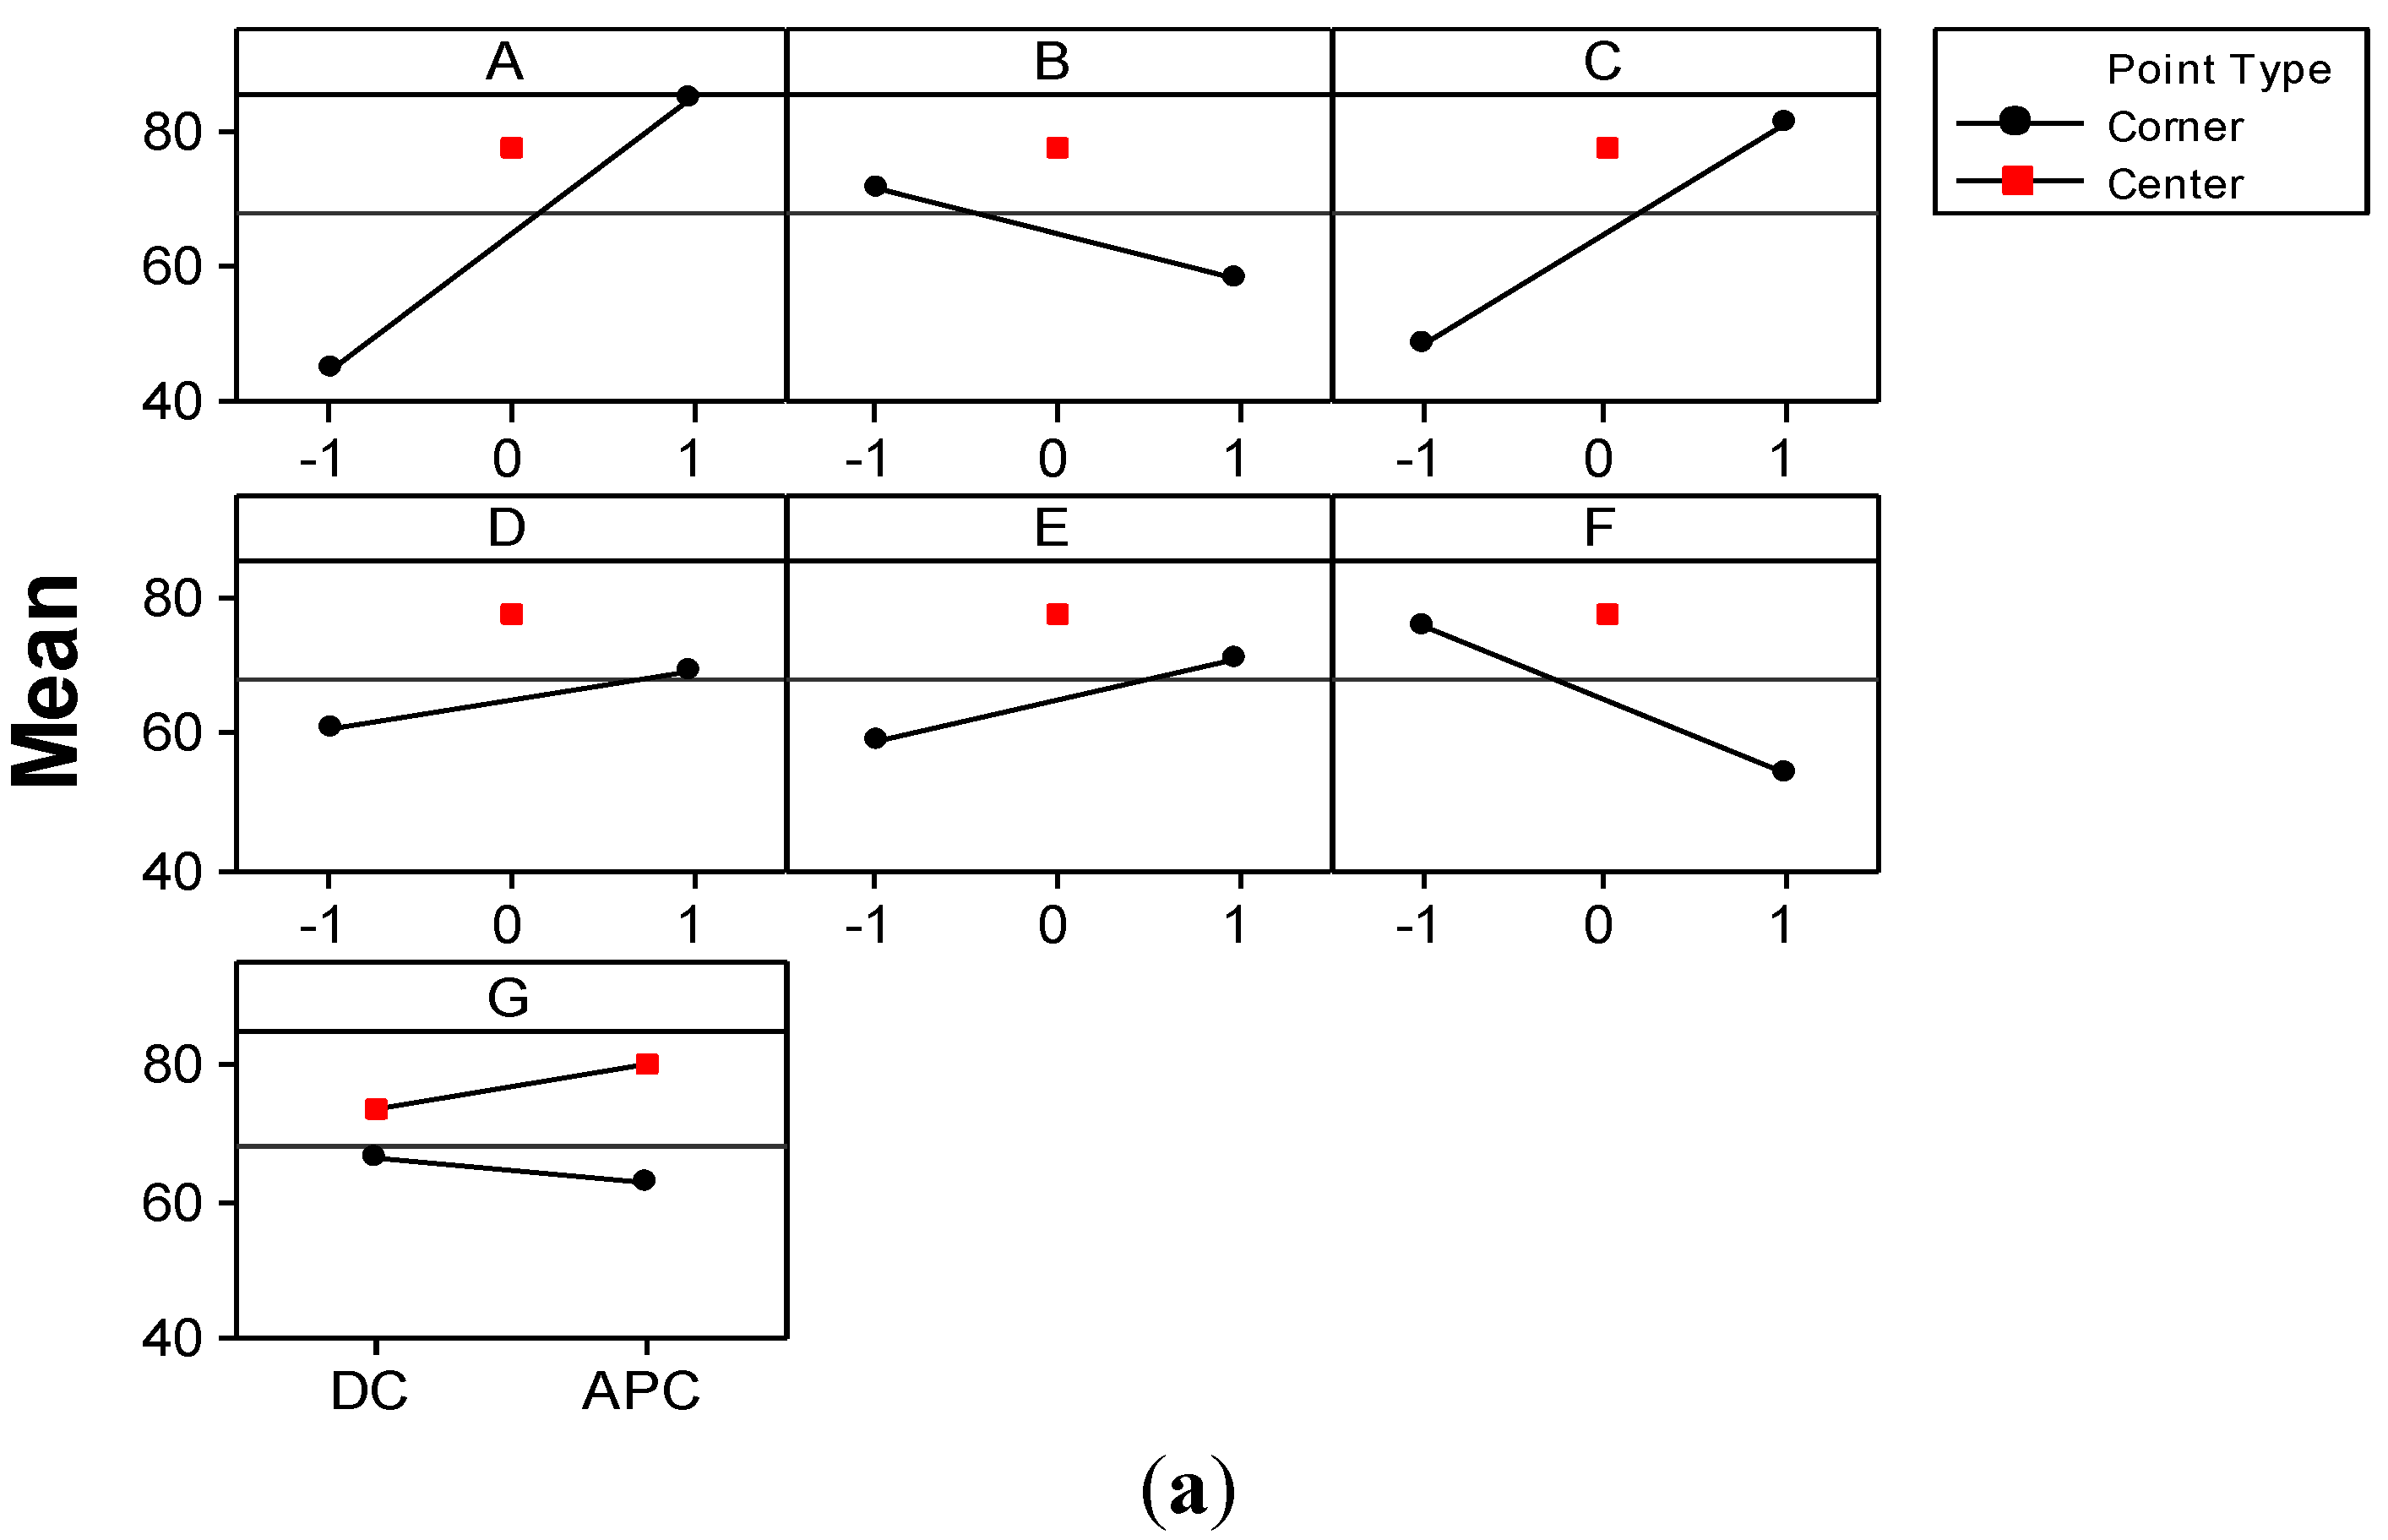
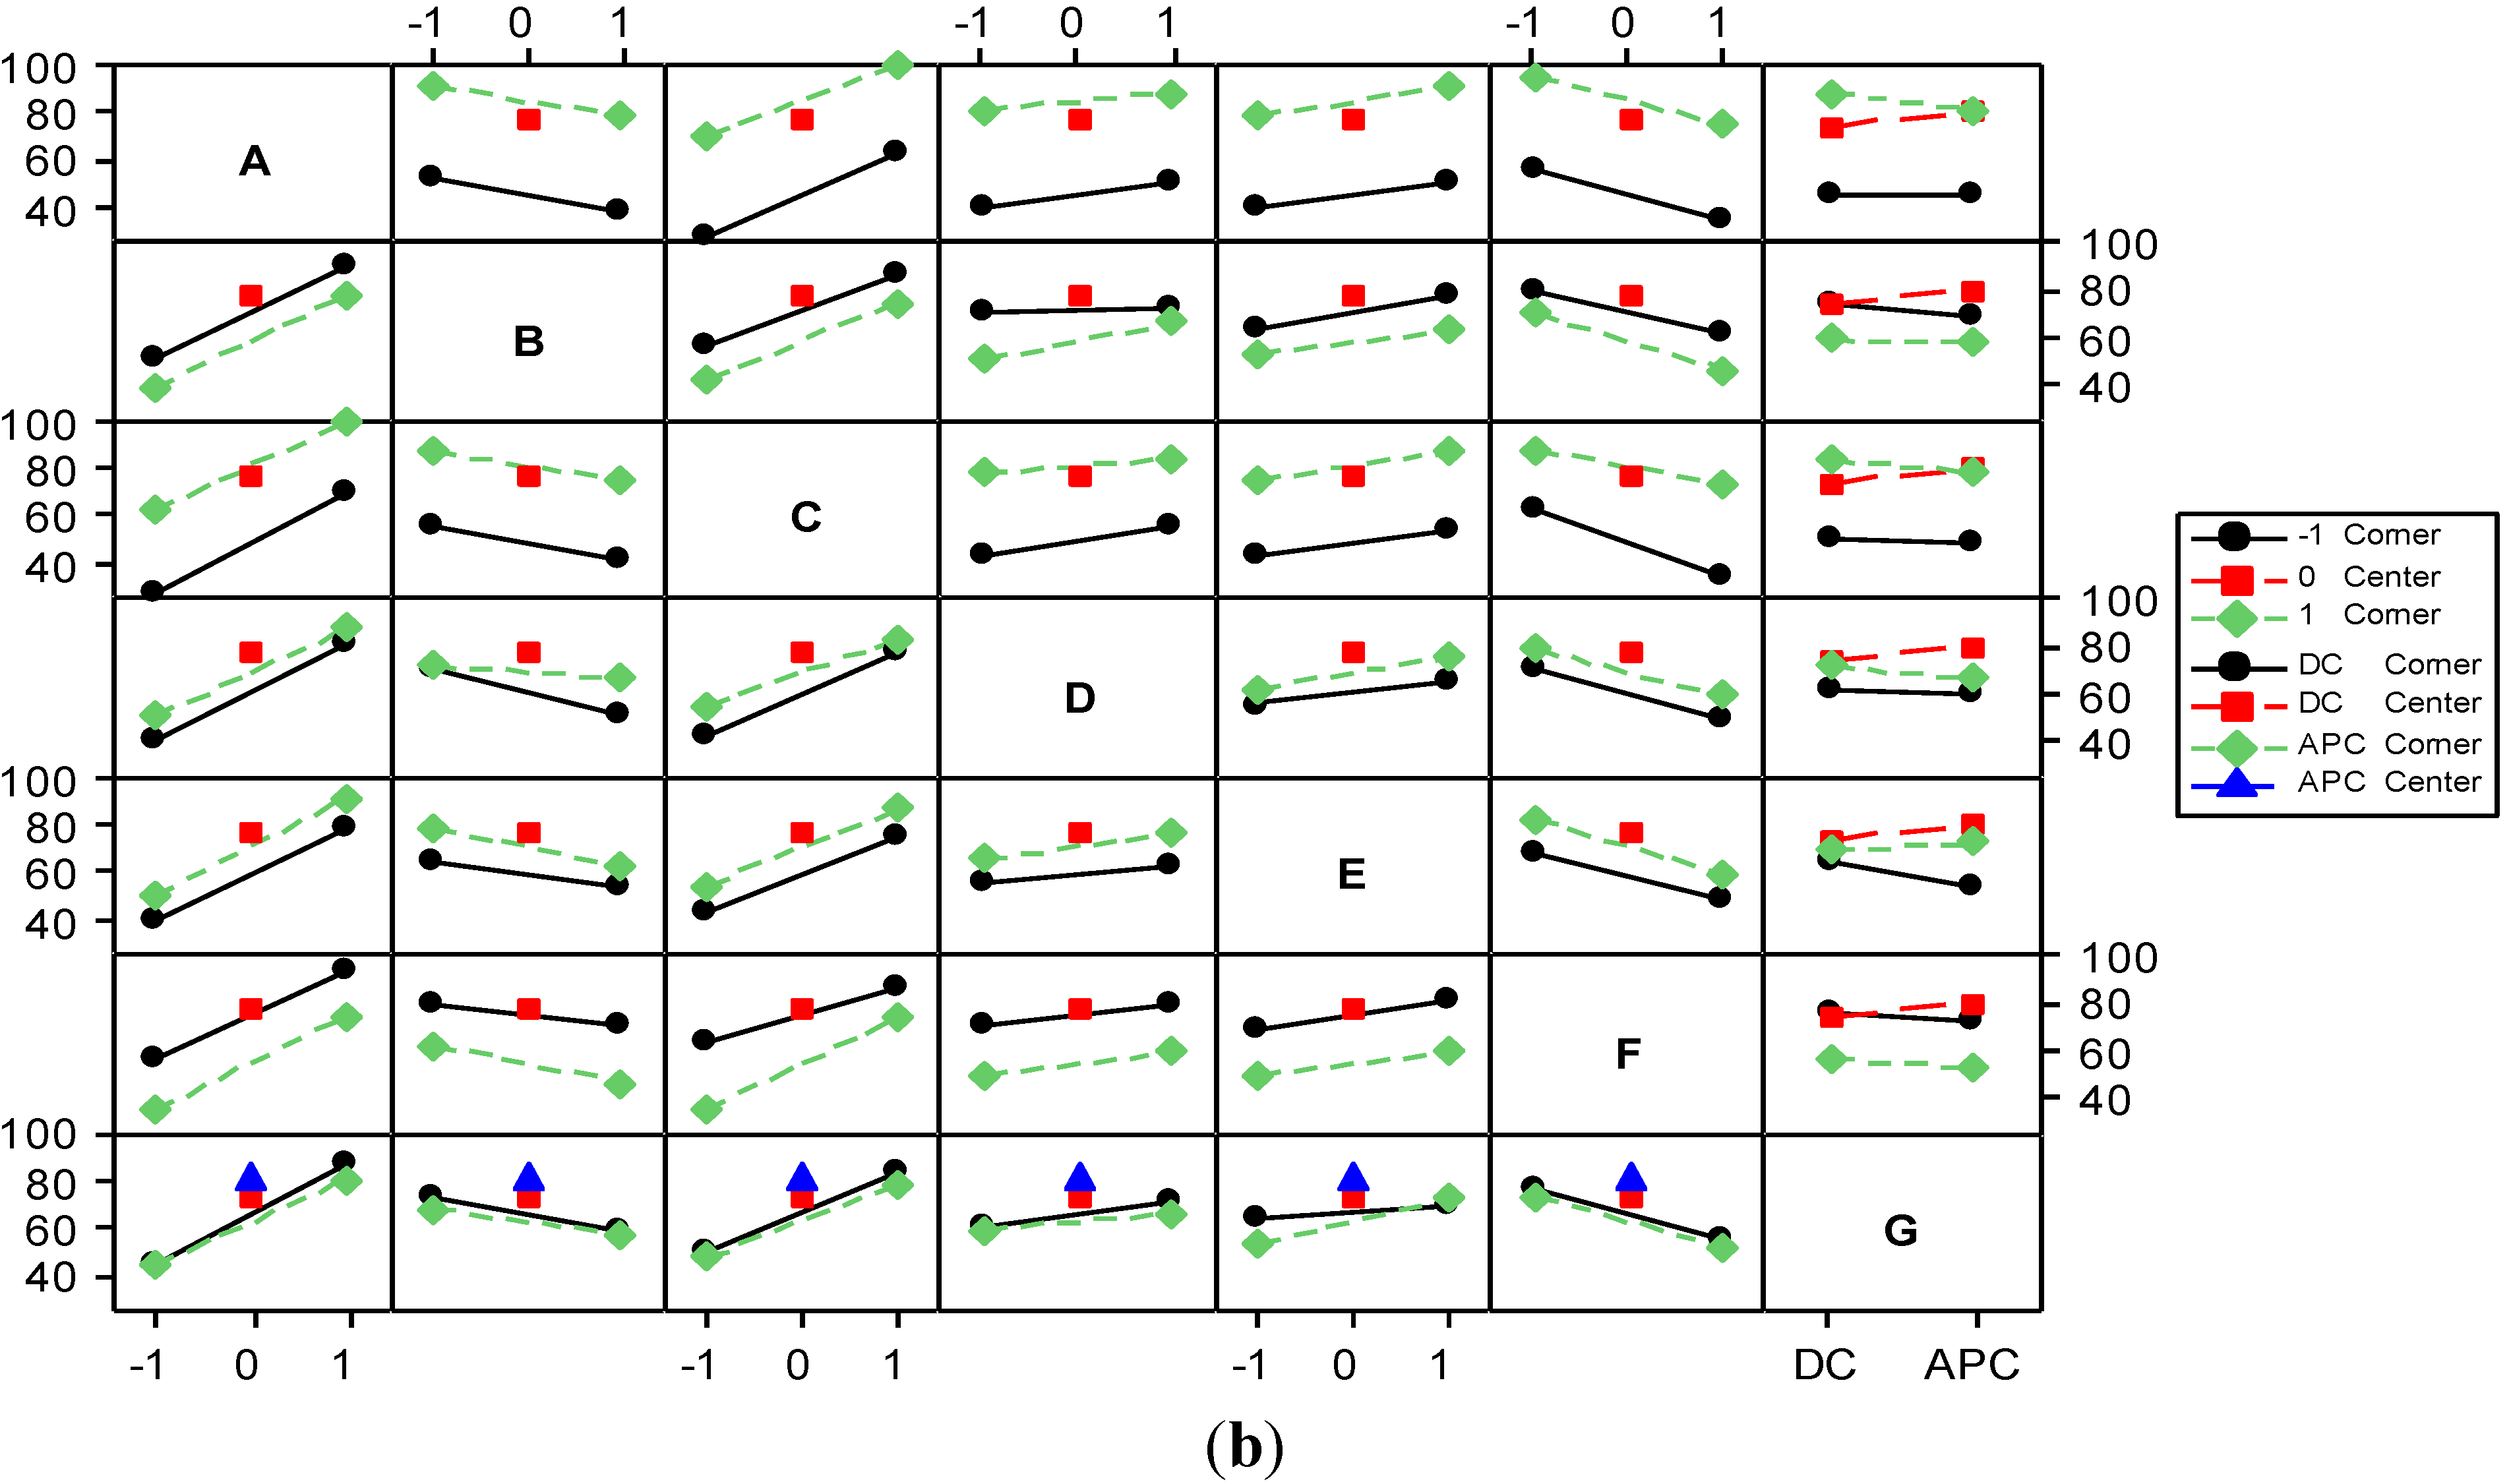
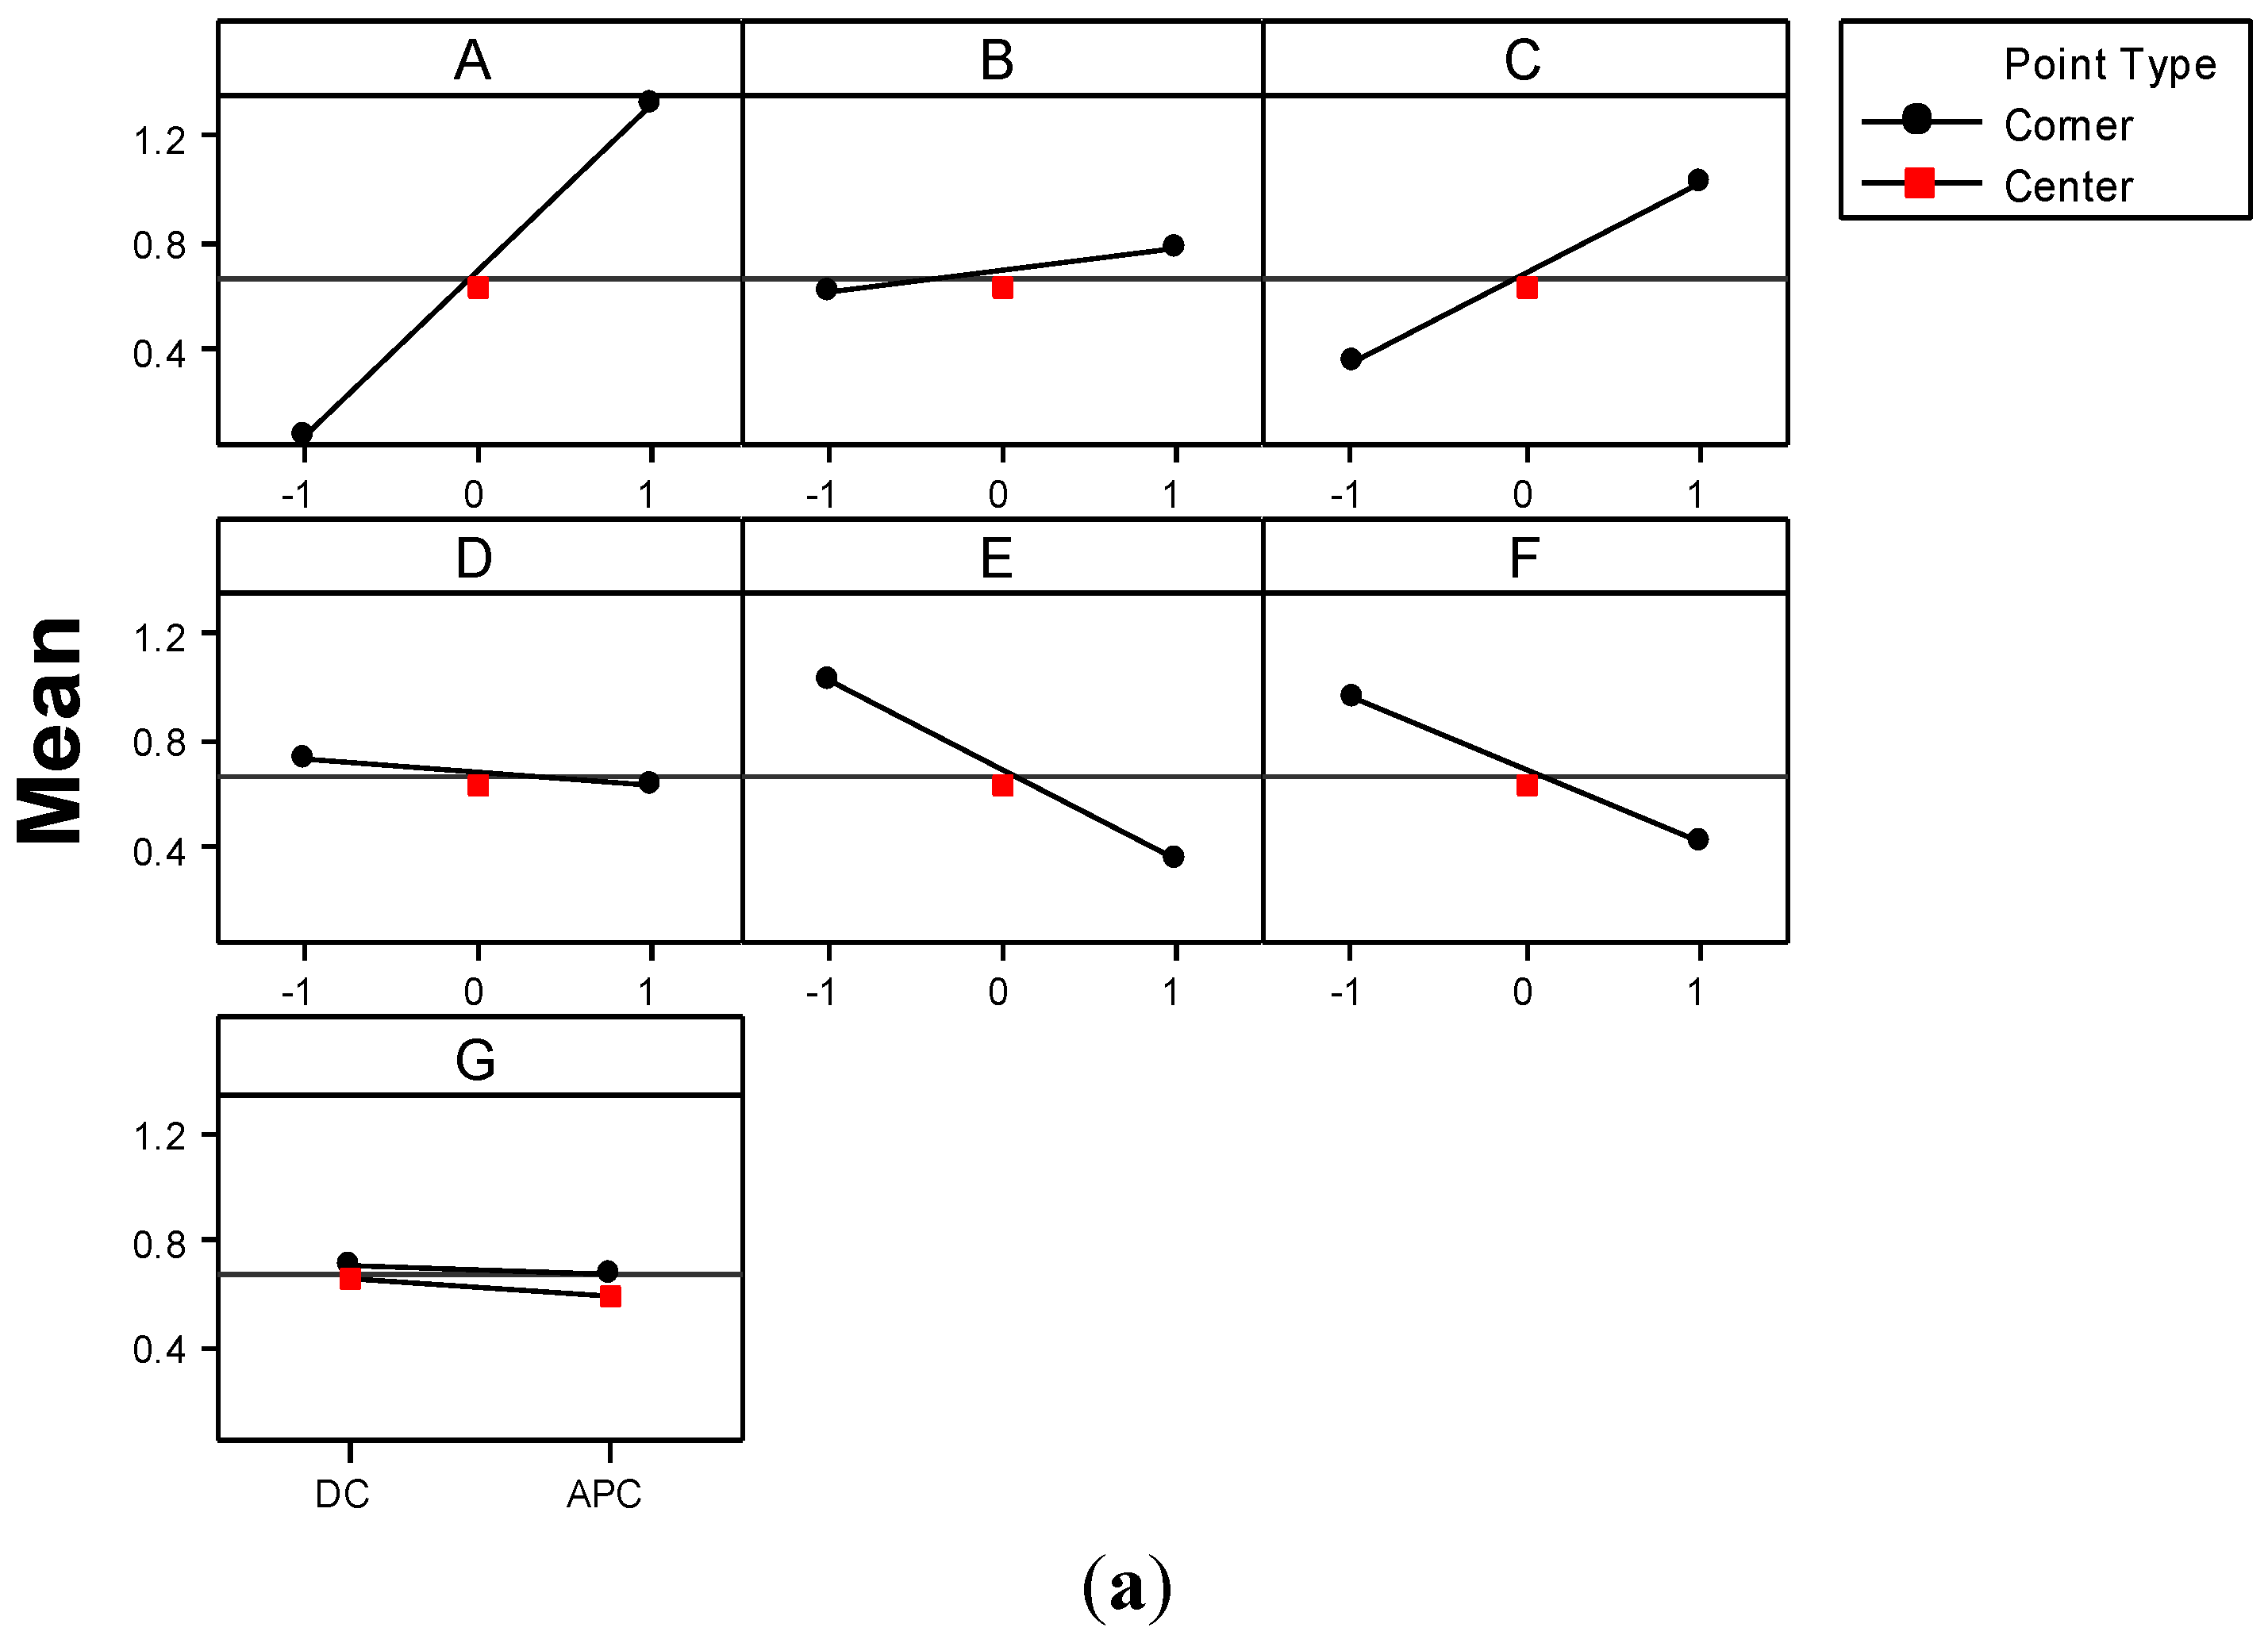
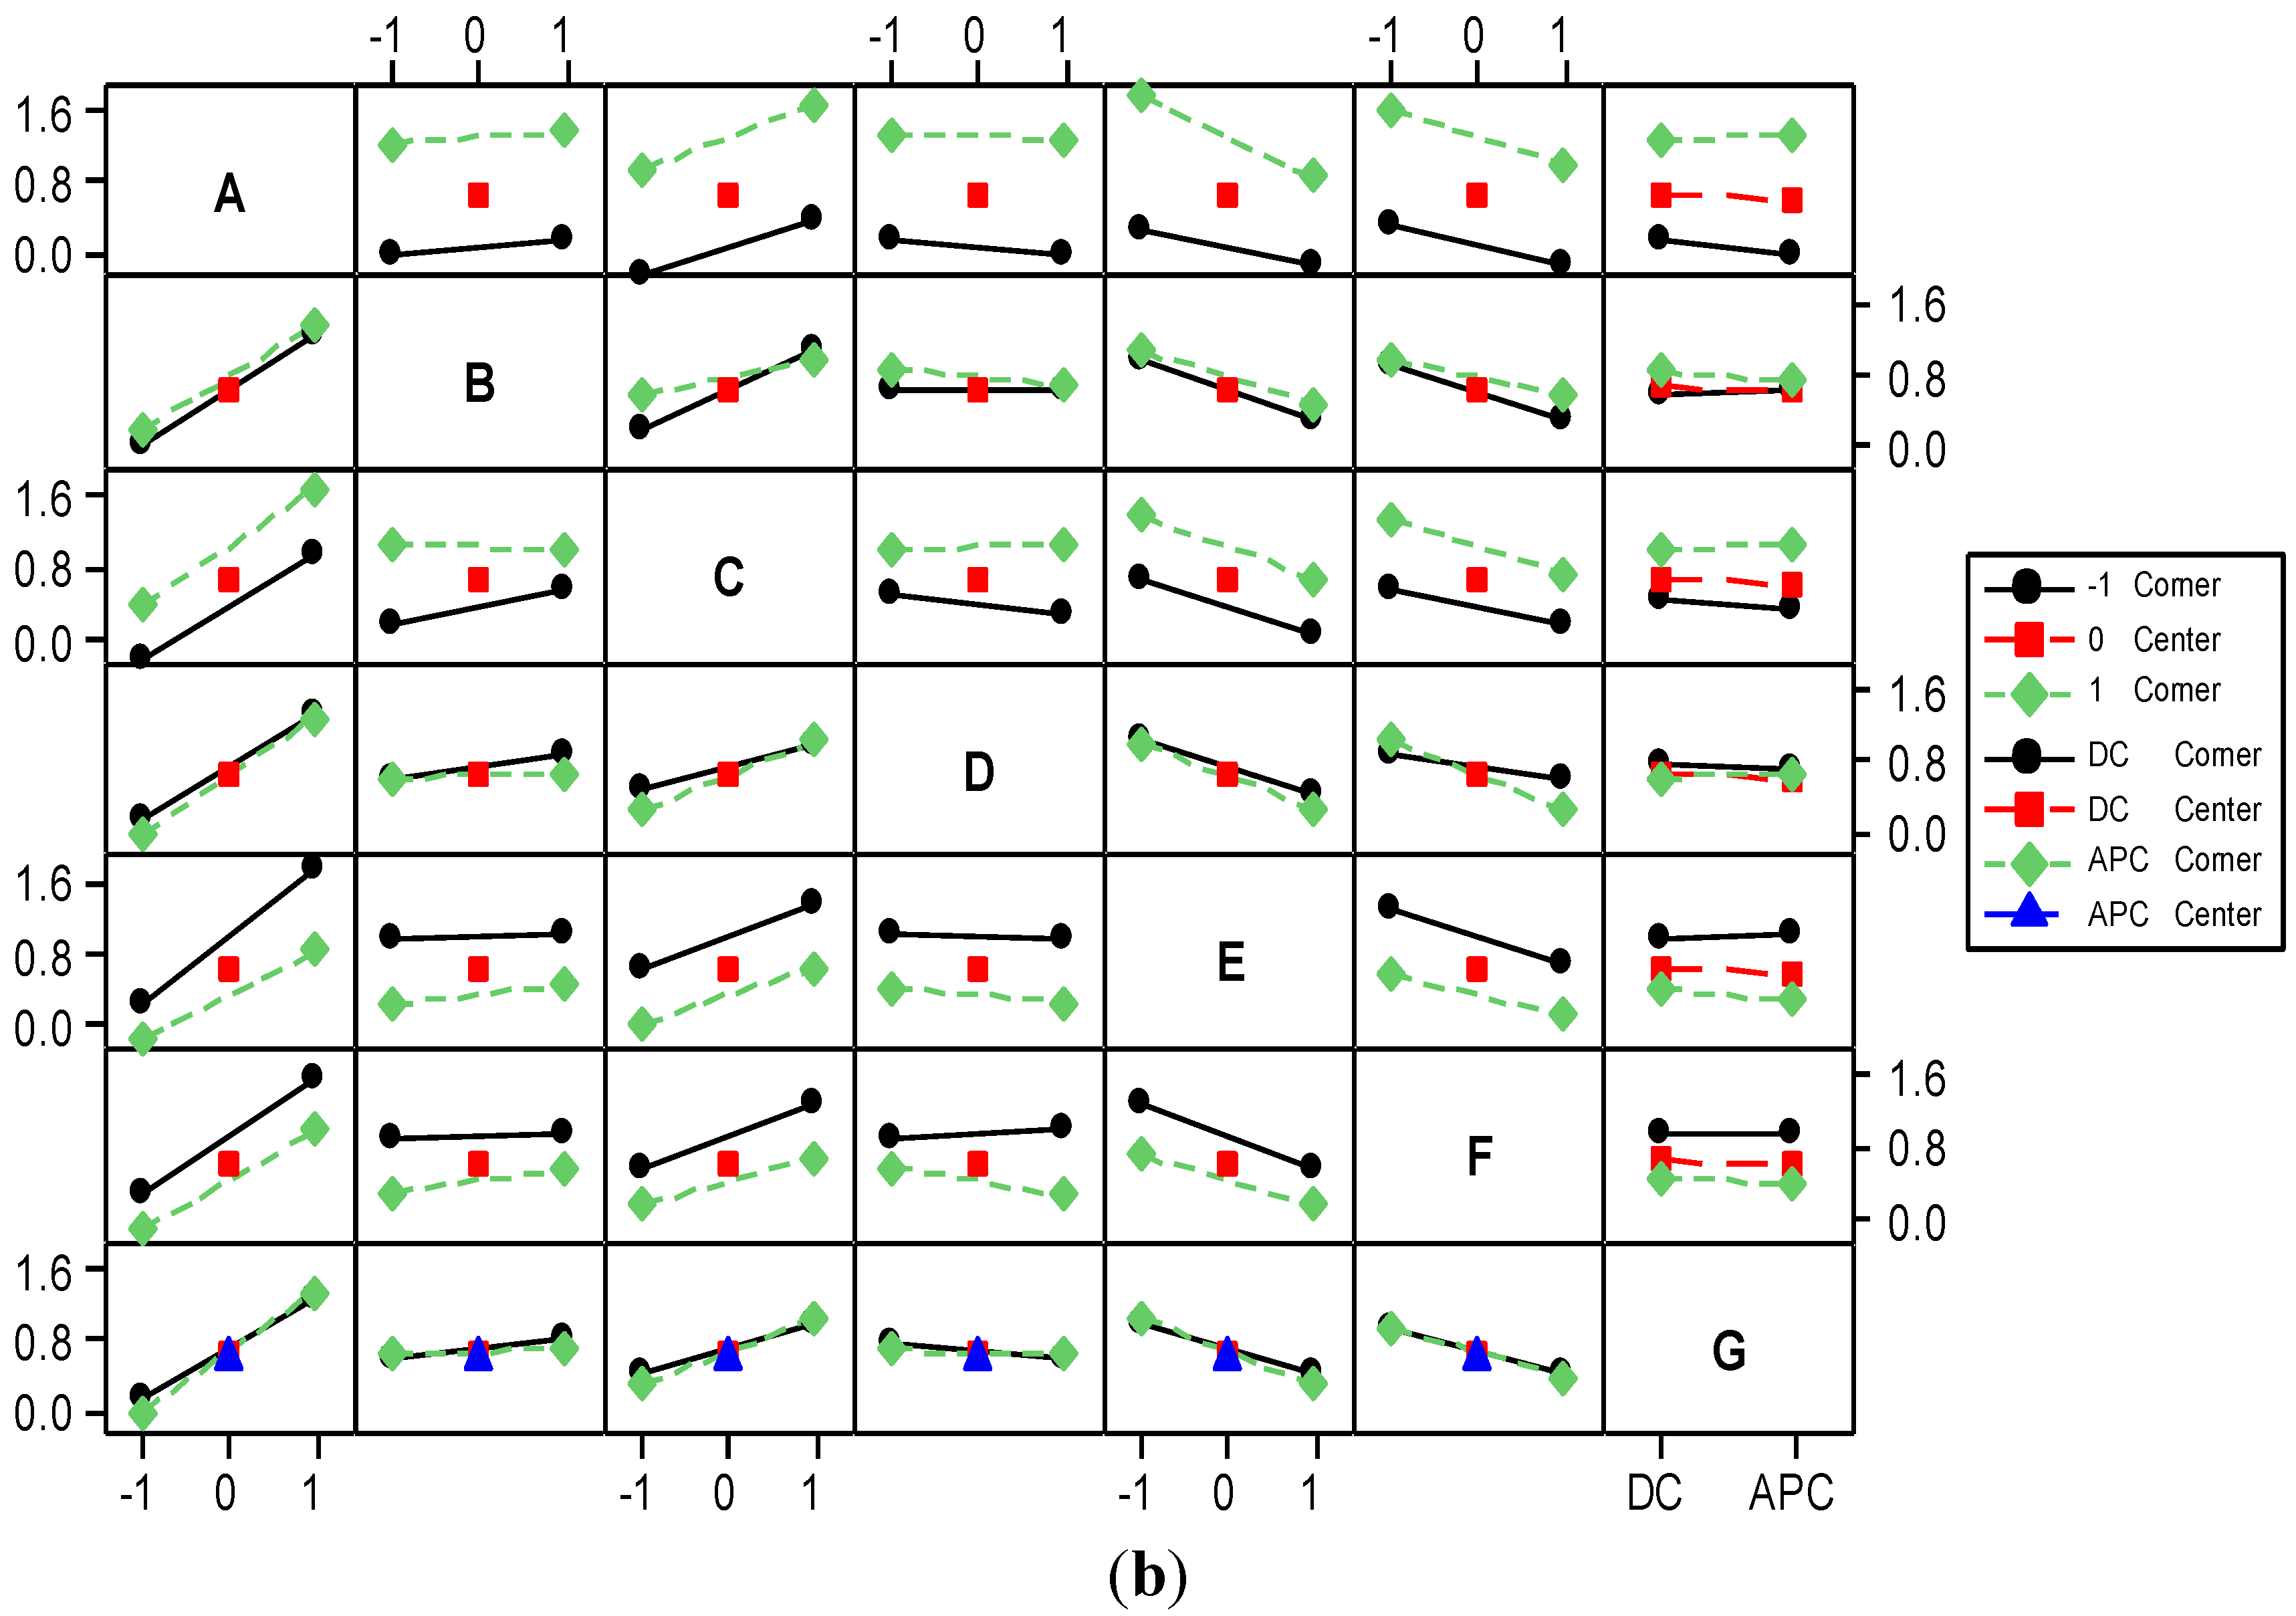
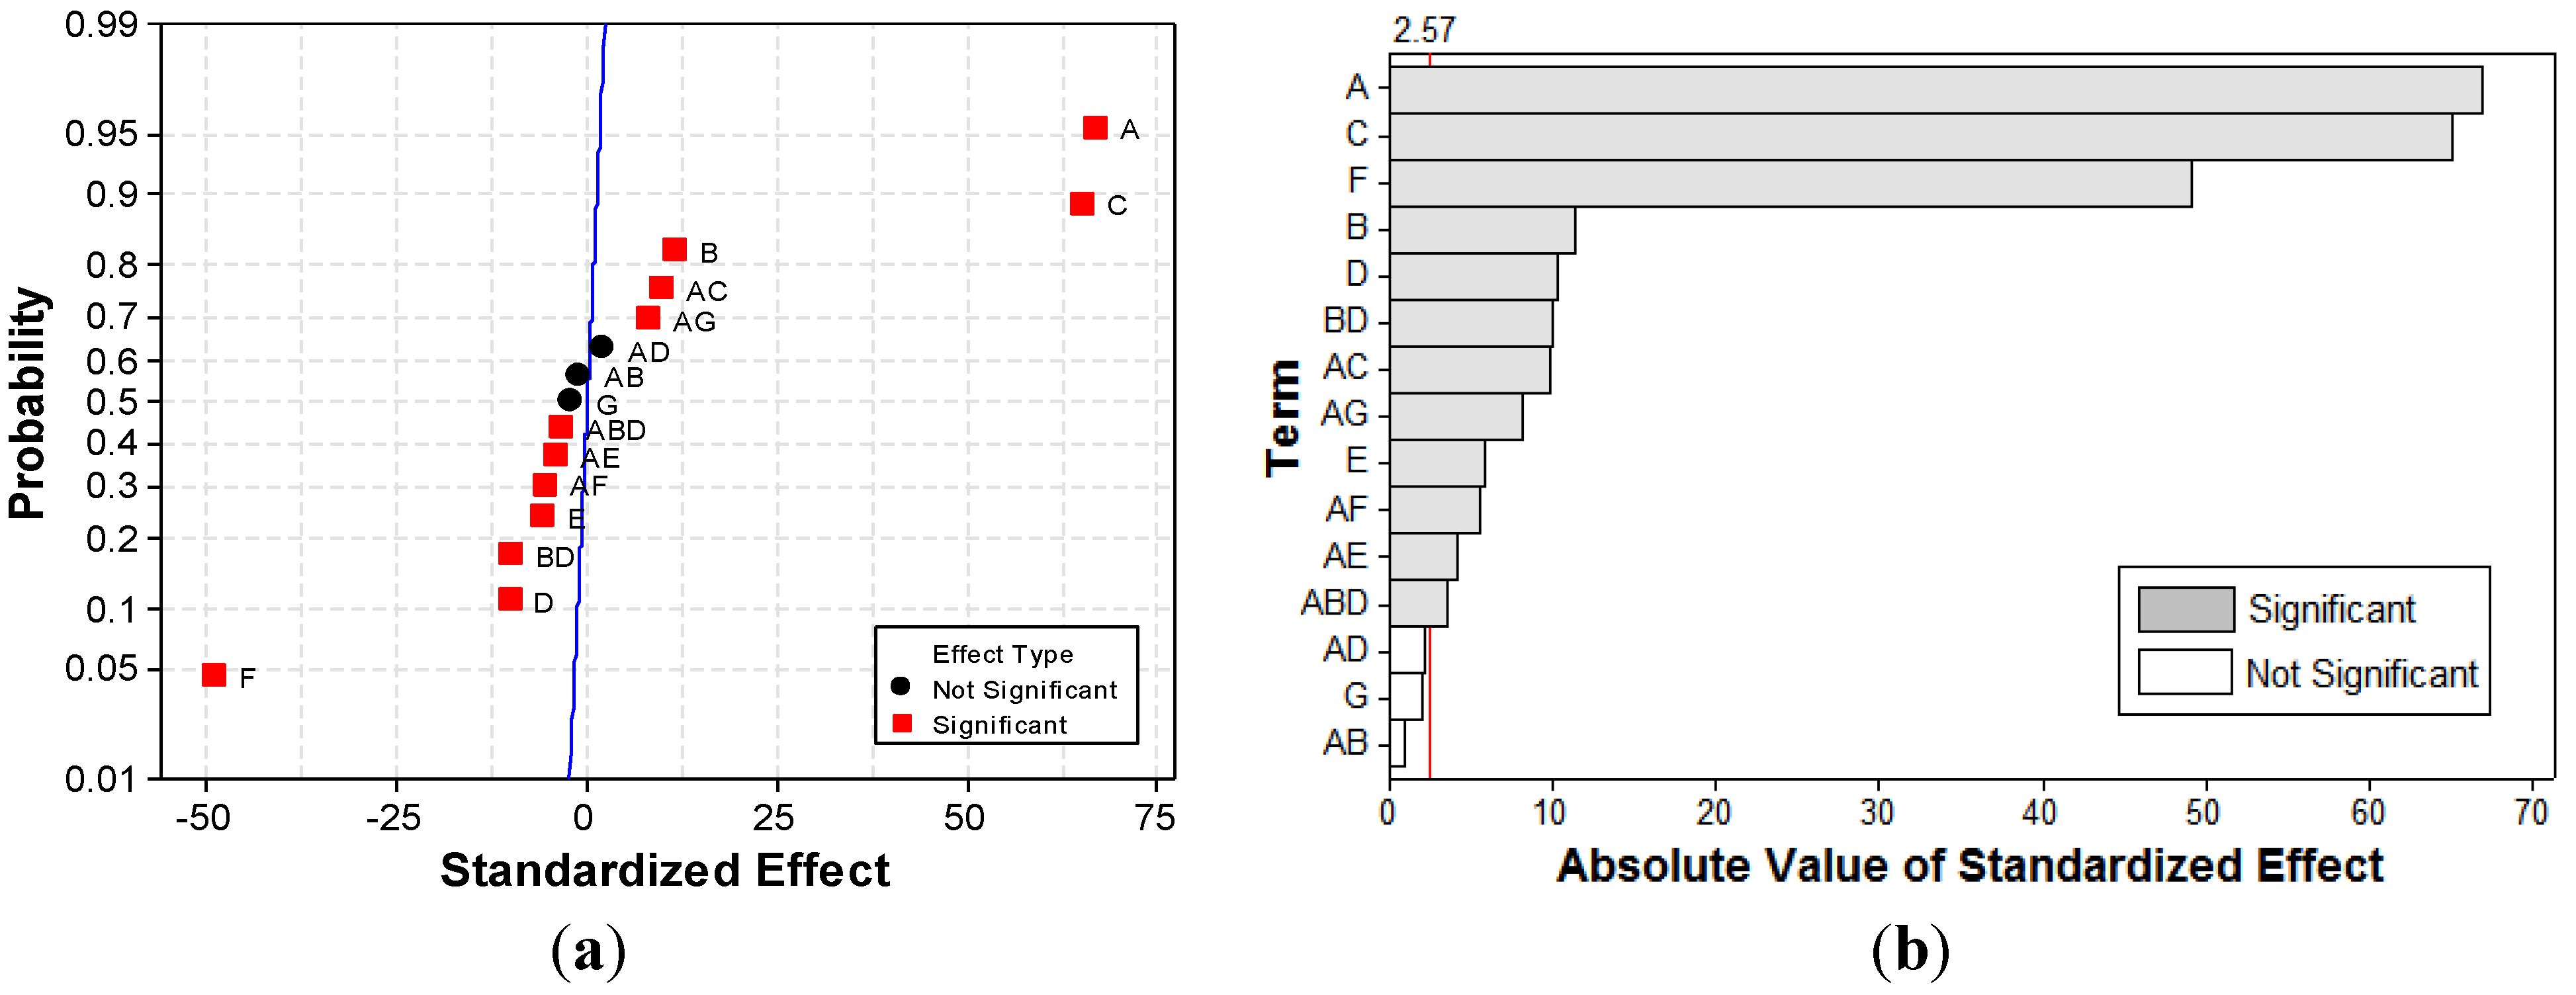
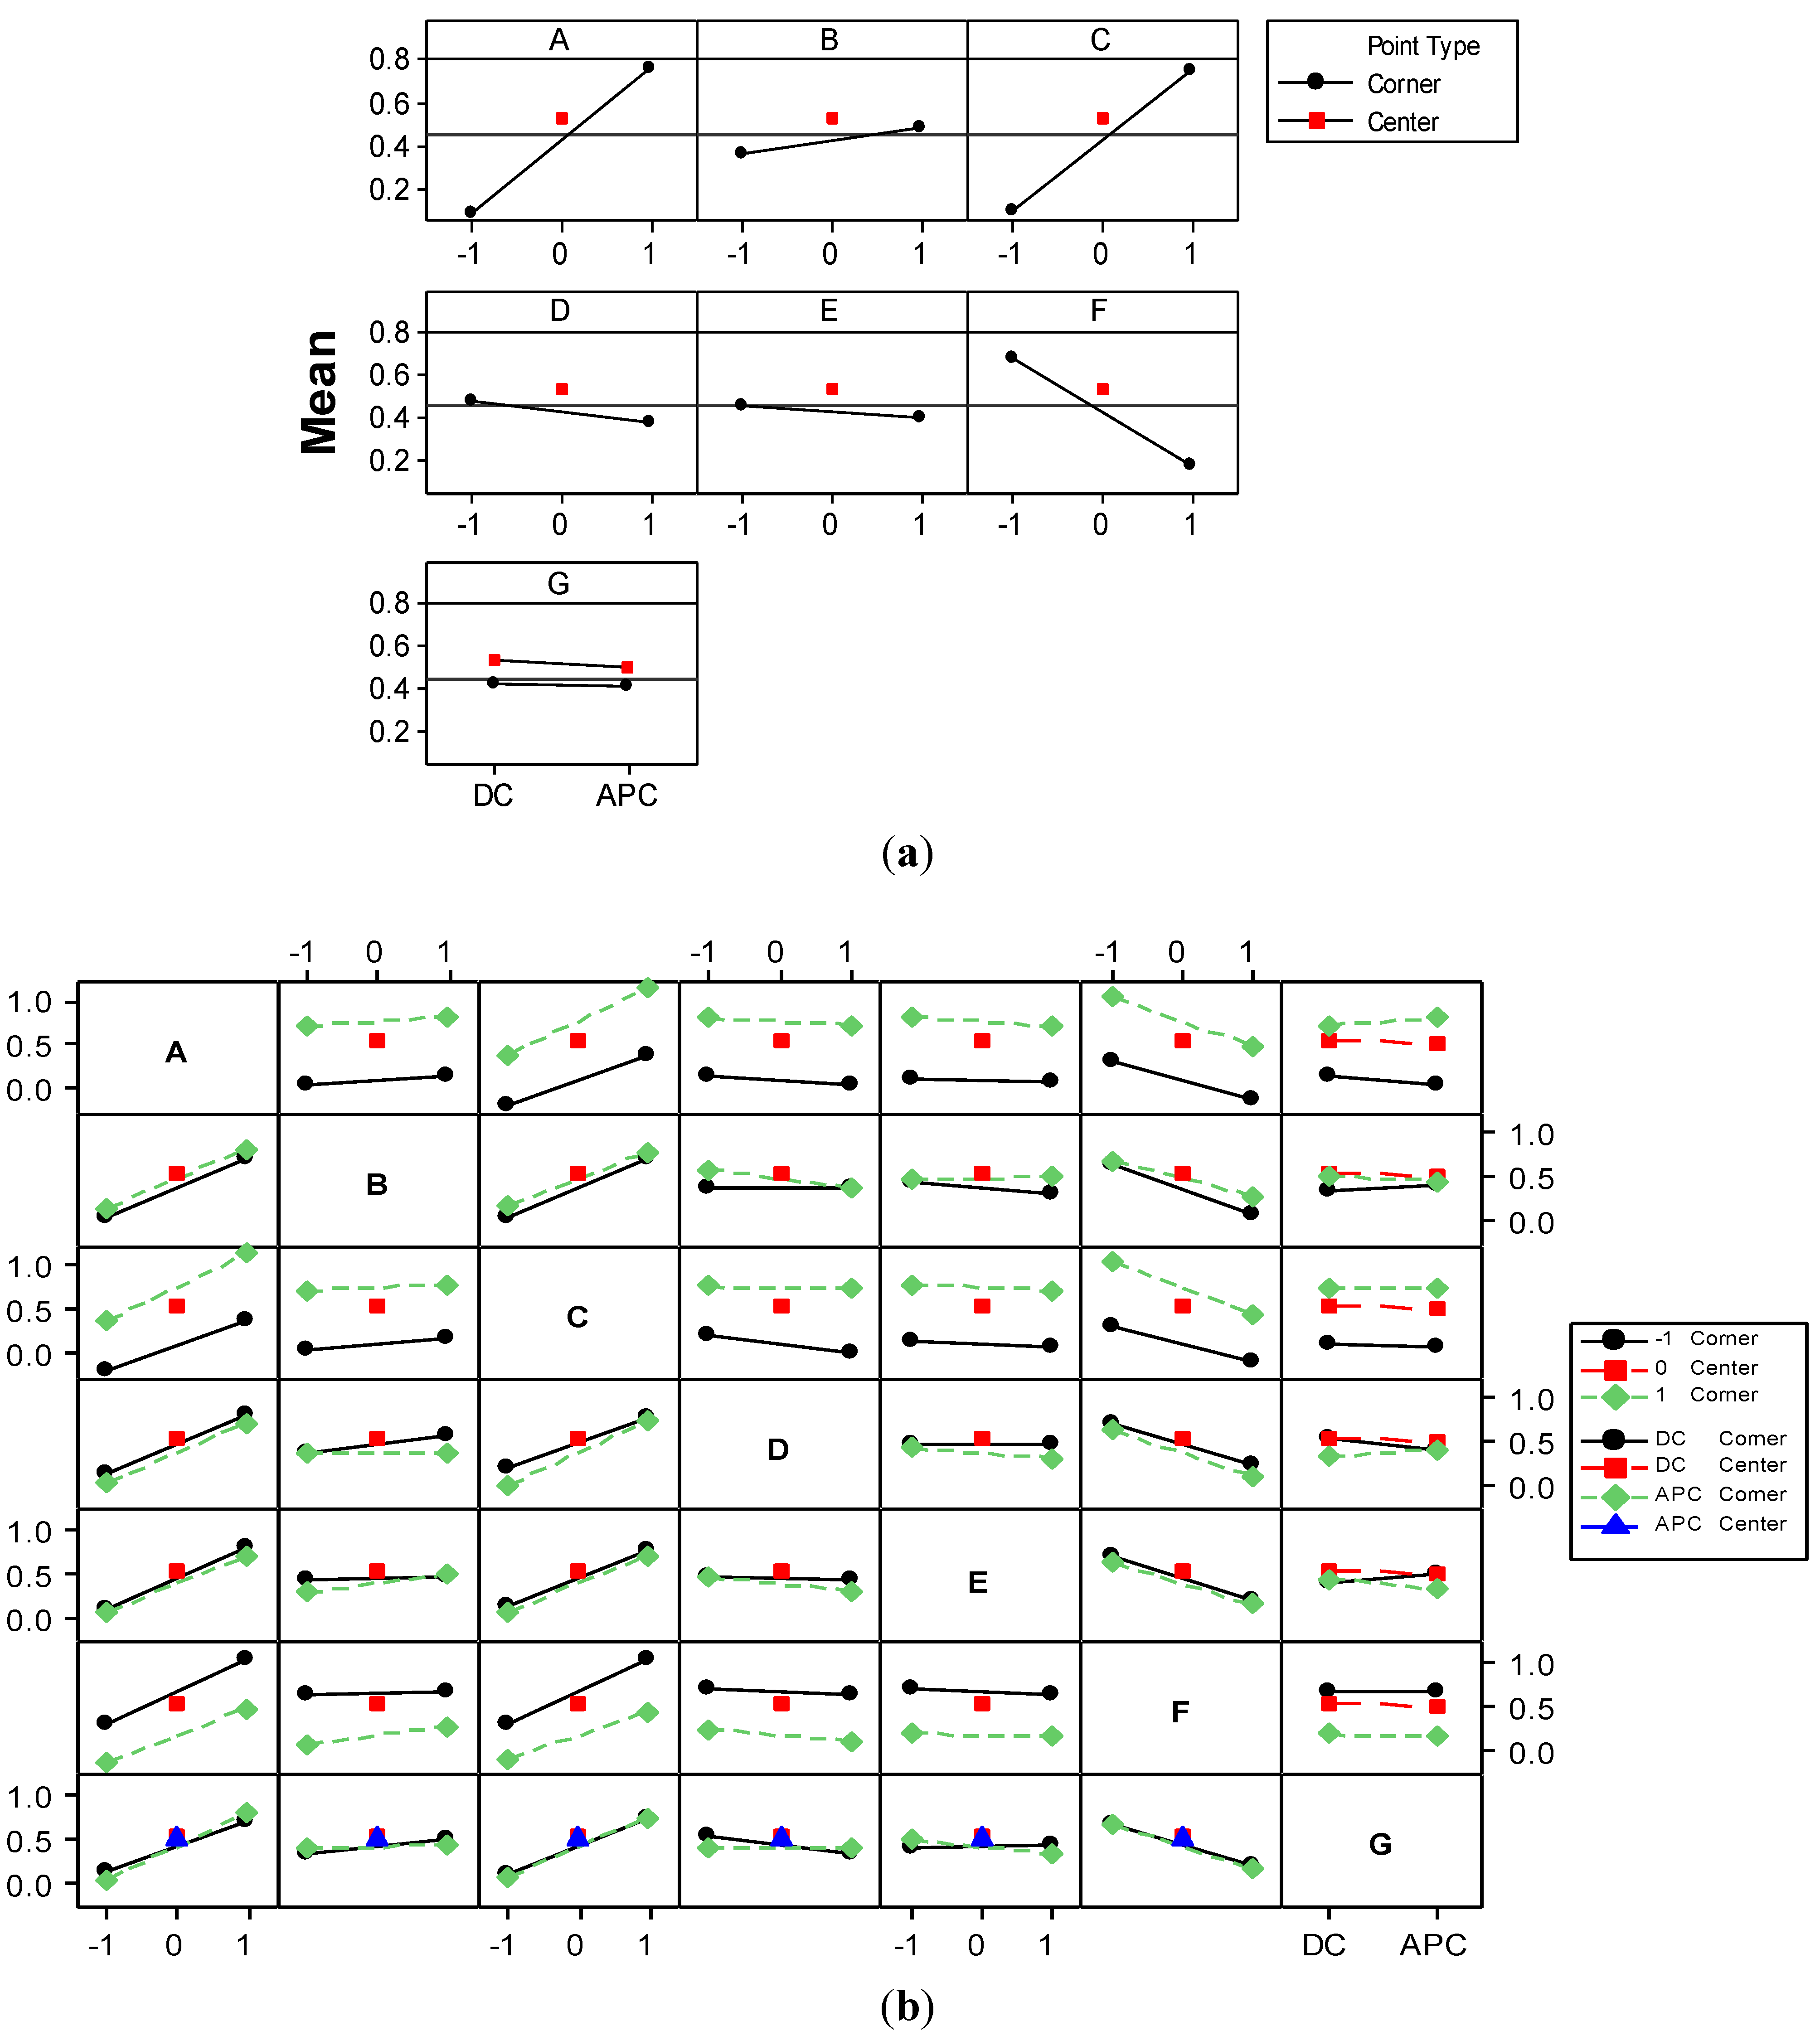
3.1. Effects on the Color Removal Efficiency


| Response | Y, % | UED, kWh/kg | UEMD, kg/kg |
|---|---|---|---|
| Transformation | None | Log | Log |
| Lack of Fit p value | 0.336 | 0.124 | 0.196 |
| Model p value | <0.0001 | <0.0001 | <0.0001 |
| Model F value | 101.71 | 3969.8 | 1628.9 |
| Curvature p-value | <0.0001 | 0.002 | <0.0001 |
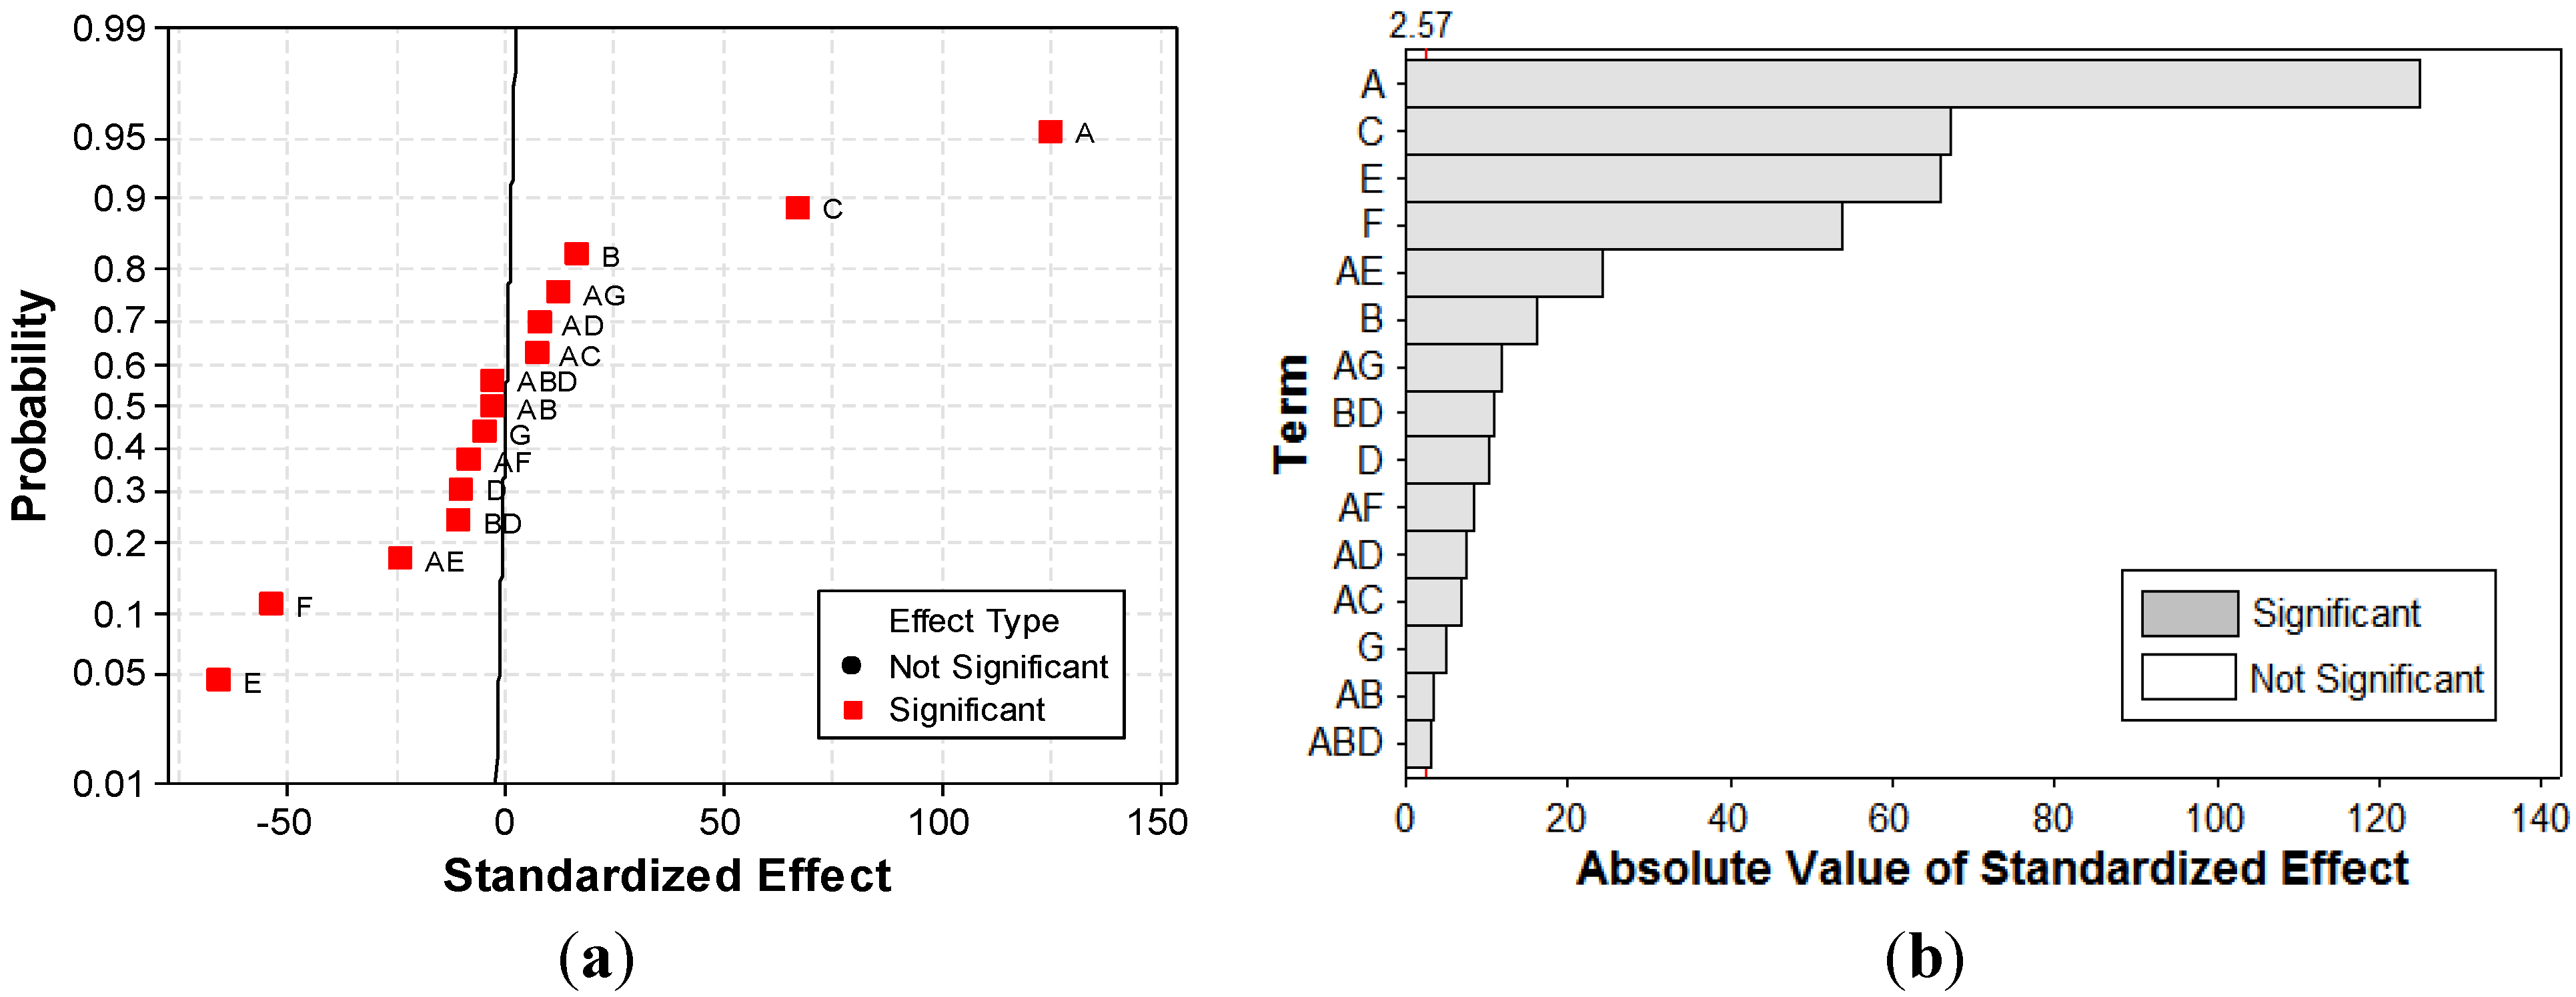
| Significant model terms | – | – | – |
| * | A, B, C, D, E, F, ABD | A, B, C, D, E, F, G, AC, AD, AE, AF, BD | A, B, C, D, E, F, AC, AD, AE, AF, BD |
| ** | BD | AB, ABD | ABD |
| *** | – | – | G, AD |
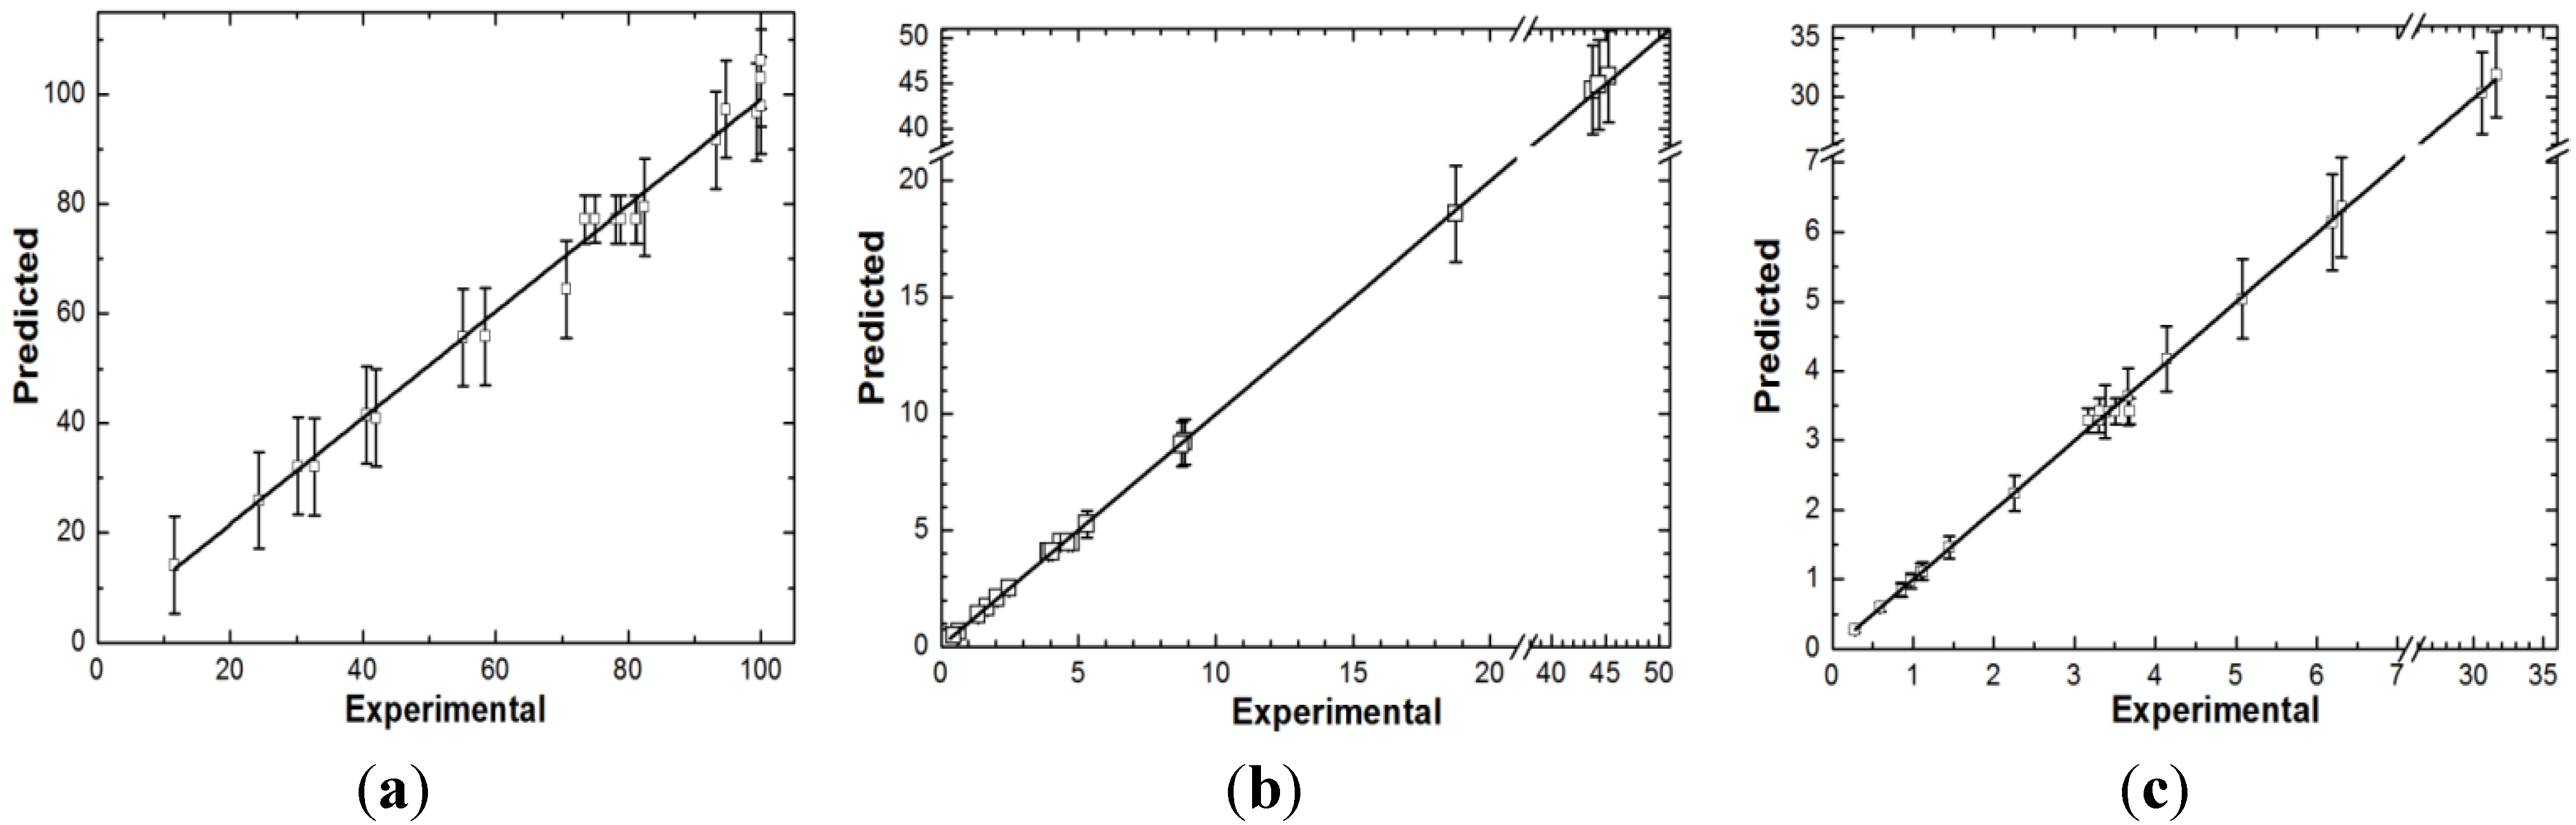
| R2 | 0.9854 | 0.9998 | 0.9996 |
| Radj2 | 0.9693 | 0.9993 | 0.8342 |
| Rpred2 | 0.835 | 0.9187 | 0.9982 |
| PRESSa | 2586 | 0.9342 | 0.8183 |
| Sb | 4.788 | 0.0199 | 0.0204 |
| Response | Expression | Equation Number |
|---|---|---|
| Y = | 64.71 + 19.96A − 6.55B + 16.31C + 4.45D + 6.01E − 10.55F + 0.04AB − 0.84AD + 3.64BD + 5.81ABD | (5) |
| Log(UED) = | −1.0872 + 0.0575A + 0.0519B + 3.67 × 10⁻³C − 0.119D − 7.53 × 10⁻³E − 2.16 × 10⁻³F − 0.093G + 1.76 × 10⁻⁴AB + 3.46 × 10⁻⁵AC + 0.0277AD − 4.11 × 10⁻⁴AE − 3.47 × 10⁻⁵AF + 4.82 × 10⁻³AG − 0.06BD − 0.002ABD | (6) |
| Log(UEMD) = | 0.597 + 0.341A + 0.058B + 0.0332C − 0.0524D − 0.03E − 0.251F − 0.009G − 0.0051AB + 0.05AC + 0.011AD − 0.021AE − 0.028AF + 0.041AG − 0.051BD − 0.018ABD | (7) |

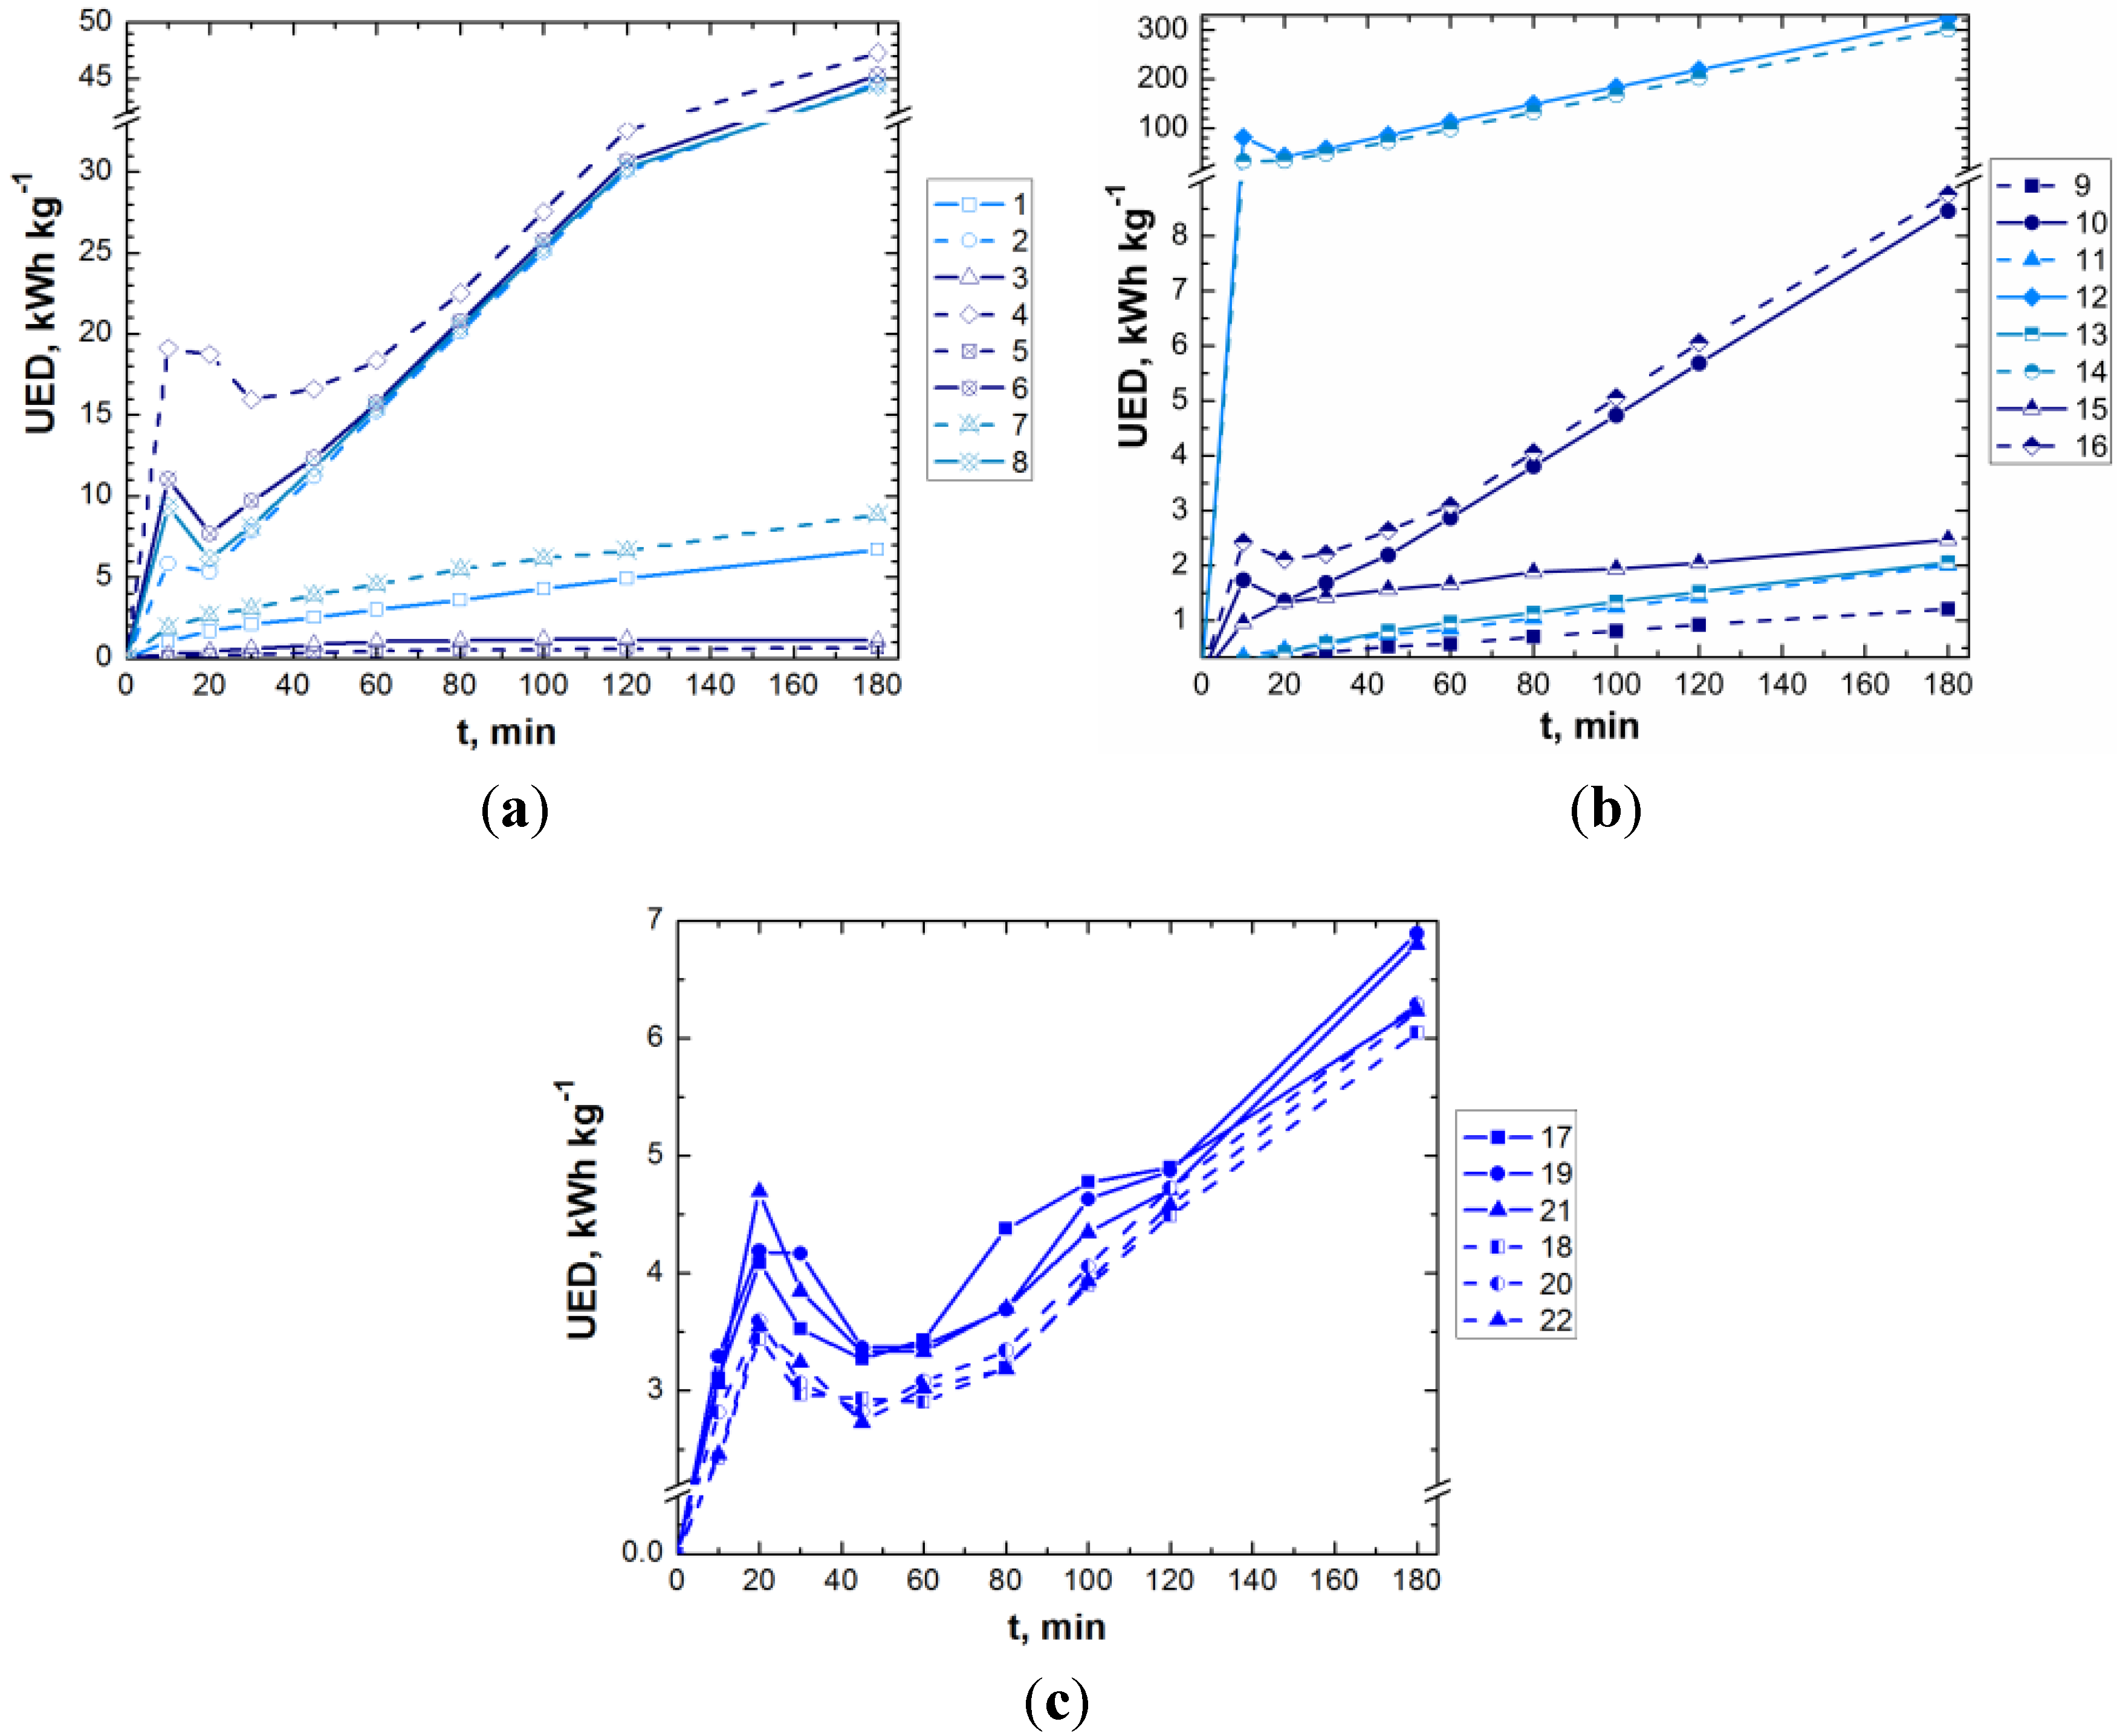
3.2. Effects on the UED Response


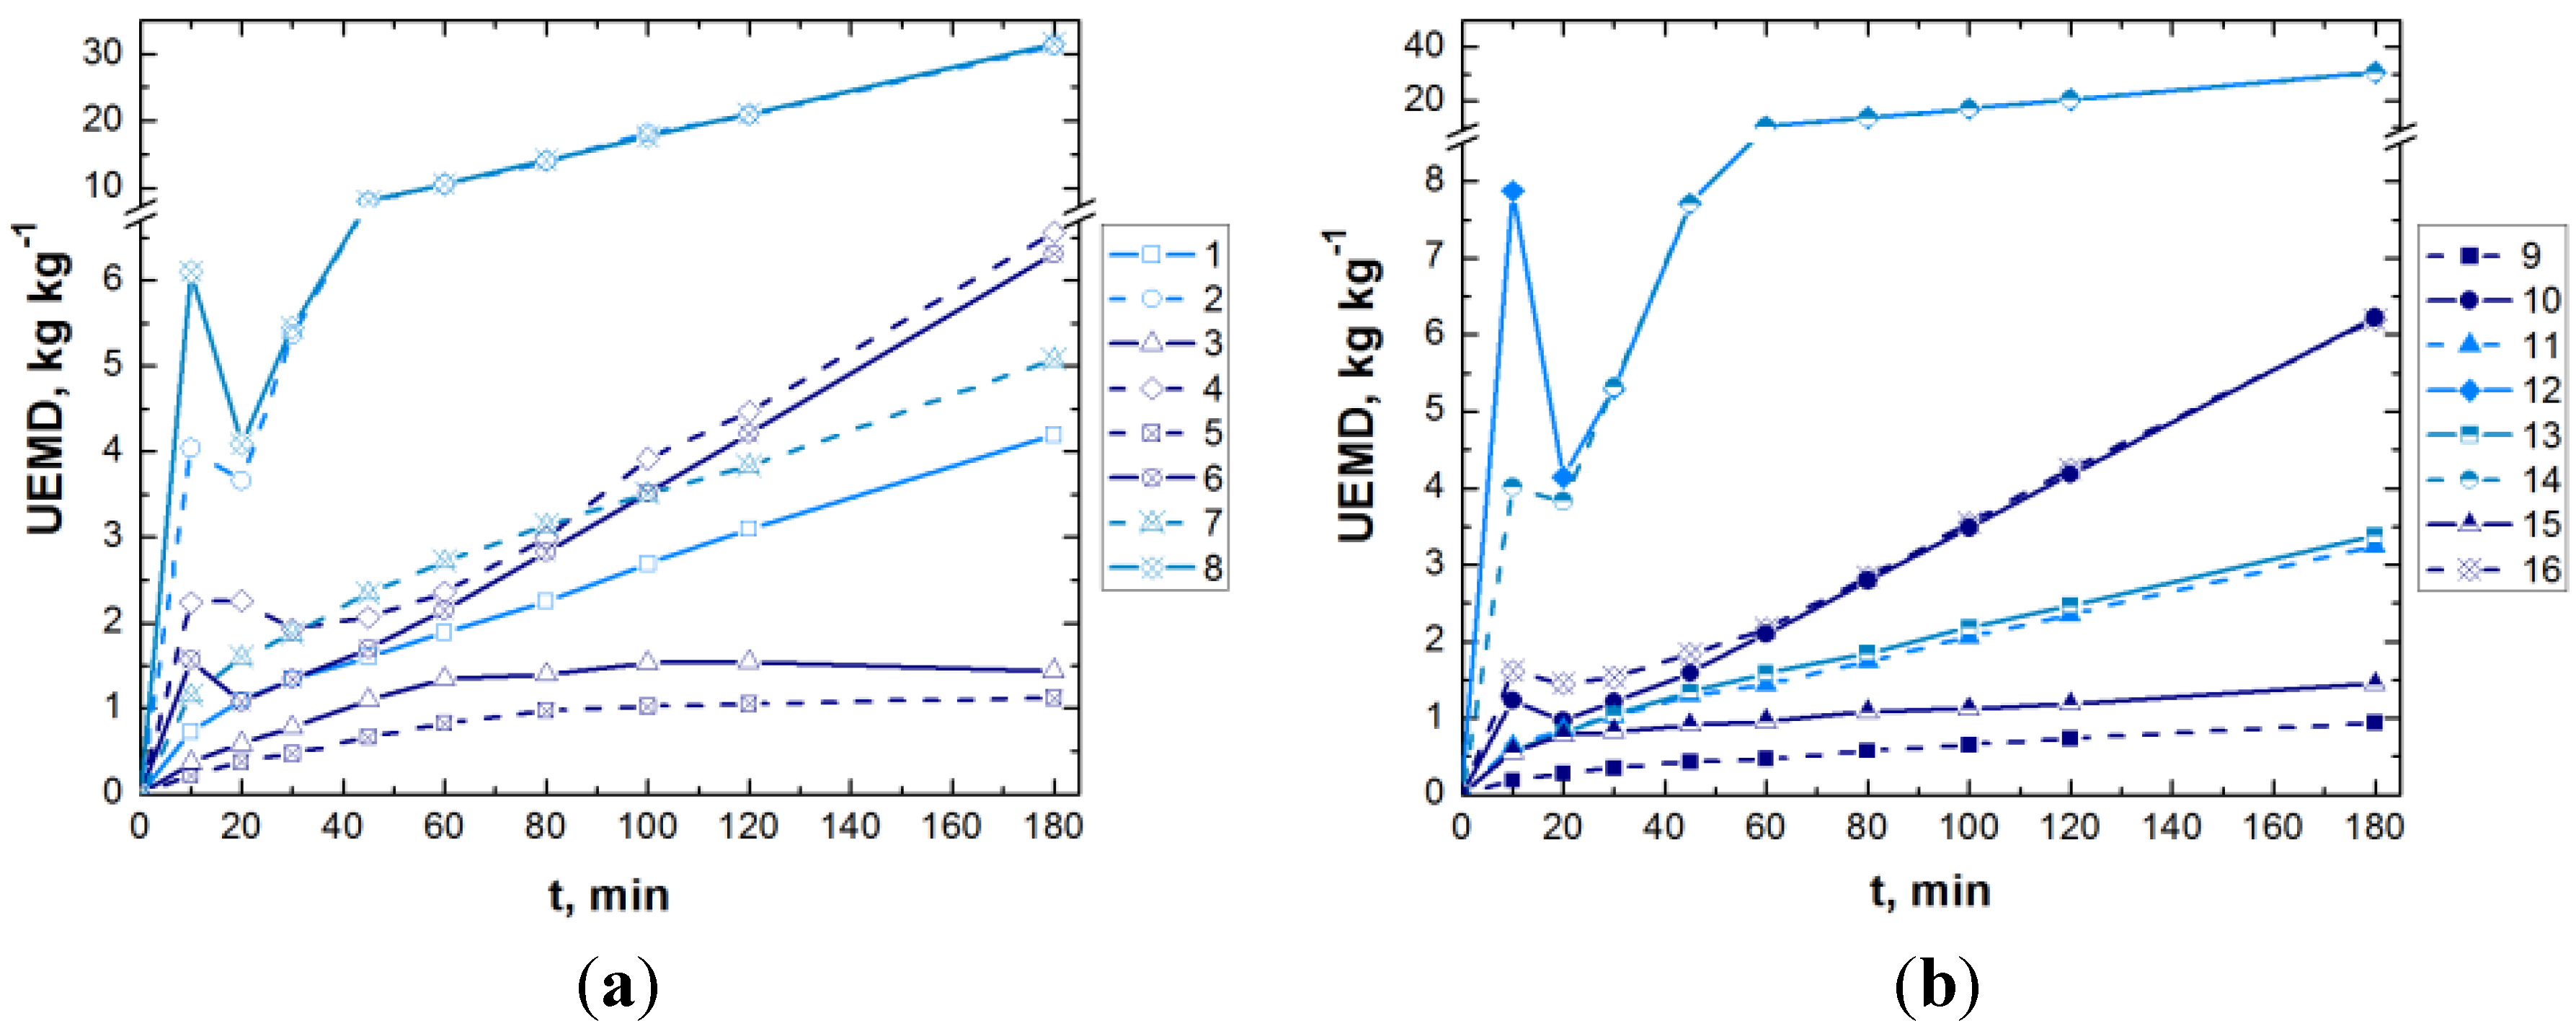
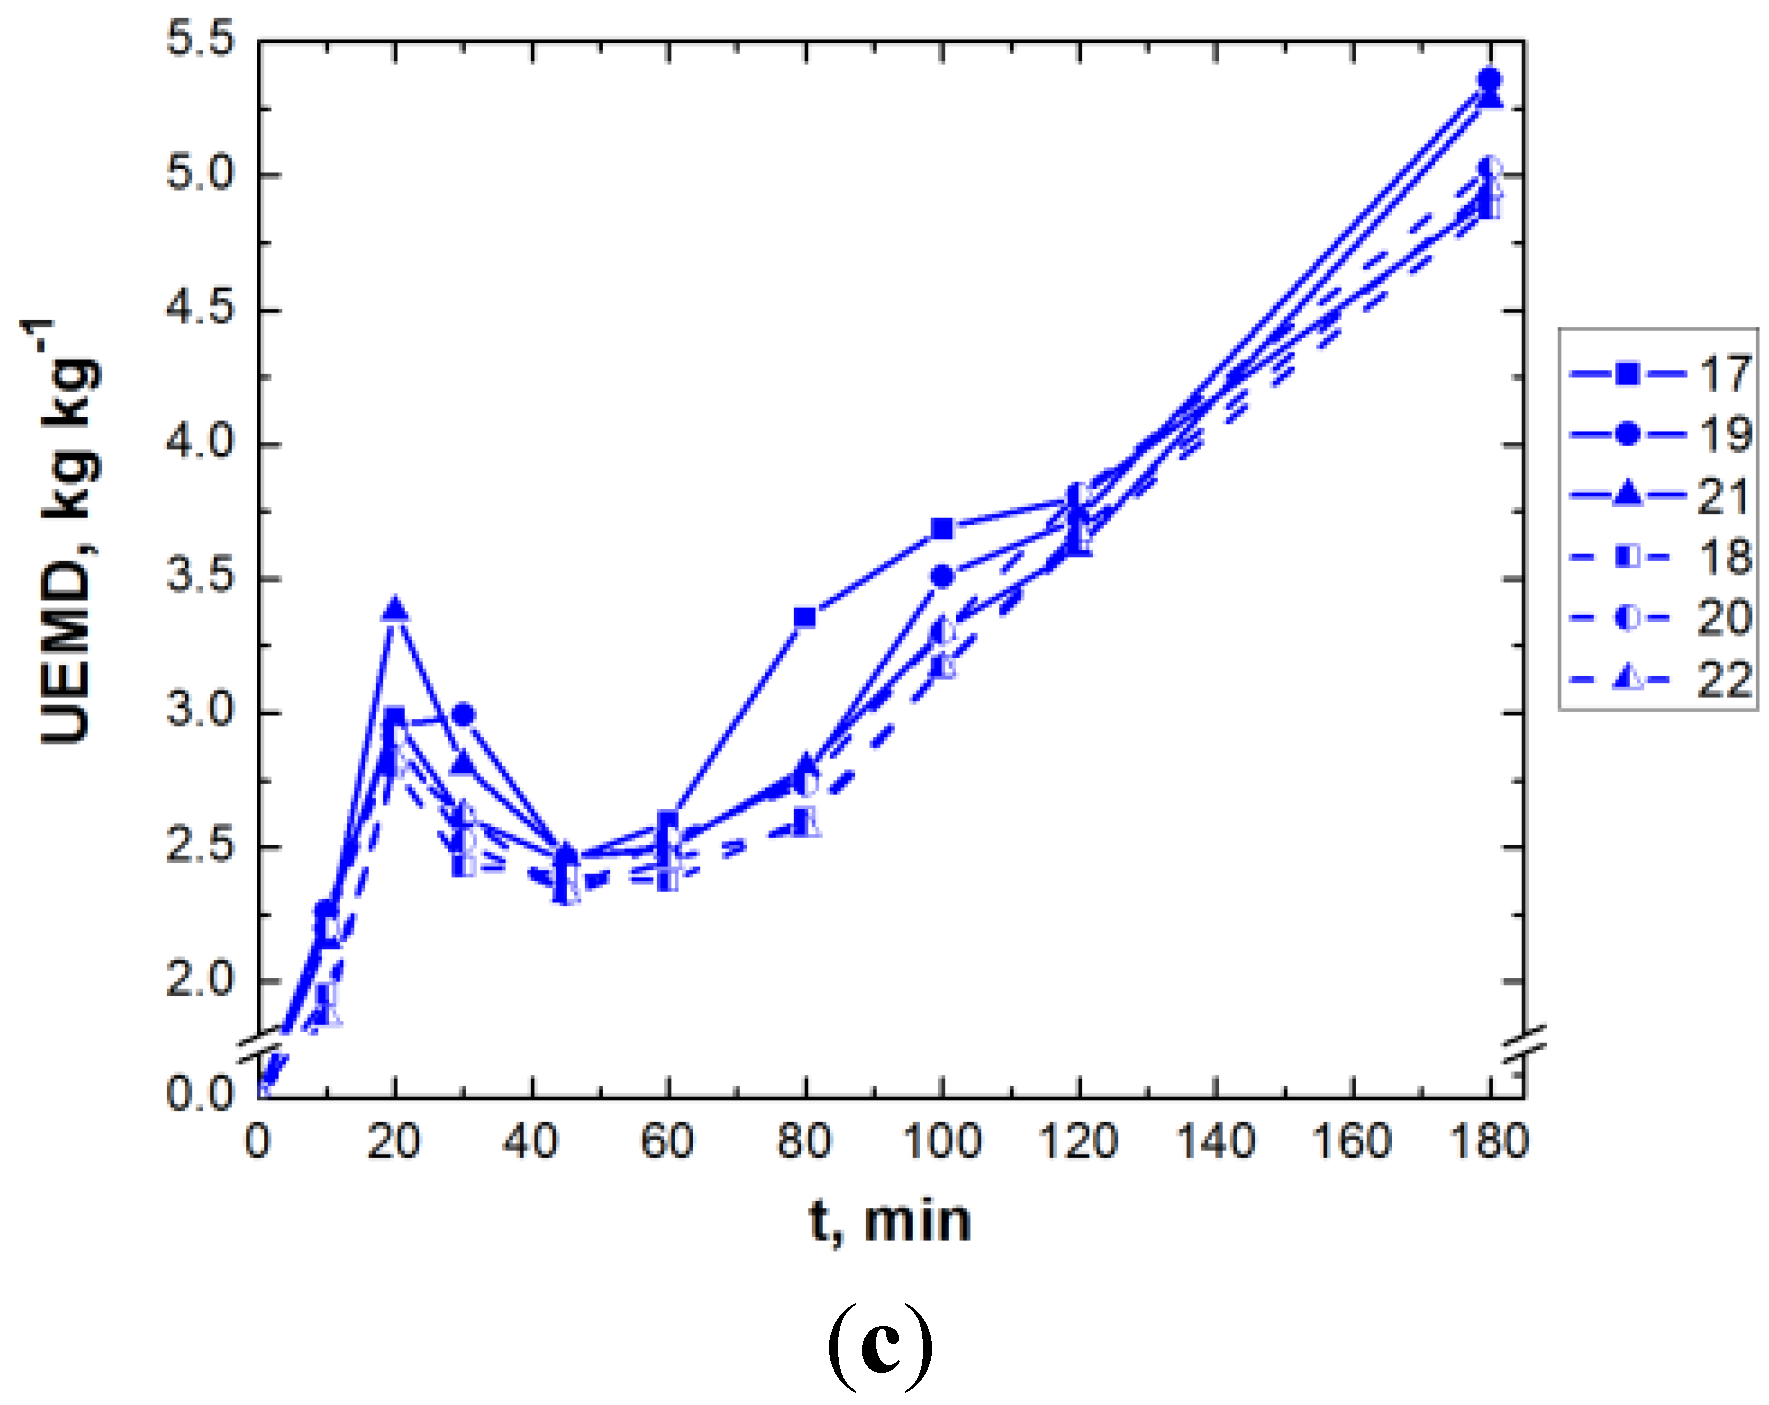
3.3. Effects on the UEMD Response


3.4. Multi-Objective Optimization
| Goals | Criteria | Desirability | Results | |
|---|---|---|---|---|
| Predicted | Experimental | |||
| – | A,B,C,D,E,F,G∈ Ω | Da = 0.215 | – | – |
| Max(Y) | dY = 0.432 | 94.32 | 92.24 (s.d.b 2.5) | |
| Min(UED) | dlog(UED) = 0.346 | 0.144 | 0.178 (s.d.b 0.01) | |
| Min(UEMD) | dlog(UEMD) = 0.242 | 4.209 | 4.683 (s.d.b 0.11) | |
3.5. Electrical Operating Costs
4. Conclusions
Acknowledgments
References
- UN Environment Programme (UNEP). 1st World Water Development Report: Water for People, Water for Life; UNEP: Paris, France, 2003. [Google Scholar]
- Boussu, K.; Kindts, C.; Vandecasteele, C.; van der Bruggen, B.V. Applicability of nanofiltration in the carwash industry. Sep. Purif. Technol. 2007, 54, 139–146. [Google Scholar] [CrossRef]
- Forgacs, E.; Cserhati, T.; Oros, G. Removal of synthetic dyes from wastewaters: A review. Environ. Int. 2004, 30, 953–971. [Google Scholar] [CrossRef]
- Rai, H.S.; Bhattacharyya, M. S.; Singh, J.; Bansal, T.K.; Vats, P.; Banerjee, U.C. Removal of dyes from the effluent of textile and dyestuff manufacturing industry: A review of emerging techniques with reference to biological treatment. Crit. Rev. Environ. Sci. Technol. 2005, 35, 219–238. [Google Scholar] [CrossRef]
- Babu, B.R.; Parande, A.K.; Raghu, S.; Kumar, T.P. Textile technology, cotton textile processing: Waste generation and effluent treatment. J. Cotton. Sci. 2007, 11, 141–153. [Google Scholar]
- Gupta Suhas, V.K. Application of low-cost adsorbents for dye removal—A review. J. Environ. Manag. 2009, 90, 2313–2342. [Google Scholar]
- De Oliveira, F.T.; Chedeville, O.; Fauduet, H.; Cagnon, B. Use of ozone/activated carbon coupling to remove diethyl phthalate from water: Influence of activated carbon textural and chemical properties. Desalination 2011, 276, 359–365. [Google Scholar]
- Bhaskar Raju, G.; Thalamadai, K.M.; Latha, S.S.; Parvathy, S.; Prabhakar, S. Treatment of wastewater from synthetic textile industry by electrocoagulation–electrooxidation. Chem. Eng. J. 2008, 144, 51–58. [Google Scholar]
- Bayramoglu, M.; Eyvaz, M.; Kobya, M. Treatment of the textile wastewater by electrocoagulation economical evaluation. Chem. Eng. J. 2007, 128, 155–161. [Google Scholar] [CrossRef]
- Avsar, Y.; Kurt, U.; Gonullu, T. Comparison of classical chemical and electrochemical processes for treating rose processing wastewater. J. Hazard. Mater. 2007, 148, 340–345. [Google Scholar] [CrossRef]
- Mollah, M.Y.A.; Schennach, R.; Parga, J.R.; Cocke, D.L. Electrocoagulation (EC)—Science and applications. J. Hazard. Mater. 2001, 84, 29–41. [Google Scholar] [CrossRef]
- Holt, P.K.; Barton, G.W.; Mitchell, C.A. The future for electrocoagulation as a localised water treatment technology. Chemosphere 2005, 59, 355–367. [Google Scholar] [CrossRef]
- Mollah, M.Y.A.; Morkovsky, P.; Gomes, J.A.G.; Kesmez, M.; Pargad, J.; Cocke, D.L. Fundamentals, present and future perspectives of electrocoagulation. J. Hazard. Mater. 2004, 114, 199–210. [Google Scholar] [CrossRef]
- Grøterud, O.; Smoczynski, L. Phosphorous removal from water by means of electrolysis. Water Res. 1986, 20, 667–669. [Google Scholar] [CrossRef]
- Eyvaz, M.; Kirlaroglu, M.; Aktas, T.S.; Yuksel, E. The effects of alternating current electrocoagulation on dye removal from aqueous solutions. Chem. Eng. J. 2009, 153, 16–22. [Google Scholar] [CrossRef]
- Mao, X.; Hong, S.; Zhu, H.; Lin, H.; Wei, L.; Gan, F. Alternating pulse current in electrocoagulation for wastewater treatment to prevent the passivation of aluminum electrode. J. Wuhan Univ. Tech. Mater. Sci.Ed. 2008, 23, 239–241. [Google Scholar] [CrossRef]
- Keshmirizadeh, E.; Yousefi, S.; Rofouei, M.K. An investigation on the new operational parameter effective in Cr(VI) removal efficiency: A study on electrocoagulation by alternating pulse current. J. Hazard. Mater. 2011, 190, 119–124. [Google Scholar] [CrossRef]
- Narayanan, N.V.; Ganesan, M. Use of adsorption using granular activated carbon (GAC) for the enhancement of removal of chromium from synthetic wastewater by electrocoagulation. J. Hazard. Mater. 2009, 161, 575–580. [Google Scholar]
- Fischer, V.M. In Situ Electrochemical Regeneration of Activated Carbon. Ph.D. Dissertation, University of Groningen, Groningen, The Netherlands, 2001. [Google Scholar]
- Zhou, M.; Lei, L. The role of activated carbon on the removal of p-nitrophenol in an integrated three-phase electrochemical reactor. Chemosphere 2006, 65, 1197–1203. [Google Scholar]
- Fischer-Colbrie, G.; Maier, J.; Robra, K.H.; Guebitz, G.M. Degradation of the indigo carmine dye. In Environmental Chemistry: Green Chemistry and Pollutants in Ecosystems; Lichtfouse, E., Schwarzbauer, J., Robert, D., Eds.; Springer-Verlag: Berlin, Germany, 2005; Chapter 27; p. 289. [Google Scholar]
- Science Lab, Inc. Material Safety Data Sheet SLR1375; Science Lab, Inc.: Houston, TX, USA, 2005. [Google Scholar]
- Santa Cruz Biotechnology, Inc. Material Safety Data Sheet SC-215793; Santa Cruz Biotechnology, Inc.: Santa Cruz, CA, USA, 2010. [Google Scholar]
- Secula, M.S.; Cretescu, I.; Petrescu, S. An experimental study of indigo carmine dye removal from aqueous solutions by electrocoagulation. Desalination 2011, 277, 227–235. [Google Scholar] [CrossRef]
- Secula, M.S.; Cagnon, B.; Ferreira de Oliveira, T.; Chedeville, O.; Fauduet, H. Removal of acid dye from aqueous solutions by Electrocoagulation/GAC adsorption coupling: Kinetics and electrical operating costs. J. Taiwan Inst. Chem. Eng. 2012, 43, 767–775. [Google Scholar] [CrossRef]
- Apaydin, Ö.; Kurt, U.; Gönüllü, M.T. An investigation on the treatment of tannery wastewater by electrocoagulation. Glob. NEST J. 2009, 11, 546–555. [Google Scholar]
- Secula, M.S.; Cretescu, I.; Petrescu, S. Electrocoagulation treatment of sulfide wastewater in a batch reactor: Effect of electrode material on electrical operating costs. Environ. Eng. Manag. J. 2012, 11, 1485–1491. [Google Scholar]
- Espinoza-Quinones, F.R.; Fornari, M.M.T.; Módenes, A.N.; Palácio, S.M.; da Silva, F.G., Jr.; Szymanski, N.A.D.; Kroumov, N.; Trigueros, D.E.G. Pollutant removal from tannery effluent by electrocoagulation. Chem. Eng. J. 2009, 151, 59–65. [Google Scholar]
- Liu, Y.; Ritter, J.A. Fractional factorial design study of a pressure swing adsorption-solvent vapor recovery process. Adsorption 1997, 3, 151–163. [Google Scholar]
- Berthouex, P.M.; Brown, L.C. Statistics for Environmental Engineers, 2nd Ed. ed; Lewis Publishers: Boca Raton, FL, USA, 2002. [Google Scholar]
- Hines, W.W.; Montgomery, D.C. Probability and Statistics in Engineering and Management Science, 3rd ed.; John Wiley & Sons: New York, NY, USA, 1990. [Google Scholar]
- Mittal, A.; Mittal, J.; Kurup, L. Batch and bulk removal of hazardous dye, indigo carmine from wastewater through adsorption. J. Hazard. Mater. 2006, 137, 591–602. [Google Scholar] [CrossRef]
- Gutiérrez-Segura, E.; Solache-Ríos, M.; Colín-Cruz, A. Sorption of indigo carmine by a Fe-zeolitic tuff and carbonaceous material from pyrolyzed sewage sludge. J. Hazard. Mater. 2009, 170, 1227–1235. [Google Scholar] [CrossRef]
- Lazic, Z.R. Design of Experiments in Chemical Engineering; Wiley-VCH Verlag GmbH & Co.: Weiheim, Germany, 2004. [Google Scholar]
- Mason, R.L.; Gunst, R.F.; Hess, J.L. Statistical Design and Analysis of Experiments with Applications to Engineering and Science, 2nd ed.; John Wiley & Sons, Inc.: New York, NY, USA, 1989. [Google Scholar]
- Montgomery, D.C. Design and Analysis of Experiments; John Wiley & Sons, Inc.: New York, NY, USA, 2001. [Google Scholar]
- Derringer, G.; Suich, R. Simultaneous optimization of several response variables. J. Qual. Technol. 1980, 12, 214–219. [Google Scholar]
- Bezerra, M.A.; Santelli, R.A.; Oliveira, E.P.; Villar, L.S.; Escaleira, L.A. Response surface methodology (RSM) as a tool for optimization in analytical chemistry. Talanta 2008, 76, 965–977. [Google Scholar] [CrossRef]
© 2013 by the authors; licensee MDPI, Basel, Switzerland. This article is an open access article distributed under the terms and conditions of the Creative Commons Attribution license (http://creativecommons.org/licenses/by/3.0/).
Share and Cite
Secula, M.S.; Cretescu, I.; Cagnon, B.; Manea, L.R.; Stan, C.S.; Breaban, I.G. Fractional Factorial Design Study on the Performance of GAC-Enhanced Electrocoagulation Process Involved in Color Removal from Dye Solutions. Materials 2013, 6, 2723-2746. https://doi.org/10.3390/ma6072723
Secula MS, Cretescu I, Cagnon B, Manea LR, Stan CS, Breaban IG. Fractional Factorial Design Study on the Performance of GAC-Enhanced Electrocoagulation Process Involved in Color Removal from Dye Solutions. Materials. 2013; 6(7):2723-2746. https://doi.org/10.3390/ma6072723
Chicago/Turabian StyleSecula, Marius Sebastian, Igor Cretescu, Benoit Cagnon, Liliana Rozemarie Manea, Corneliu Sergiu Stan, and Iuliana Gabriela Breaban. 2013. "Fractional Factorial Design Study on the Performance of GAC-Enhanced Electrocoagulation Process Involved in Color Removal from Dye Solutions" Materials 6, no. 7: 2723-2746. https://doi.org/10.3390/ma6072723
APA StyleSecula, M. S., Cretescu, I., Cagnon, B., Manea, L. R., Stan, C. S., & Breaban, I. G. (2013). Fractional Factorial Design Study on the Performance of GAC-Enhanced Electrocoagulation Process Involved in Color Removal from Dye Solutions. Materials, 6(7), 2723-2746. https://doi.org/10.3390/ma6072723