3.1. Chemical and Mineralogical Characterization of BFS and SCBA
The chemical compositions of blast furnace slag (BFS) and sugar cane bagasse ash (SCBA) are shown in
Table 1.
Table 1.
Chemical composition of Blast Furnace slag (BFS) and Sugar Cane Bagasse Ash (SCBA).
Table 1.
Chemical composition of Blast Furnace slag (BFS) and Sugar Cane Bagasse Ash (SCBA).
| Oxide | BFS | SCBA |
|---|
| SiO2 | 30.19 | 31.41 |
| Al2O3 | 10.66 | 7.57 |
| Fe2O3 | 1.31 | 6.02 |
| CaO | 39.53 | 16.06 |
| MgO | 7.50 | 1.07 |
| Na2O | 0.87 | 0.14 |
| K2O | 0.58 | 1.58 |
| SO3 | 1.95 | 0.78 |
| TiO2 | 0.51 | 2.09 |
| MnO | 0.40 | 0.10 |
| Chloride | 0.44 | 0.14 |
| LOI | 5.62 | 32.20 |
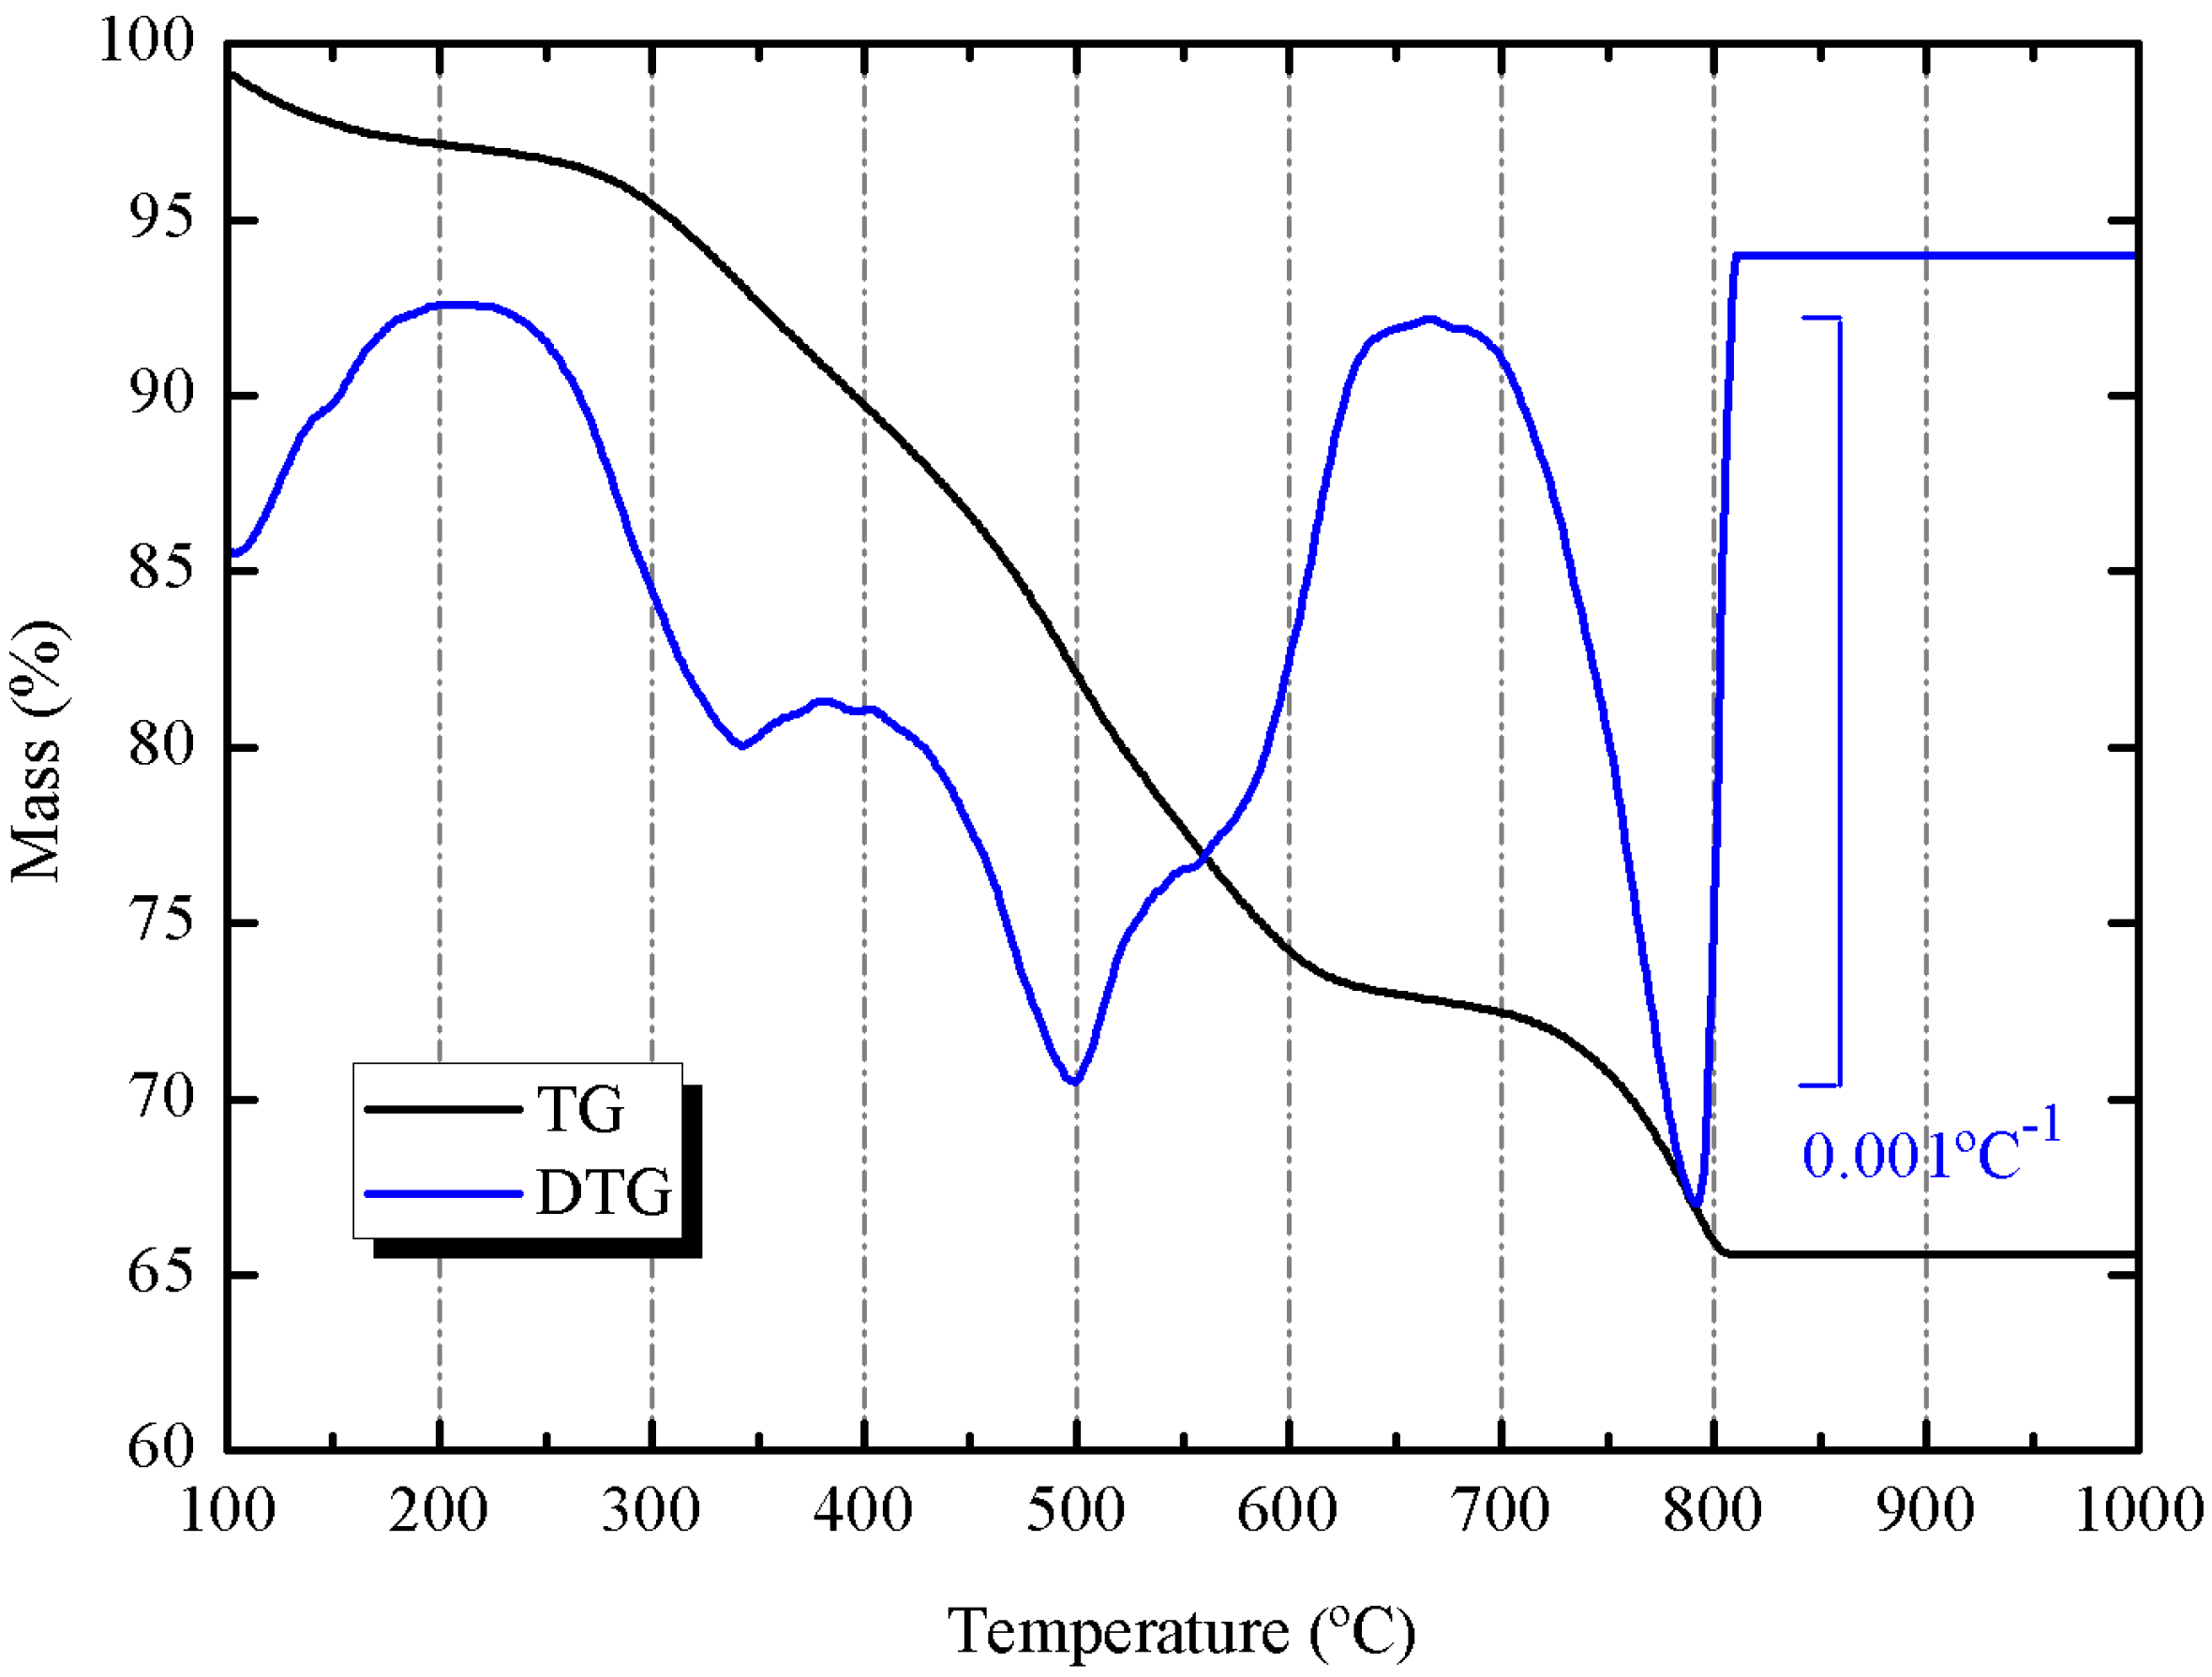
SCBA presented a high percentage loss on ignition (32.2%). This fact is attributed to mixing the liquid from gas scrubber and the wastewater from washing sugarcane, which contains a high amount of organic matter. The
Figure 1 shows the thermogravimetric curve for the ash (heated in air at 20 °C/min heating rate, using alumina crucible). It is important to notice that part of the mass loss (24.68%) was produced in the 250–650 °C range, which belongs to organic matter volatilization and oxidation. However, a part of the mass loss (6.86%) was observed at 700–800 °C range, which corresponds to the decomposition of calcium carbonate. The percentage of CaCO
3 calculated from this mass loss was 15.59%.
Figure 1.
Thermogravimetric (TG) and derivative thermogravimetric (DTG) curves for SCBA: heating rate 20 °C/min, 70 μL alumina crucible, dried air atmosphere.
Figure 1.
Thermogravimetric (TG) and derivative thermogravimetric (DTG) curves for SCBA: heating rate 20 °C/min, 70 μL alumina crucible, dried air atmosphere.
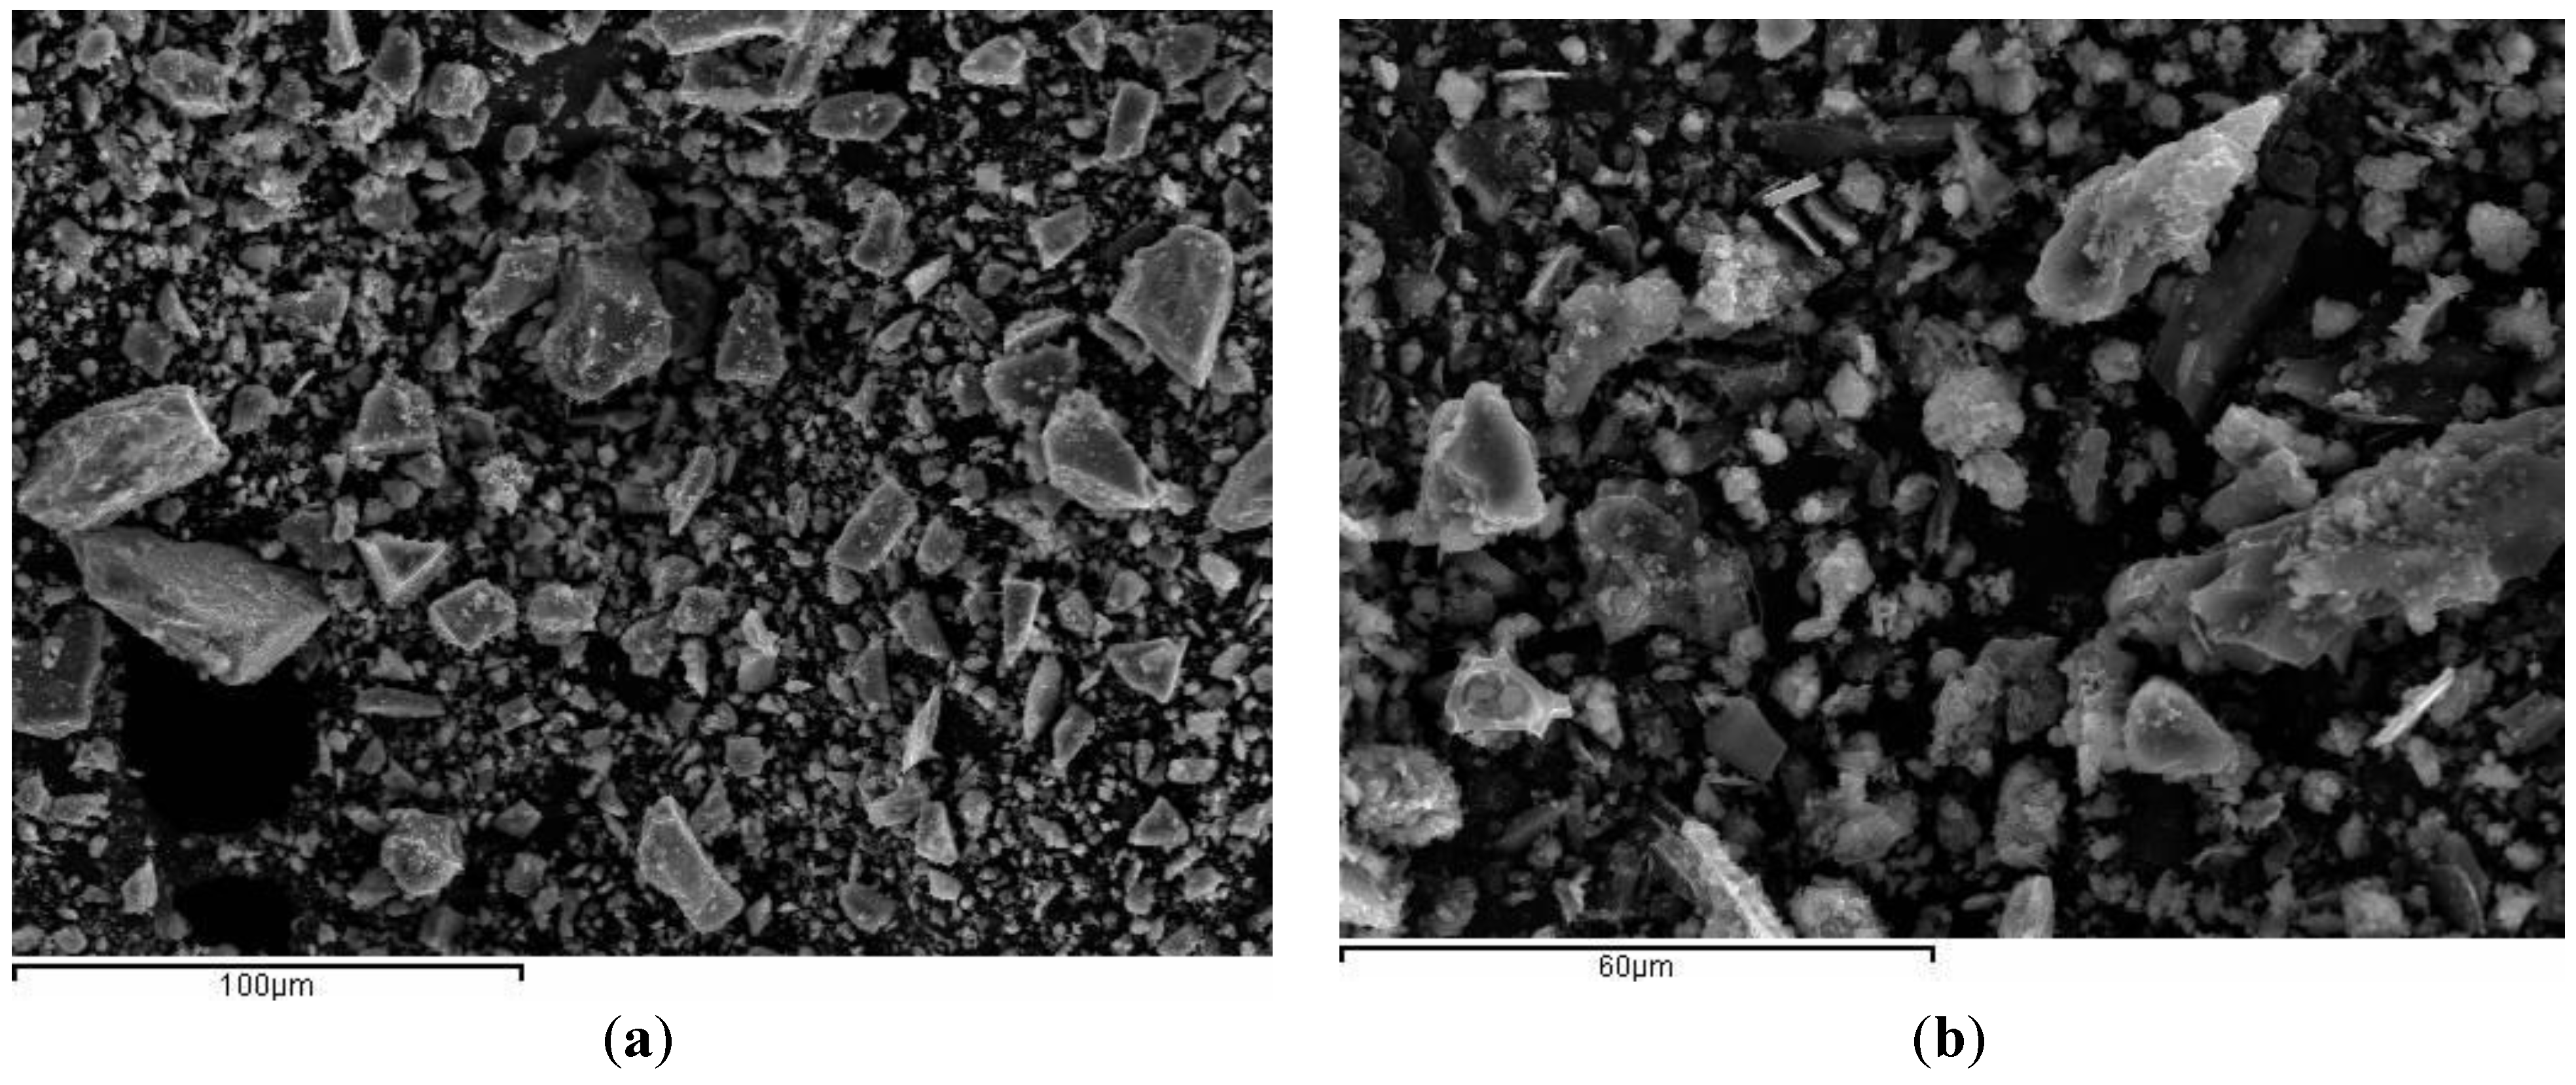
The particle morphology for BFS is depicted in
Figure 2a. Particles present fairly dense, smooth texture, sharp particles and different sizes. Particle morphology of ground SCBA is shown in
Figure 2b. It can be seen that particles are irregular in shape. Spherical shaped particles were not found, suggesting that the combustion temperature reached in the burning process did not produce the melting of inorganic matter. SCBA particles presented rough surfaces.
Figure 2.
SEM micrographs: (a) BFS and (b) SCBA.
Figure 2.
SEM micrographs: (a) BFS and (b) SCBA.
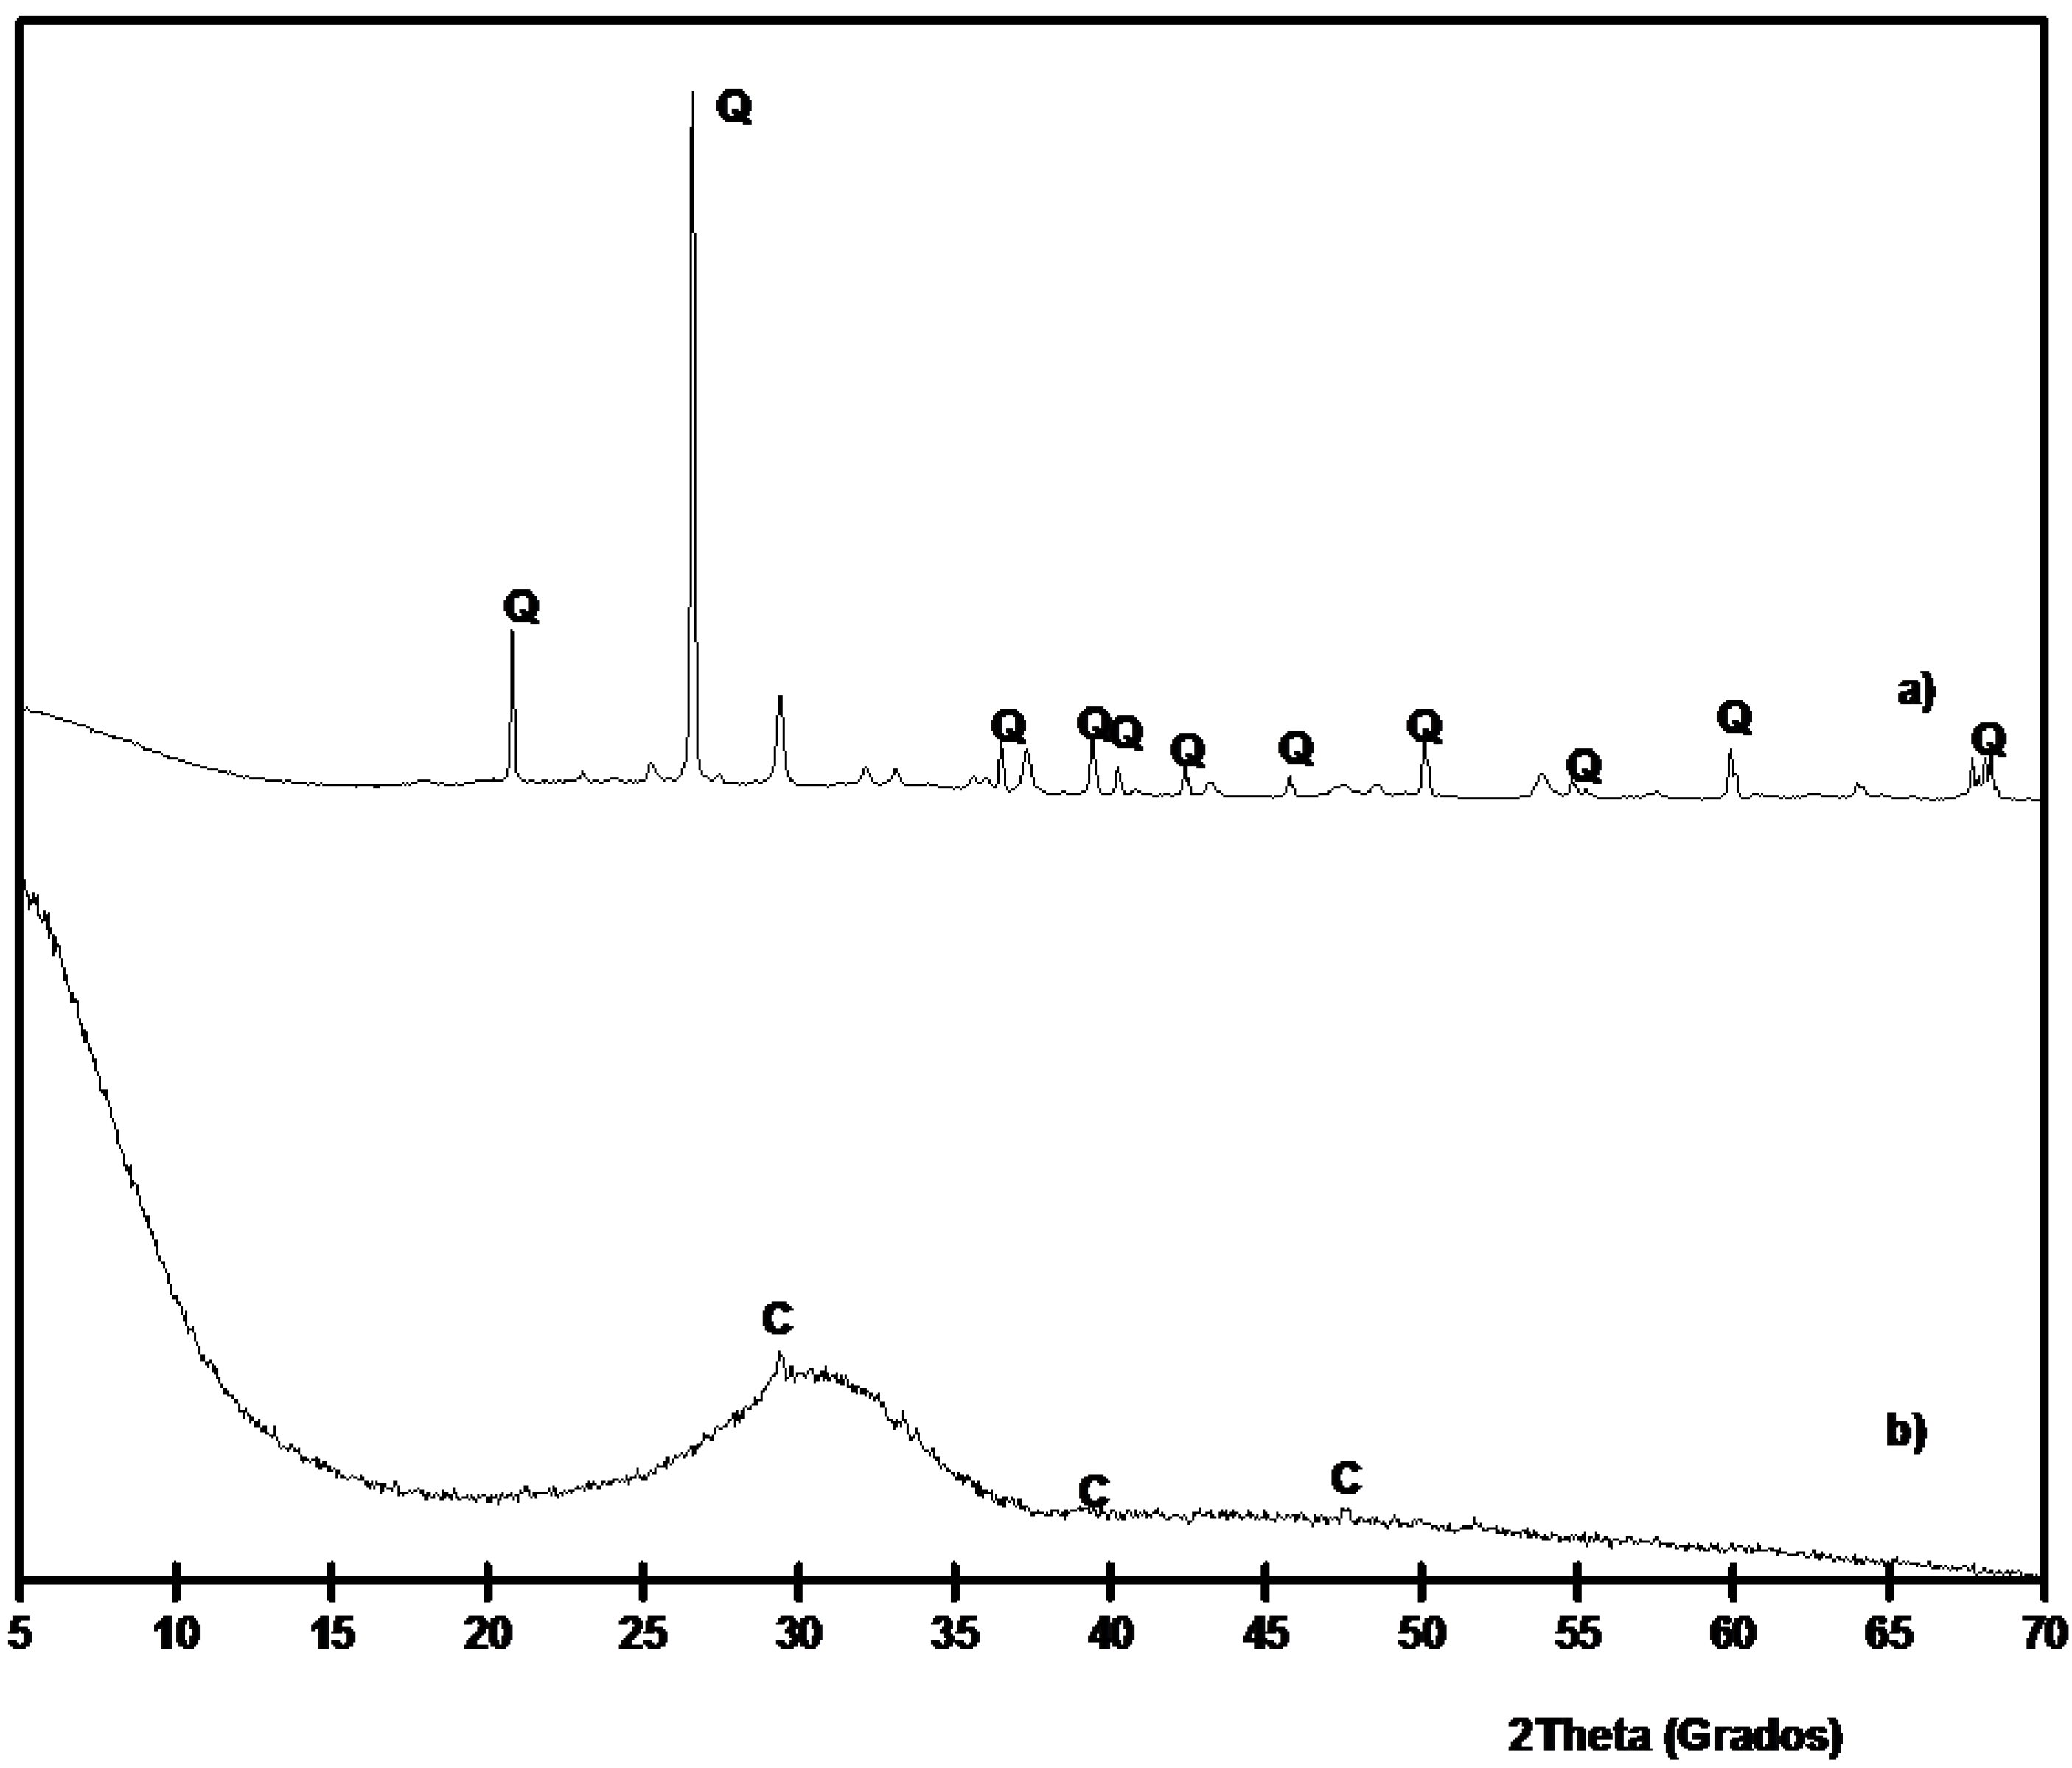
SCBA and BFS were characterized by means of XRD analysis. The corresponding diffractograms are shown in
Figure 3. It is noticeable the high crystallinity degree of SCBA: the baseline of the diffractogram had not deviated in the 2θ range 20°–40°, suggesting that the proportion of crystallized fractions is important. The insoluble residue was determined for SCBA by means of dissolution in refluxing 4 M potassium hydroxide [
35]. The obtained value was 24.1% ± 0.6%: the residue was due to the presence (see
Figure 3) of quartz (PDF card 331161) as the main crystallized compound; also calcite was identified (PDF card 050586). The background level for BFS is higher than those found for SCBA. Additionally, BFS had a very important vitreous fraction, accordingly to the baseline deviation in the 20°–35° 2θ range. A trace of calcite was identified in its XRD spectrum.
Figure 3.
XRD diffractograms for: (a) SCBA; (b) BFS. (Key: Q: Quartz; C: Calcite).
Figure 3.
XRD diffractograms for: (a) SCBA; (b) BFS. (Key: Q: Quartz; C: Calcite).
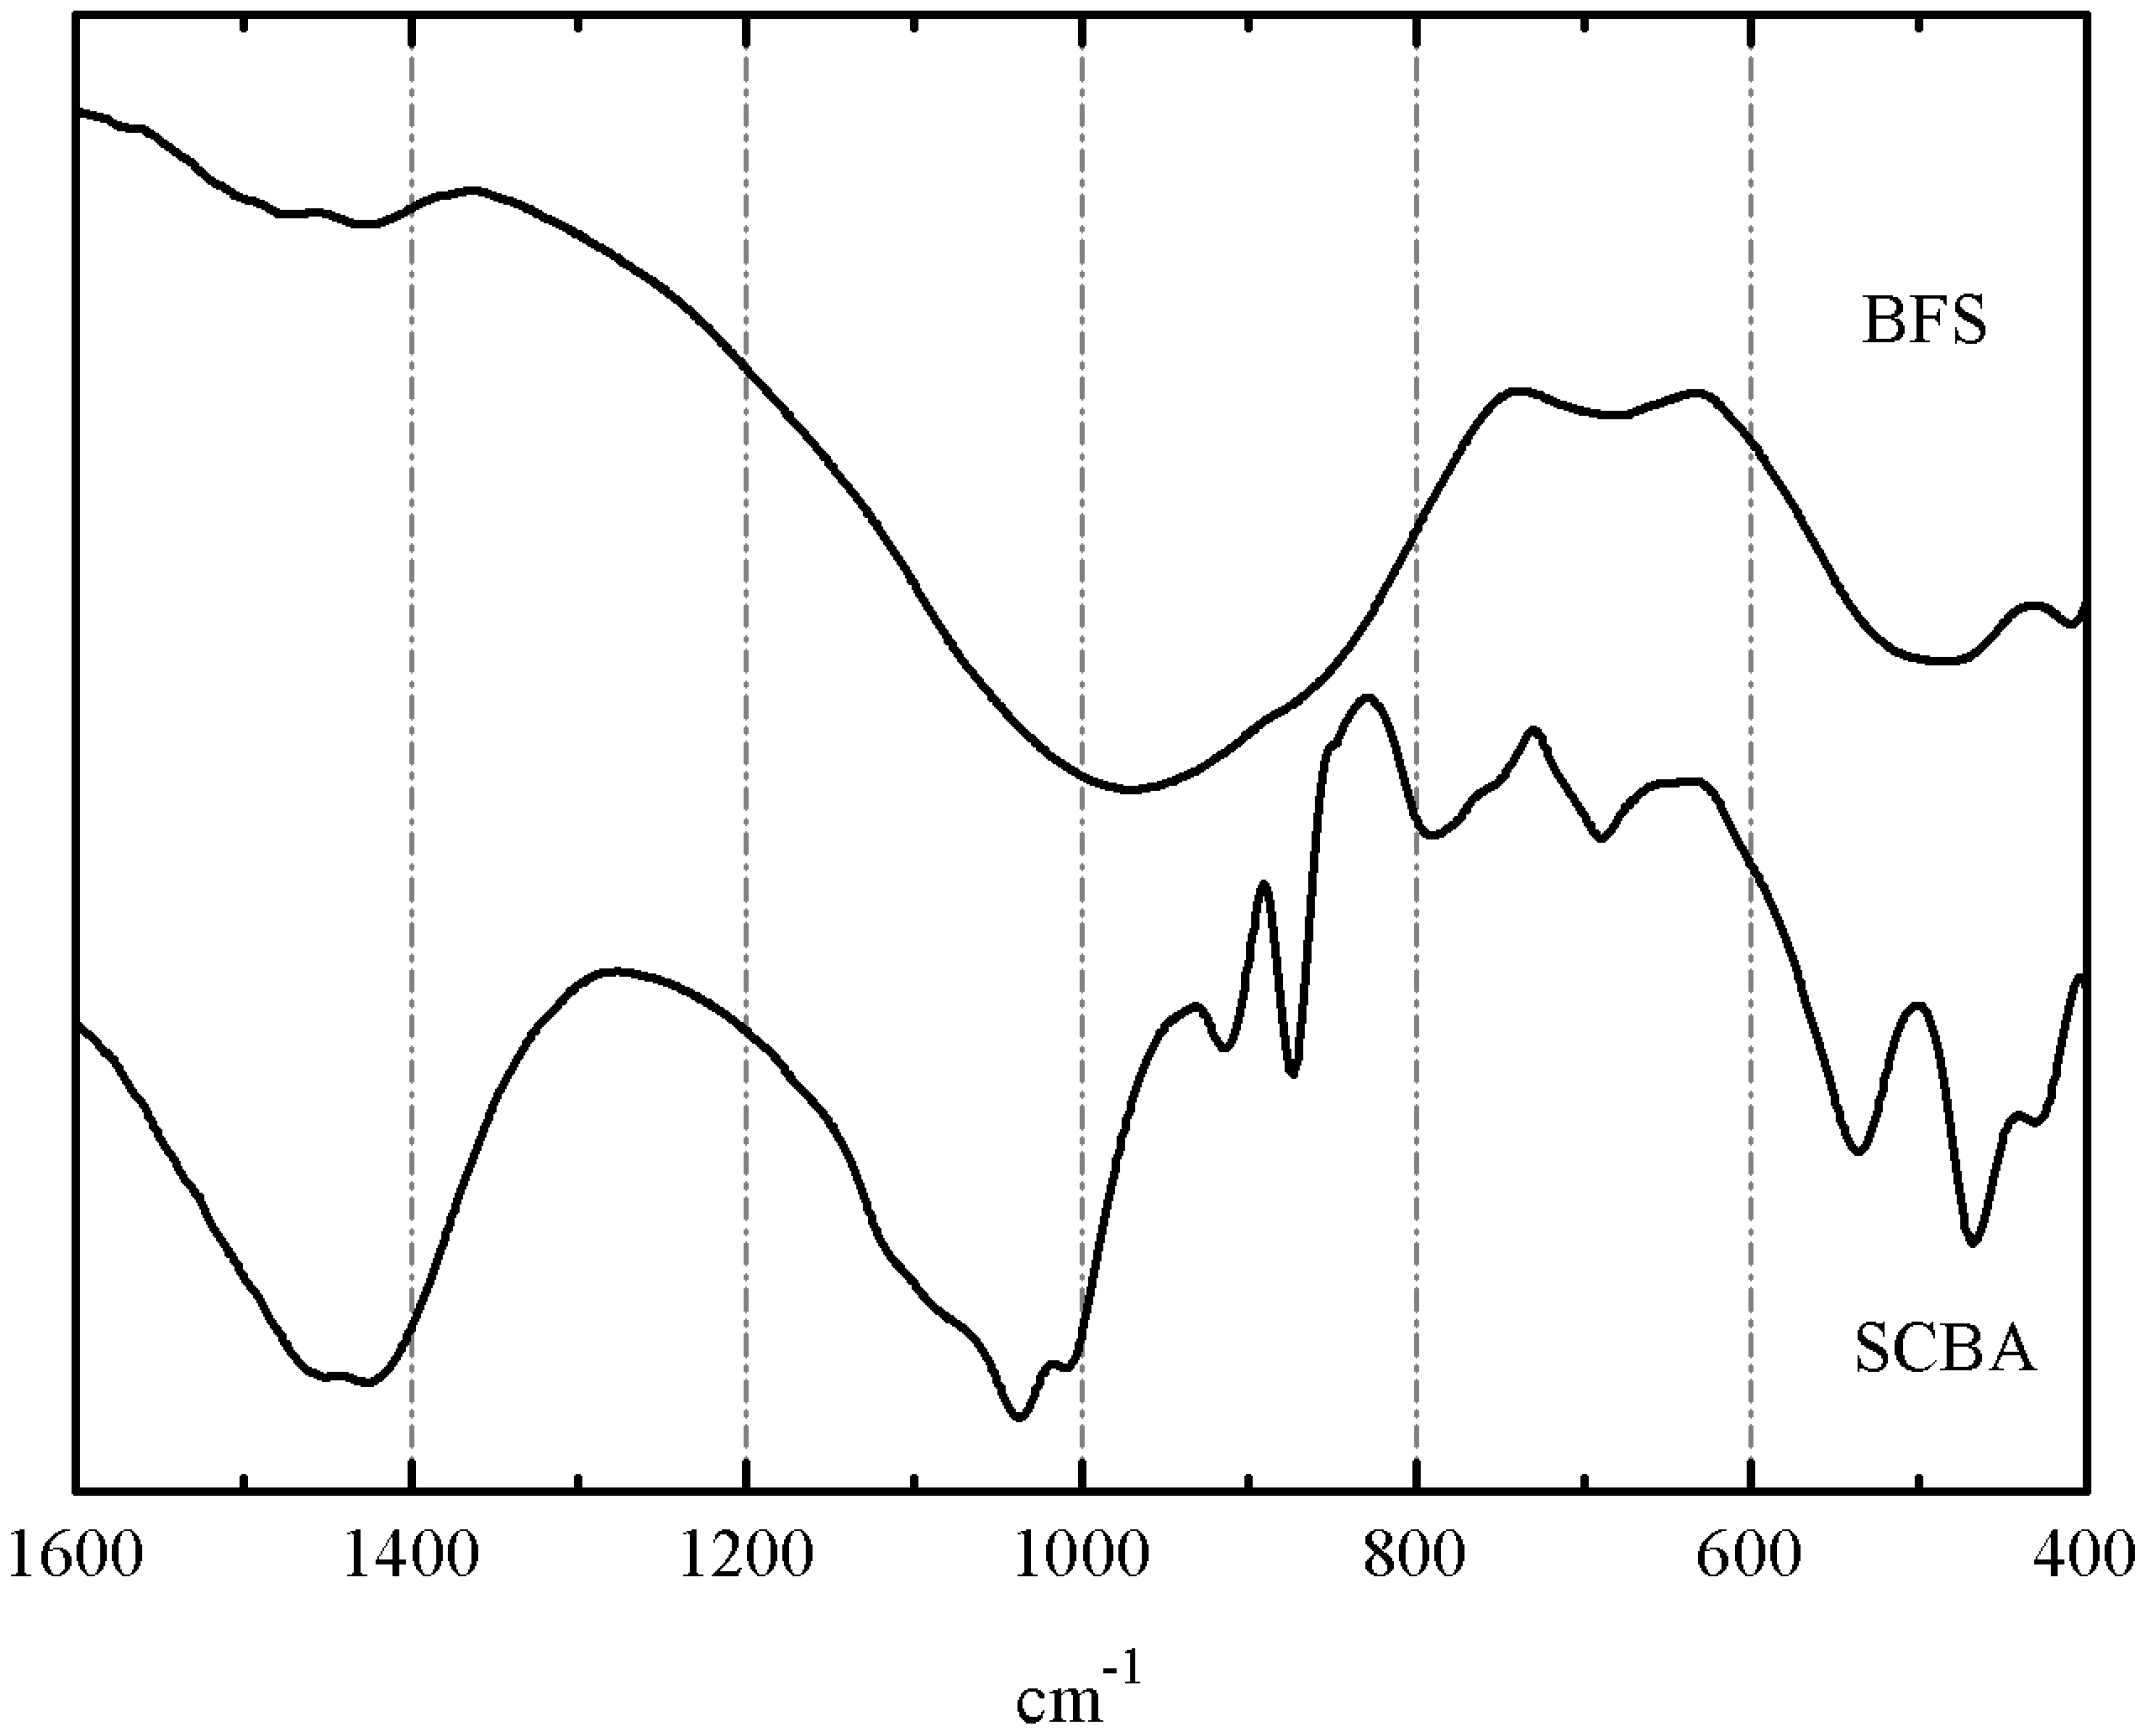
FTIR spectra for BFS and SCBA are depicted in
Figure 4. The spectrum for BFS showed a broadband characteristic of gehlenite. Two strong peaks are noticed: one of them centered at 981 cm
−1, attributed to symmetric stretching vibration of Si(Al)–O–Si bonds, and another one at 527 cm
−1, belonging to in-plane bending Si(Al)–O–Si vibrations of aluminosilicate network [
36]. Small peaks attributed to carbonate anion vibrations (
ca. 1430 and 710 cm
−1) were also identified. The spectrum of SCBA showed more peaks: the highest intensity absorption peak was related to the Si(Al)–O–Si network: a intense a broad band centered at 1030–1050 cm
−1 (asymmetric stretching vibration of Si(Al)–O–Si bonds). Also, peaks corresponding to quartz were noticed at 792 and 468 cm
−1. Additionally, peaks belonging to carbonate anion (from calcite) were also identified: 1437 cm
−1 (asymmetric stretching vibration of CO
32− anion) and 873 cm
−1 (out-of-plane bending mode of CO
32−) [
36]. Sharp peaks at 1035, 914, 663, and 538 cm
−1 were attributed to organic matter presence in the ash, probably due to C–O stretching in alcohol groups or other oxygen-containing functional groups, out of plane C=C–H bending, out of plane C≡C–H bending, and out of plane aromatic ring bending vibrations [
37]. These peaks are attributed to organic compounds disappearing in FTIR after calcination of SCBA at 650 °C.
Figure 4.
FTIR spectra for SCBA and BFS (KBr pellets).
Figure 4.
FTIR spectra for SCBA and BFS (KBr pellets).
3.2. Preliminary Results
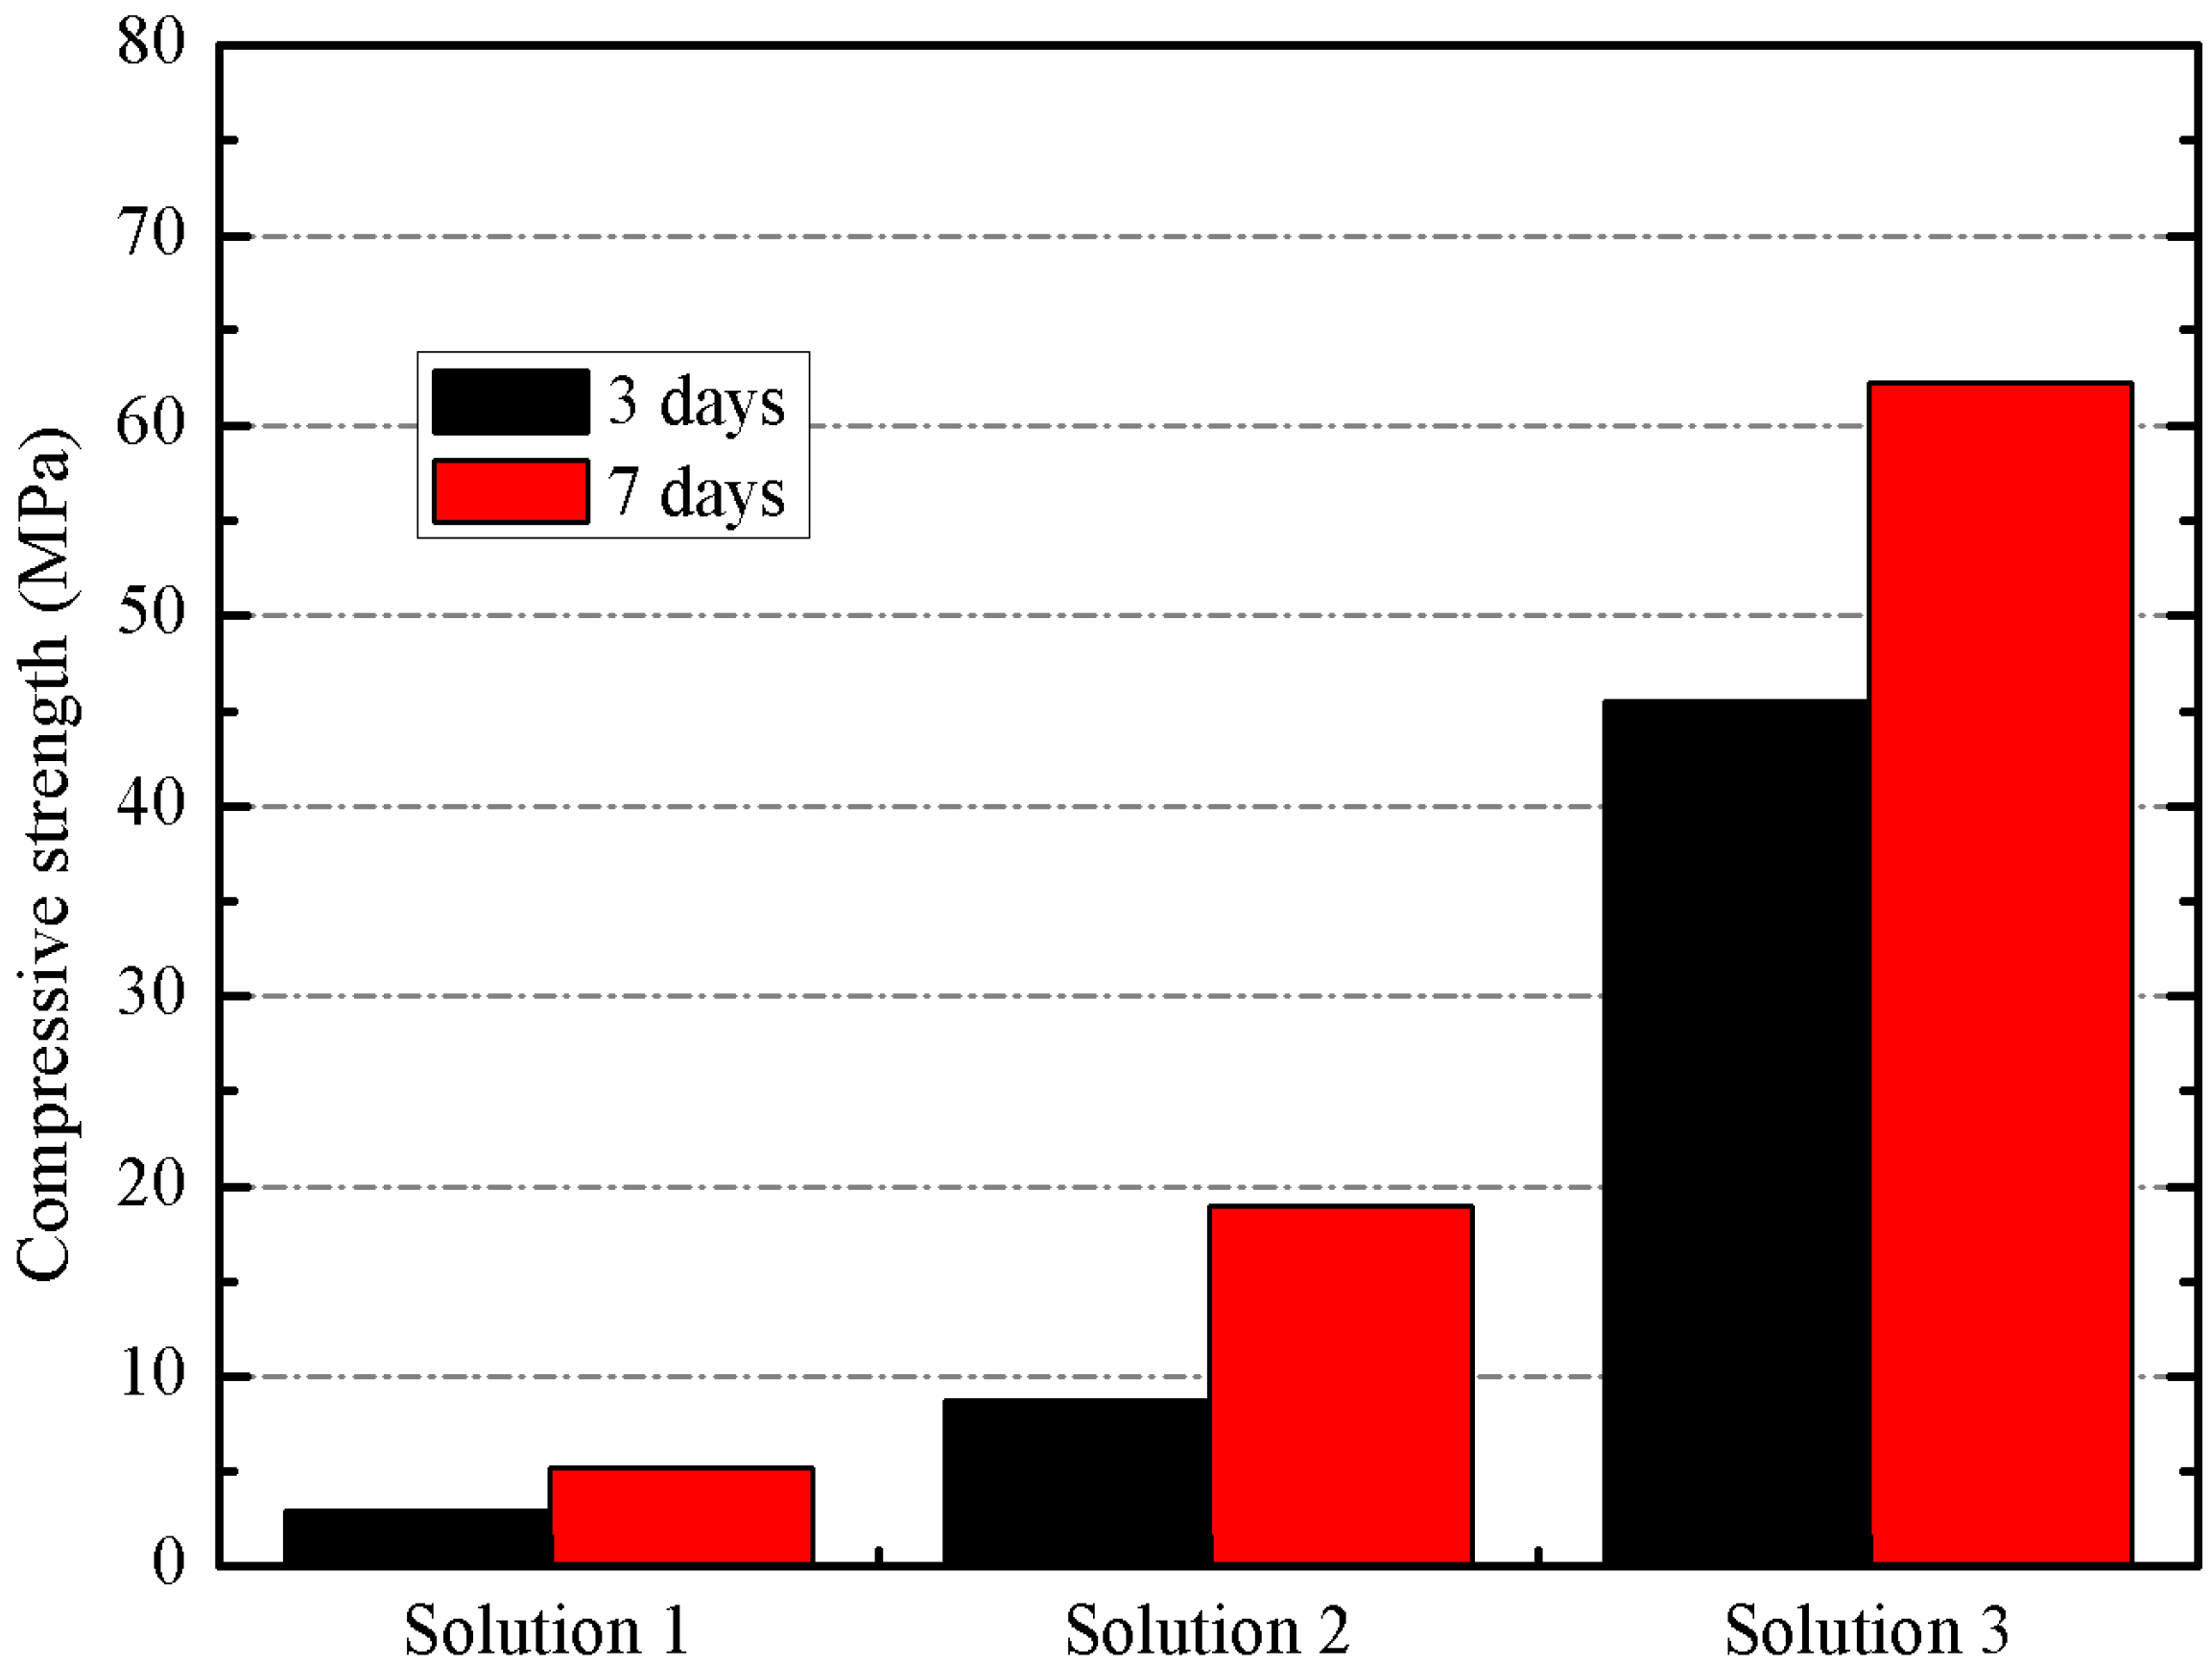
Three mortars (100% BFS as mineral admixture) were prepared by using different solutions: pure water (solution 1); 5 mol kg
−1 of sodium cation (solution 2); and 5 mol kg
−1 of sodium cation and a SiO
2/Na
2O molar ratio of 1.46 (solution 3). They were cured at 65 °C and tested in compression after 3 and 7 days. In
Figure 5, the compressive strength values of mortars activated with different activating solutions is shown.
Figure 5.
Compressive strength of mortars activated with different activating solutions.
Figure 5.
Compressive strength of mortars activated with different activating solutions.
On one hand, the significant increase in compressive strength values at both ages justifies the alkaline activation of BFS by using a mixture of solid NaOH and sodium silicate solution.
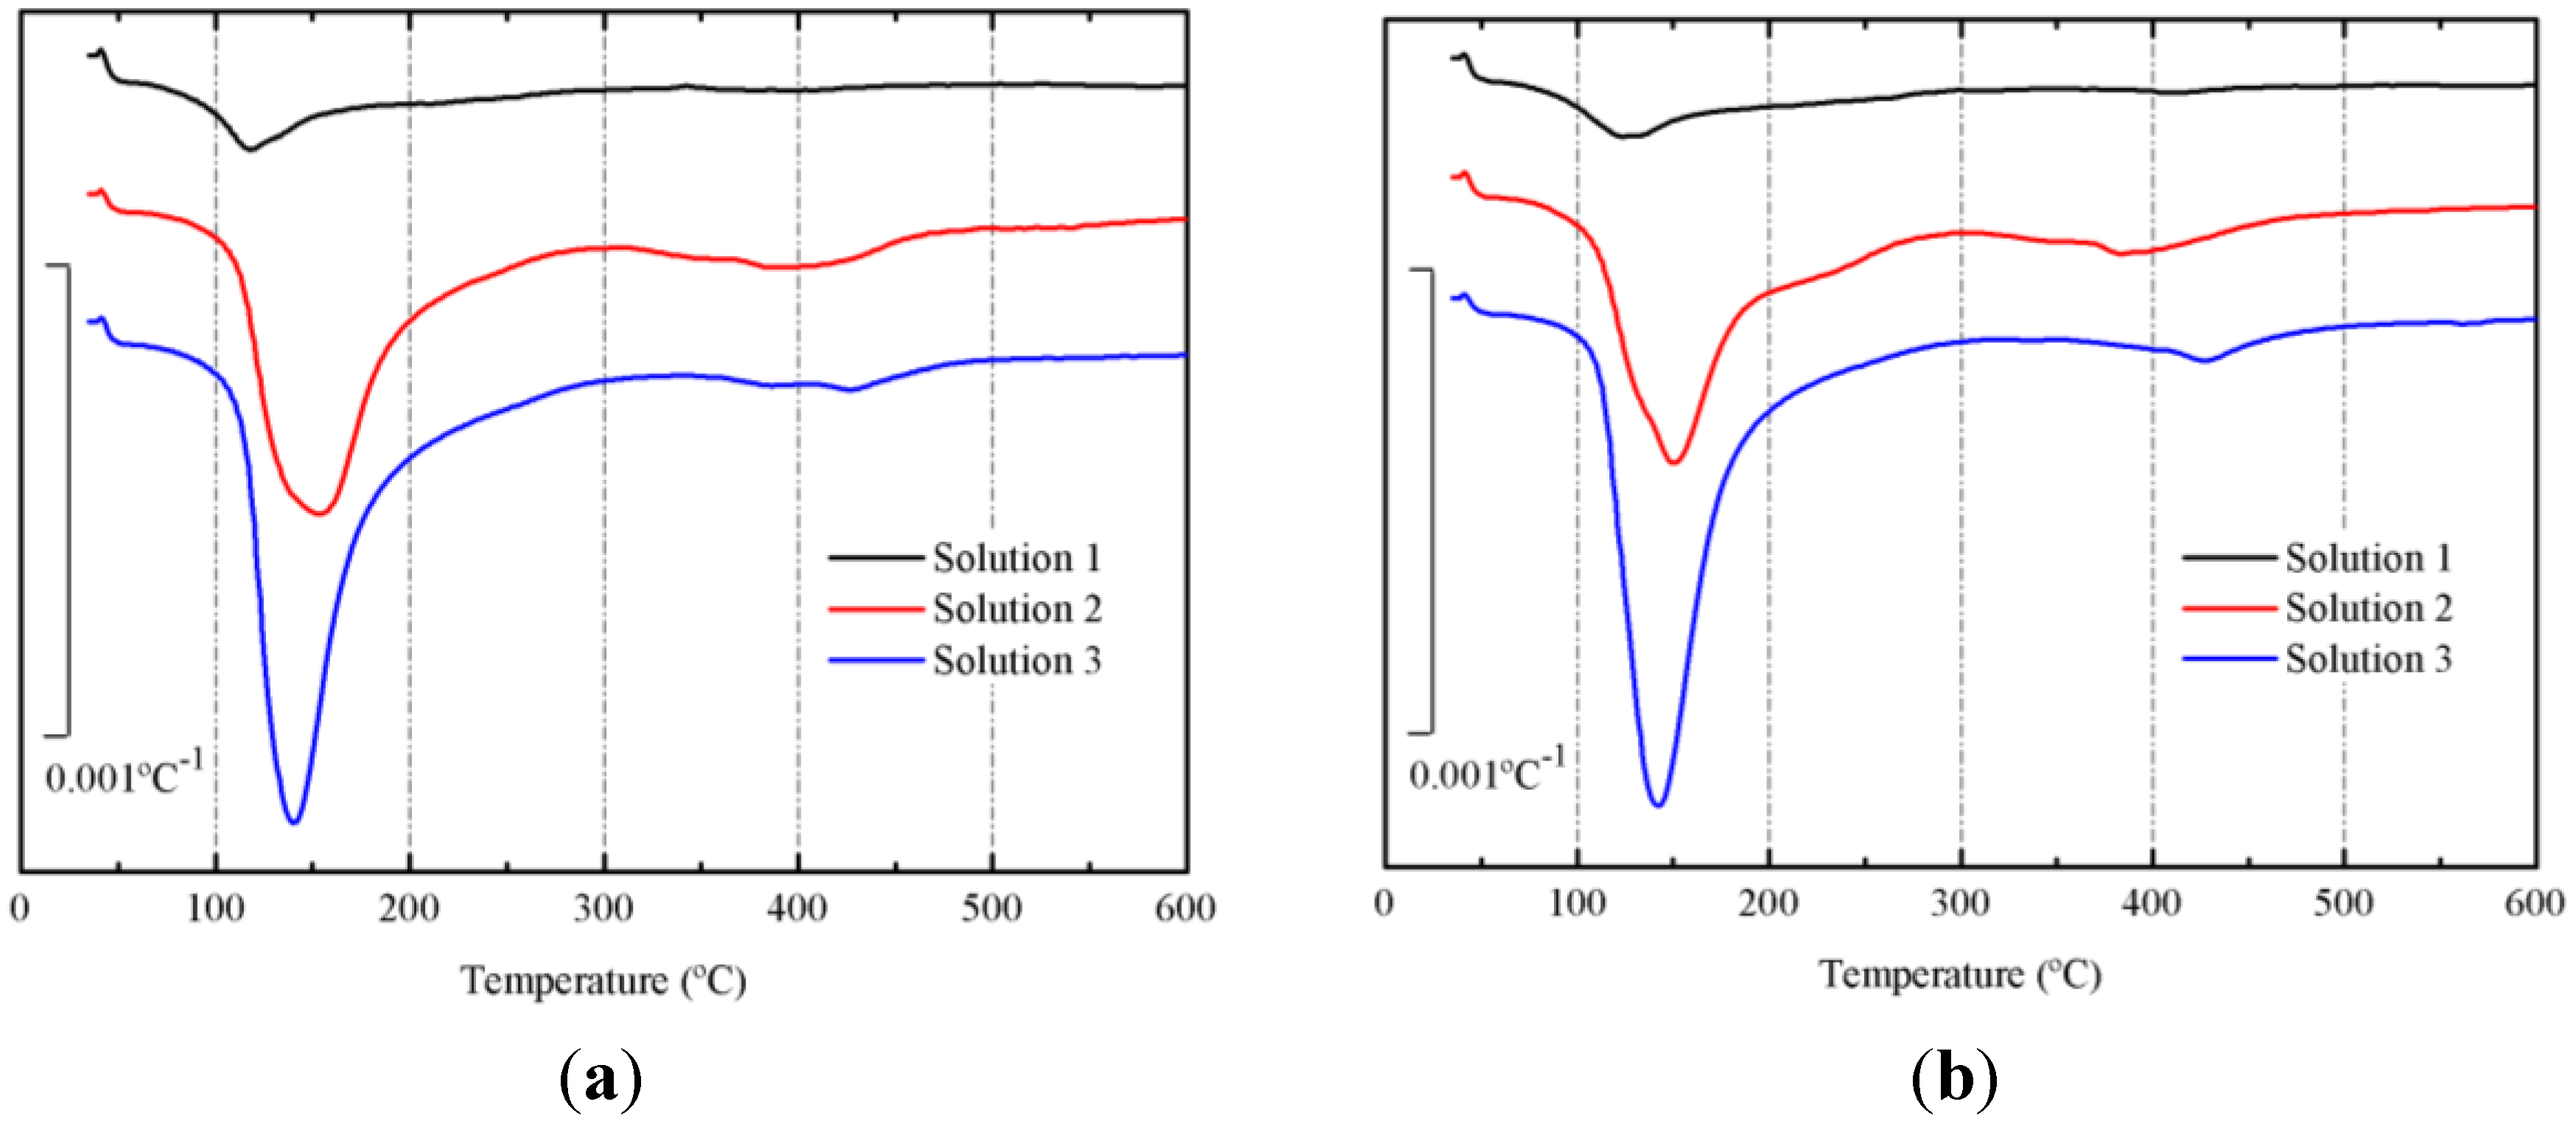
Derivative thermogravimetric curves (DTG) of pastes cured at 65 °C for 3 and 7 days are depicted in
Figure 6a,b, respectively. In both figures (for all curves), a main peak centered at the 135–145 °C range is noticed. This peak belongs to the dehydration/dehydroxylation process [
21] for the gels formed in the alkali activation of BFS. The following mass losses after 3 days were calculated: 4.51% for paste with solution 1, 16.24% for paste with solution 2 and 18.15% for paste with solution 3. And after 7 days, the mass losses were respectively: 5.13%, 16.62% and 19.28%. Pastes prepared with solution 3 had the highest mass loss, suggesting that using this solution, a more important progression in the alkali activation of BFS is shown. Additionally, the increase in the mass loss with curing time, indicated that the reaction took place also in the 3–7 day period.
Figure 6.
Derivative thermogravimetric curves (DTG) for preliminary study on BFS pastes, after curing at 65 °C: (a) 3 days; (b) 7 days.
Figure 6.
Derivative thermogravimetric curves (DTG) for preliminary study on BFS pastes, after curing at 65 °C: (a) 3 days; (b) 7 days.
Paste produced with solution 1 presented the lowest alkalinity, pH = 11.91 after 3 days of curing and pH = 11.92 after 7 days of curing. Paste prepared with solution 2 presented pH = 12.96 after 3 days of curing and pH = 12.90 after 7 days of curing, and the paste with solution 3 had pH = 12.85 and pH = 12.80 respectively. The pH of the paste with solution 1 is lower than others, because it was activated by plain water: the alkalinity was due to hydraulicity of BFS. The pH values for BFS pastes activated with solutions 2 and 3 were significantly lower than initial pH of the corresponding solutions, suggesting that an important amount of hydroxyl anions was chemically combined with mineral compounds in BFS, and this means dissolution and precipitation of the gel [
21].
For the following section, solution 3 was selected for activating mineral admixtures containing BFS and SCBA. The main reasons for this selection were the higher amount of chemically combined H2O/OH− groups in the formed gel and the development in the compressive strength of mortars.
3.3. Results on Binders Containing SCBA
All mixtures were prepared and activated with a solution of 5 mol kg−1 of sodium cation, a SiO2/Na2O molar ratio of 1.46 and a water/binder ratio of 0.45. Pastes cured for 3 days at 65 °C were characterized by means of SEM, TGA, XRD, pH and FTIR. TGA curves were also analyzed on the pastes cured for 7 days at 65 °C. Pastes for 28–270 days of curing at 20 °C were characterized by TGA, XRD, pH and FTIR. Mortars were mechanically characterized (compressive and flexural strengths) at 3 and 7 days of curing at 65 °C and at 7, 28, 90 and 270 days of curing at 20 °C. MIP tests were carried out on mortars at 3 days of curing at 65 °C and 270 days of curing at 20 °C, and also on pastes cured for 270 days at 20 °C.
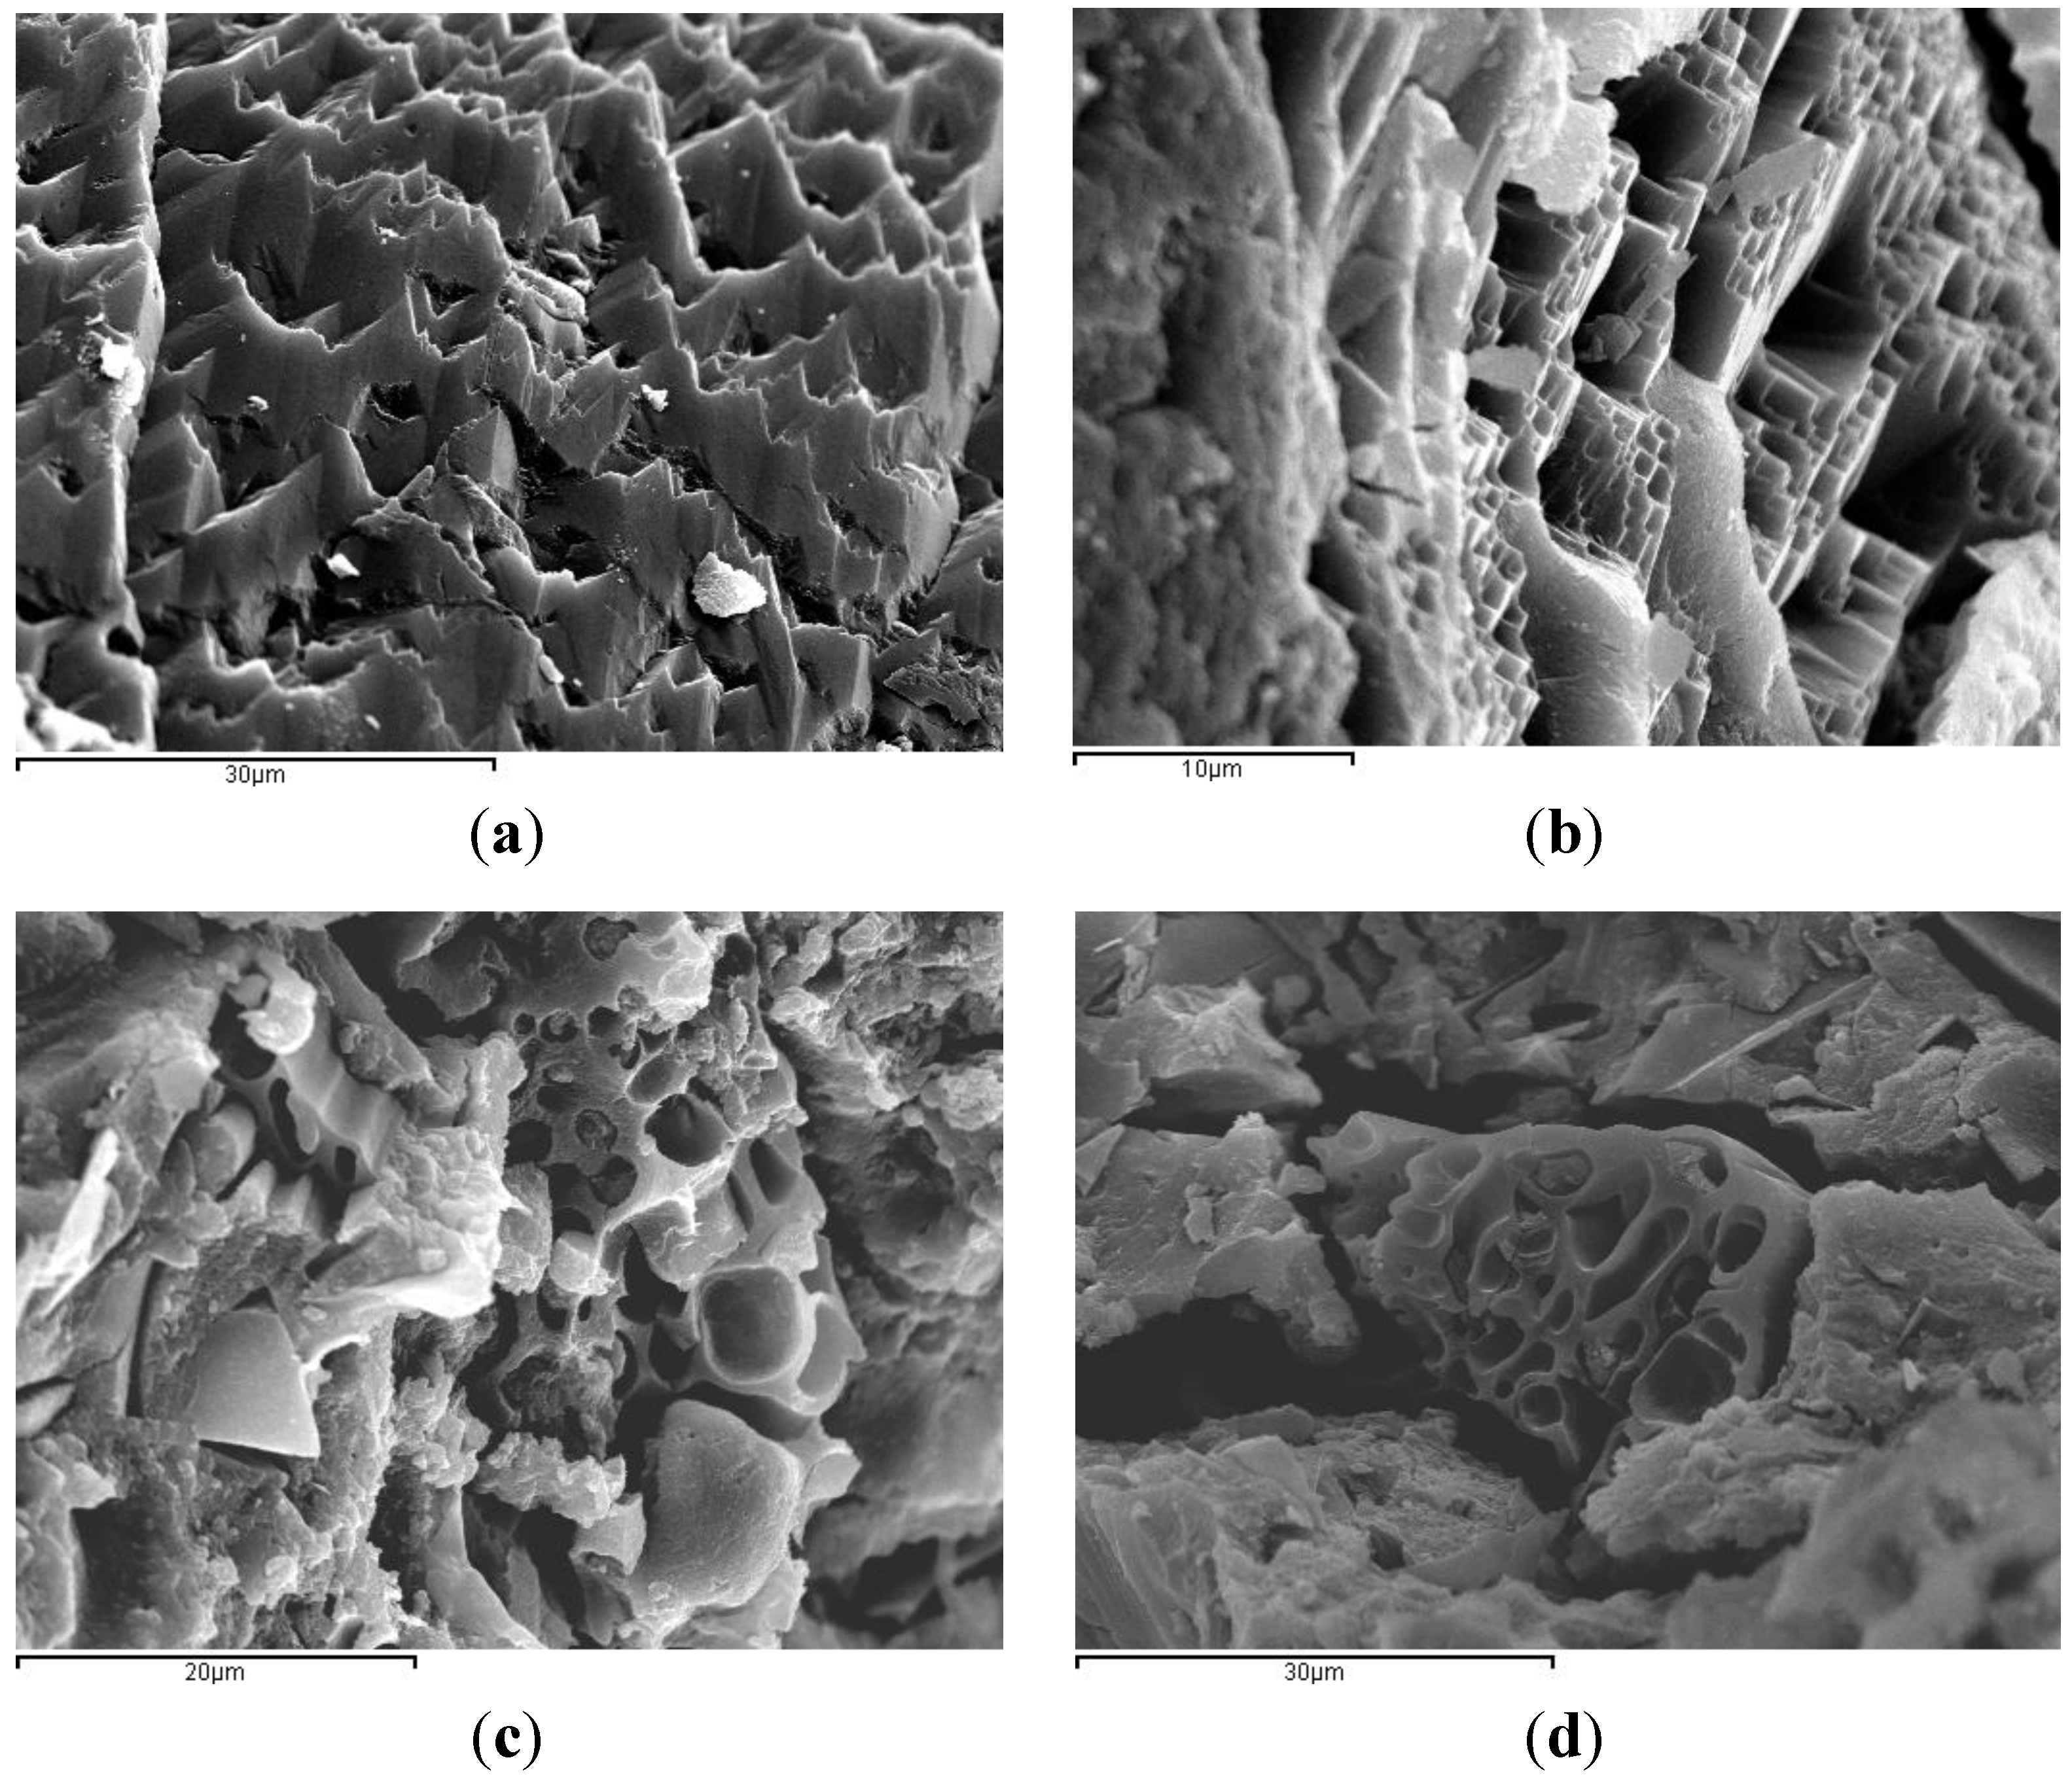
SEM micrographs of BFS/SCBA pastes cured at 65 °C for 3 days are shown in
Figure 7. The
Figure 7a shows the mix 100/0: a dense structure with sharp shapes and with some small pores. The
Figure 7b shows the mix 85/75: a similar gel structure was observed, as above. The dense matrix found in mixes 100/0 and 85/15 may be a consequence of the activation of the mineral admixture.
Figure 7c shows the mix 75/25: it was noticed a less dense structure quite different from the above pastes. Some porous particles embedded in the gel matrix were observed, due to the presence of unreacted SCBA particles (unburned or partially unburned bagasse particles). And finally, the
Figure 7d shows the mix 60/40, very similar to mix 75/25. Apparently, the highest contents of SCBA (25% and 40%) produced a more porous matrix.
Figure 7.
SEM micrographs of alkali-activated binders of BFS + SCBA cured at 65 °C for 3 days: (a) mix 100/0; (b) mix 85/15; (c) mix 75/25; (d) mix 60/40.
Figure 7.
SEM micrographs of alkali-activated binders of BFS + SCBA cured at 65 °C for 3 days: (a) mix 100/0; (b) mix 85/15; (c) mix 75/25; (d) mix 60/40.
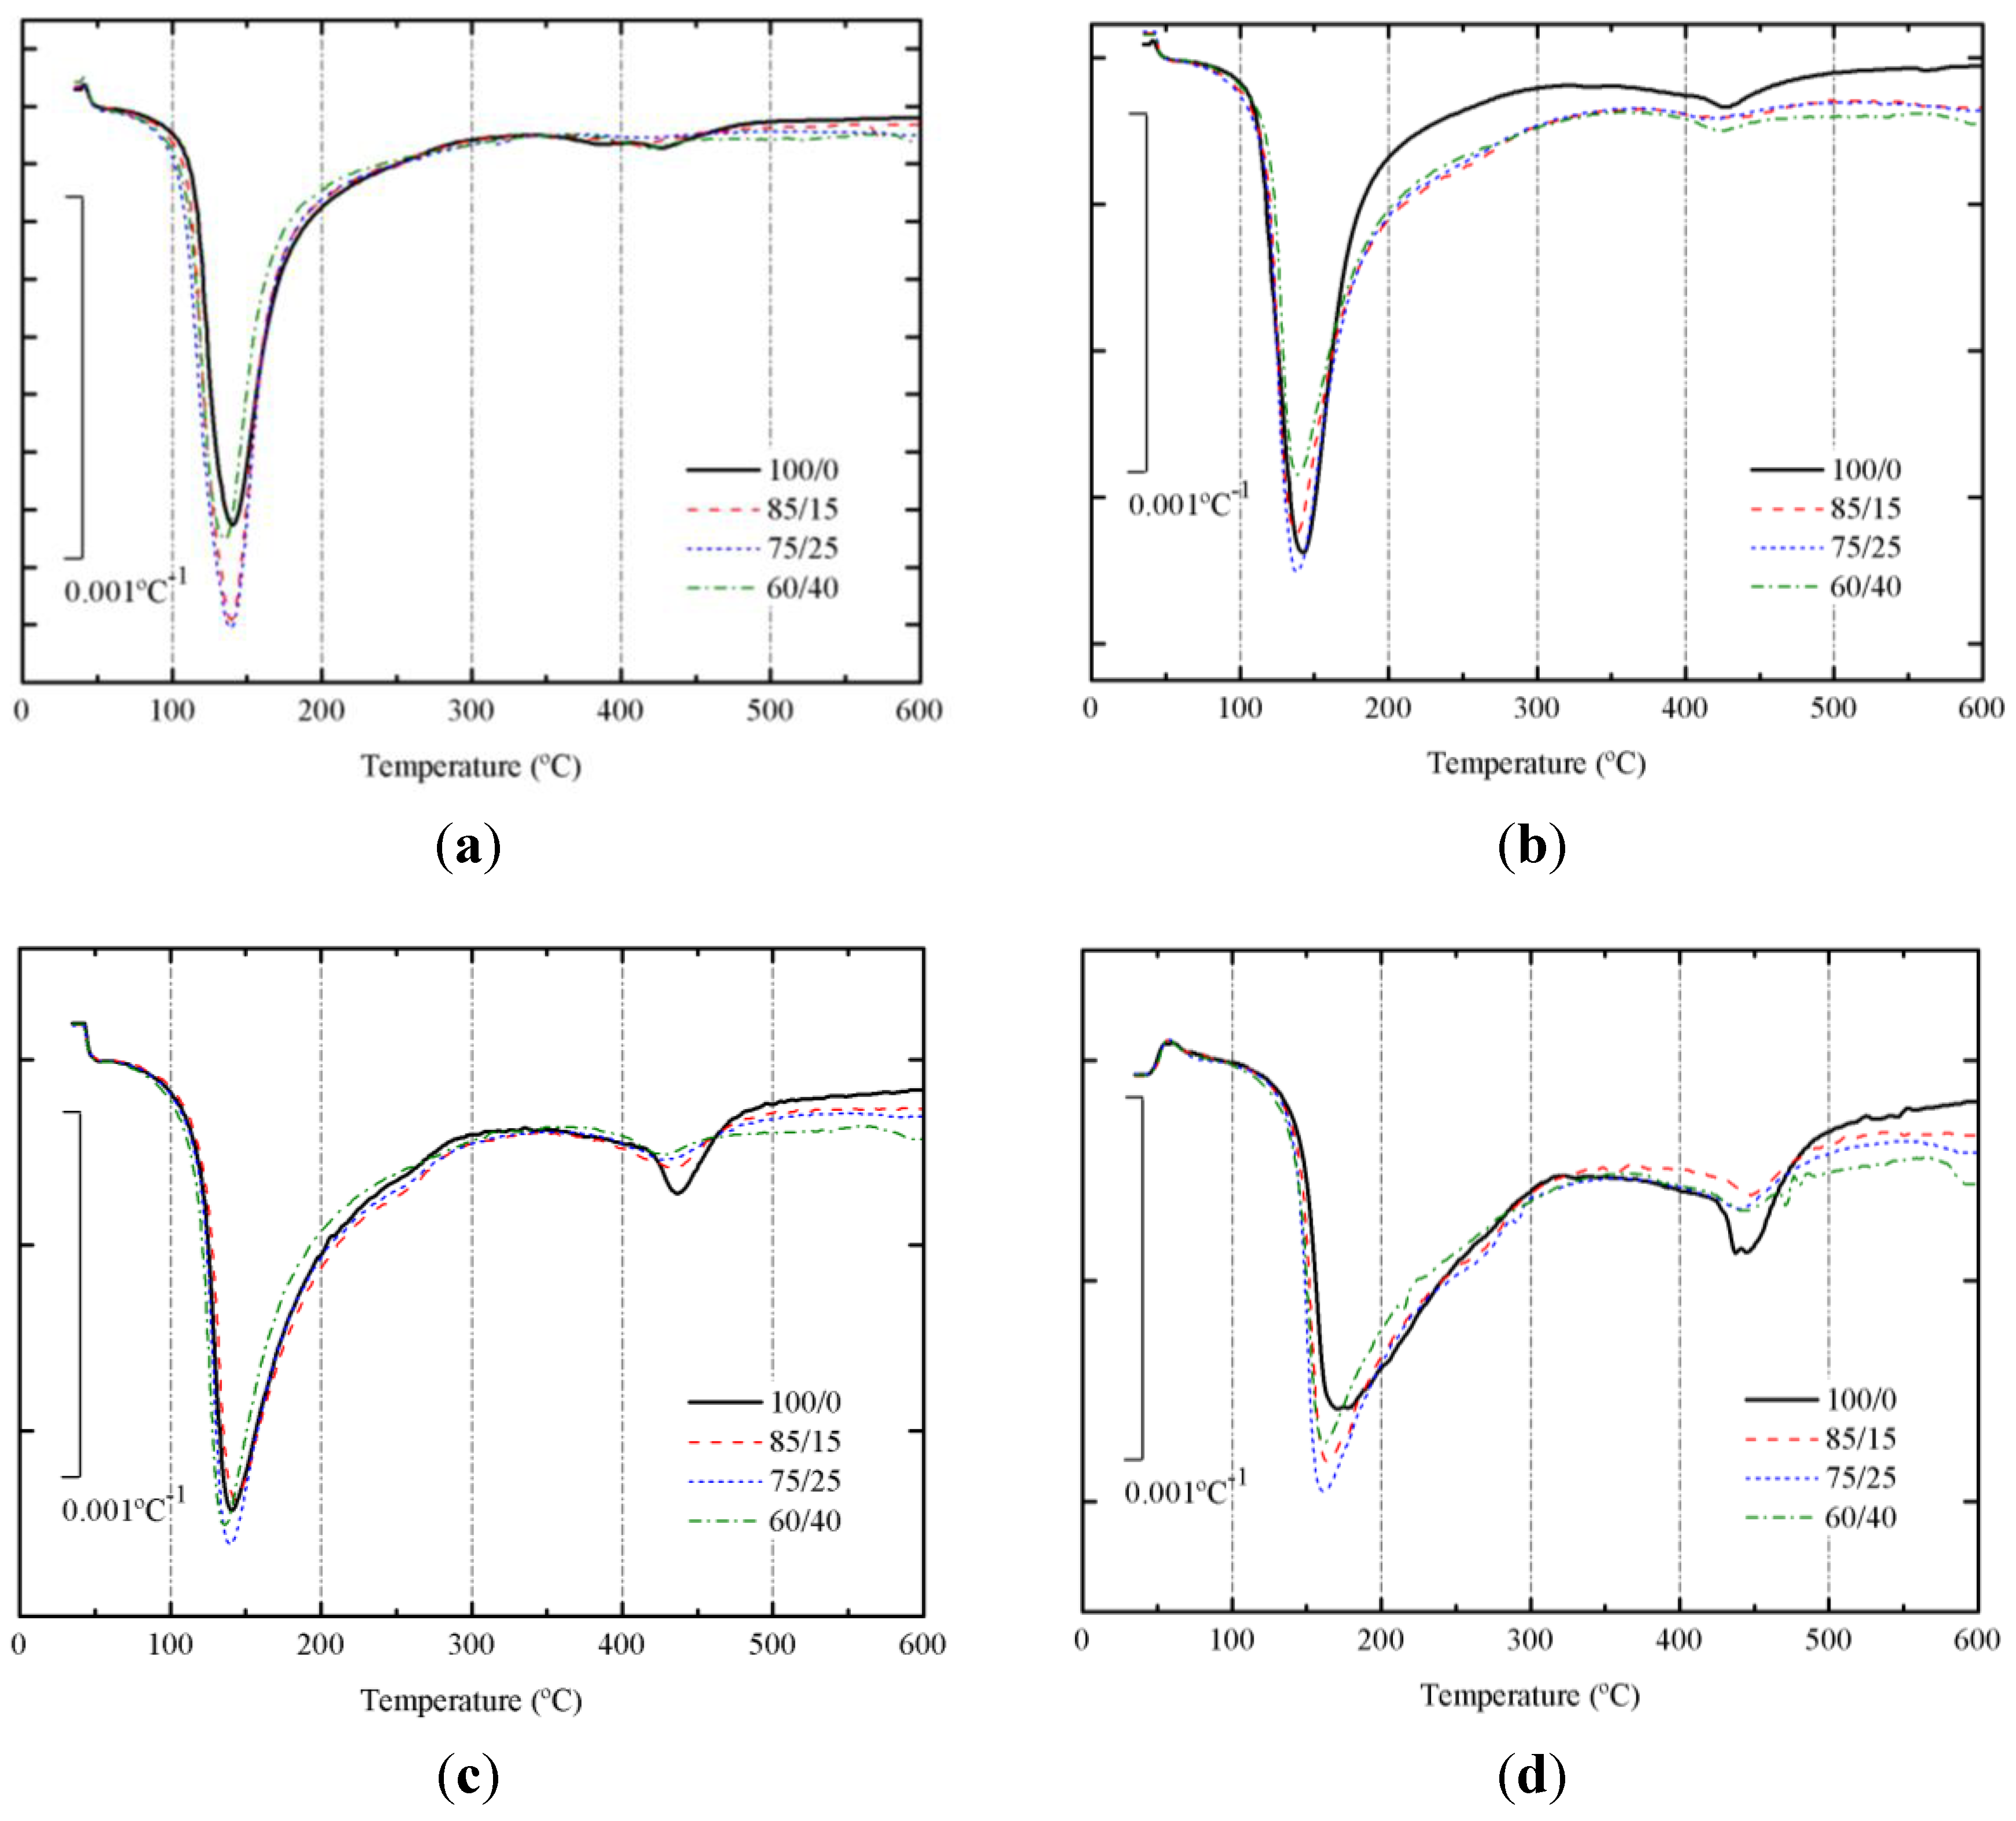
DTG curves for SCBA + BFS pastes cured at 65 °C for 3 days and 7 days are depicted in
Figure 8a,b, respectively. Corresponding DTG curves for pastes cured at 20 °C for 28 and 270 days are depicted in
Figure 8c,d, respectively.
Table 2 summarizes the total mass loss for all these pastes in the 35–600 °C range.
Figure 8.
DTG curves for alkali activated BFS + SCBA pastes cured: (a) after 3 days at 65 °C; (b) after 7 days at 65 °C; (c) after 28 days at 25 °C; (d) after 270 days at 25 °C.
Figure 8.
DTG curves for alkali activated BFS + SCBA pastes cured: (a) after 3 days at 65 °C; (b) after 7 days at 65 °C; (c) after 28 days at 25 °C; (d) after 270 days at 25 °C.
Table 2.
Total mass losses in the 35–600 °C range for BFS + SCBA pastes and temperature at the highest mass loss rate.
Table 2.
Total mass losses in the 35–600 °C range for BFS + SCBA pastes and temperature at the highest mass loss rate.
| Mix BFS/SCBA | Mass loss in pastes in different curing conditions (days–temperature) and temperature at the highest mass loss rate (°C, in parentheses) |
|---|
| 3 d–65 °C | 7 d–65 °C | 28 d–20 °C | 270 d–20 °C |
|---|
| 100/0 | 18.15 (140) | 19.28 (143) | 15.69 (141) | 15.58 (171) |
| 85/15 | 20.00 (139) | 17.93 (139) | 16.36 (143) | 15.87 (164) |
| 75/25 | 21.42 (139) | 18.34 (138) | 16.77 (140) | 17.25 (162) |
| 60/40 | 19.15 (135) | 17.53 (139) | 16.33 (136) | 16.81 (161) |
In all DTG curves, a peak centered in the 135–171 °C range was observed. This behavior means that the alkaline activation took place and some binder gel was formed [
16,
33]. The water molecules and OH groups are bonded to the new aluminosilicate network. Mass losses for pastes cured at 65 °C were higher than those found for pastes cured at 20 °C. This fact means that the matrix formed at 65 °C presented more H
2O/OH groups. And the DTG peak did not shift after increasing the curing time from 3 to 7 days. Also, mass losses for pastes cured at 20 °C did not vary from 28 to 270 days; however, in this case a significant shift of the DTG peak was observed, from the 136–143 °C to the 161–171 °C range. This behavior would be related to the stronger binding of H
2O/OH groups in the matured matrix for long curing times. These data suggest that it would be an interesting change in mechanical properties of these matrices.
Additionally, a small peak was identified in the 420–470 °C range. This peak is more important for pates cured at 65 °C for 7 days, and especially for pastes cured at 20 °C for 270 days. Moreover, this peak is larger for pastes 100/0, suggesting that this peak could be related to the presence of slag in the studied pastes. Probably, the decomposition observed at this temperature range is related to the presence of brucite or hydrotalcite [
34,
38,
39].
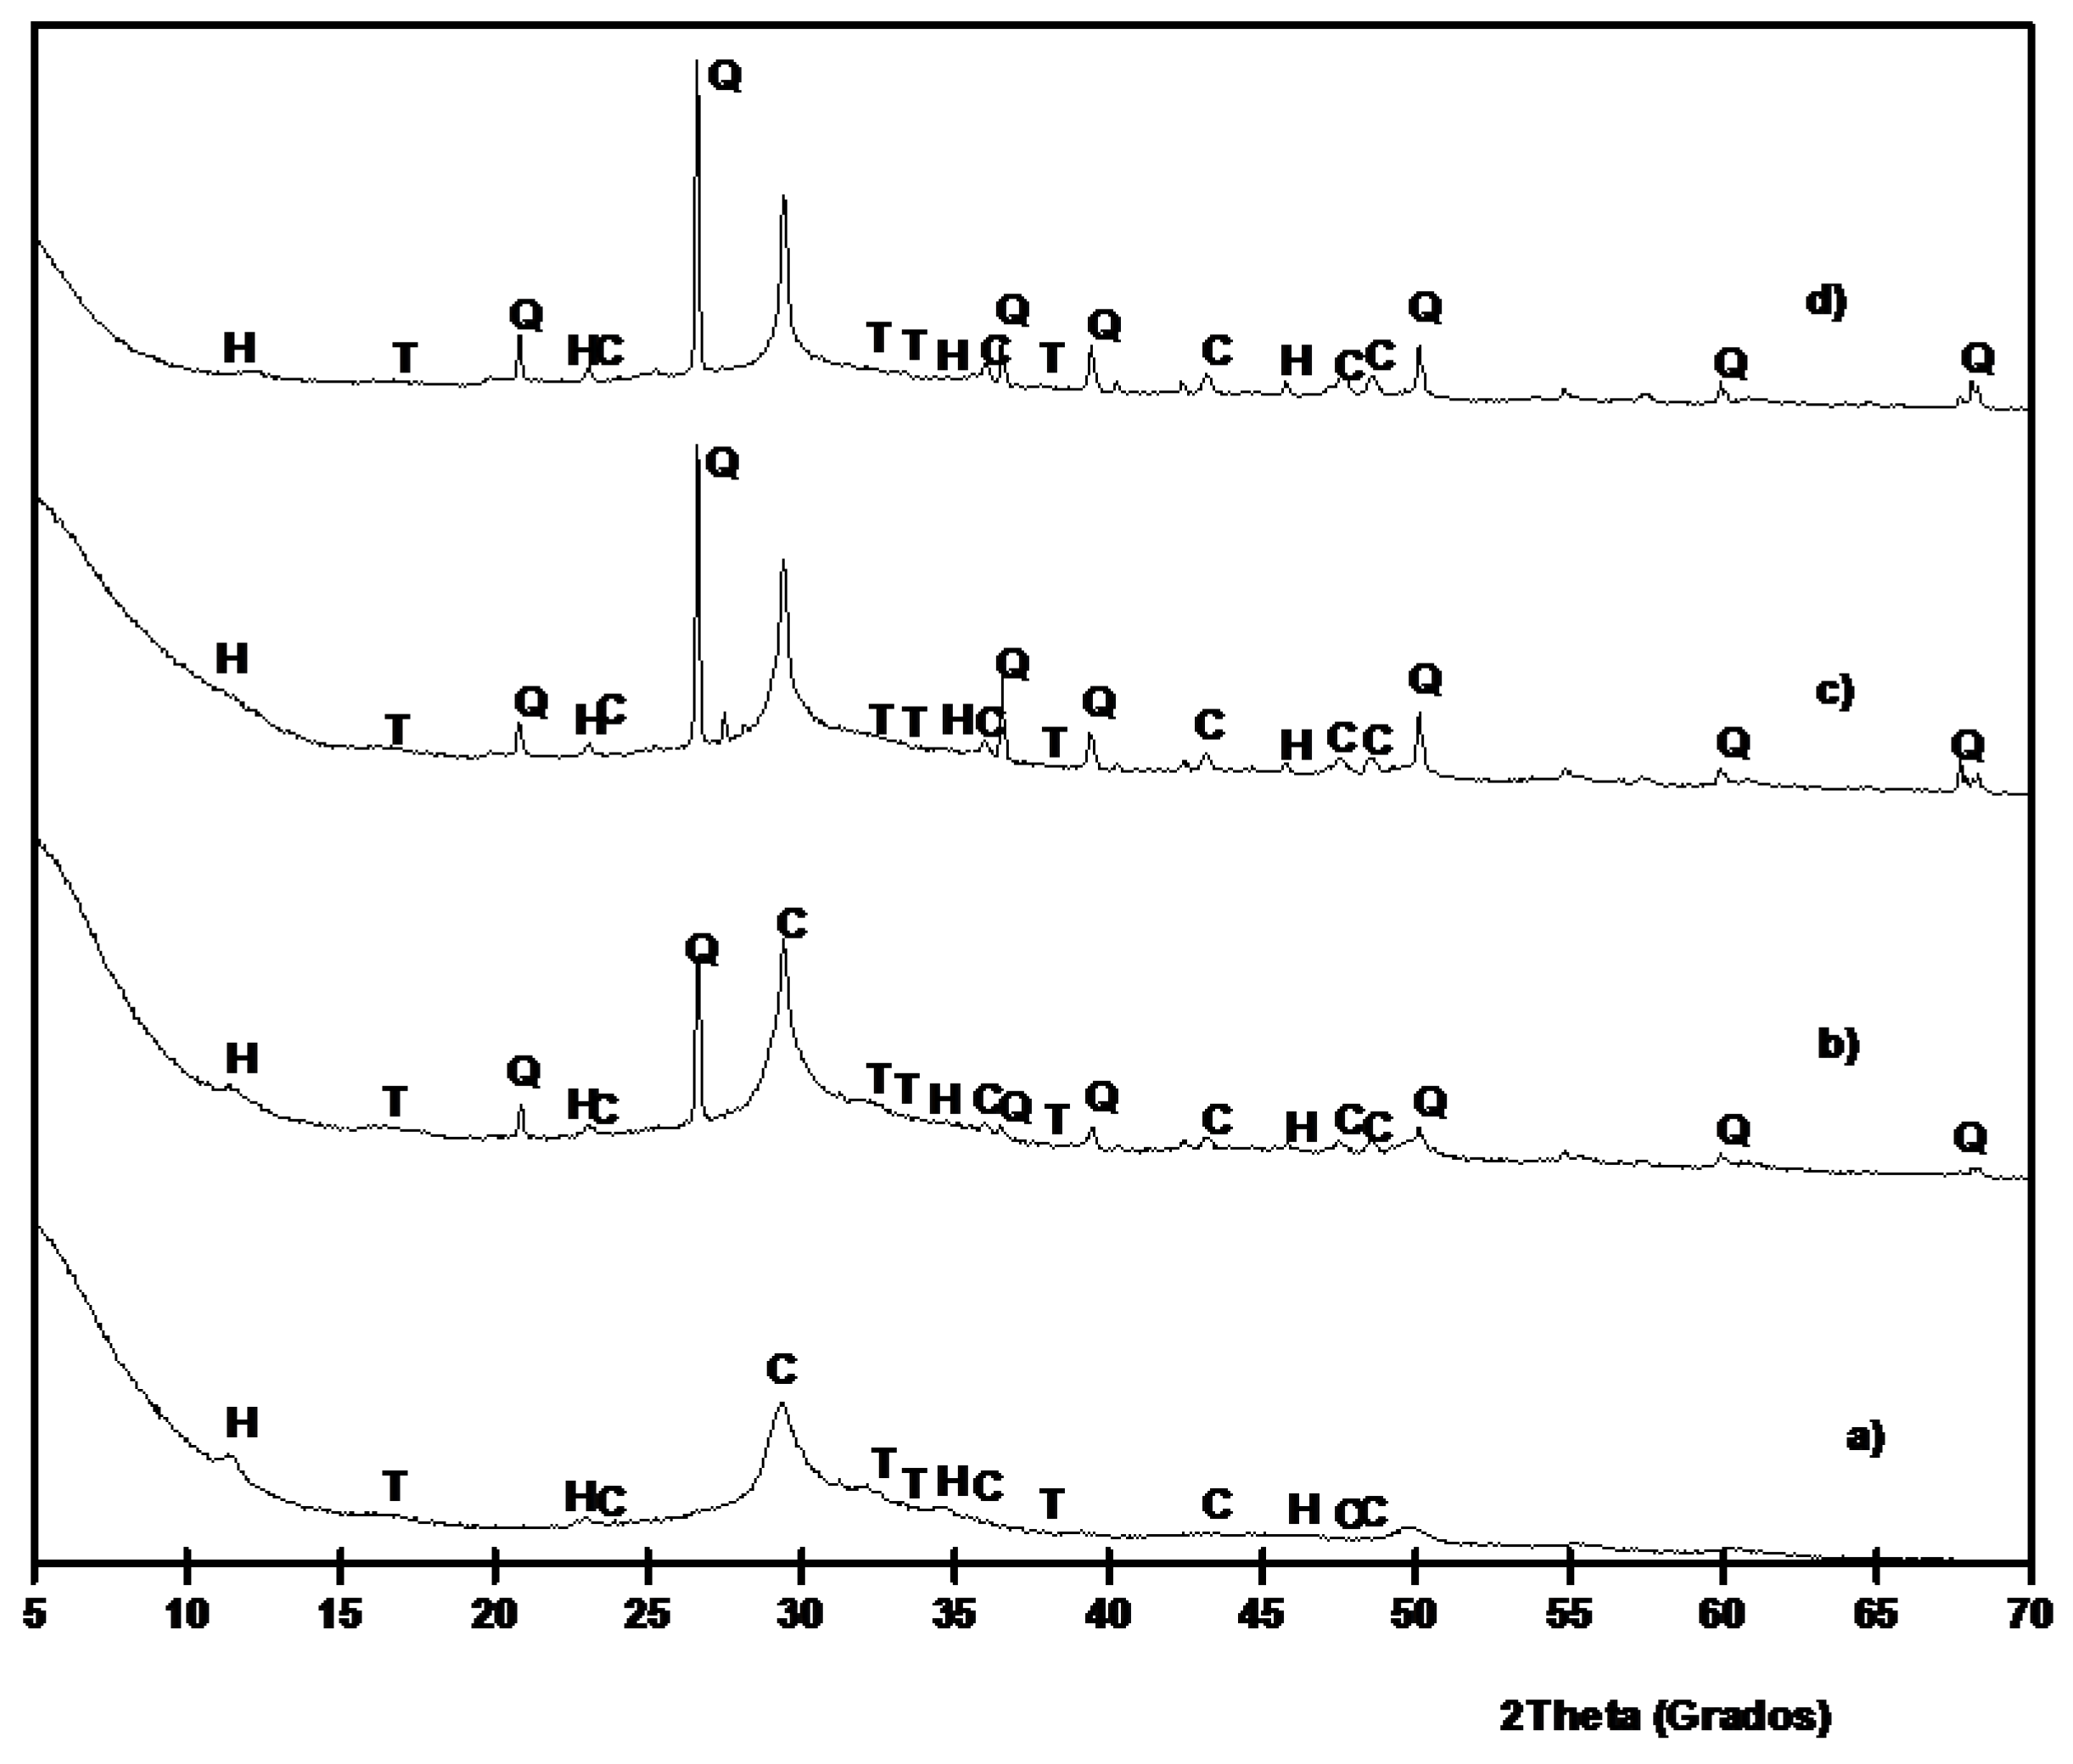
XRD patterns for 100/0 paste cured for 3 days at 65 °C is shown in
Figure 9a. The most important peak present in this paste is a broad peak centered at 2θ = 29.35, which is slightly lower than those found in BFS (centered at 2θ = 30.86°). This behavior demonstrates the formation of an amorphous gel C–N–S–A–H [
13,
40]. Also, peaks belonging to calcite, thermonatrite (Na
2CO
3·H
2O, PDF card 080448) and hydrotalcite (PDF card 140191) were identified. The presence of hydrotalcite, Mg
6Al
2CO
3(OH)
16·4H
2O, agree with TGA identification. For pastes containing SCBA (
Figure 9b–d) the presence of quartz and calcite became more important, because of the replacement of BFS by SCBA. The baseline deviation for BFS/SCBA mixtures was less important because the presence of quartz and calcite. Also, traces of hydrotalcite were found.
Figure 9.
XRD diffractograms for BFS/SCBA pastes cured for 3 days at 65 °C: (a) 100/0; (b) 85/15; (c) 75/15; (d) 60/40. (Key: Q: Quartz; C: Calcite; T: Thermonatrite; H: Hydrotalcite).
Figure 9.
XRD diffractograms for BFS/SCBA pastes cured for 3 days at 65 °C: (a) 100/0; (b) 85/15; (c) 75/15; (d) 60/40. (Key: Q: Quartz; C: Calcite; T: Thermonatrite; H: Hydrotalcite).
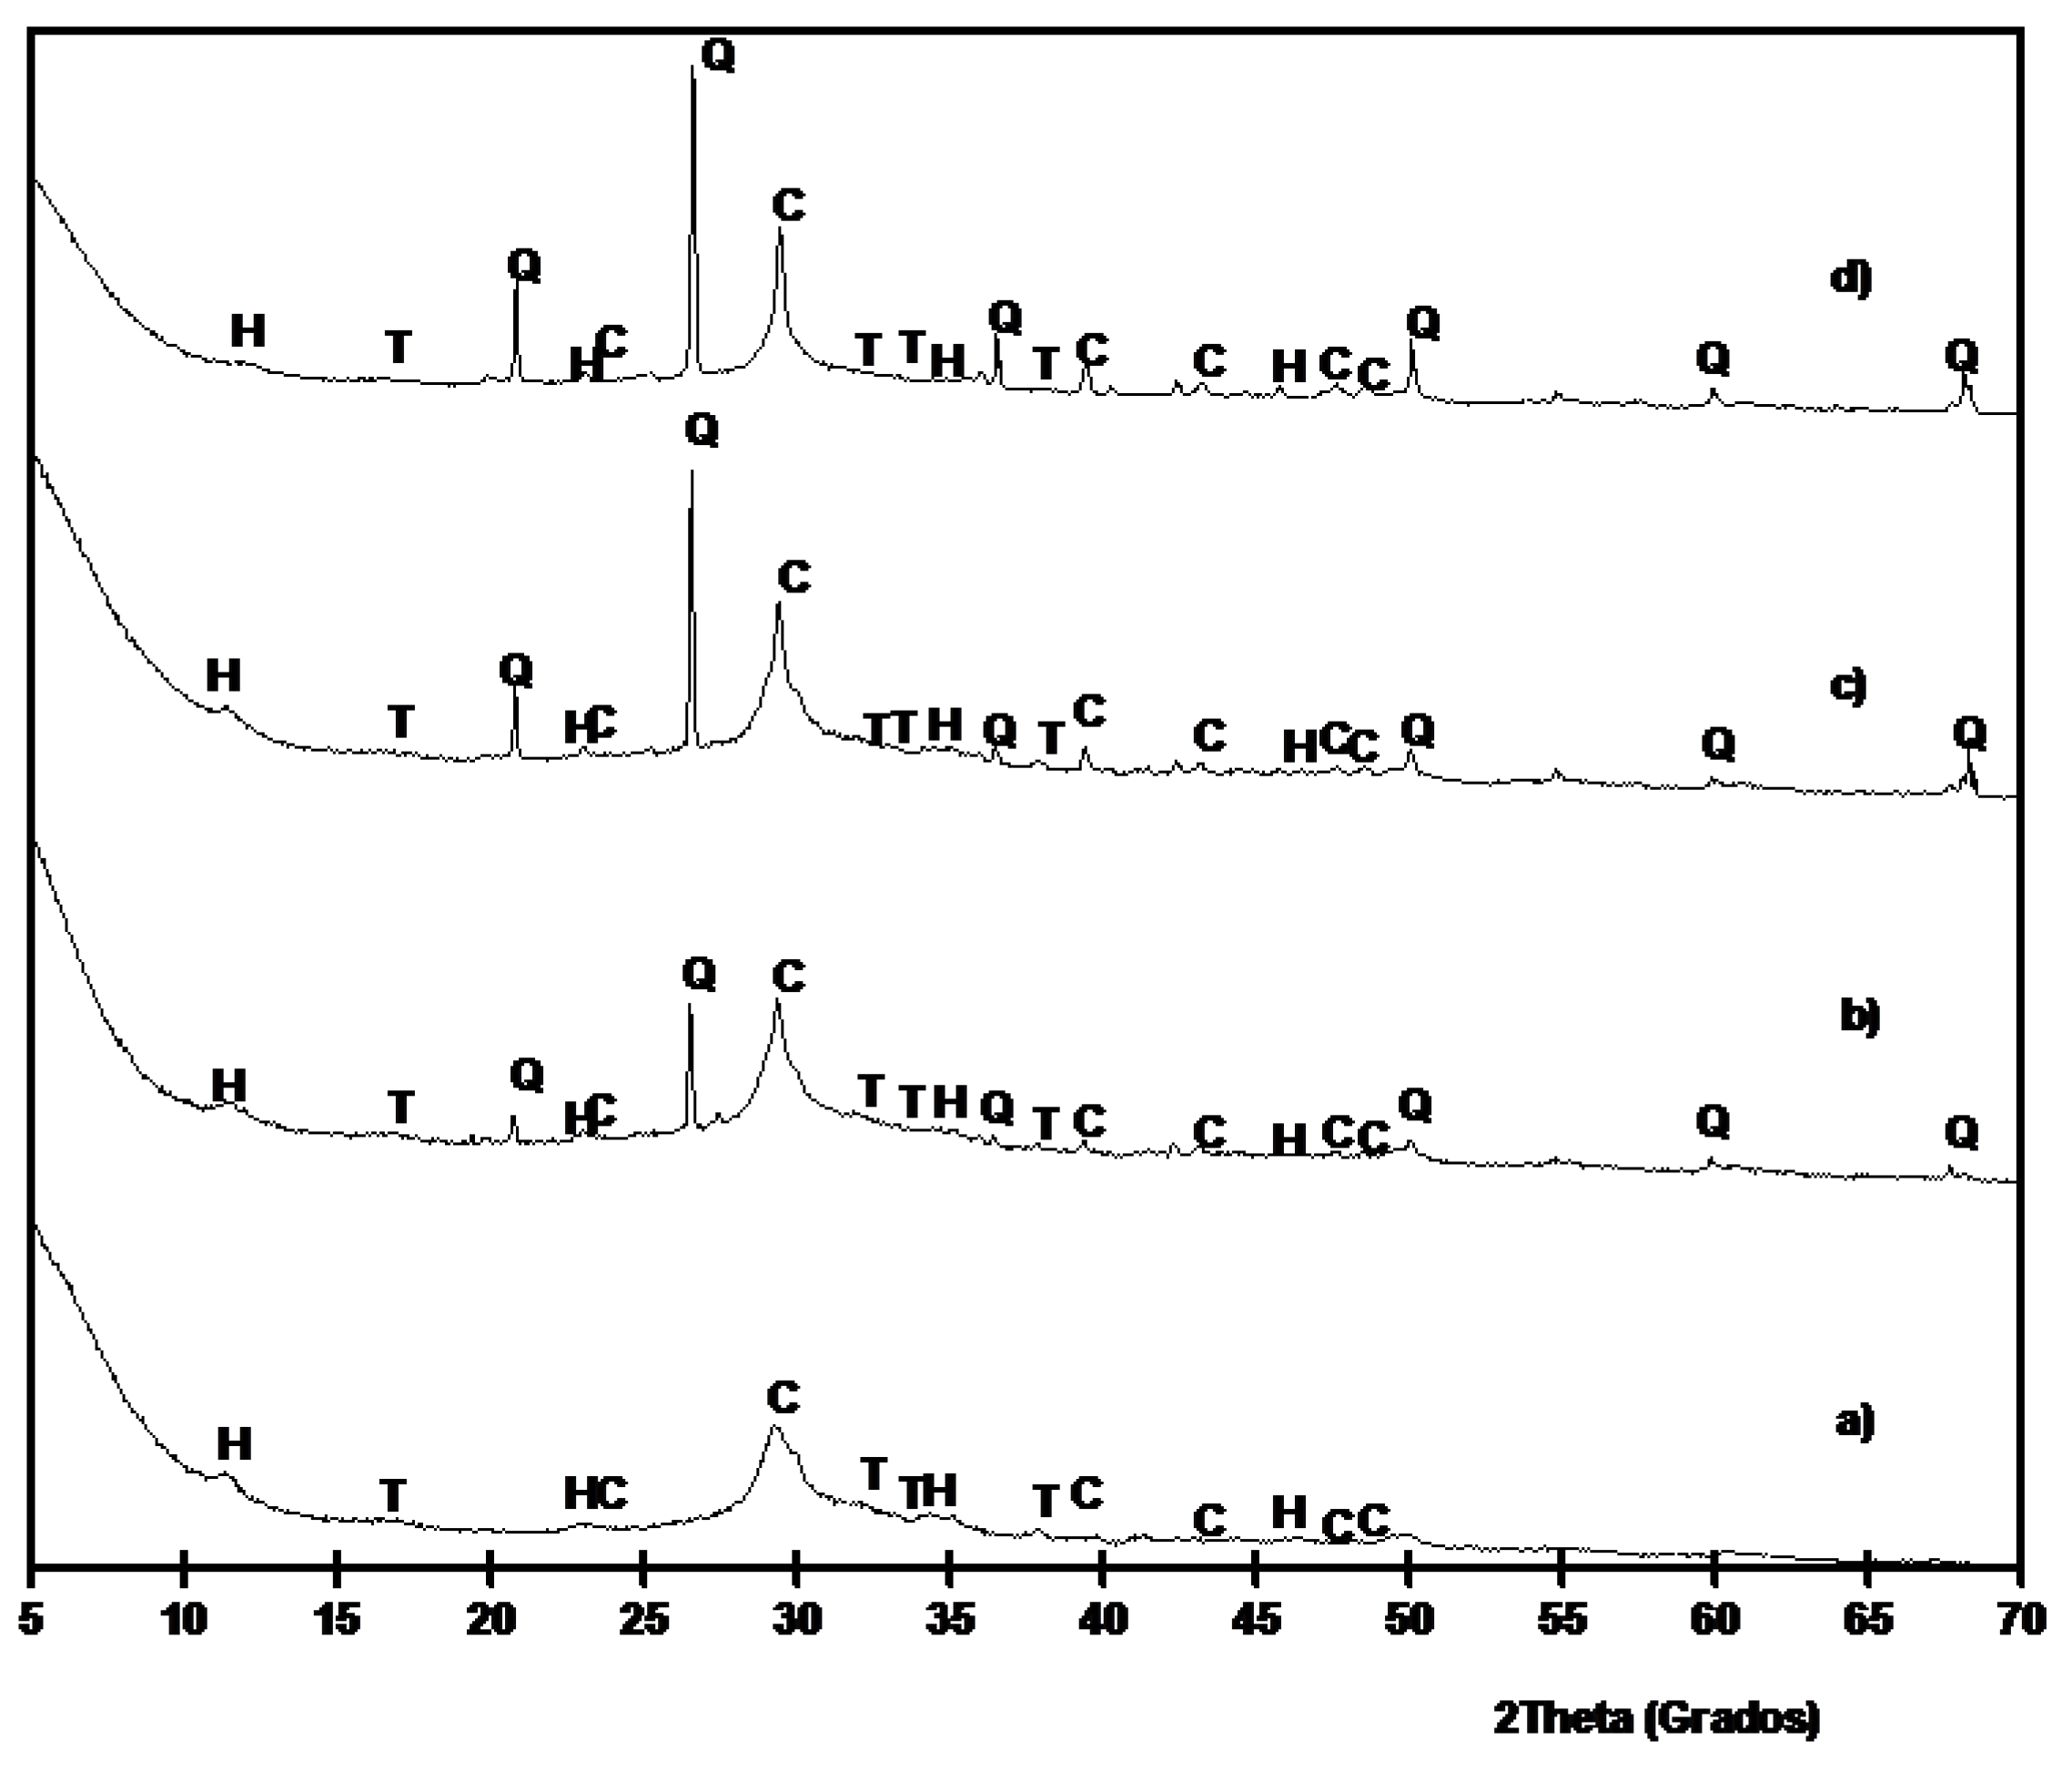
Figure 10 shows the XRD diffractograms for pastes cured at 20 °C for 270 days. Similar results were obtained if compared to results on pastes cured at 65 °C. In this case, hydrotalcite peaks were easily observed.
Figure 10.
XRD diffractograms for BFS/SCBA pastes cured for 270 days at 20 °C: (a) 100/0; (b) 85/15; (c) 75/15; (d) 60/40. (Key: Q: Quartz; C: Calcite; T: Thermonatrite; H: Hydrotalcite).
Figure 10.
XRD diffractograms for BFS/SCBA pastes cured for 270 days at 20 °C: (a) 100/0; (b) 85/15; (c) 75/15; (d) 60/40. (Key: Q: Quartz; C: Calcite; T: Thermonatrite; H: Hydrotalcite).
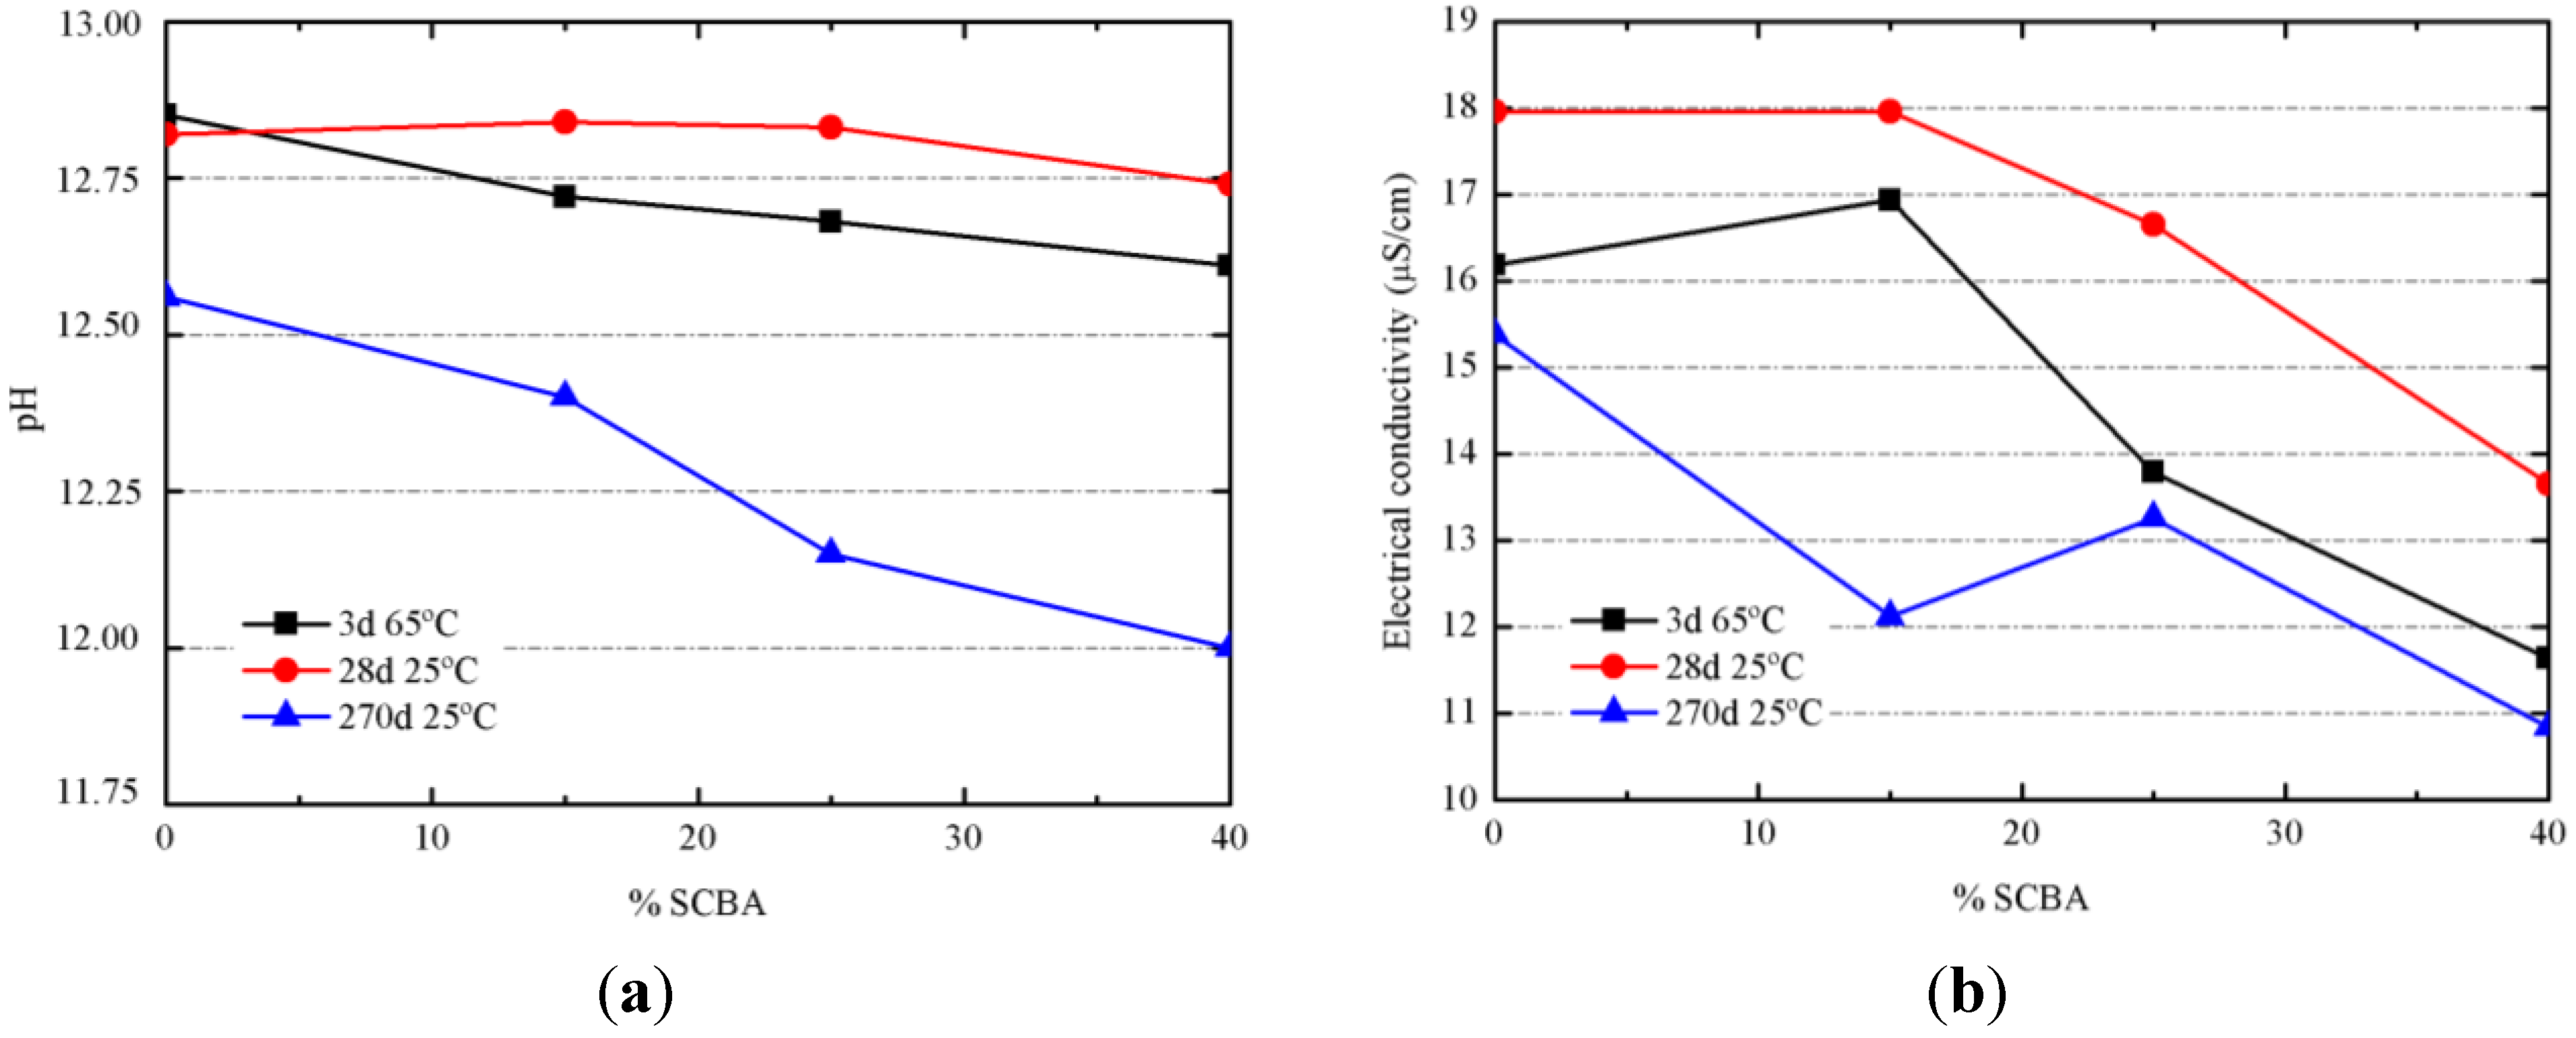
Figure 11.
Evolution of the properties of alkali-activated pastes: (a) pH values; (b) electrical conductivity values.
Figure 11.
Evolution of the properties of alkali-activated pastes: (a) pH values; (b) electrical conductivity values.
The progress of alkali-activated reaction was monitored by means of pH and electrical conductivity measurements in an aqueous suspension [
21]. Pastes cured after 3 days at 65 °C and pastes cured after 28 days at 20 °C had small differences on pH when the replacing percentage of SCBA was increasing (
Figure 11a). For pastes cured at 20 °C for 270 days, differences are more significant, finding that 100/0 had pH = 12.56; pH values for 85/15, 75/25 and 60/40 were lowered to 12.40, 12.15 and 12.00, respectively. This behavior has been attributed to two factors: firstly, the hydraulicity of BFS, which favored the increase of pH; and secondly, the reactivity of SCBA by combination of silica network with OH
− anions, by the cleavage of Si–O–Si bonds to produce silanol groups (Si-O-H). The higher chemical reaction progress for pastes cured at 20 °C for 270 days will be assessed by means of mechanical experiments (see below). Associated to the pH reduction, there is a parallel decrease of electrical conductivity (
Figure 11b). Alkali-activator solution was the same for all pastes, and consequently, the lowest electrical conductivity for pastes containing the highest replacement of BFS by SCBA suggests that a larger quantity of ions (sodium cation, silicate and hydroxyl anions) were chemically reacted.
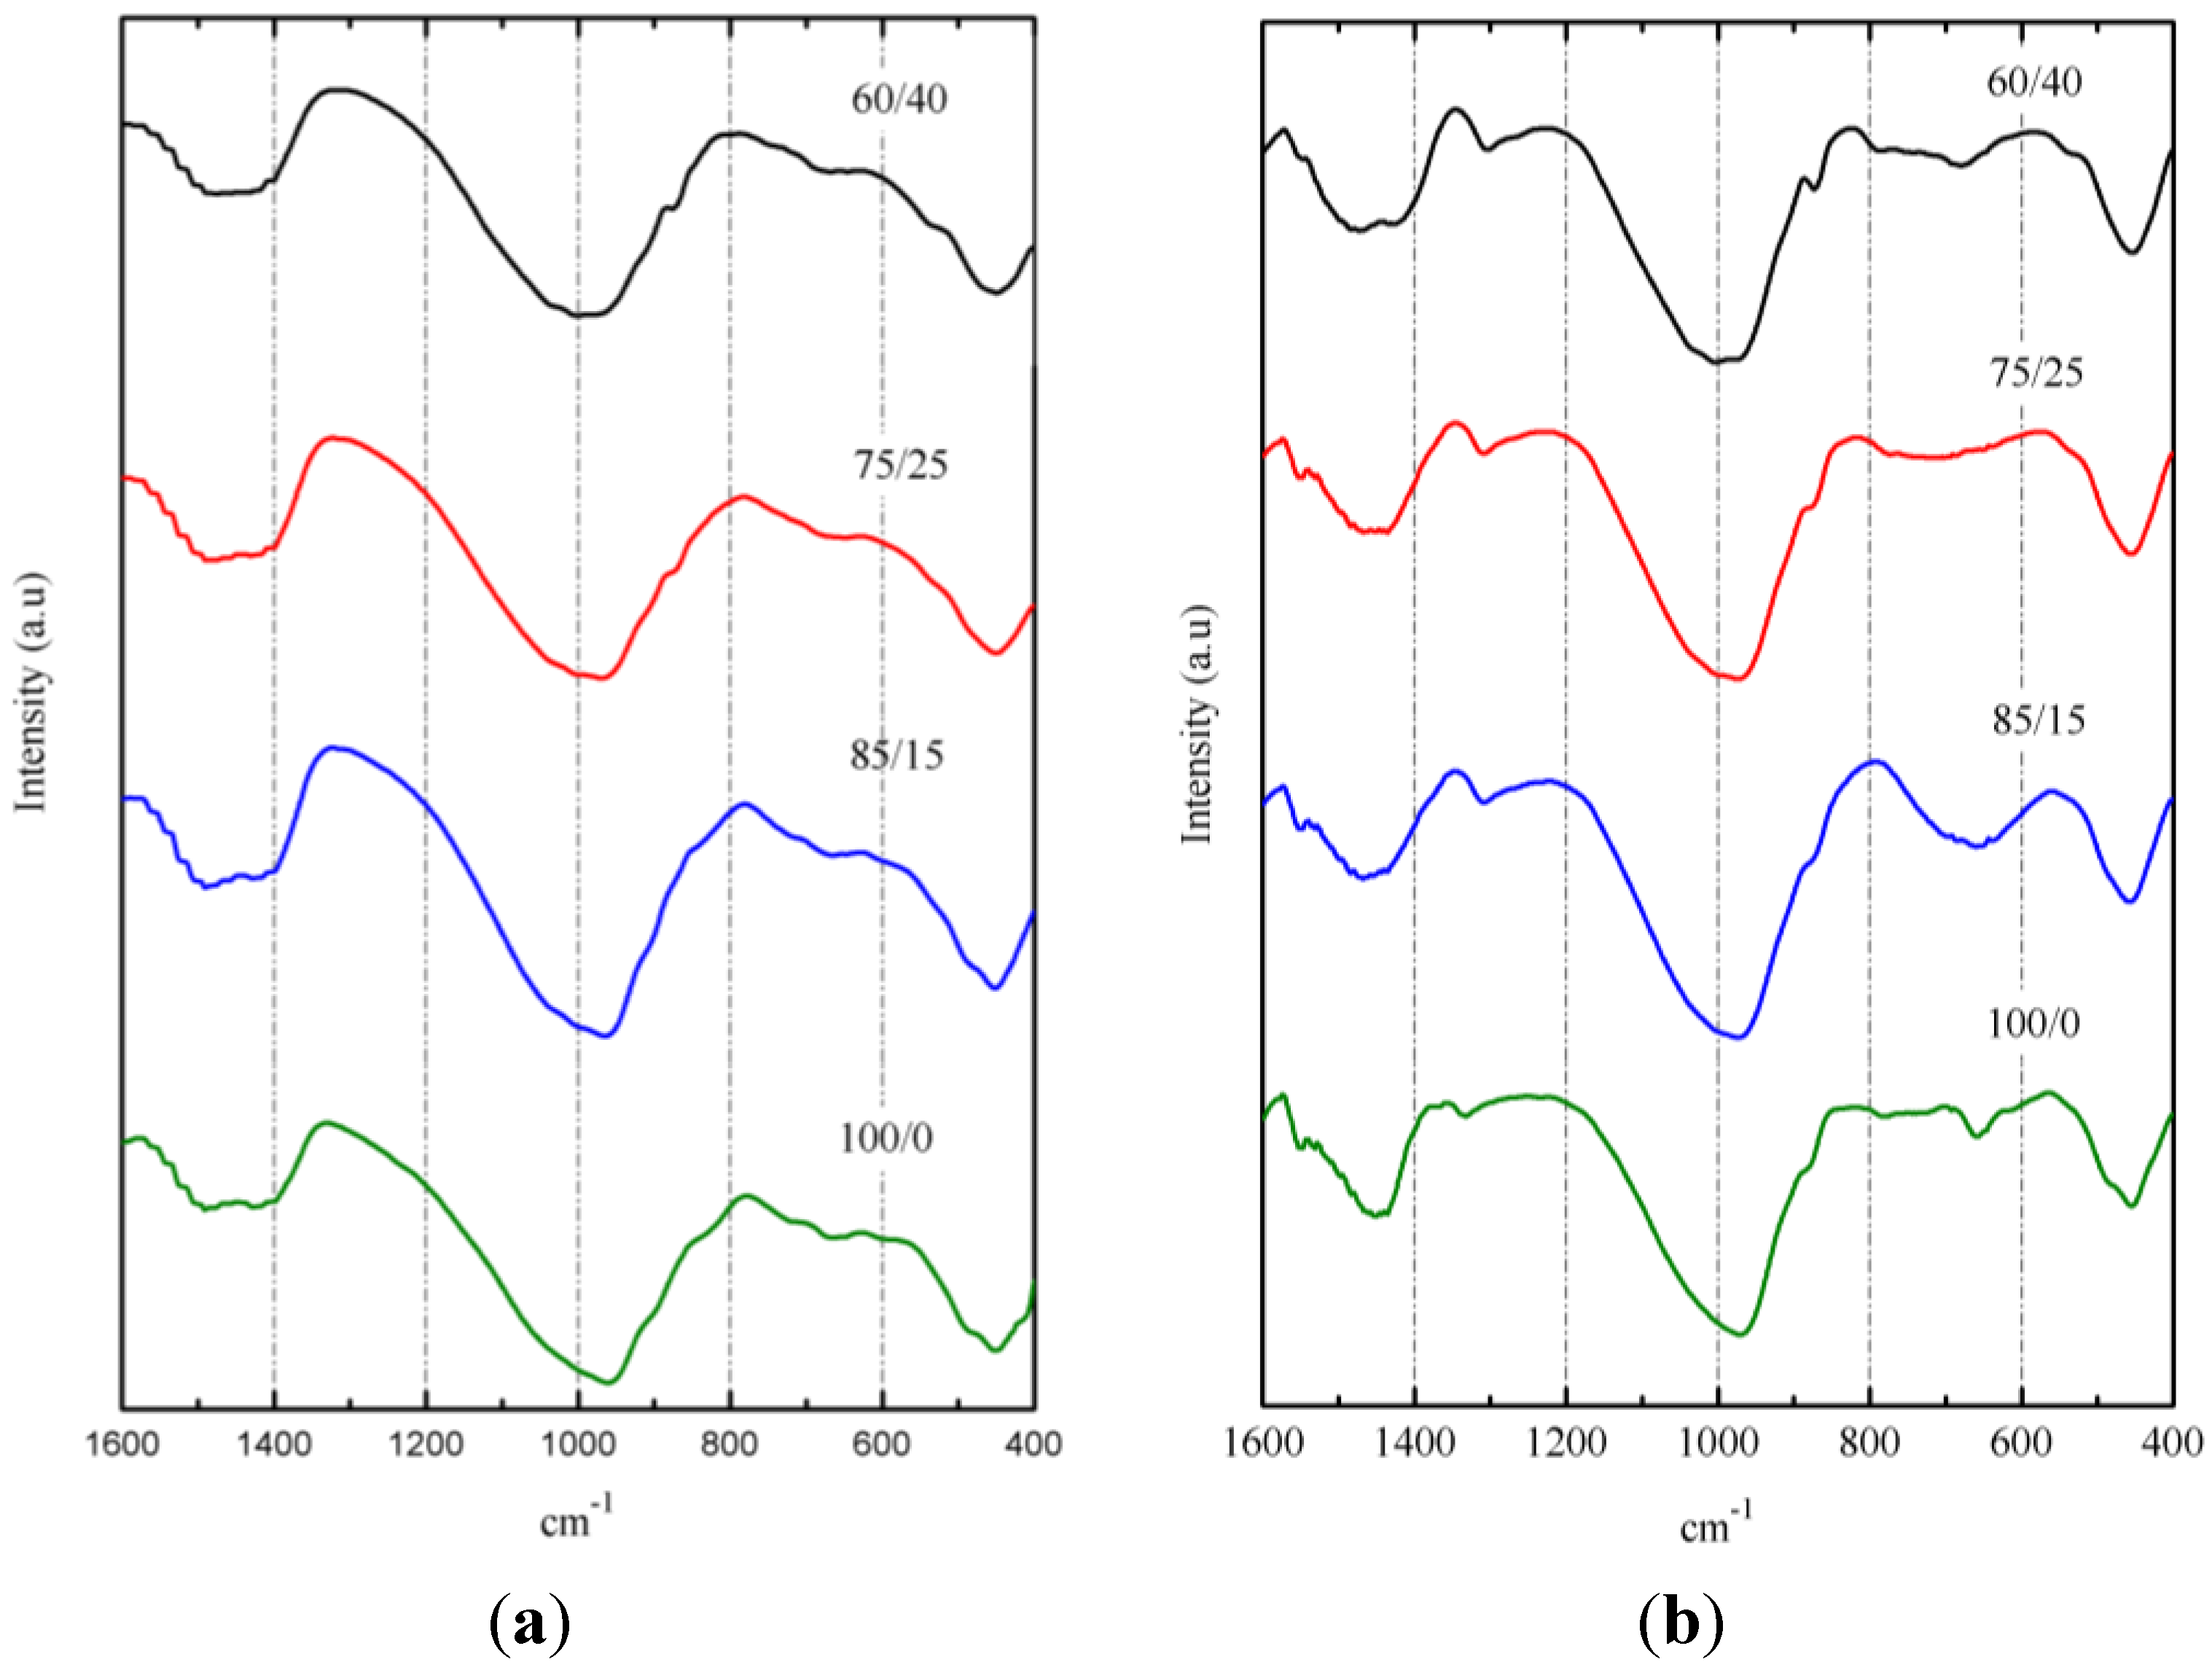
Figure 12 shows the FTIR spectra of pastes after 3 days of curing at 65 °C (
Figure 12a) and after 270 days of curing at 20 °C (
Figure 12b). The broadness of the main absorption band (Si–O stretching vibrations) around 960–973 cm
−1 for pastes cured at 65 °C and 974–1004 cm
−1 for pastes cured at 20 °C is indicative of the disordered structure of these materials. According to Clayden
et al. [
41], a broadness of the main band results from the coexistence of various SiQ
n units in the amorphous network. The peak of this broad band shifted to lower wave-number values for 100/0 pastes, probably due to the presence of more aluminum in BFS than in SCBA [
42]. The increasing curing time from 3 to 270 days resulted in shifting the main band (e.g., for the 100/0 paste, the shift was from 960 to 974 cm
−1, and for the 60/40 paste, the shift was from 974 to 1004 cm
−1. This could be a consequence of increasing Q
3 units [
36] and can be attributed to the role of SCBA.
Figure 12.
FTIR spectra for BFS/SCBA pastes: (a) cured at 65°C for 3 days; (b) cured at 20 °C for 270 days.
Figure 12.
FTIR spectra for BFS/SCBA pastes: (a) cured at 65°C for 3 days; (b) cured at 20 °C for 270 days.
Table 3 shows mechanical strengths values (compressive, R
c; flexural, R
f) of mortars cured at 65 °C after 3 and 7 days of curing. R
c values at 3 days were in the 42–54 MPa range, finding higher R
c values for 85/15 and 75/25 mixtures. For 7 days curing time, 100/0 sample increased the R
c value to 62.2 MPa, whereas mortars containing SCBA showed little change.
This behavior could be attributed to the SCBA that contribute on the early stages of alkali activation reaction (in the first 3 days). However, the sample with only BFS as a mineral admixture, present a progress on the strength development from 3 to 7 days, as observed in TG analysis of pastes. In terms of Rf values, a decrease was observed from 3 to 7 days, suggesting changes in the microcrack pattern due to prolonged high temperatures, specially for SCBA containing mortars. In these conditions (high curing temperature), the negative influence of organic matter and carbon present in SCBA on the hardening process of alkali-activated systems based on Slag/SCBA is negligible.
Table 3.
Mechanical strengths of mortars cured at 65 °C.
Table 3.
Mechanical strengths of mortars cured at 65 °C.
| Mixtures | Rc (MPa) | Rf (MPa) |
|---|
| 3 days | 7 days | 3 days | 7 days |
|---|
| 100/0 | 45.5 ± 2.9 | 62.2 ± 2.6 | 5.80 ± 0.3 | 5.39 ± 1.1 |
| 85/15 | 53.5 ± 2.0 | 51.2 ± 0.4 | 5.31 ± 0.4 | 2.94 ± 0.6 |
| 75/25 | 49.0 ± 2.7 | 52.8 ± 1.9 | 5.31 ± 0.6 | 4.00 ± 0.4 |
| 60/40 | 42.8 ± 0.9 | 43.2 ± 0.3 | 3.84 ± 0.5 | 3.19 ± 0.4 |
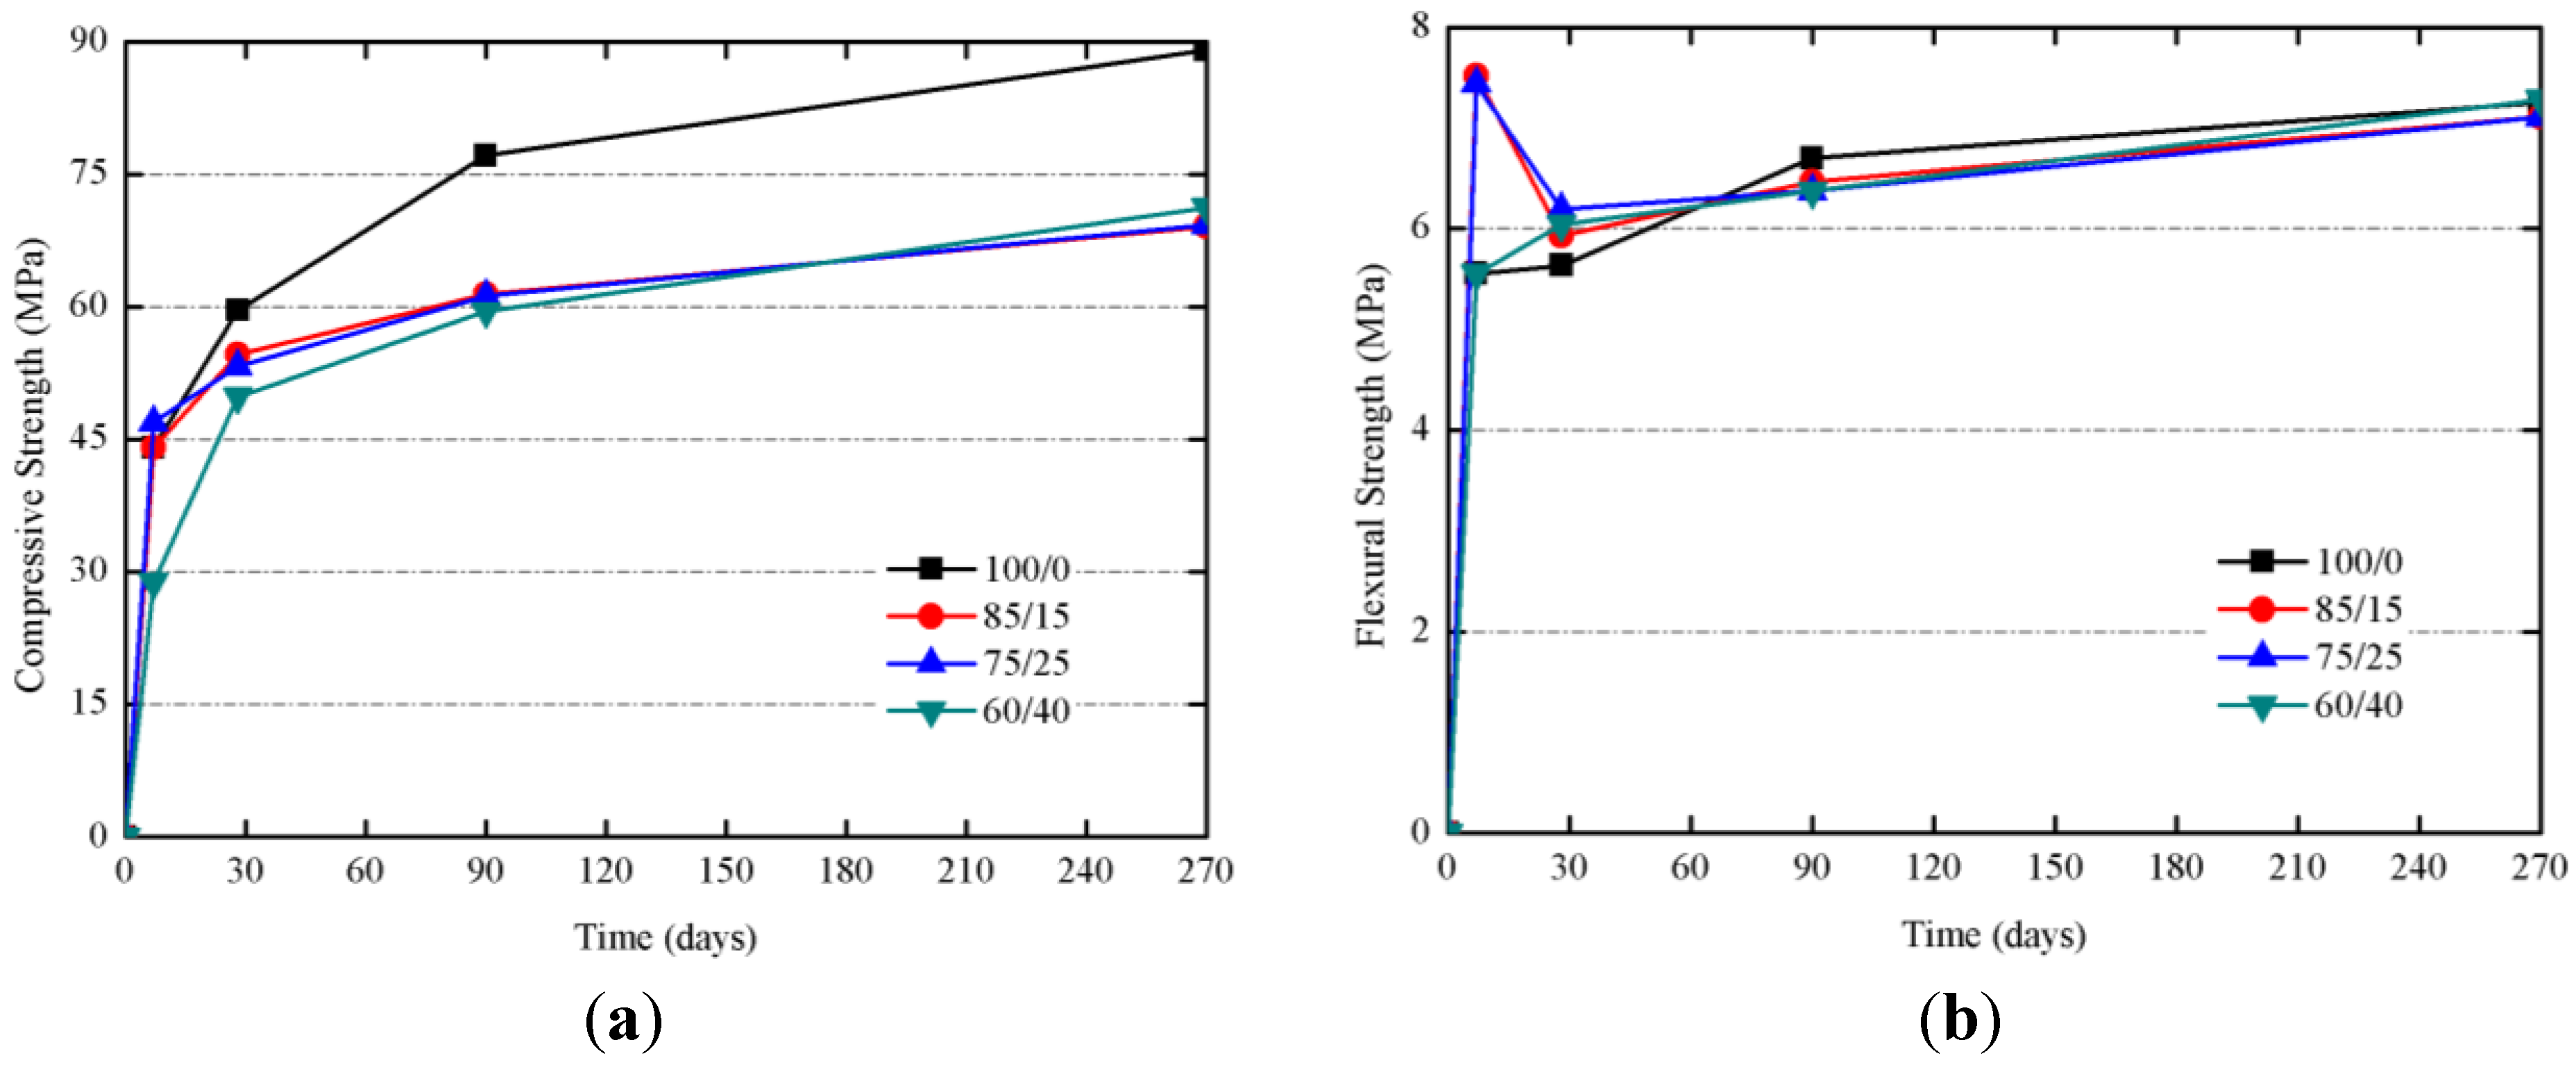
Studies on mortars cured at 20 °C at 7, 28, 90 and 270 days were carried out. The
Figure 13a shows the evolution for R
c of samples cured at 20 °C. R
c values at 28 days were very similar, and for longer curing times (90 and 270 days), 100/0 mortar showed a significant increase on R
c (from 59.6 to 89.0 MPa), suggesting that, on one hand, the presence of SCBA enhances the reactivity at early ages, and, on the other hand, the matrix containing only BFS is developed for longer ages. Samples containing SCBA showed very similar R
c values after 270 days (
ca. 70 MPa), values significantly higher than those found for mortars cured at 65 °C (43–53 MPa, see
Table 2) indicating that the curing at lower temperatures let to form better developed matrices. Once again, it has been observed that the presence of organic matter and carbon in SCBA did not adversely influence strength development, even at lower curing temperatures. Also, interestingly, R
f values (see
Figure 13b) were in the 6–8 MPa range for longest the curing times: in this case, no decay in R
f values was observed, suggesting that the matrix produced at 20 °C did not suffer critical microcracks.
Figure 13.
Mechanical strength developments for of BFS + SCBA mortars cured at 20 °C: (a) Compressive strength; (b) Flexural strength.
Figure 13.
Mechanical strength developments for of BFS + SCBA mortars cured at 20 °C: (a) Compressive strength; (b) Flexural strength.
Finally, cured samples were characterized by means of Mercury Intrusion Porosimetry (MIP). The test was conducted for mortars cured for 3 days at 65 °C. In
Table 4, selected data for all mortars are summarized. Sample 100/0 showed the smallest total porosity, this indicates that the presence of the SCBA in the alkali activated binders did not contribute to reduce the total volume of accessible pores in this type of test. In general terms, for all pore size range, mortars containing SCBA showed higher specific volume of Hg (mL of Hg/g of mortar). The Hg retained after the extrusion step was high in all samples, suggesting that the alkali-activated matrices presented a significant tortuosity degree.
In
Table 5, data for mortars cured at 20 °C over 270 days are summarized. In this case, the total porosity obtained was lower than that found for mortars cured at 65 °C. This fact suggests that, taking into account that dosage compositions were the same in both curing conditions, the reduction in curing temperature allowed an improved development of the matrix, closing many pores and capillaries, and then reducing the total volume of pores. This reduction was found for all selected pore size ranges summarized in
Table 5. Also, for these mortars, the mercury retained in the extrusion process was high: in this curing condition, the percentage of Hg retained was higher for samples with a large amount of SCBA (75/25 and 60/40), suggesting the importance of the role of SCBA particles in the development of the matrix. This behavior was also found for pastes cured at 20 °C for 270 days (
Table 6). In this case, the total porosity was higher for all tested samples if compared to those found for mortars. In general terms, the total volume of capillary pores (1 μm to 10 nm) was higher for samples containing SCBA particles, and also for the volume of gel pores.
Table 4.
MIP results for mortars cured 3 days at 65 °C.
Table 4.
MIP results for mortars cured 3 days at 65 °C.
| Mixtures | Total porosity (%) | Total pore area (m2/g) | Median pore diameter | Volume (mL of Hg/g of mortar) | Hg retained (%) |
|---|
| Volume (nm) | Area (nm) | >1 μm | 1 μm–50 nm | 50–10 nm | <10 nm |
|---|
| 100/0 | 9.43 | 0.251 | 15,683.0 | 5.8 | 0.0381 | 0.0019 | 0.0001 | 0.0004 | 81.64 |
| 85/15 | 12.58 | 1.918 | 17,706.1 | 7.2 | 0.0517 | 0.0033 | 0.0006 | 0.0032 | 86.53 |
| 75/25 | 9.82 | 2.897 | 7154.3 | 6.9 | 0.0351 | 0.0047 | 0.0008 | 0.0047 | 74.35 |
| 60/40 | 11.30 | 5.321 | 4823.1 | 6.6 | 0.0375 | 0.0070 | 0.0018 | 0.0083 | 70.59 |
Table 5.
MIP results for mortars cured after 270 days at 20 °C.
Table 5.
MIP results for mortars cured after 270 days at 20 °C.
| Mixtures | Total porosity (%) | Total pore area (m2/g) | Median pore diameter | Volume (mL of Hg/g of mortar) | Hg retained (%) |
|---|
| Volume (nm) | Area (nm) | >1 μm | 1 μm–50 nm | 50–10 nm | <10 nm |
|---|
| 100/0 | 6.80 | 2.070 | 10,813.8 | 8.2 | 0.0229 | 0.0024 | 0.0021 | 0.0021 | 71.29 |
| 85/15 | 7.48 | 1.154 | 8835.9 | 8.2 | 0.0278 | 0.0037 | 0.0008 | 0.0017 | 77.57 |
| 75/25 | 7.62 | 1.989 | 6903.3 | 7.3 | 0.0256 | 0.0051 | 0.0010 | 0.0032 | 75.64 |
| 60/40 | 9.61 | 1.535 | 8554.4 | 7.6 | 0.0348 | 0.0064 | 0.0011 | 0.0021 | 84.35 |
Table 6.
MIP results for pastes cured after 270 days at 20 °C.
Table 6.
MIP results for pastes cured after 270 days at 20 °C.
| Mixtures | Total porosity (%) | Total pore area (m2/g) | Median pore diameter | Volume (mL of Hg/g of mortar) | Hg retained (%) |
|---|
| Volume (nm) | Area (nm) | >1 μm | 1 μm–50 nm | 50–10 nm | <10 nm |
|---|
| 100/0 | 8.78 | 1.287 | 7738.9 | 6.4 | 0.0405 | 0.0033 | 0.0001 | 0.0021 | 69.53 |
| 85/15 | 9.69 | 5.713 | 1423.5 | 7.4 | 0.0319 | 0.0127 | 0.0032 | 0.0092 | 74.13 |
| 75/25 | 8.60 | 3.173 | 1933.6 | 6.7 | 0.0339 | 0.0109 | 0.0043 | 0.0048 | 83.97 |
| 60/40 | 12.53 | 3.881 | 1125.6 | 7.7 | 0.0427 | 0.0306 | 0.0030 | 0.0053 | 83.15 |


 and
and 


