3.1. Microstructure of As-Prepared TBCs
The cross-sectional microstructures of as-prepared TBC specimens are shown in
Figure 2, indicating that
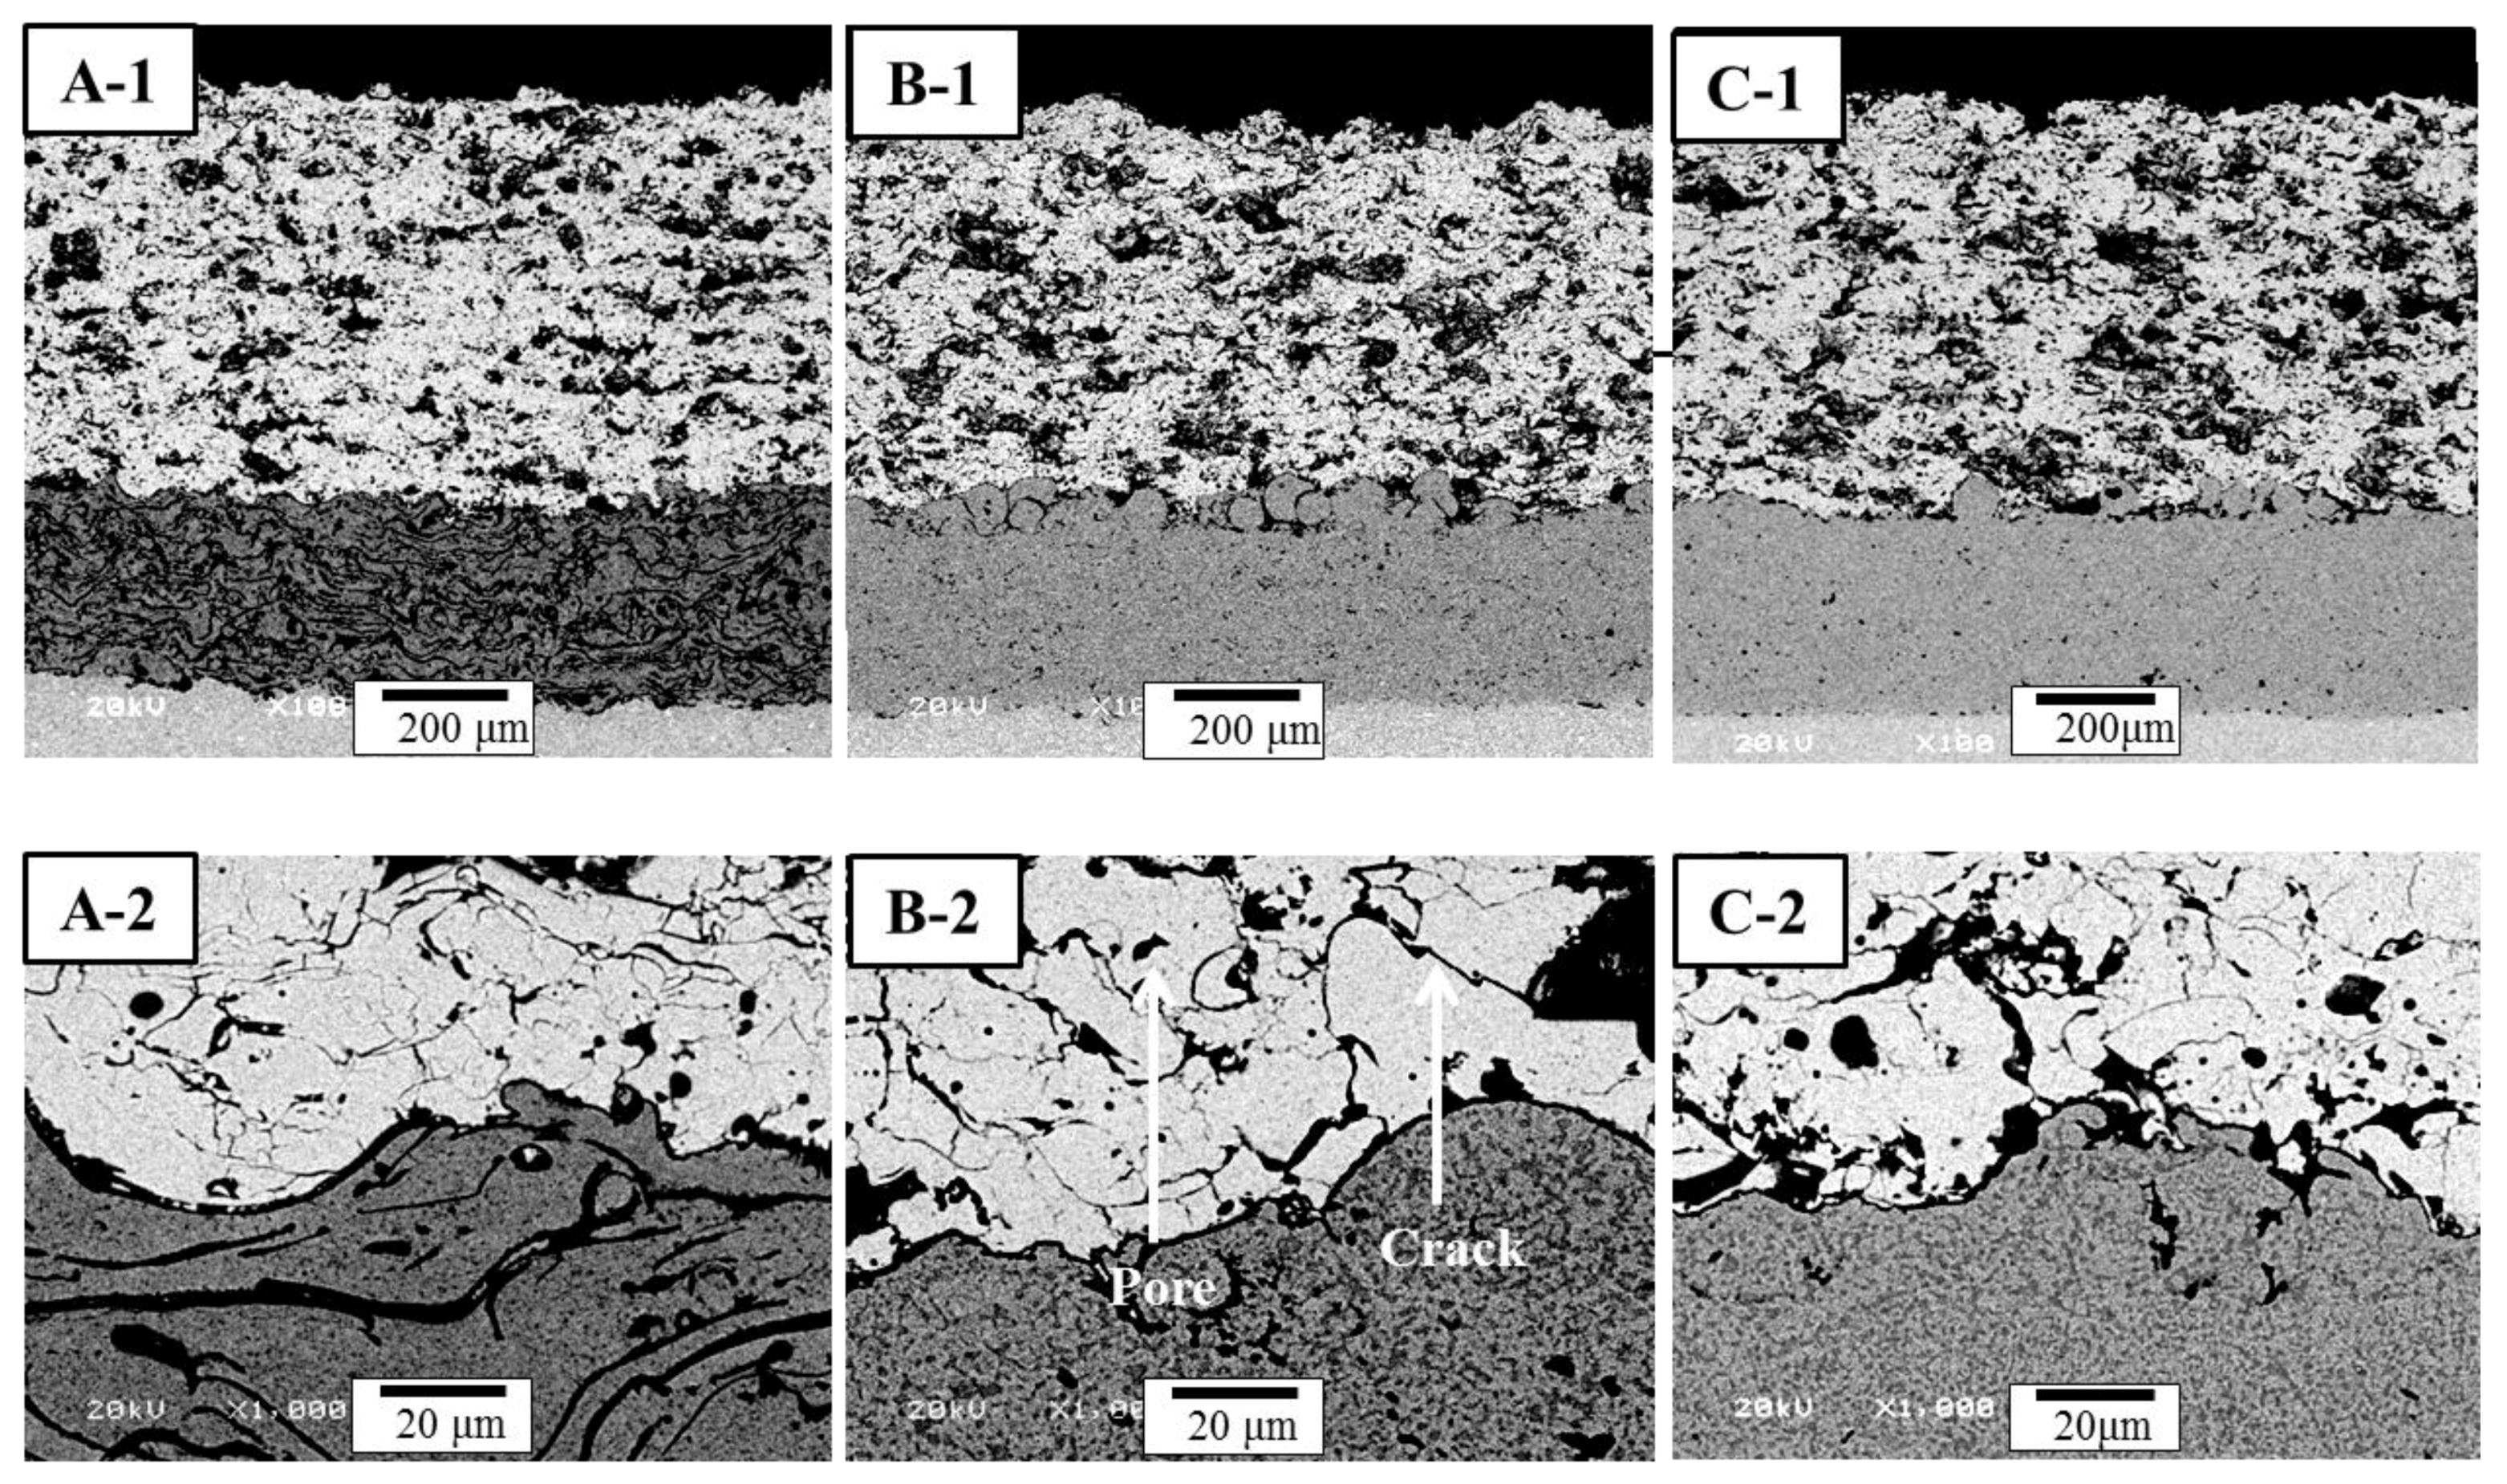
Figure 2(A-1)–(C-1) are the microstructures of the TBCs with different bond coats prepared by the APS, HVOF and LPPS processes, respectively. The top coats prepared by the APS process showed intrinsic defects, such as pores, unmelted particles, and splat boundaries. In the APS process, many small particles are accelerated by the high-power plasma to impinge on the bond coat to form the top coat. The interface microstructures between the top and bond coats of TBCs formed in this study are shown in
Figure 2. The interface of the TBCs (
Figure 2(A-2)–(C-2)) showed irregular shapes at the interface between the top and bond coats, without the formation of a TGO layer and cracking between the top and bond coats. The bond coats prepared by the HVOF and LPPS exhibited similar microstructure with a dense microstructure and no oxide formation, whereas the APS bond coat featured high levels of visible oxides.
Figure 2.
Cross-sectional microstructures of as-prepared thermal barrier coating (TBCs): (A) TBC with air-plasma spray (APS) bond coat; (B) Thermal barrier coating (TBC) with HVOF bond coat; and (C) TBC with low-pressure plasma spray (LPPS) bond coat. Each number indicates the overall and interface microstructures, respectively.
It is well known that the microstructure and roughness of the bond coat are significantly affected by both the composition as well as powder size. In addition, the interface roughness (surface roughness) of the bond coat in turn is one of the most important factors that affect the lifetime of TBC systems [
24,
25]. However, in other study, it was reported that the APS TBC lifetime was independent of average surface roughness [
26]. In this study, the feedstock powders for each bond coat were selected to get an optimal microstructure in each coating process, which were recommended by the manufacturer (Chrome-Alloying Co. Ltd., Hatfield, UK). Even though each TBC system showed a little different interface microstructure in a microscopic viewpoint, the interface structure was much similar with each other in a macroscopic viewpoint. Oxides in the APS bond coat are generally seen as dark, elongated phases that appear as strings in the microstructure, parallel to the substrate. Oxides are produced by particle/atmosphere interaction and/or heating of the coating surface during deposition. Interaction of the hot particles with their surrounding environment, usually air, leads to oxide film on particle surfaces. Longer dwell times and higher particle temperatures increase the thickness of the oxide layer on the particles, producing higher concentrations of oxide stringers within the bond coat [
27].
3.2. Lifetime of TBC Systems
Cross-sectional microstructures of different bond coats deposited by the APS, HVOF, and LPPS are shown in
Figure 3 after the FTF tests for 1429 cycles. After the thermal fatigue tests for 1429 cycles using the FTF apparatus, the interface microstructure of each TBC showed a sound condition without cracking or delamination. The TGO layer was not fully developed after 1429 cycles, because of the relatively short thermal exposure time (5 min) and the lower temperature on the bond coat (the temperature of bottom surface: 350–500 °C), showing a thickness for the TGO layer in the range of 2–3 μm. The interface microstructures were densified owing to resintering during the thermal exposure to 1429 cycles, even though the thermal exposure time was just 119 h. The interface microstructures of each TBC system after the FTF were much similar with each other, compared with the as-prepared TBC.
Figure 3.
Cross-sectional microstructures of TBCs after FTF tests for 1429 cycles: (A) TBC with APS bond coat; (B) TBC with HVOF bond coat; and (C) TBC with LPPS bond coat. Each number indicates the overall and interface microstructures, respectively.
Figure 3.
Cross-sectional microstructures of TBCs after FTF tests for 1429 cycles: (A) TBC with APS bond coat; (B) TBC with HVOF bond coat; and (C) TBC with LPPS bond coat. Each number indicates the overall and interface microstructures, respectively.
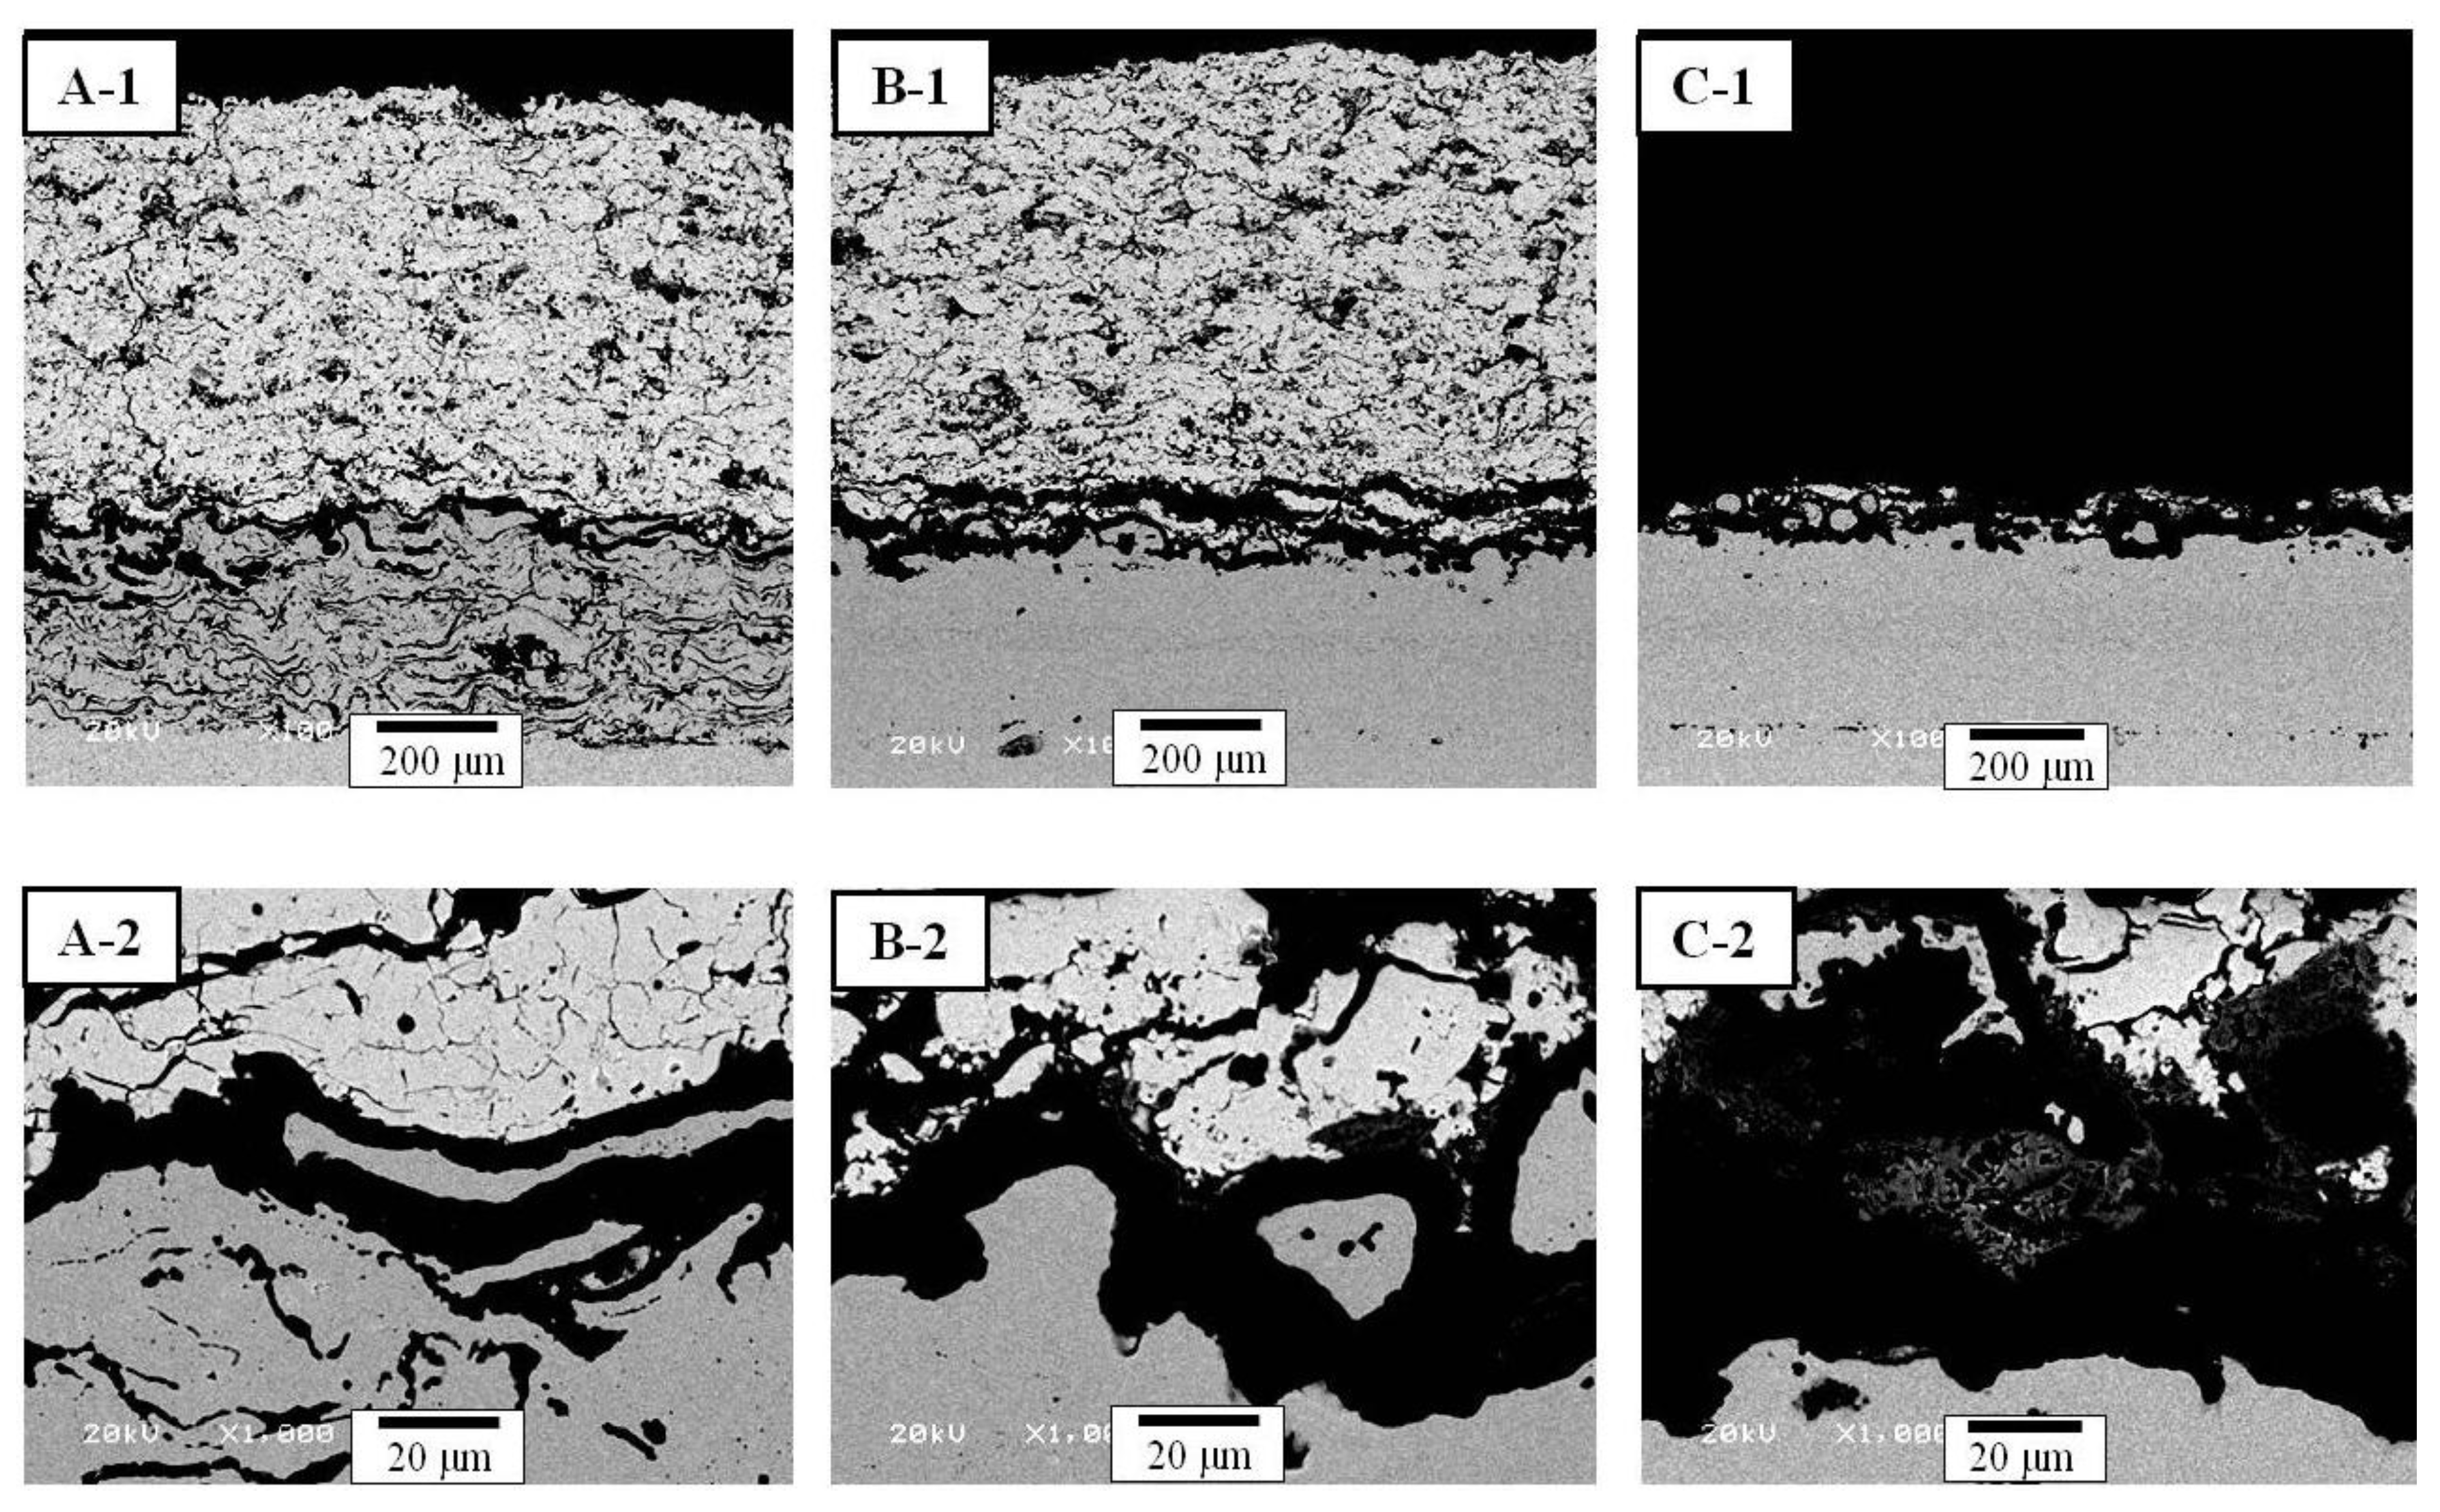
The cross-sectional microstructures of different bond coats deposited by the APS, HVOF, and LPPS processes are shown in
Figure 4 after the CTFT tests. The TBC with the APS bond coat (
Figure 4(A-1)) showed defects, such as the horizontal and vertical cracks, in the top coat, TGO layer at the interface, and oxidation in the bond coat after the CTFF for 1429 cycles. In the case of TBC with the HVOF bond coat (
Figure 4(B-1)), a thick and long crack near the interface between the top coat and TGO layer was newly developed. The TBC with the LPPS bond coat (
Figure 4(C-1)) was delaminated after 780 cycles, but no delamination was observed in other TBCs. The nominal thickness of the TGO layer in the TBC with the APS bond coat (
Figure 4(B-1)) was 10.5 mm, whereas the nominal thickness of the TGO layer was 16.5 mm for the TBC with the HVOF bond coat (
Figure 4(B-2)). The nominal thickness for the TGO layer for the TBC with the LPPS bond coat was 13.3 mm (
Figure 4(C-2)), after delaminating at 780 cycles. The oxidation of the bond coat leads to a change in sign of stresses due to the smaller coefficient of thermal expansion (CTE) of the TGO layer. It is assumed that small cracks formed in the regions of initial tensile stress at the peak tips before and grow into the valleys after stress conversion [
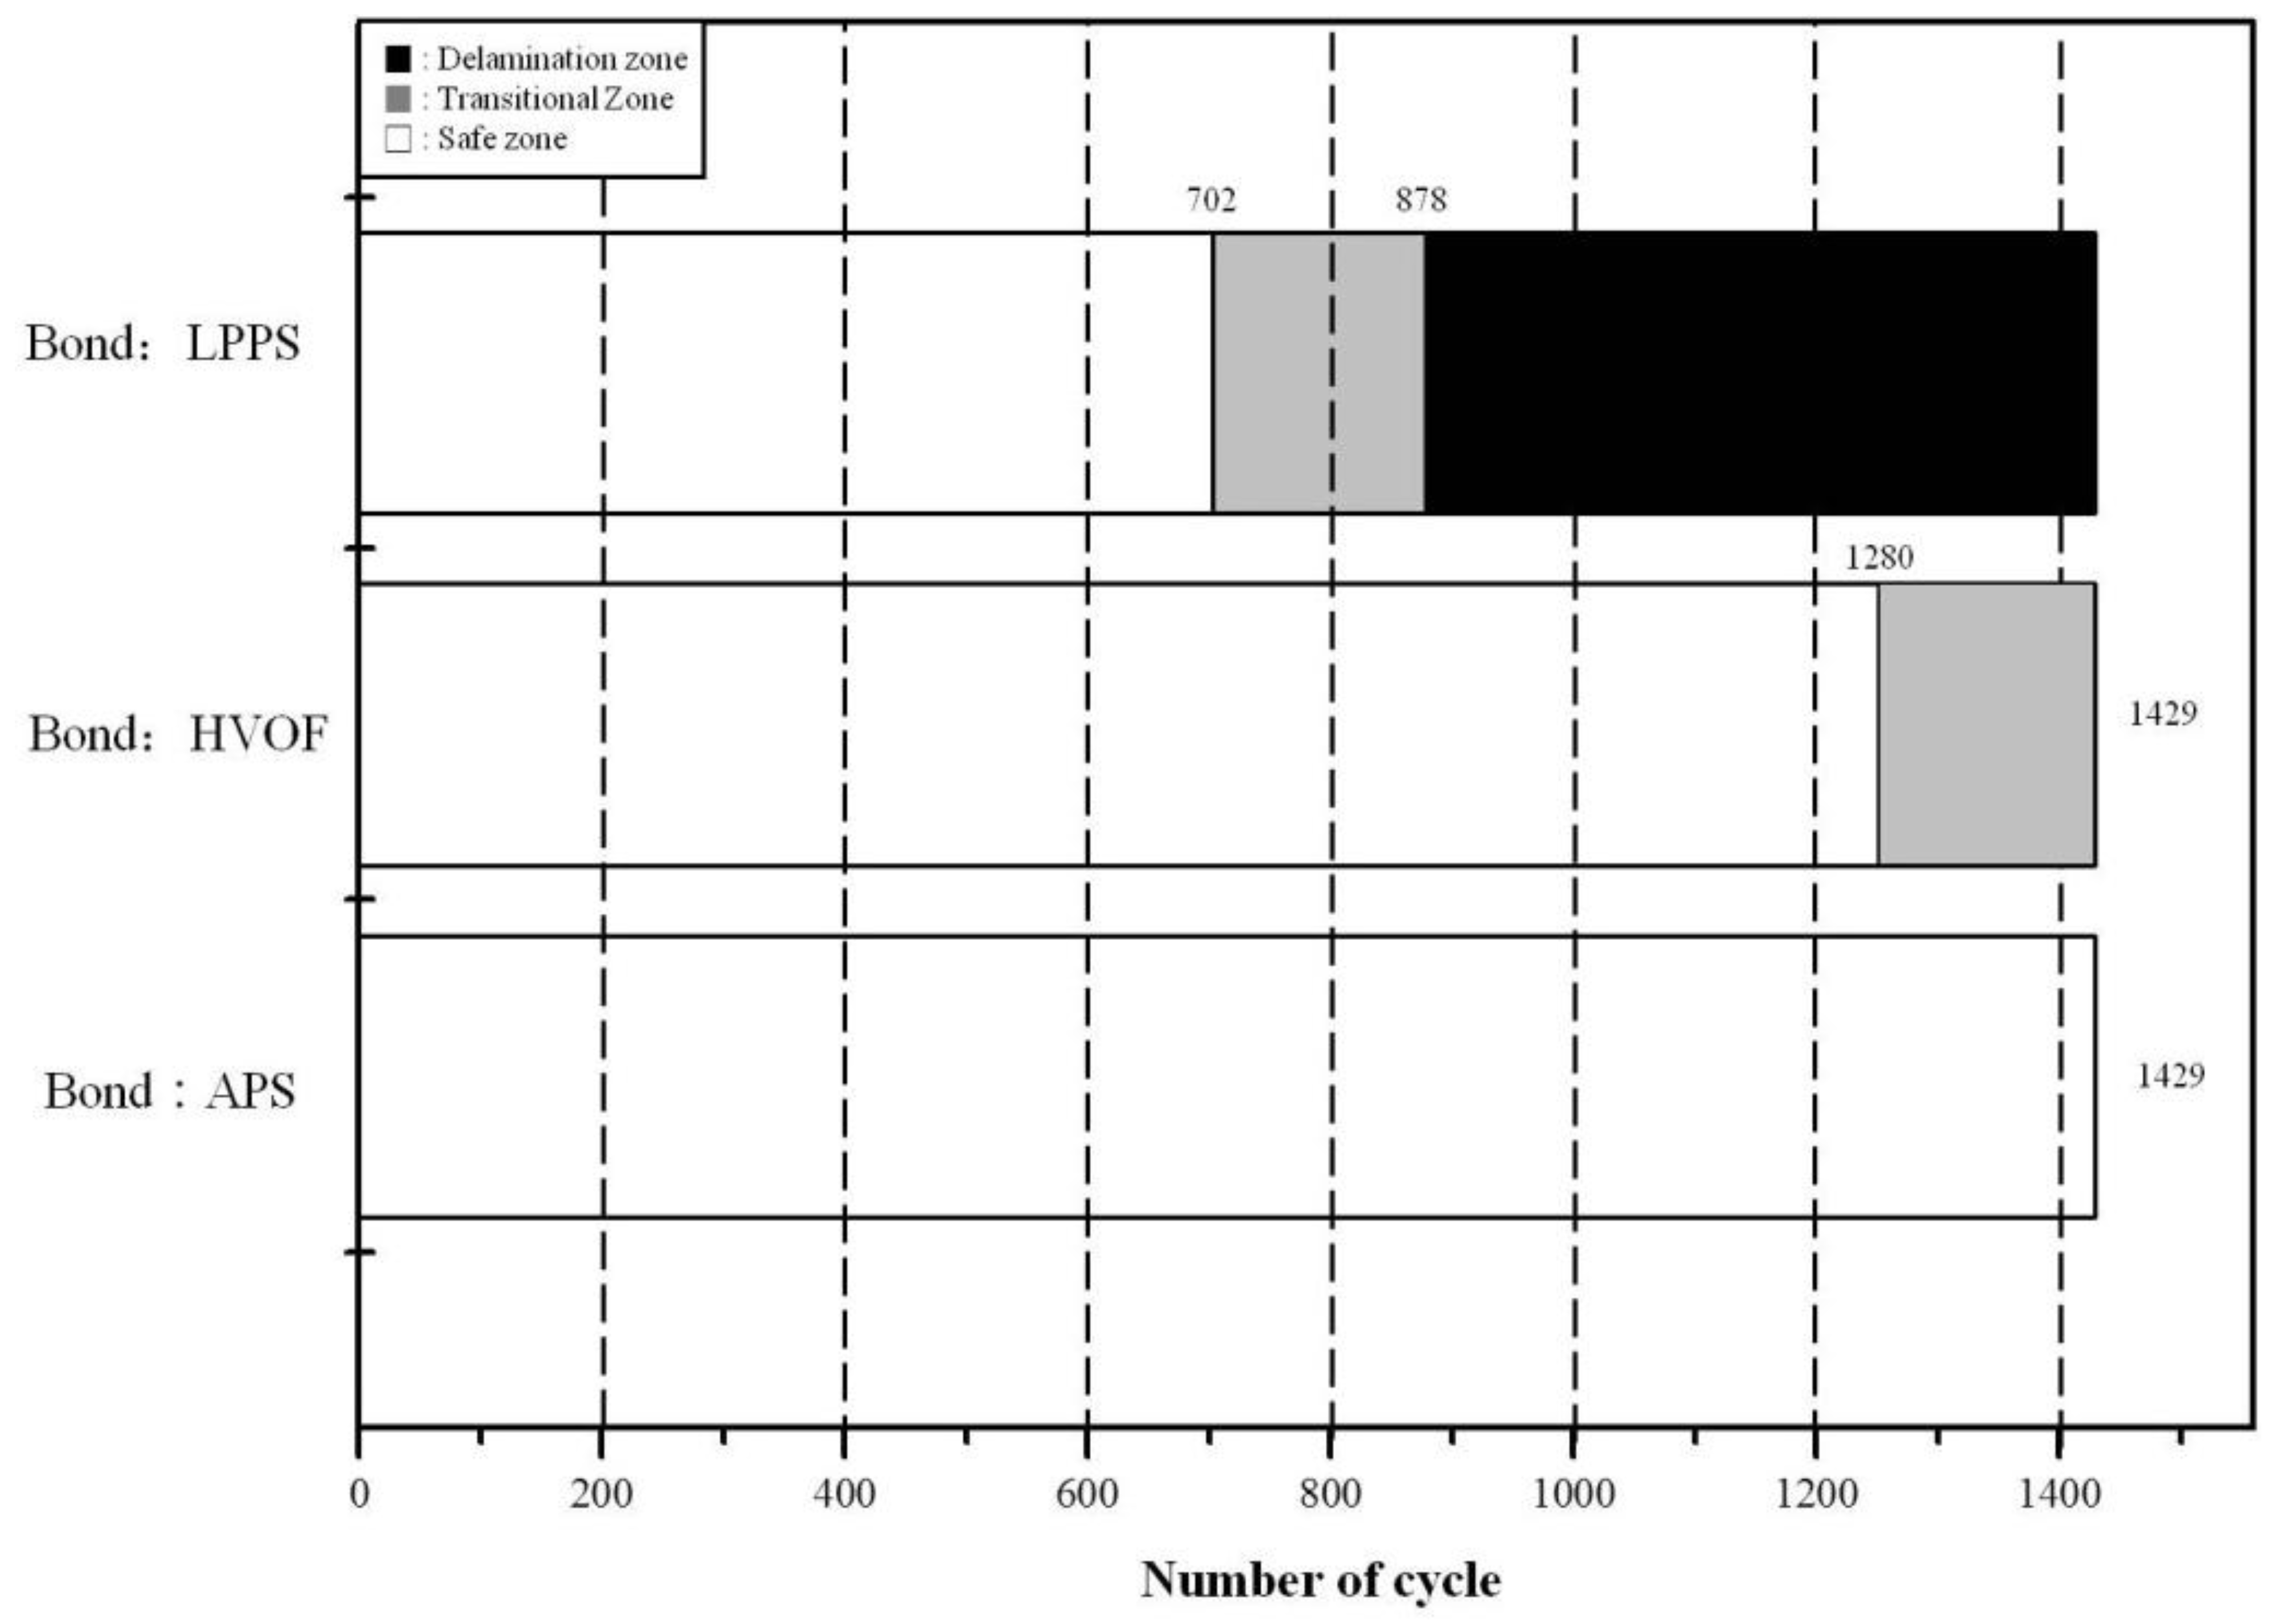
28].The lifetime of different bond coats deposited by the APS, HVOF, and LPPS processes is shown in
Figure 5 after the CTFT tests. The result indicates that the structural effectiveness is one of important factors for thermal durability of TBC system.
Figure 4.
Cross-sectional microstructures of TBCs after CFTF tests: (A) TBC with APS bond coat; (B) TBC with HVOF bond coat; and (C) TBC with LPPS bond coat. Each number indicates the overall and interface microstructures, respectively.
Figure 4.
Cross-sectional microstructures of TBCs after CFTF tests: (A) TBC with APS bond coat; (B) TBC with HVOF bond coat; and (C) TBC with LPPS bond coat. Each number indicates the overall and interface microstructures, respectively.
Figure 5.
The lifetime of TBCs with different bond coats after CFTF tests as a function of cycle number.
Figure 5.
The lifetime of TBCs with different bond coats after CFTF tests as a function of cycle number.
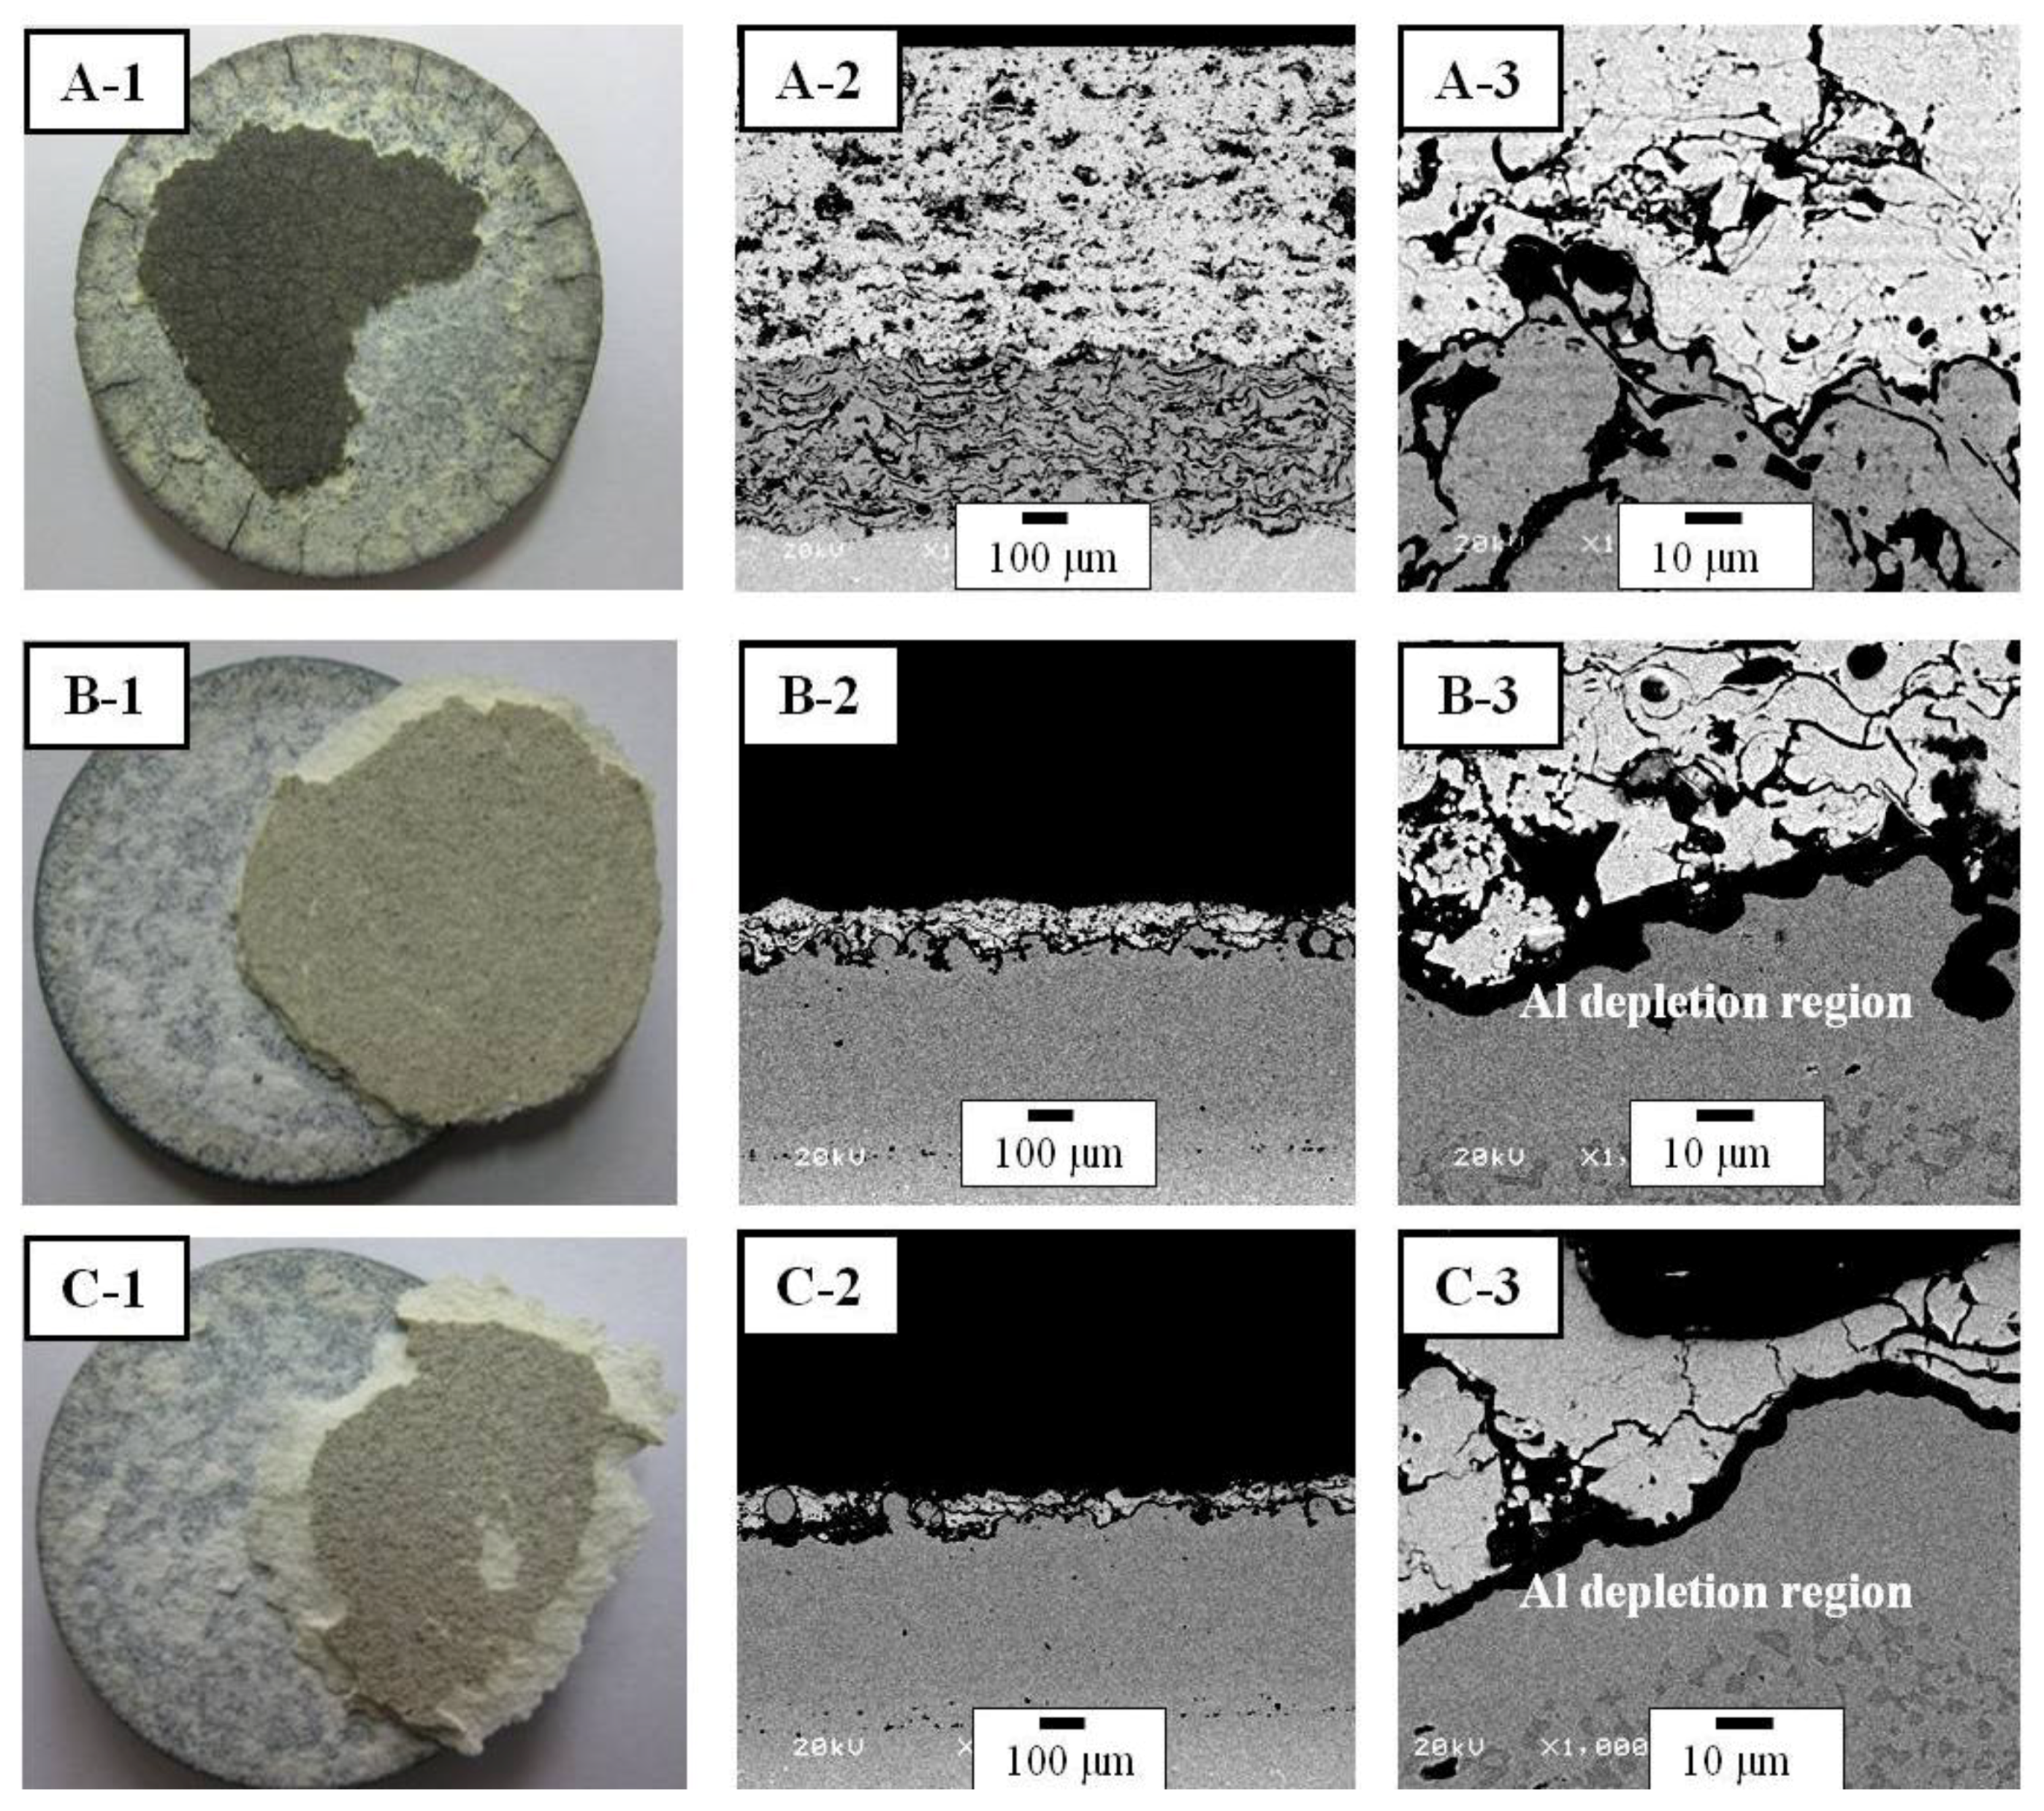
The surface micrographs and cross-sectional microstructures of TBCs after the TS tests are shown in
Figure 6. The surface micrographs showed a delamination of spalling mode at the interface between the bond and top coats. This may be due to the large temperature difference between the substrate and the top coat surface during the quenching and annealing processes. The temperature difference causes thermal stresses at the interface of the bond and top coats. The mismatch in the CTEs between the top and bond coats or oxidation of the bond coat leads to delamination and failure. The TBCs with the APS bond coat were delaminated in the range of 145–159 cycles, whereas the TBCs with the HVOF bond coat were delaminated after 30–36 cycles. In addition, the TBCs with the LPPS bond coat were delaminated after 42–46 cycles. In the TBCs with the APS bond coat, the radial cracks were created from the edge of specimens due to the relatively higher number of cycles. The TBCs with the bond coats by the HVOF and LPPS showed the Al depletion region between the bond and top coats. Usually the depletion of Al in the bond coat after oxidation was about 6 wt % for the VPS bond coat and about 4 wt % for the APS bond coat at TBC failure, indicating that the lifetime of TBCs with the APS bond coat was superior to that of TBCs with the VPS bond coat [
26]. The result of previous study is in agreement with our results of the CFTF and TF.
Figure 6.
Surface micrographs and cross-sectional microstructures of TBCs after TS tests: (A) TBC with APS bond coat; (B) TBC with HVOF bond coat; and (C) TBC with LPPS bond coat. Each number indicates surface micrographs, cross-sectional interface microstructures between the top and bond coats, and high magnification interface microstructures, respectively.
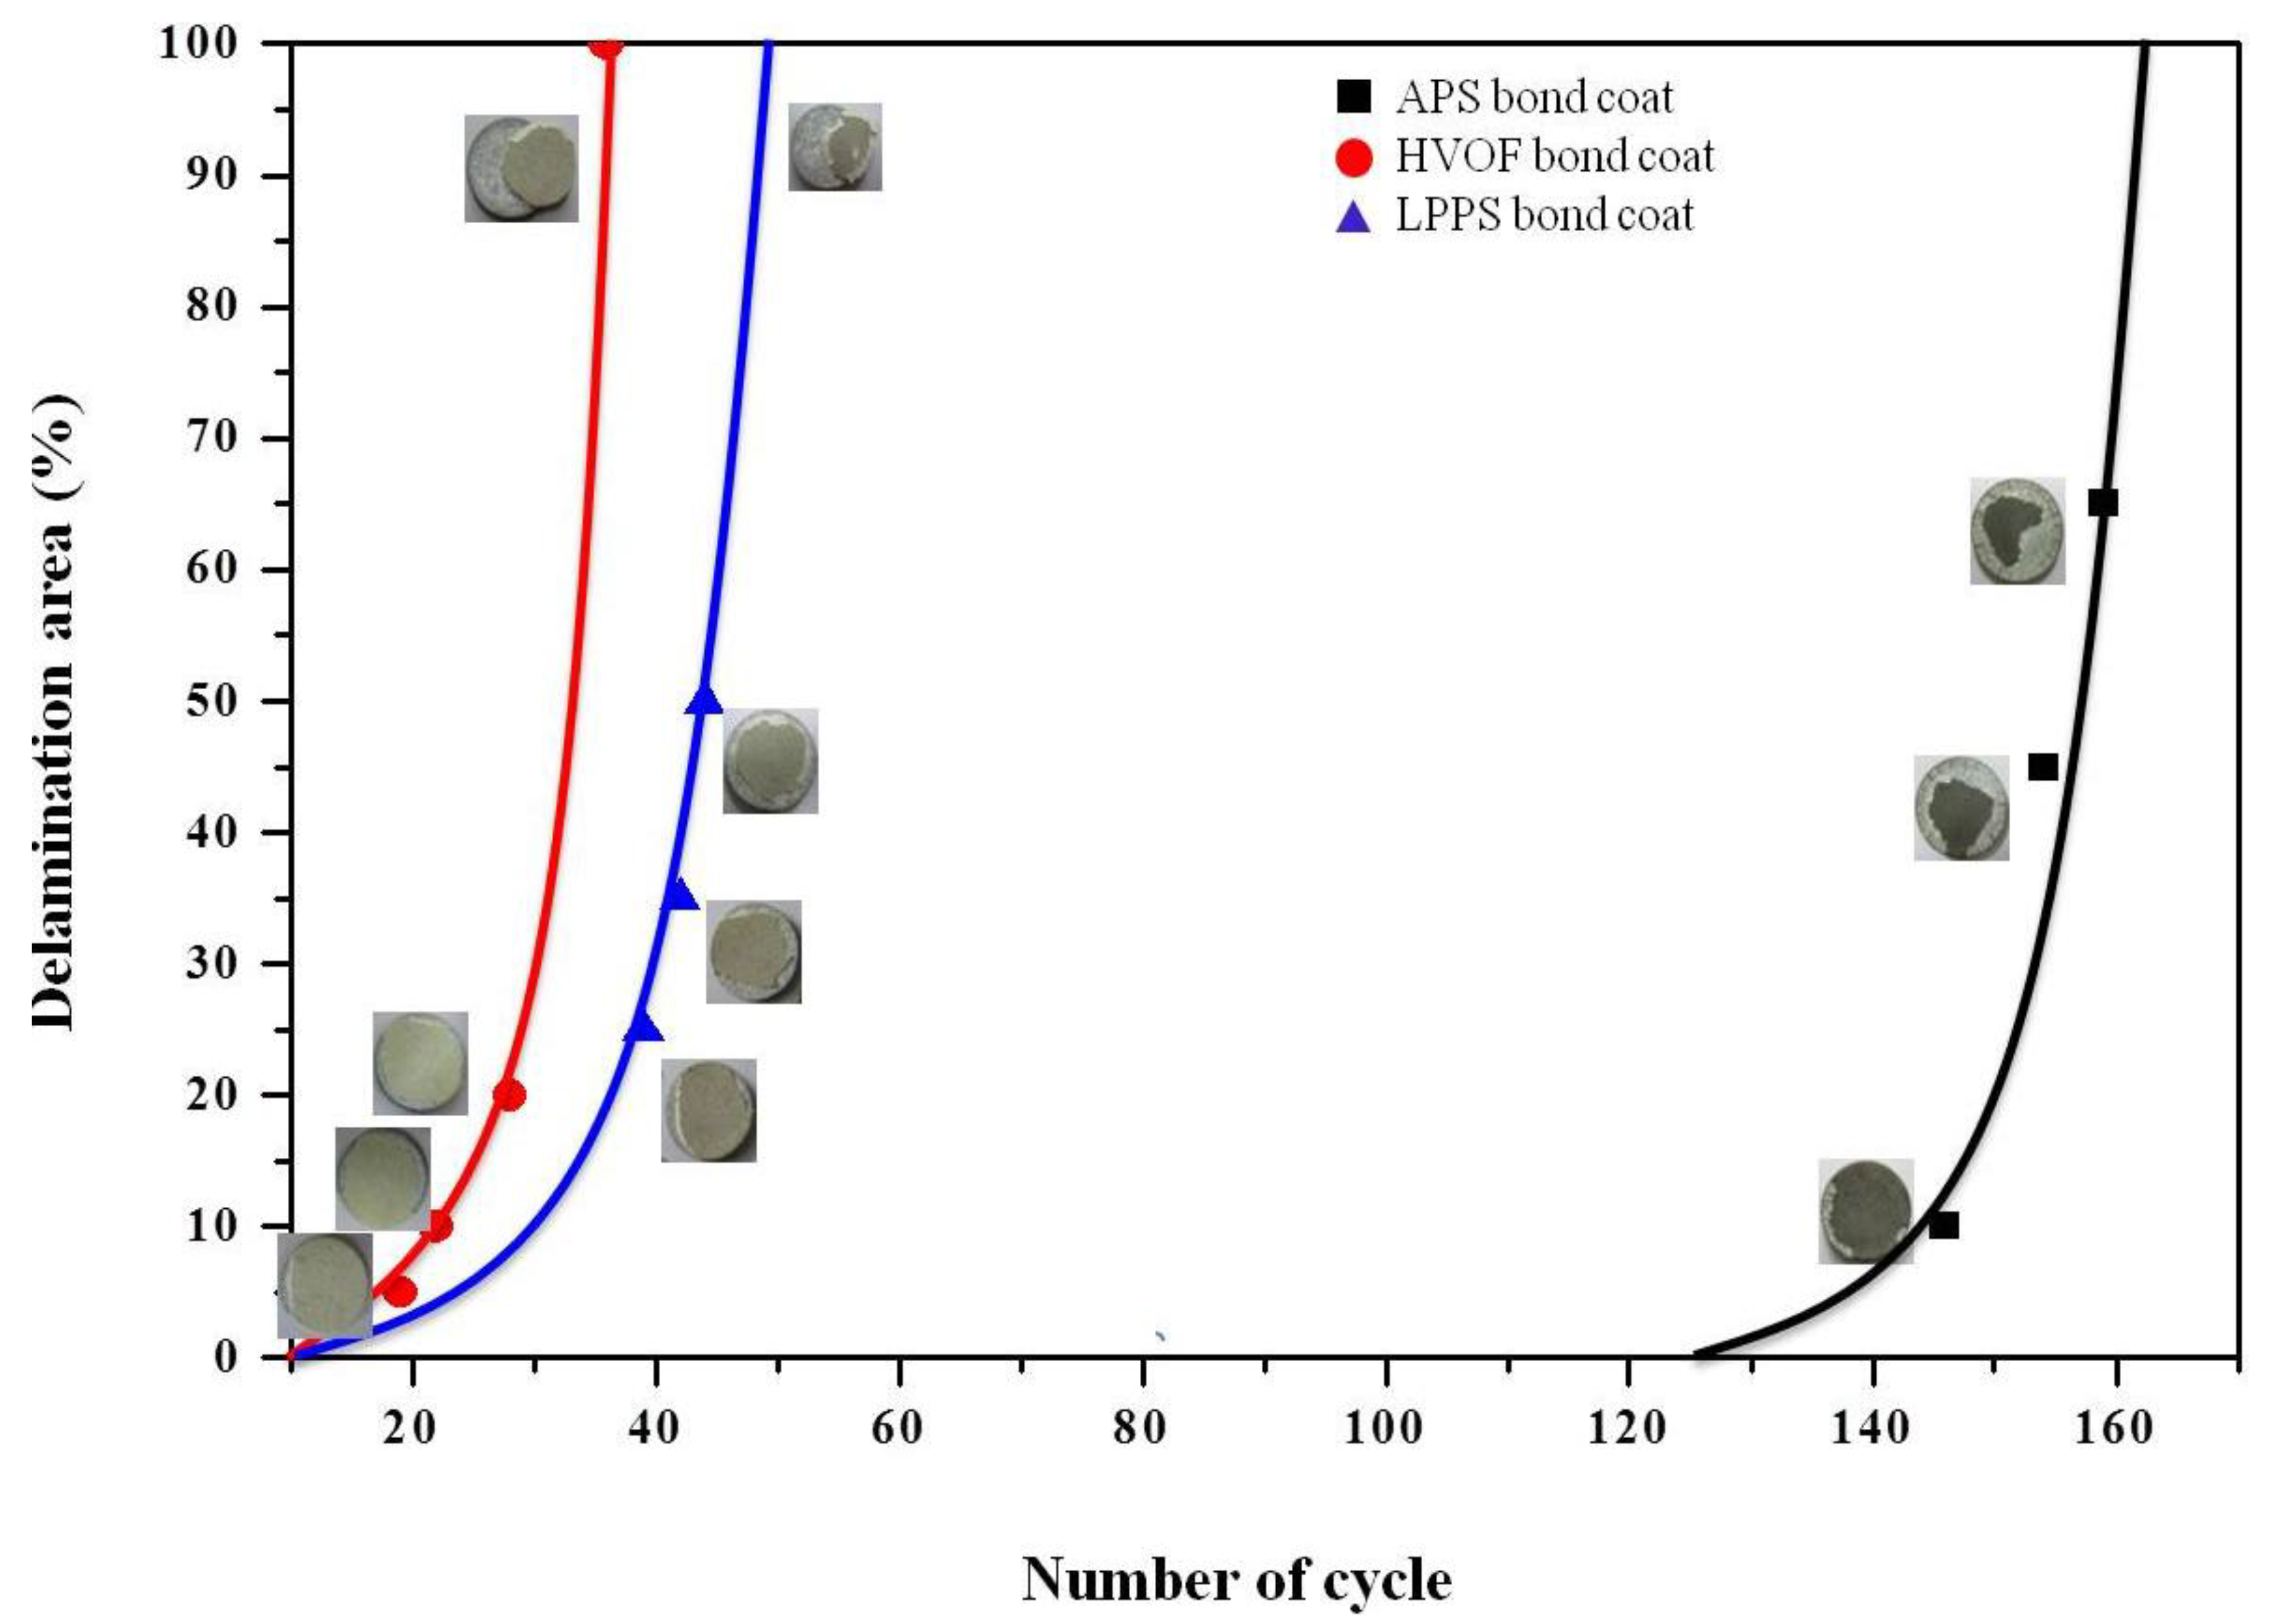
Evolution of the delamination area during the TS tests is shown in
Figure 7 as a function of cycle number. The TBC with the APS bond coat started to be delaminated after 130 cycles, where the delamination area was only 5%. After 155 cycles, the TBC was delaminated more than 60%. However, the TBC with the APS bond coat was not completely delaminated. The TBC with the HVOF bond coat started to be delaminated after 18 cycles, where the area of delamination was 10%. After 36 cycles, the top coat was completely delaminated. In the case of the TBC with the LPPS bond coat, the delamination started to occur after 40 thermal cycles, which was completed after 52 cycles. In all cases, the top coats were delaminated more that 50% in the range of 10–25 cycles after starting to delaminate, meaning that control of the initial delamination is more important in enhancing the lifetime performance of TBCs. The lifetime of TBCs with different bond coats after the thermal fatigue and thermal-shock tests are shown in
Table 1.
Figure 7.
Variation of delamination area with thermal fatigue cycle in thermal-shock tests. The solid curves are empirical data fits.
Figure 7.
Variation of delamination area with thermal fatigue cycle in thermal-shock tests. The solid curves are empirical data fits.
Table 1.
The lifetime of thermal barrier coating (TBCs) with different bond coats after the thermal fatigue and thermal-shock tests.
Table 1.
The lifetime of thermal barrier coating (TBCs) with different bond coats after the thermal fatigue and thermal-shock tests.
| Test species | ASP bond coat | HVOF bond coat | LPPS bond coat |
|---|
| Cyclic furnace thermal fatigue (CFTF) | 1429 cycles | 1429 cycles | 1429 cycles |
| Flame thermal fatigue (FTF) | 1429 cycles | 1000~1429 cycles | 780 cycles |
| Thermal shock test (TS) | 159 cycles | 36 cycles | 46 cycles |
3.3. Phase Analysis and TGO after Thermal Exposure
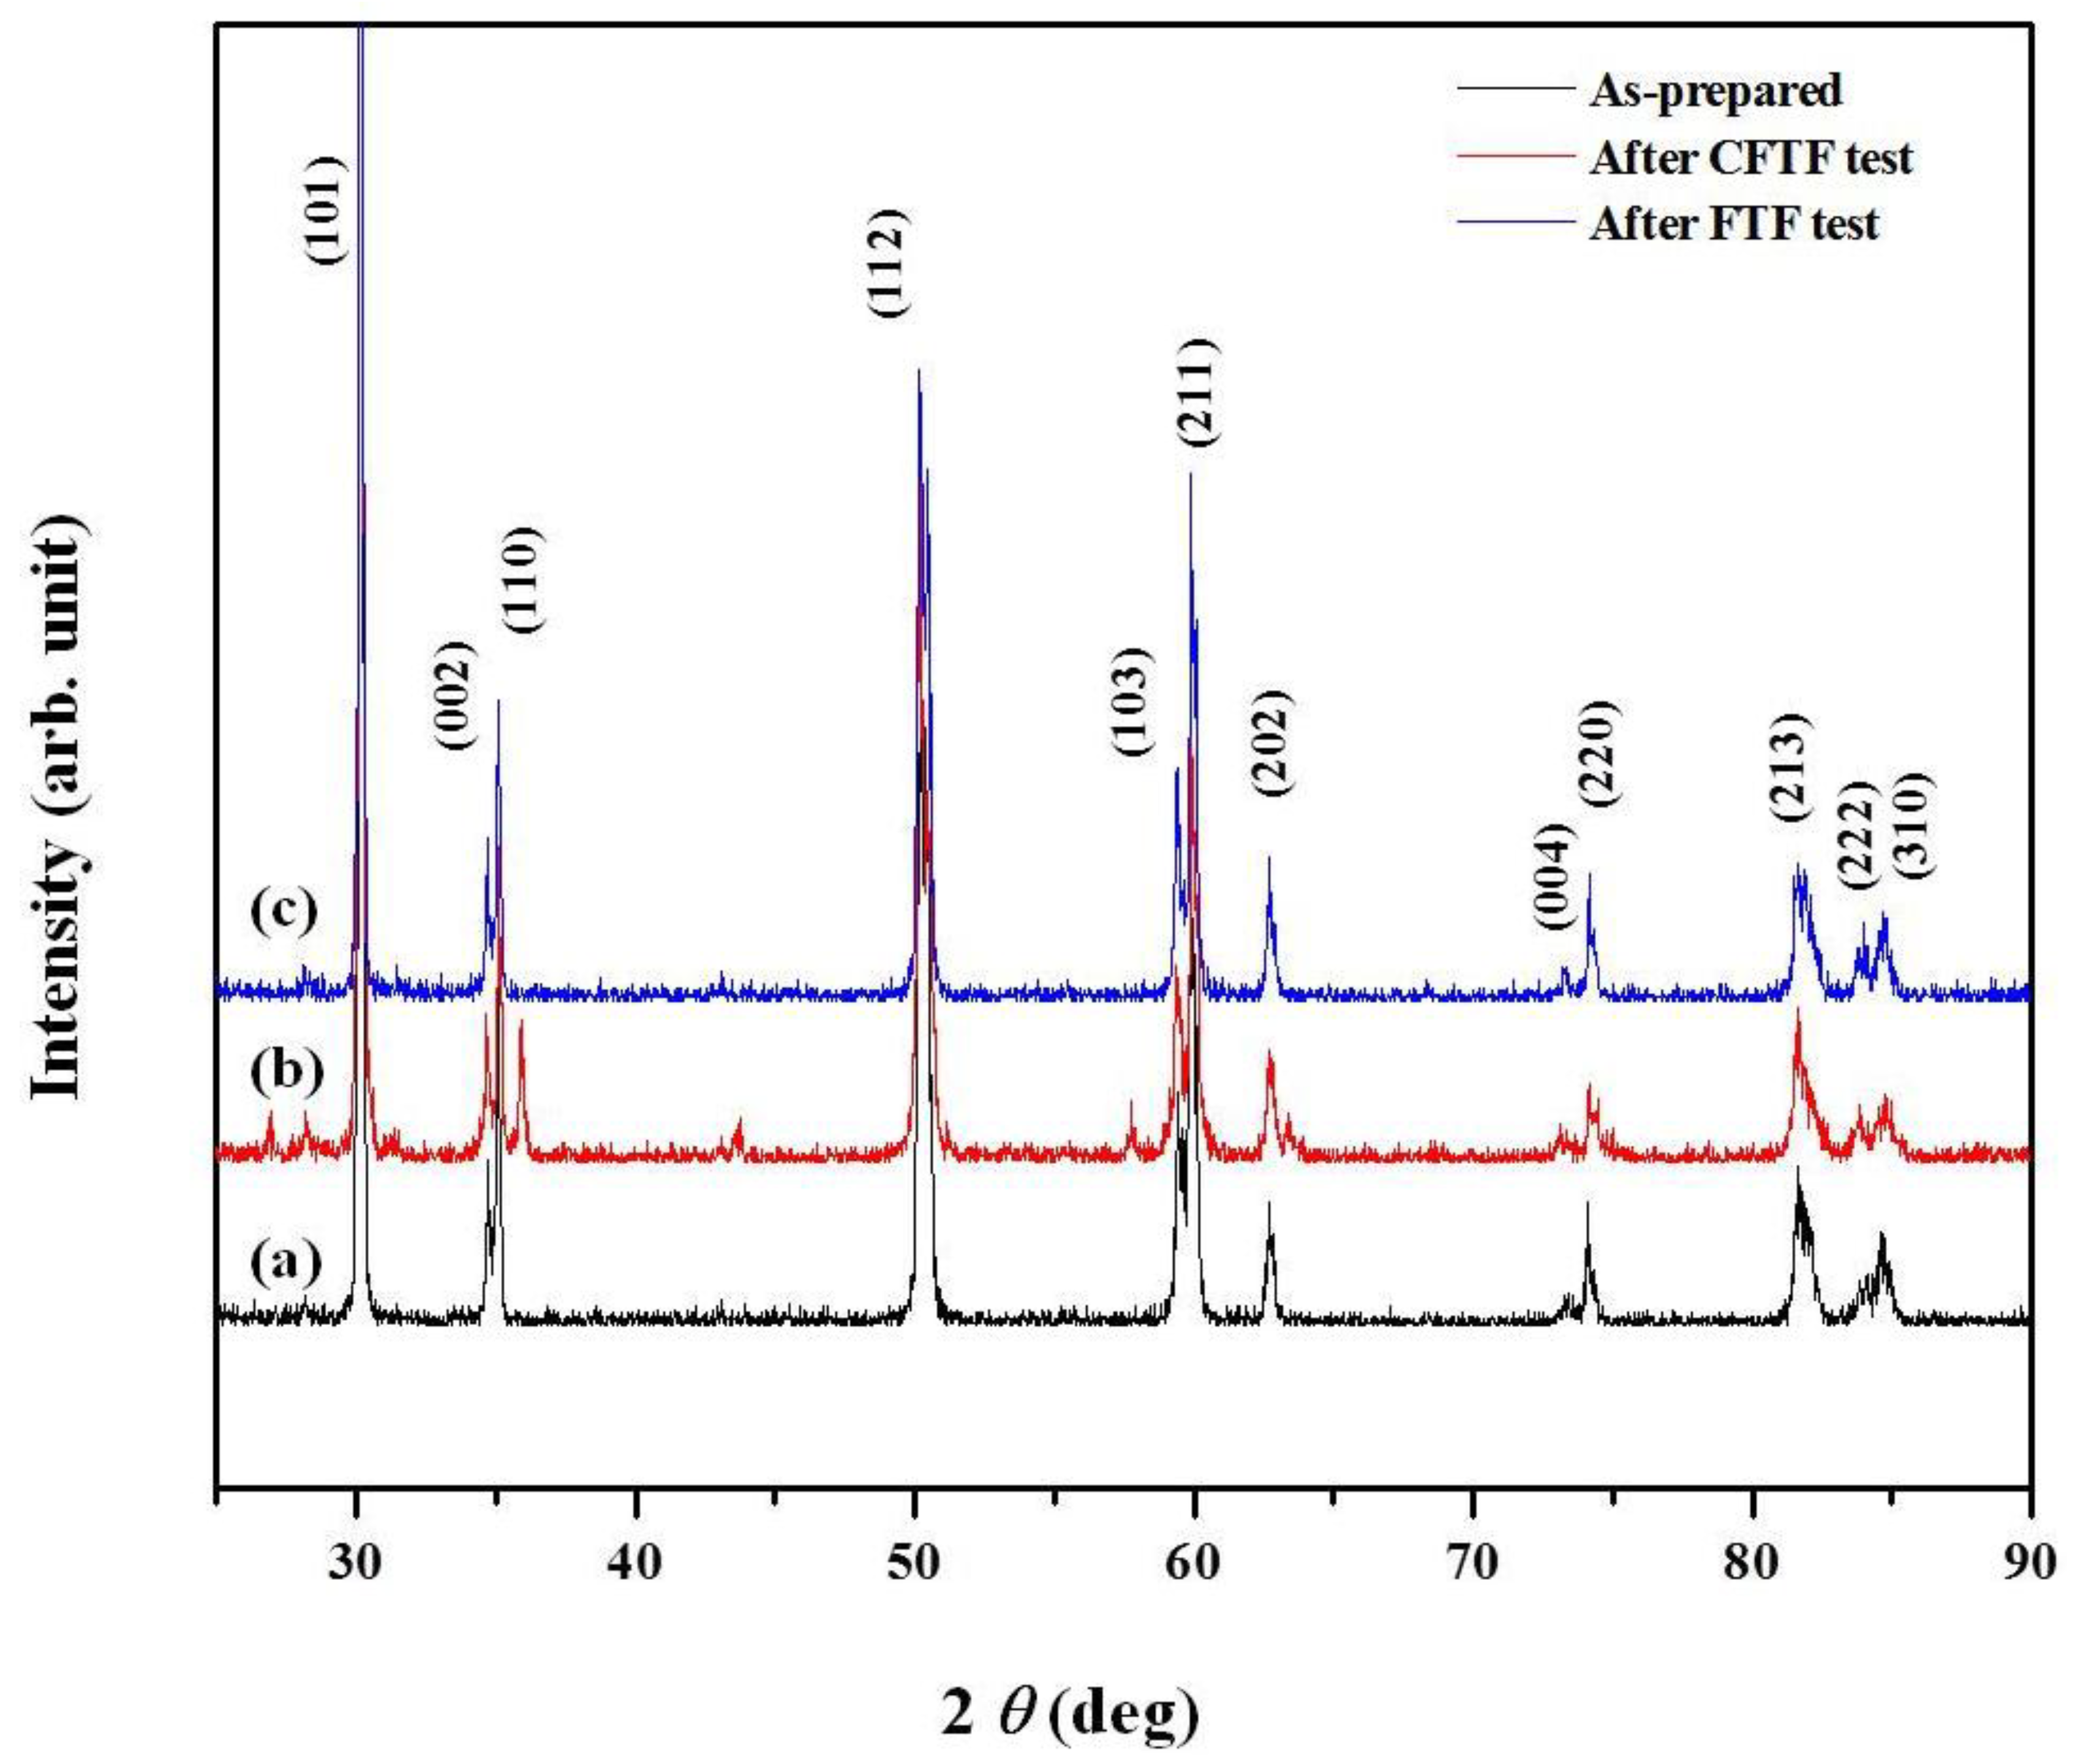
X-ray diffraction (XRD) patterns were investigated to confirm the phase identification of the TBCs before and after the tests as shown in
Figure 8. All of the peaks were tetragonal and cubic phases without any monoclinic phase before and after thermal exposure. Any phase transformation causing cracks and defects in the TBC was not observed after all tests performed in this study. It is important to suppress the monoclinic phase to enhance the thermal stability. It was verified that the TBCs prepared in this work was not affected by any phase transformation.
Figure 8.
X-ray diffraction (XRD) pattern of TBCs of as-prepared and after cyclic thermal exposure.
Figure 8.
X-ray diffraction (XRD) pattern of TBCs of as-prepared and after cyclic thermal exposure.
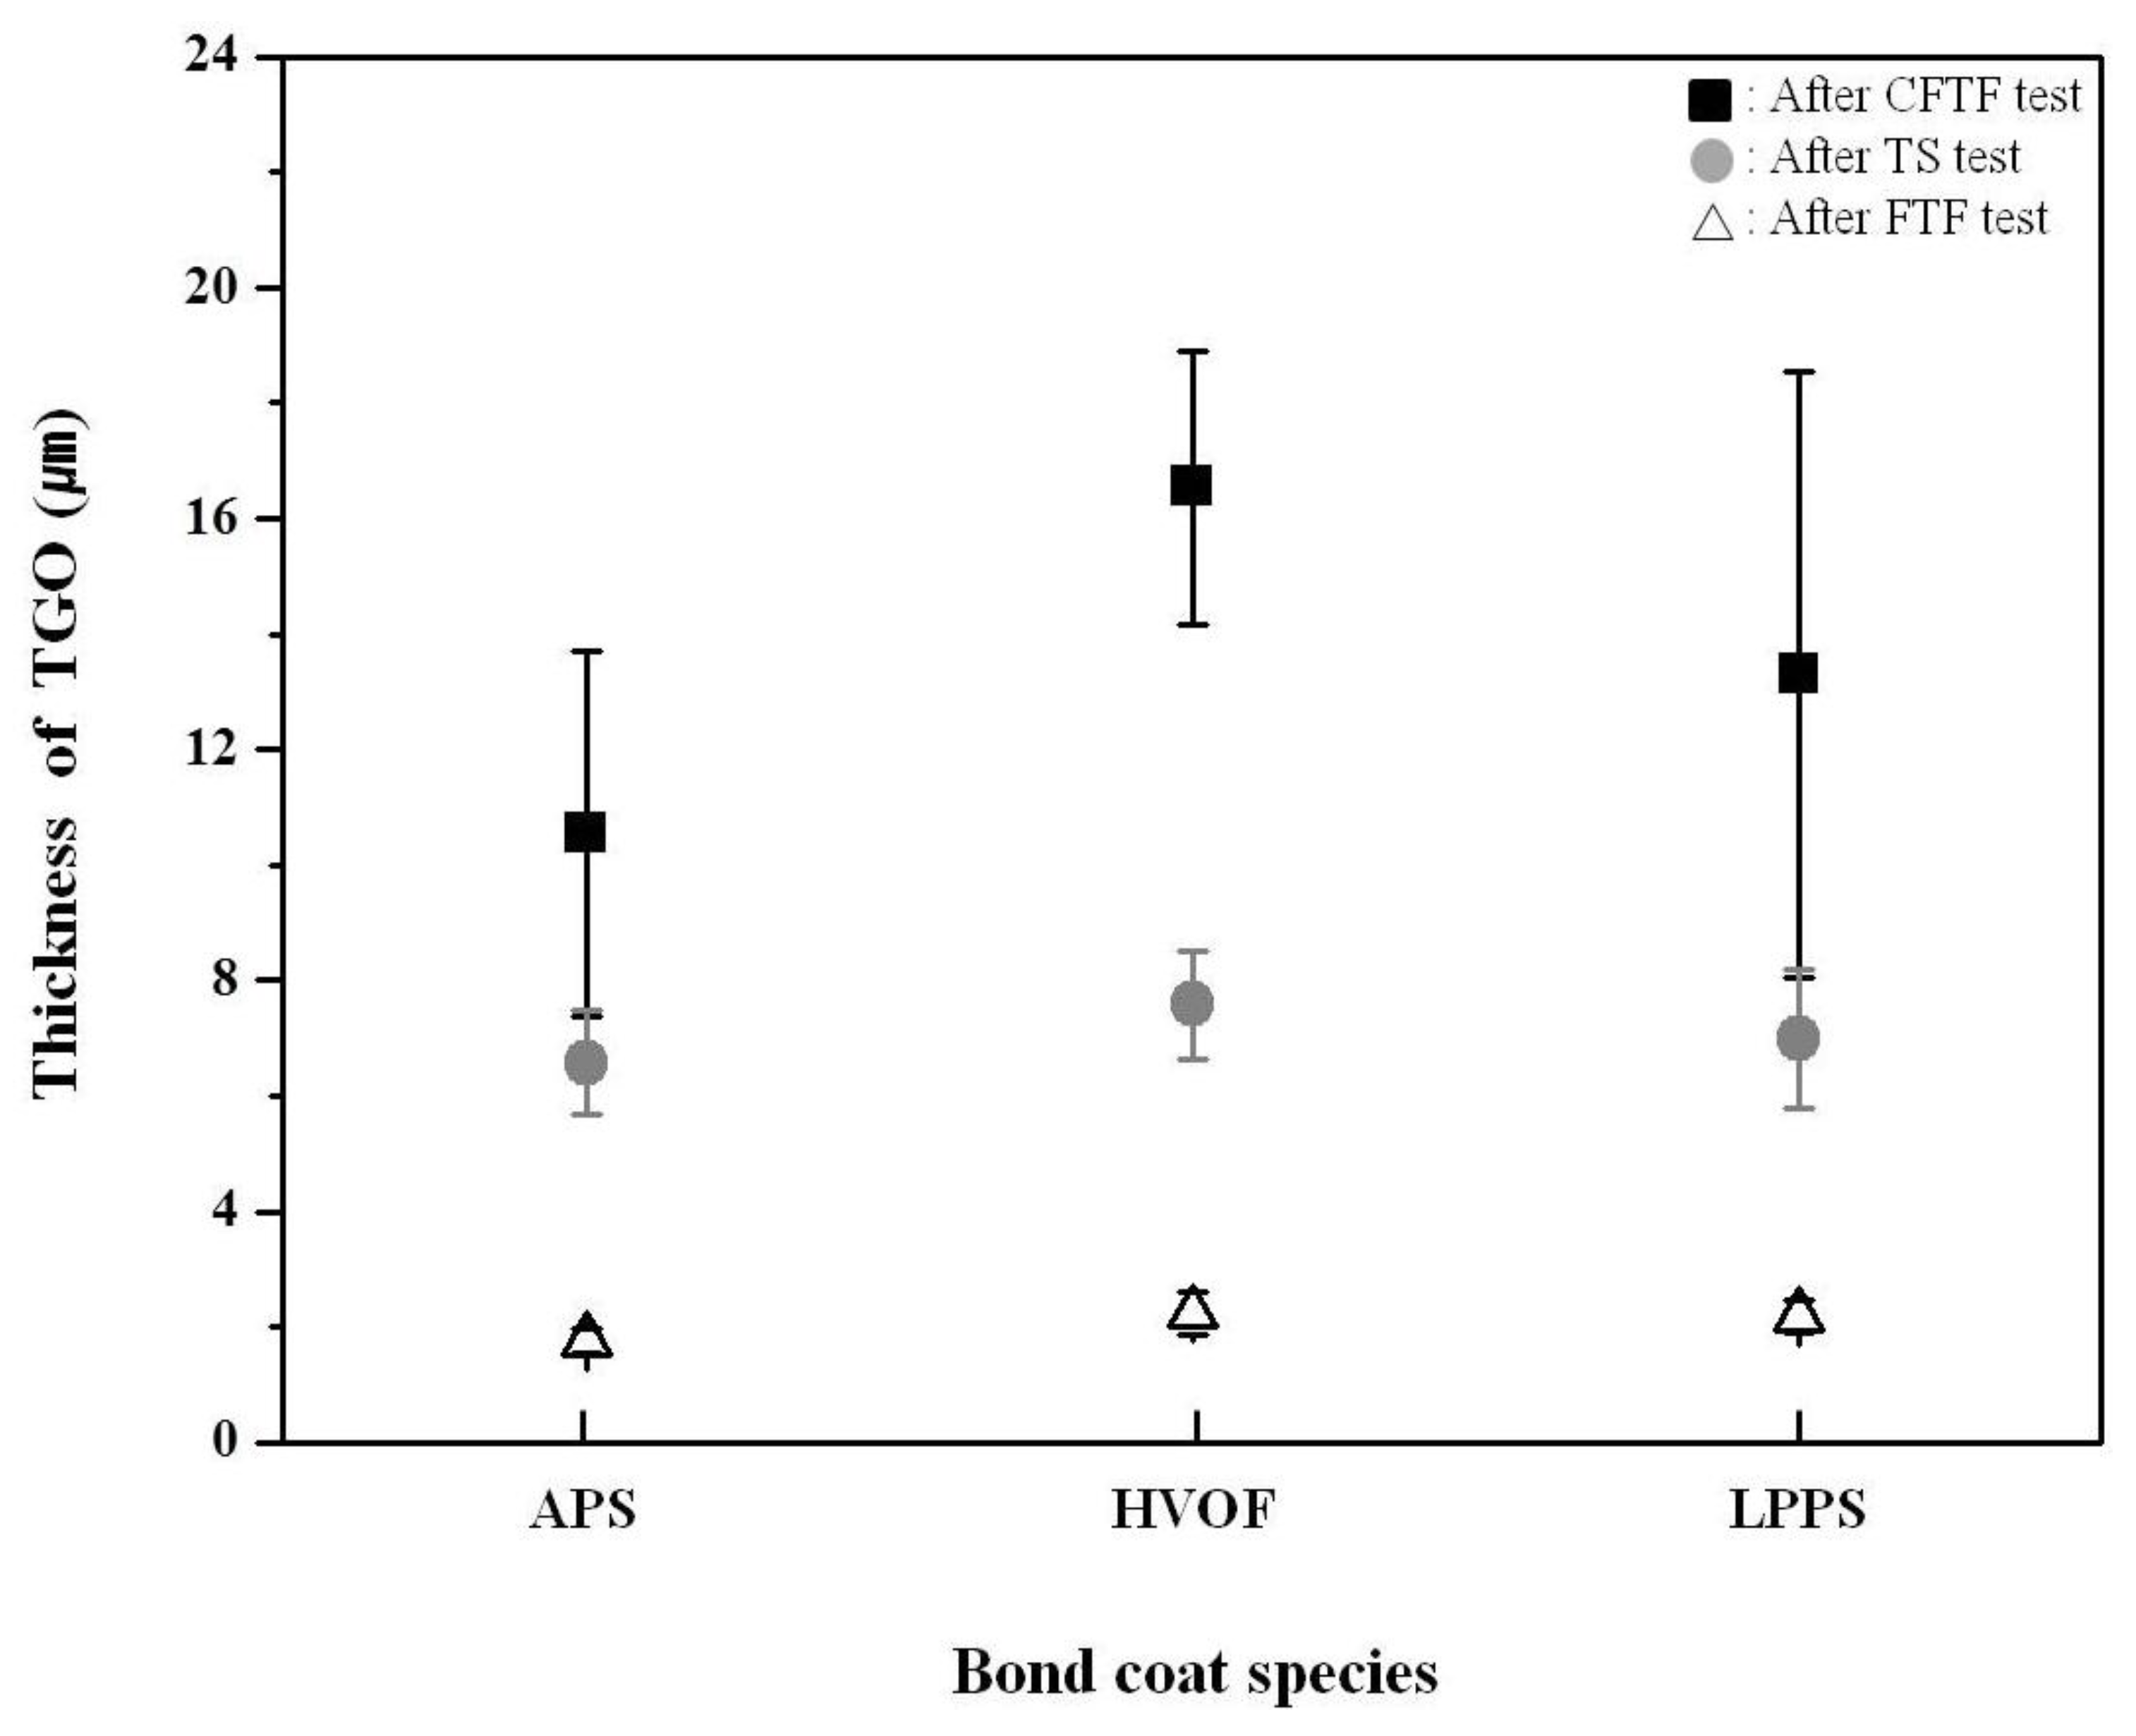
The thickness of the TGO layer for the three TBC systems after each test are shown in
Figure 9. After the FTF tests, the TGO layer was not fully developed after 1429 cycles, owing to the relatively short thermal exposure time (119 h), showing nominal thicknesses of the APS, HVOF, and LPPS specimens as 1.8, 2.2, and 2.3 μm, respectively. The TBCs with the bond coats prepared by the APS and HVOF processes showed nominal thicknesses of the TGO layer as 10.5 and 16.5 μm, respectively, after the CFTF tests for 1429 cycles. In the case of the TBC with the LPPS bond coat, the nominal thickness of the TGO layer was 13.3 μm after the CTFT tests at TBC delamination (780 cycles). The difference in the thickness of the TGO layer between the FTF and CFTF tests was due to different thermal exposure times and the temperature of bottom surface. If the exposure time is increased at higher temperature, the thickness of the TGO layer would be increased in a certain cycles. Also, the temperature of bottom surface affects the growth of the TGO layer, resulting in a thicker thickness of TGO layer at higher temperature. After the TS tests, the thickness of the TGO layer did not show a difference with bond coat species in the FTF tests, showing nominal thicknesses of 6.6, 7.6, and 7.0 μm, for the APS, HVOF, and LPPS, respectively.
Figure 9.
Thickness of thermally grown oxide (TGO) layer with bond coat species after different thermal exposure tests. Black, gray, and white marks indicate the TGO thickness values after the CFTF, TS, and FTF tests, respectively.
Figure 9.
Thickness of thermally grown oxide (TGO) layer with bond coat species after different thermal exposure tests. Black, gray, and white marks indicate the TGO thickness values after the CFTF, TS, and FTF tests, respectively.
3.4. Mechanical Properties
The hardness values of the top coats before and after thermal exposure were measured using a Vickers indentation method (
Figure 10). The indentation tests were conducted on the sectional plane with a load of 3 N at room temperature. The hardness values of the top coats in the as-prepared TBCs were determined to be 3.45 ± 0.23 GPa (mean ± standard deviation). After the FTF tests for 1429 cycles, the hardness values of the top coats were increased to 4.01 ± 0.29, 3.92 ± 0.35, and 3.83 ± 0.27 GPa for the bond coats prepared by the APS, HVOF, and LPPS processes, respectively. The increase in the hardness values after thermal exposure was due to the reduction of pores and defects [
29,
30], which is in good agreement with the microstructural evolution in
Figure 2,
Figure 3 and
Figure 4. The microstructural evolution of the top coat prepared by the APS was more advanced, resulting in the disappearance of the pores and splat boundaries. The TBCs with the bond coats prepared by the APS and HVOF processes showed hardness values of 5.40 ± 0.25 and 4.90 ± 0.32 GPa, respectively, after the CTFT tests for 1429 cycles. The TBC with the LPPS bond coat was delaminated after the ETF tests for 780 cycles and hence there was no hardness value. After the TS tests, all of the TBCs were delaminated at the interface between the top and bond coat, therefore there was no hardness value in the top coat. The hardness values of the bond coats before and after the thermal exposure tests are shown in
Figure 11. In the bond coats, the hardness values were modestly decreased, independent of bond coat species, compared with those of as-prepared bond coats. This result agrees with that of previous investigation [
29,
30]
Figure 10.
Hardness values of top coats before and after cyclic thermal exposure. Indentation for hardness was conducted on the sectional plane with a load of 3 N. The nominal value of as-prepared TBC was indicated inside figure. Filled and open marks indicate the hardness values after the CFTF and ETF tests, respectively.
Figure 11.
Hardness values of bond coats before and after cyclic thermal exposure. Indentation for hardness was conducted on the sectional plane at 3 N.
Figure 11.
Hardness values of bond coats before and after cyclic thermal exposure. Indentation for hardness was conducted on the sectional plane at 3 N.
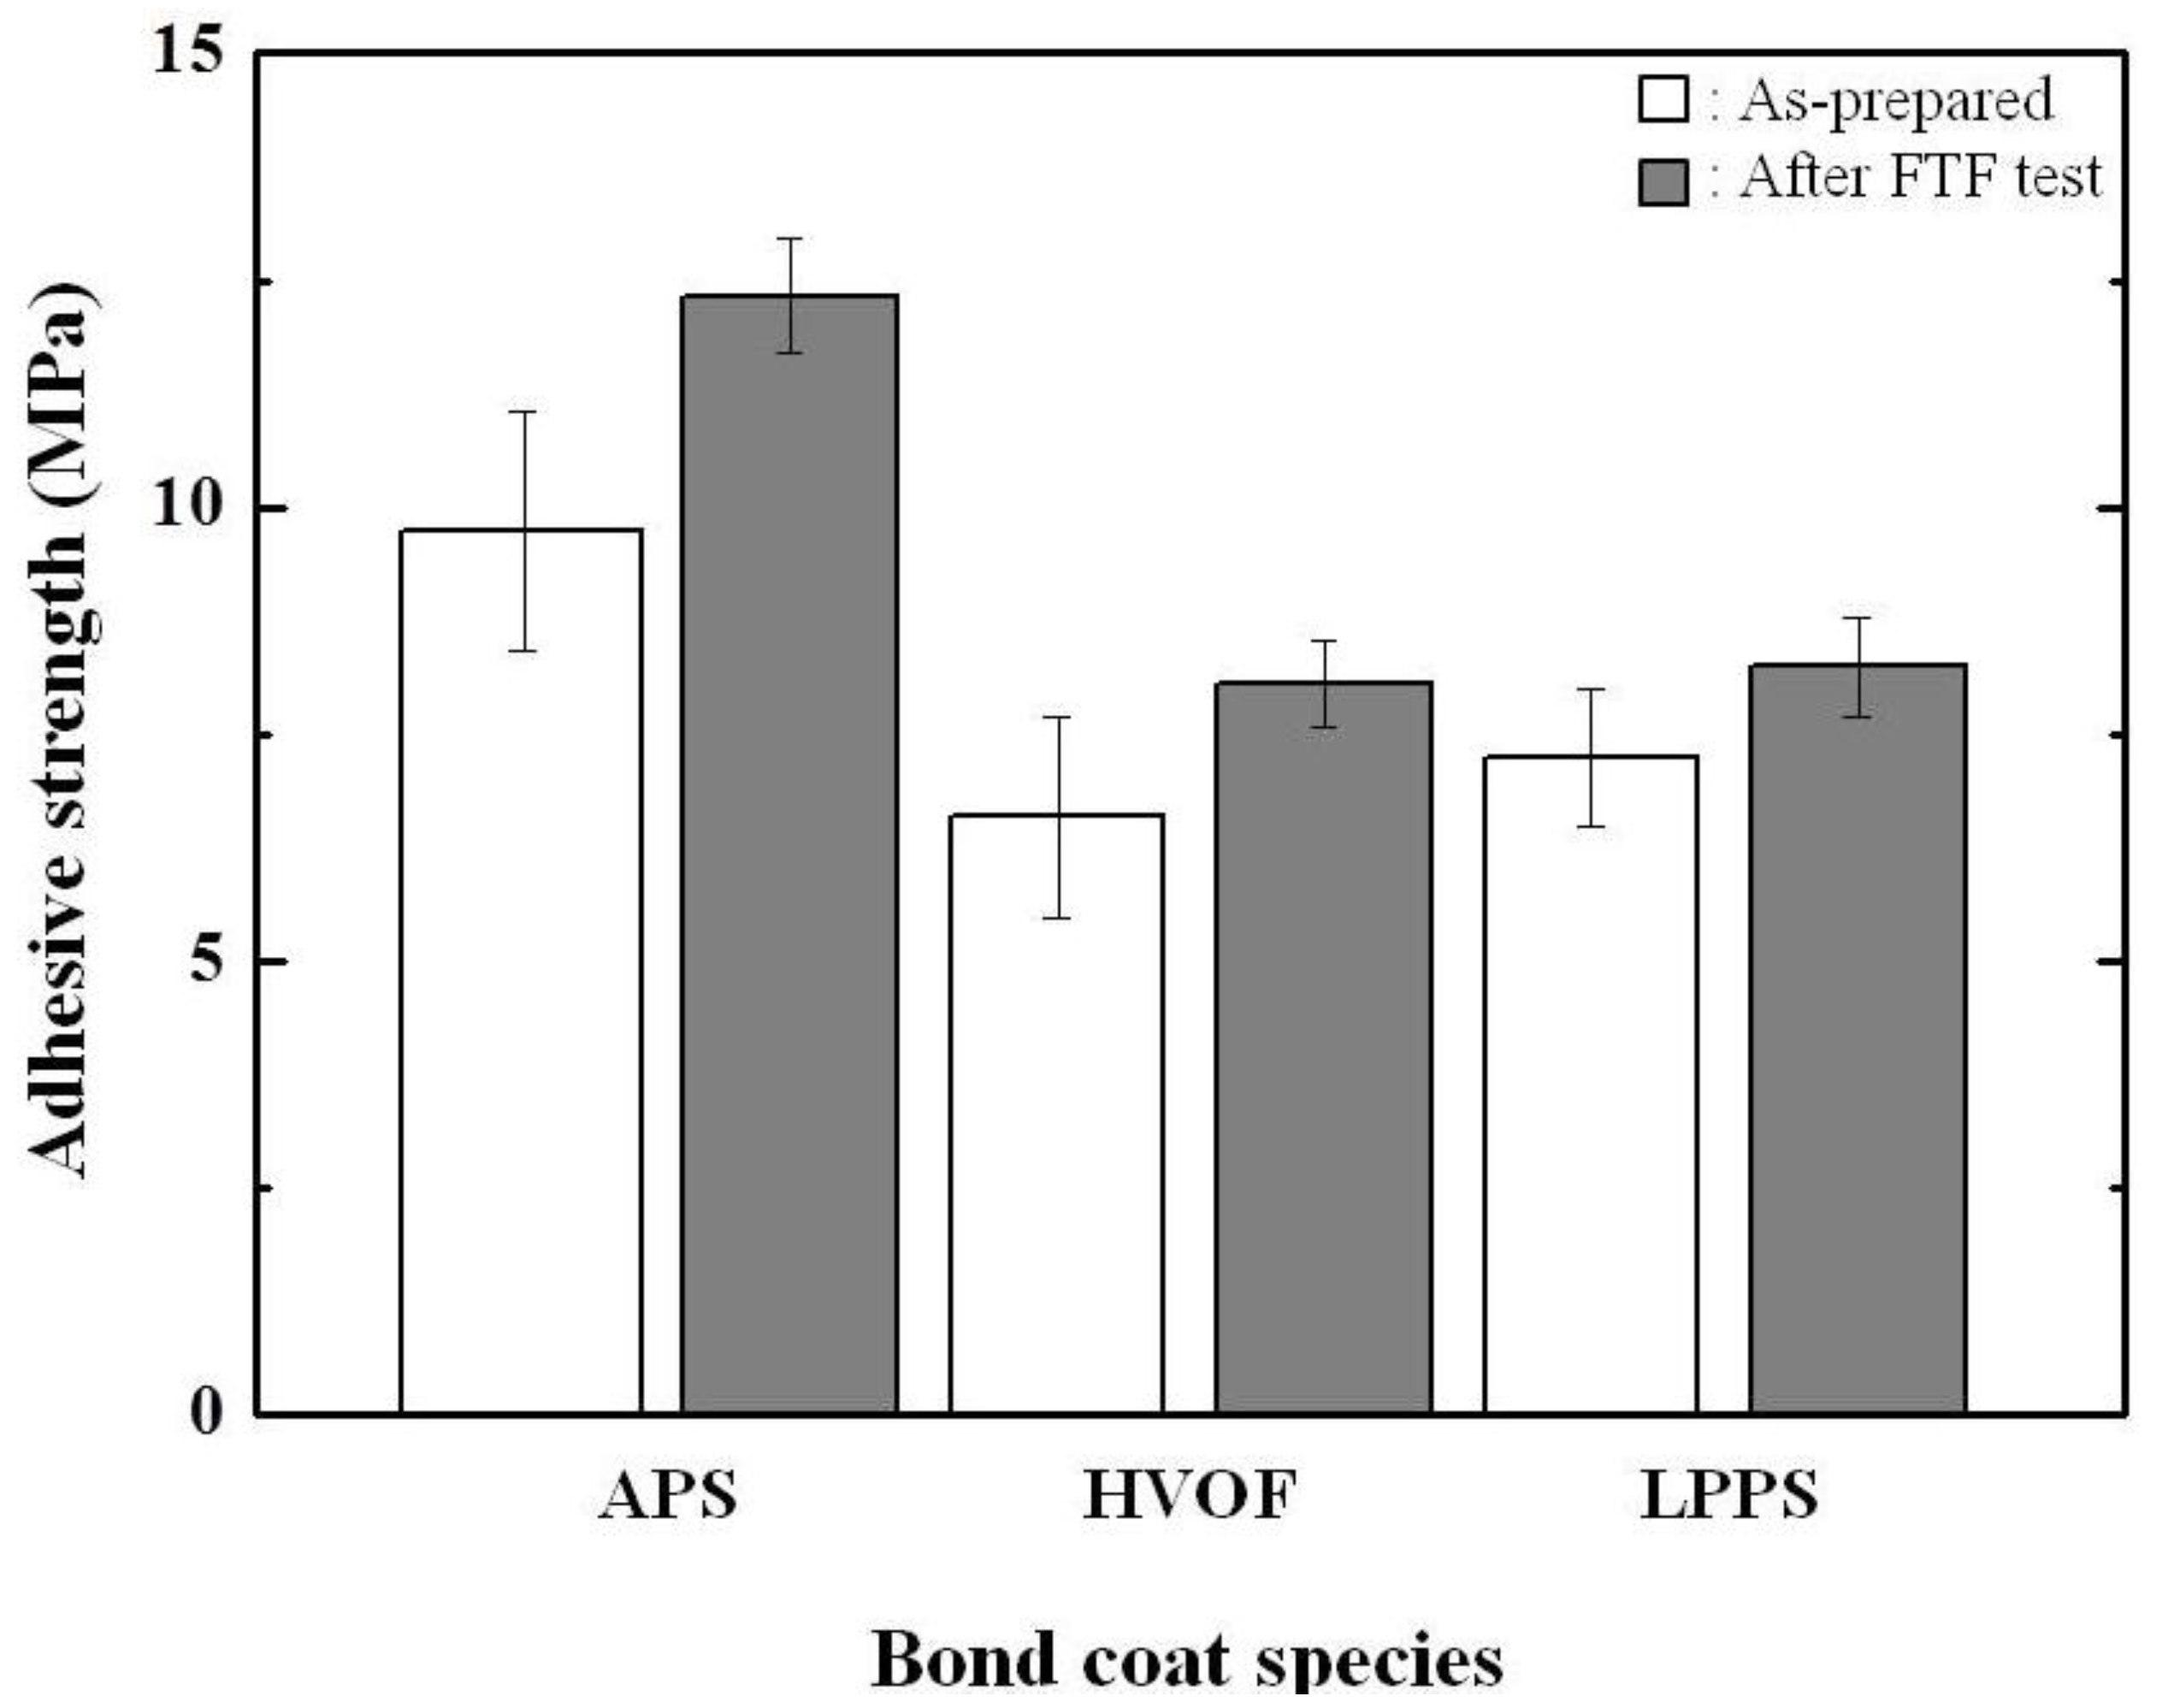
The origin of delamination at the interface between the bond and top coats is strongly related to the adhesive strength. Therefore, the adhesive strength values were measured for the TBCs before and after the FTF tests, which are shown in
Figure 12. The adhesive strength values of the as-prepared TBCs with the bond coats prepared by the APS, HVOF, and LPPS processes were determined to be 9.73 ± 1.33 (mean ± standard deviation), 6.58 ± 1.11, and 7.23 ± 0.76 MPa, respectively. All of the TBCs were completely delaminated near the interface between the top and bond coats. The adhesive strength values of the top coats are increased to 12.32 ± 0.63, 8.58 ± 1.12, and 8.24 ± 0.54 MPa for the TBCs with the bond coats prepared by the APS, HVOF, and LPPS processes, respectively, after the FTF tests for 1429 cycles. The results indicate the interface stability of the TBCs with the APS bond coat is better than the TBCs with the HVOF or LPPS bond coat. Therefore, the TBCs with the APS bond coat provided superior TBC lifetime in cyclic thermal exposure.
Figure 12.
Adhesive strength values of TBCs before and after the FTF.
Figure 12.
Adhesive strength values of TBCs before and after the FTF.


