Analysis of Pelletizing of Granulometric Separation Powder from Cork Industries

 , , , and
Abstract
:1. Introduction
2. Materials and Methods
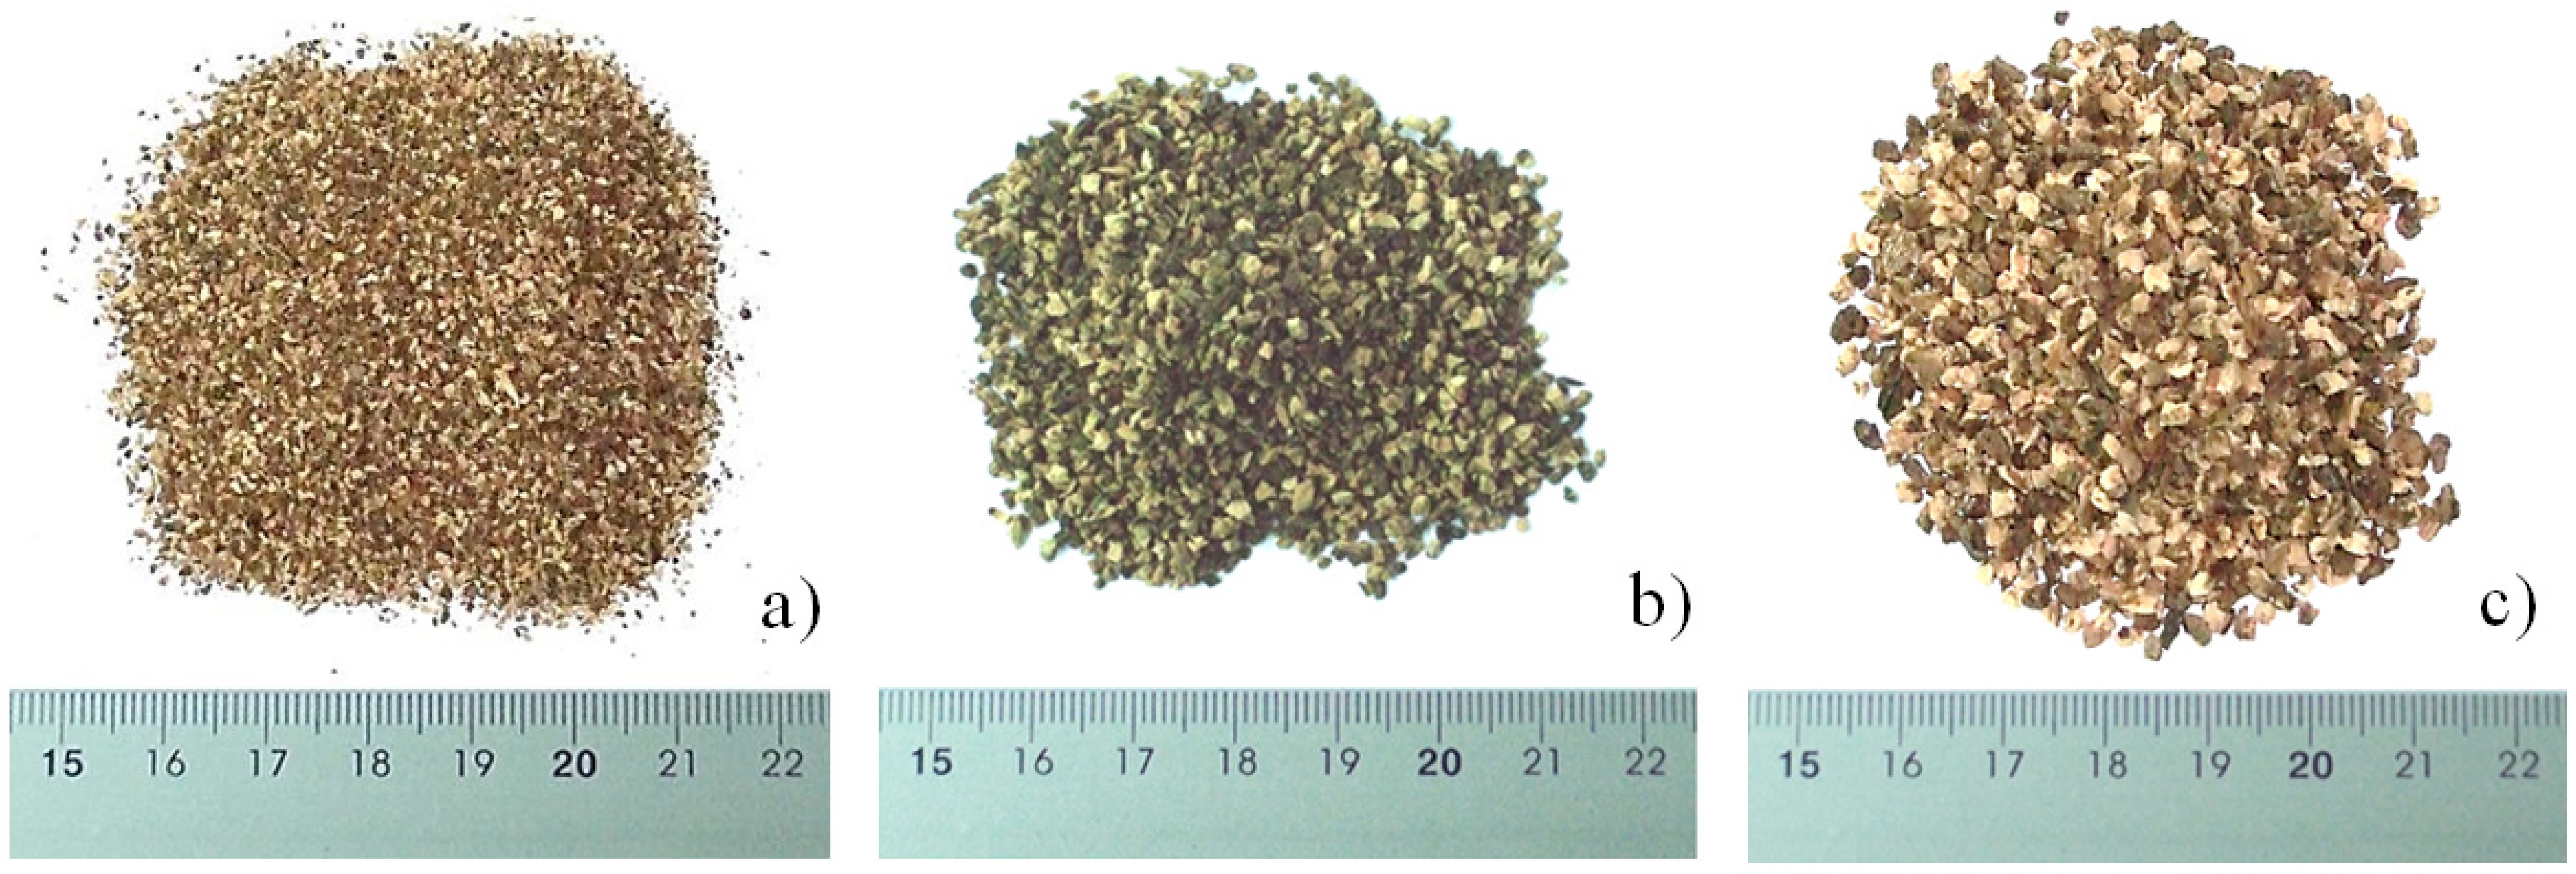
2.1. Wastes

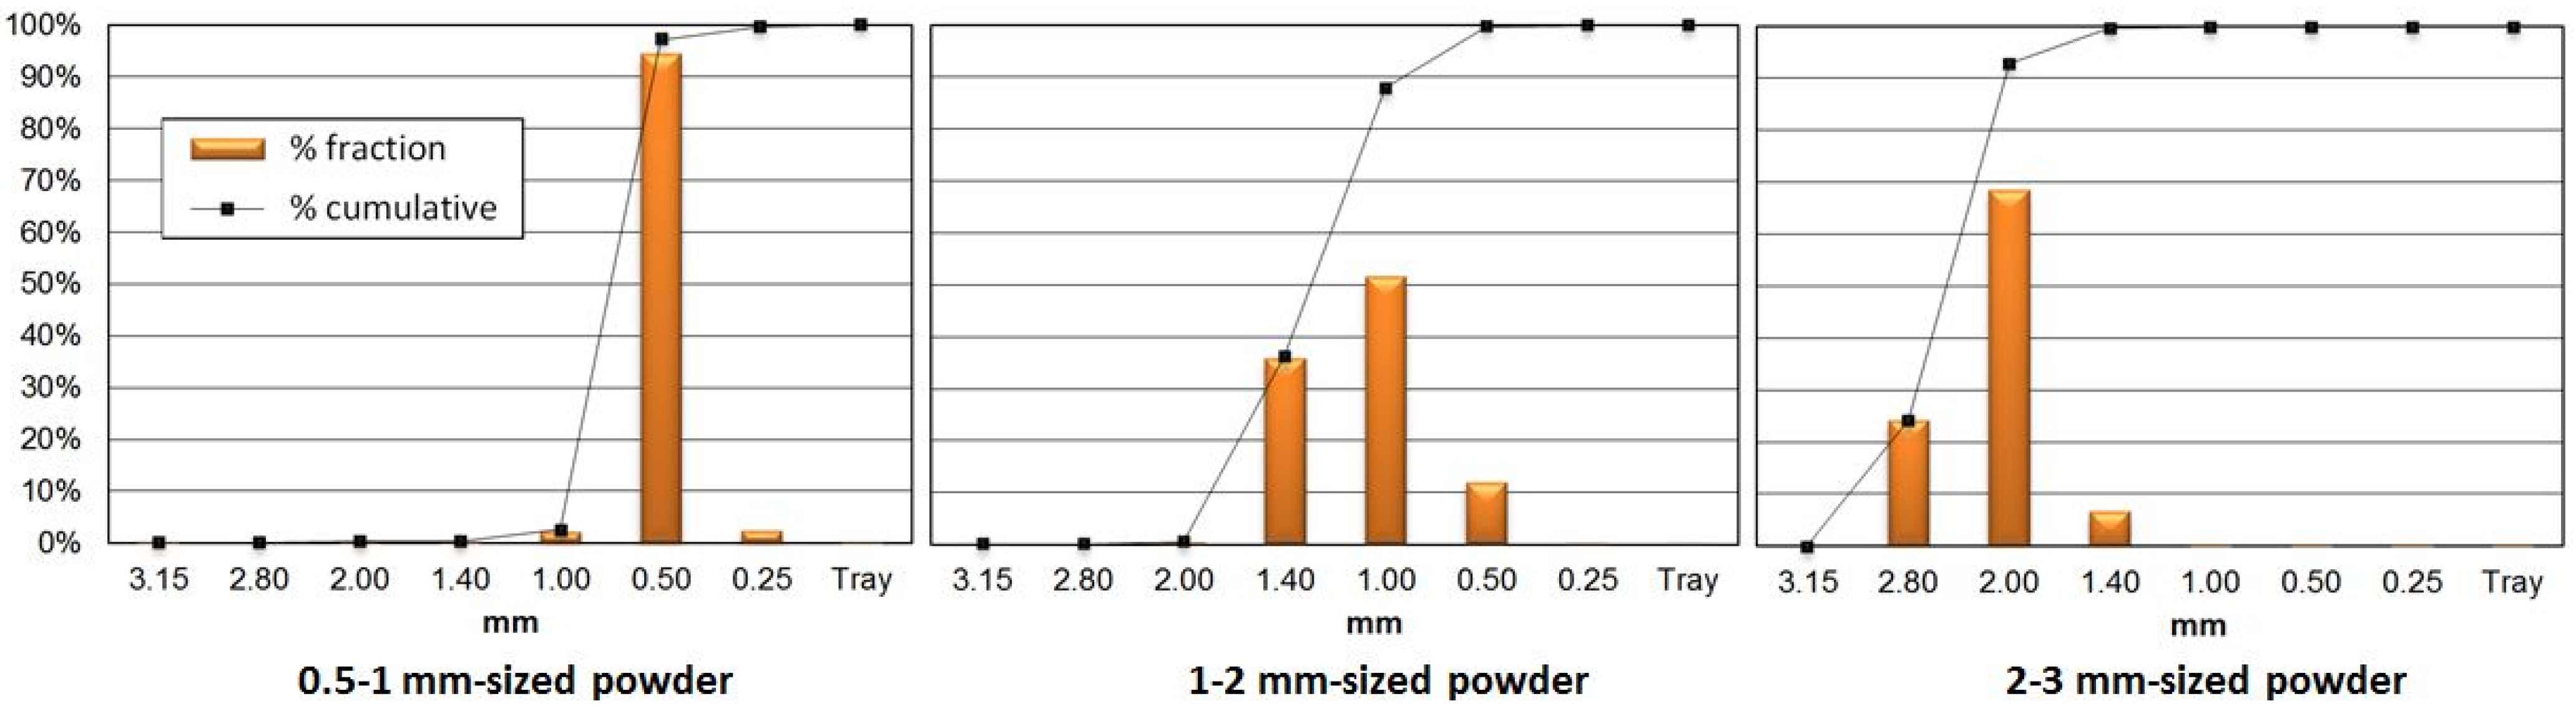
2.2. Waste Characterization


2.3. Sample Selection

| Raw materials | P1 | P2 | P3 |
|---|---|---|---|
| Cork powder 0.5–1 mm | 100% | 0% | 0% |
| Cork powder 1–2 mm | 0% | 100% | 0% |
| Cork powder 2–3 mm | 0% | 0% | 100% |
| Raw materials | P4 | P5 | P6 | P7 | P8 |
|---|---|---|---|---|---|
| Cork powder 0.5–1 mm | 50% | 60% | 40% | 33% | 50% |
| Cork powder 1–2 mm | 50% | 40% | 60% | 33% | 0% |
| Cork powder 2–3 mm | 0% | 0% | 0% | 33% | 50% |
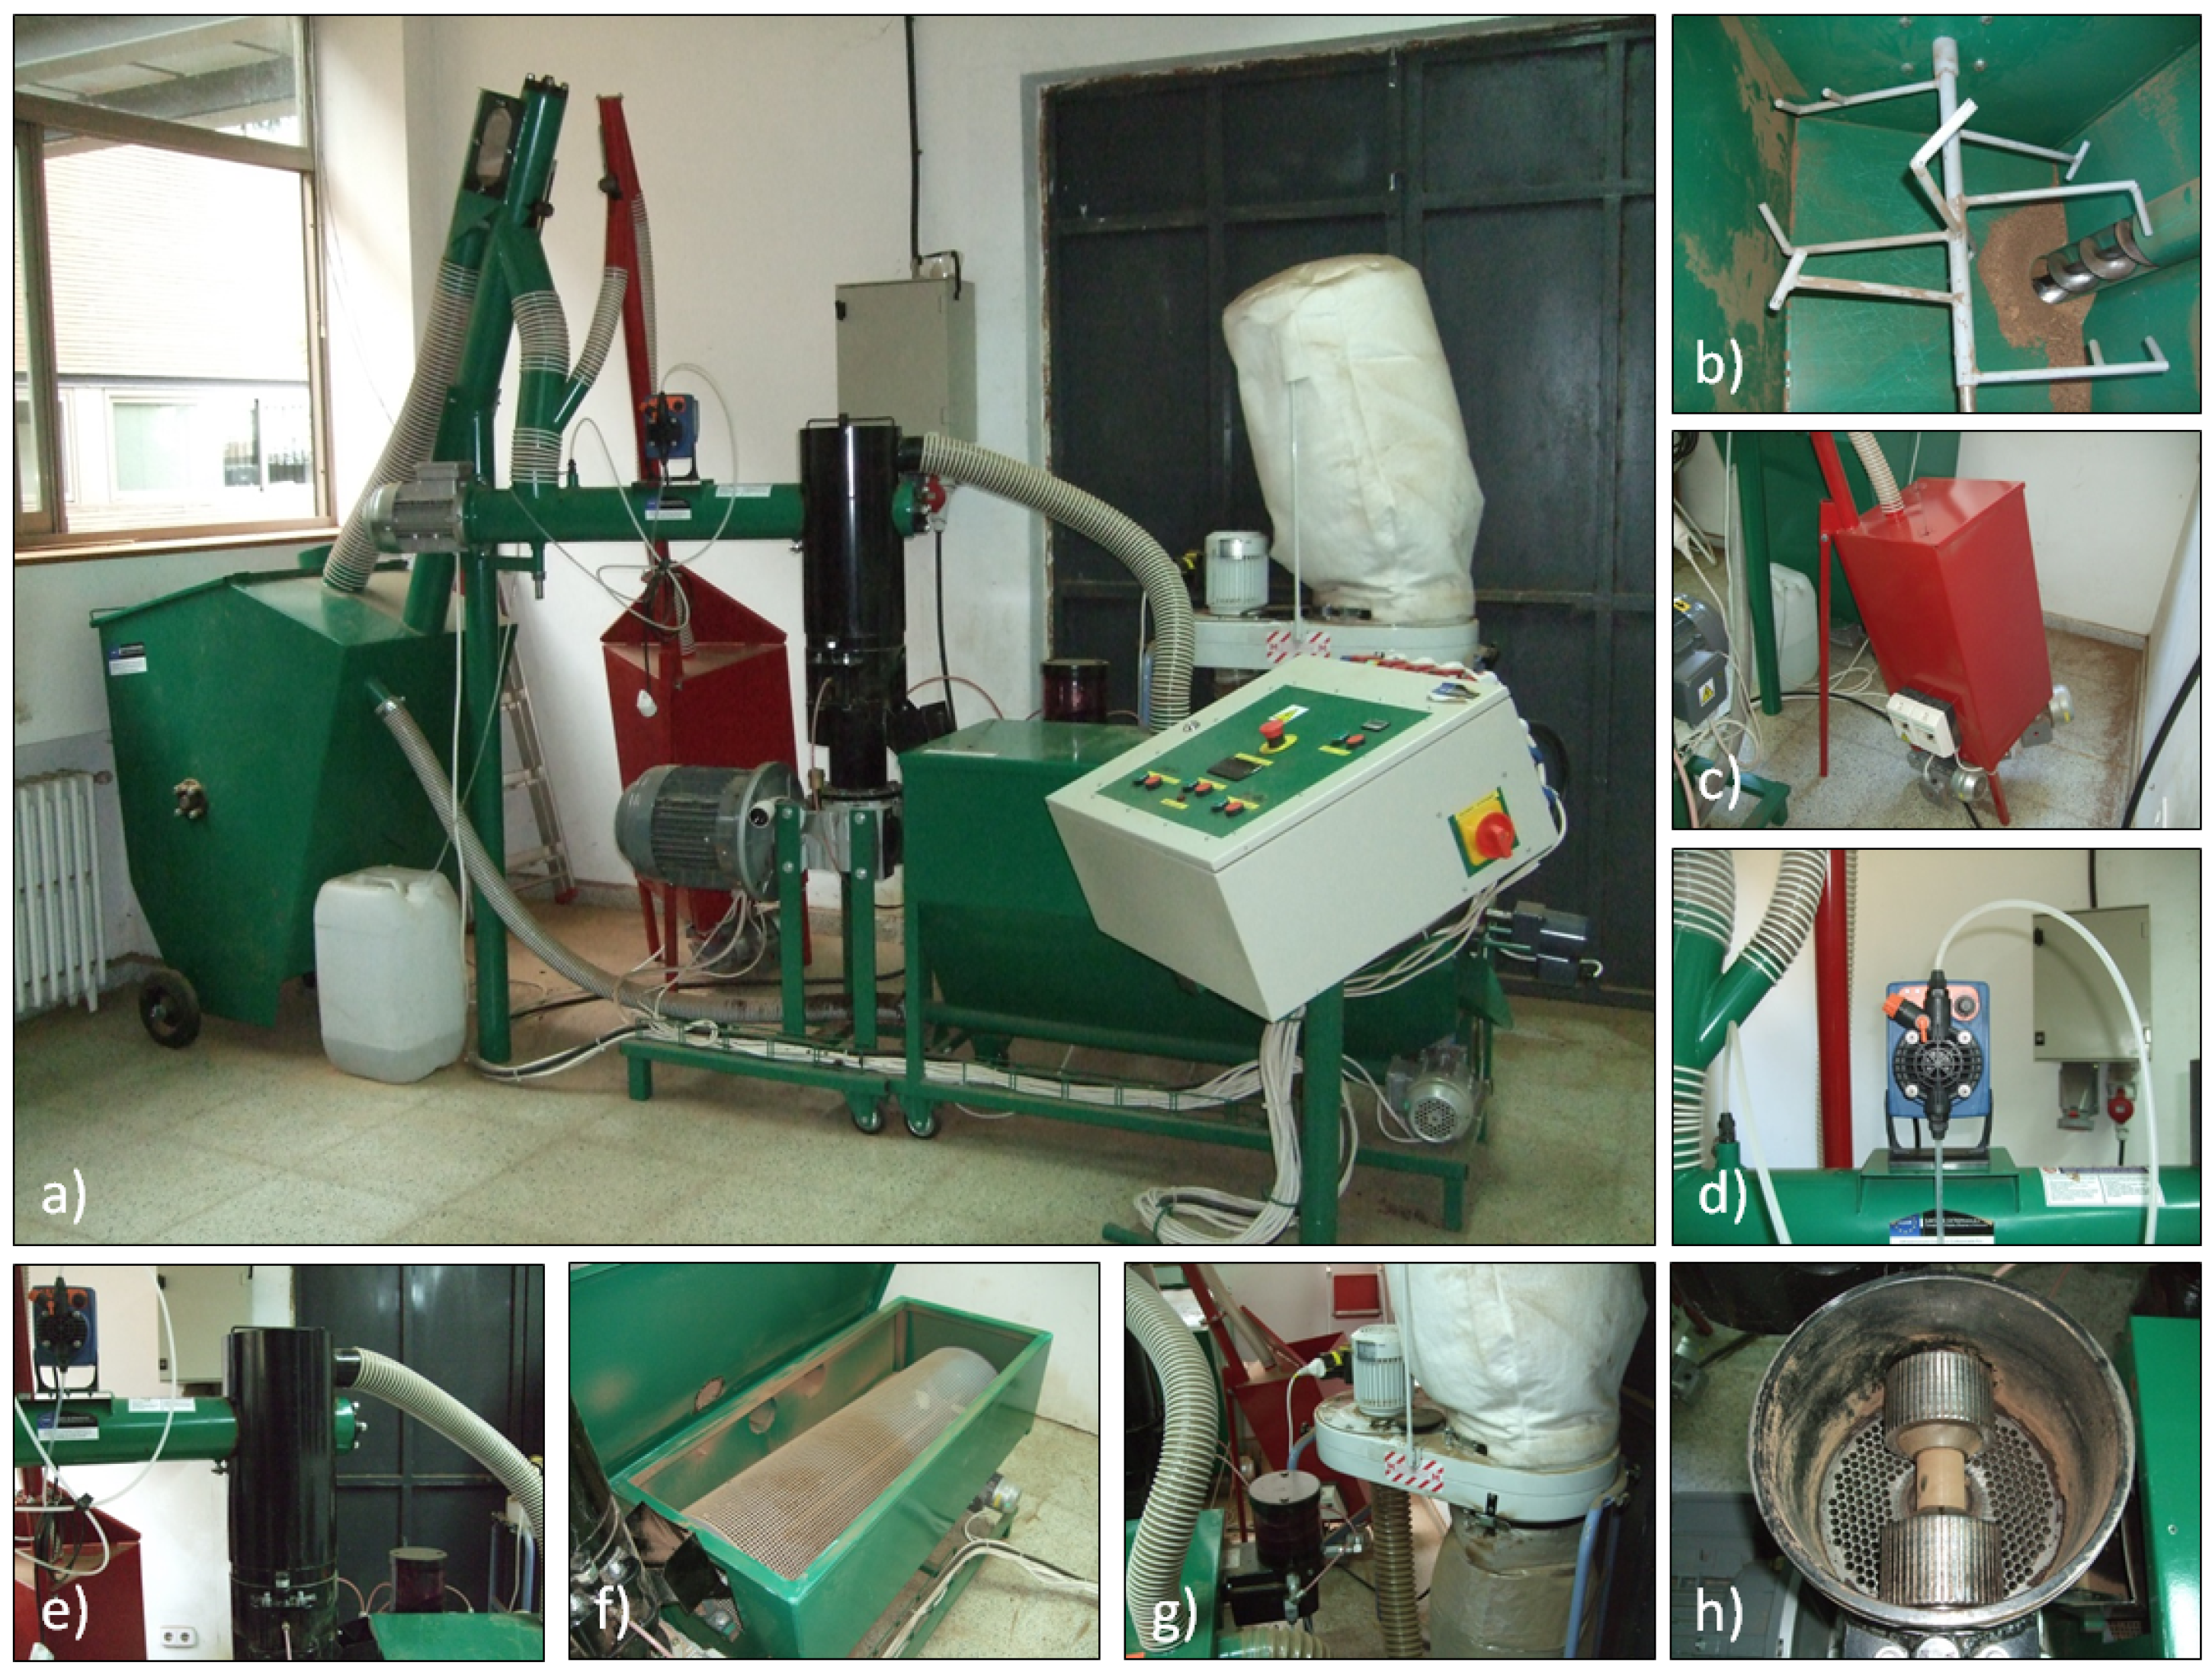
2.4. Pelletizing

2.5. Densified Products Characterization

3. Results and Discussion
3.1. Waste Characterization
| Characterization | W1 | W2 | W3 |
|---|---|---|---|
| Moisture (%wb) | 9.71 | 9.63 | 15.57 |
| Bulk density (kg/m3 wb) | 379.10 | 323.40 | 361.20 |
| Ultimate analysis | |||
| C (%db) | 50.45 | 52.89 | 51.88 |
| H (%db) | 6.02 | 5.92 | 6.92 |
| N (%db) | 0.47 | 0.33 | 0.57 |
| S (%db) | 0.03 | 0.03 | 0.04 |
| Proximate analysis | |||
| Volatile matter (%db) | 75.69 | 76.31 | 75.74 |
| Fixed carbon (%db) | 19.61 | 19.70 | 19.92 |
| Ash content (%db) | 4.70 | 3.99 | 4.34 |
| HHV (MJ/kg db) | 21.41 | 23.64 | 21.43 |
| LHV (MJ/kg db) | 20.08 | 22.33 | 19.90 |
| LHV (MJ/kg wb) | 18.13 | 20.18 | 16.81 |
| Energy density (MJ/m3 wb) | 6,873 | 6,526 | 6,072 |
| Characterization | W4 | W5 | W6 | W7 | W8 |
|---|---|---|---|---|---|
| Moisture (%wb) | 13.59 | 12.55 | 11.95 | 11.97 | 14.12 |
| Bulk density (kg/m3 wb) | 349.01 | 372.58 | 348.15 | 352.04 | 365.73 |

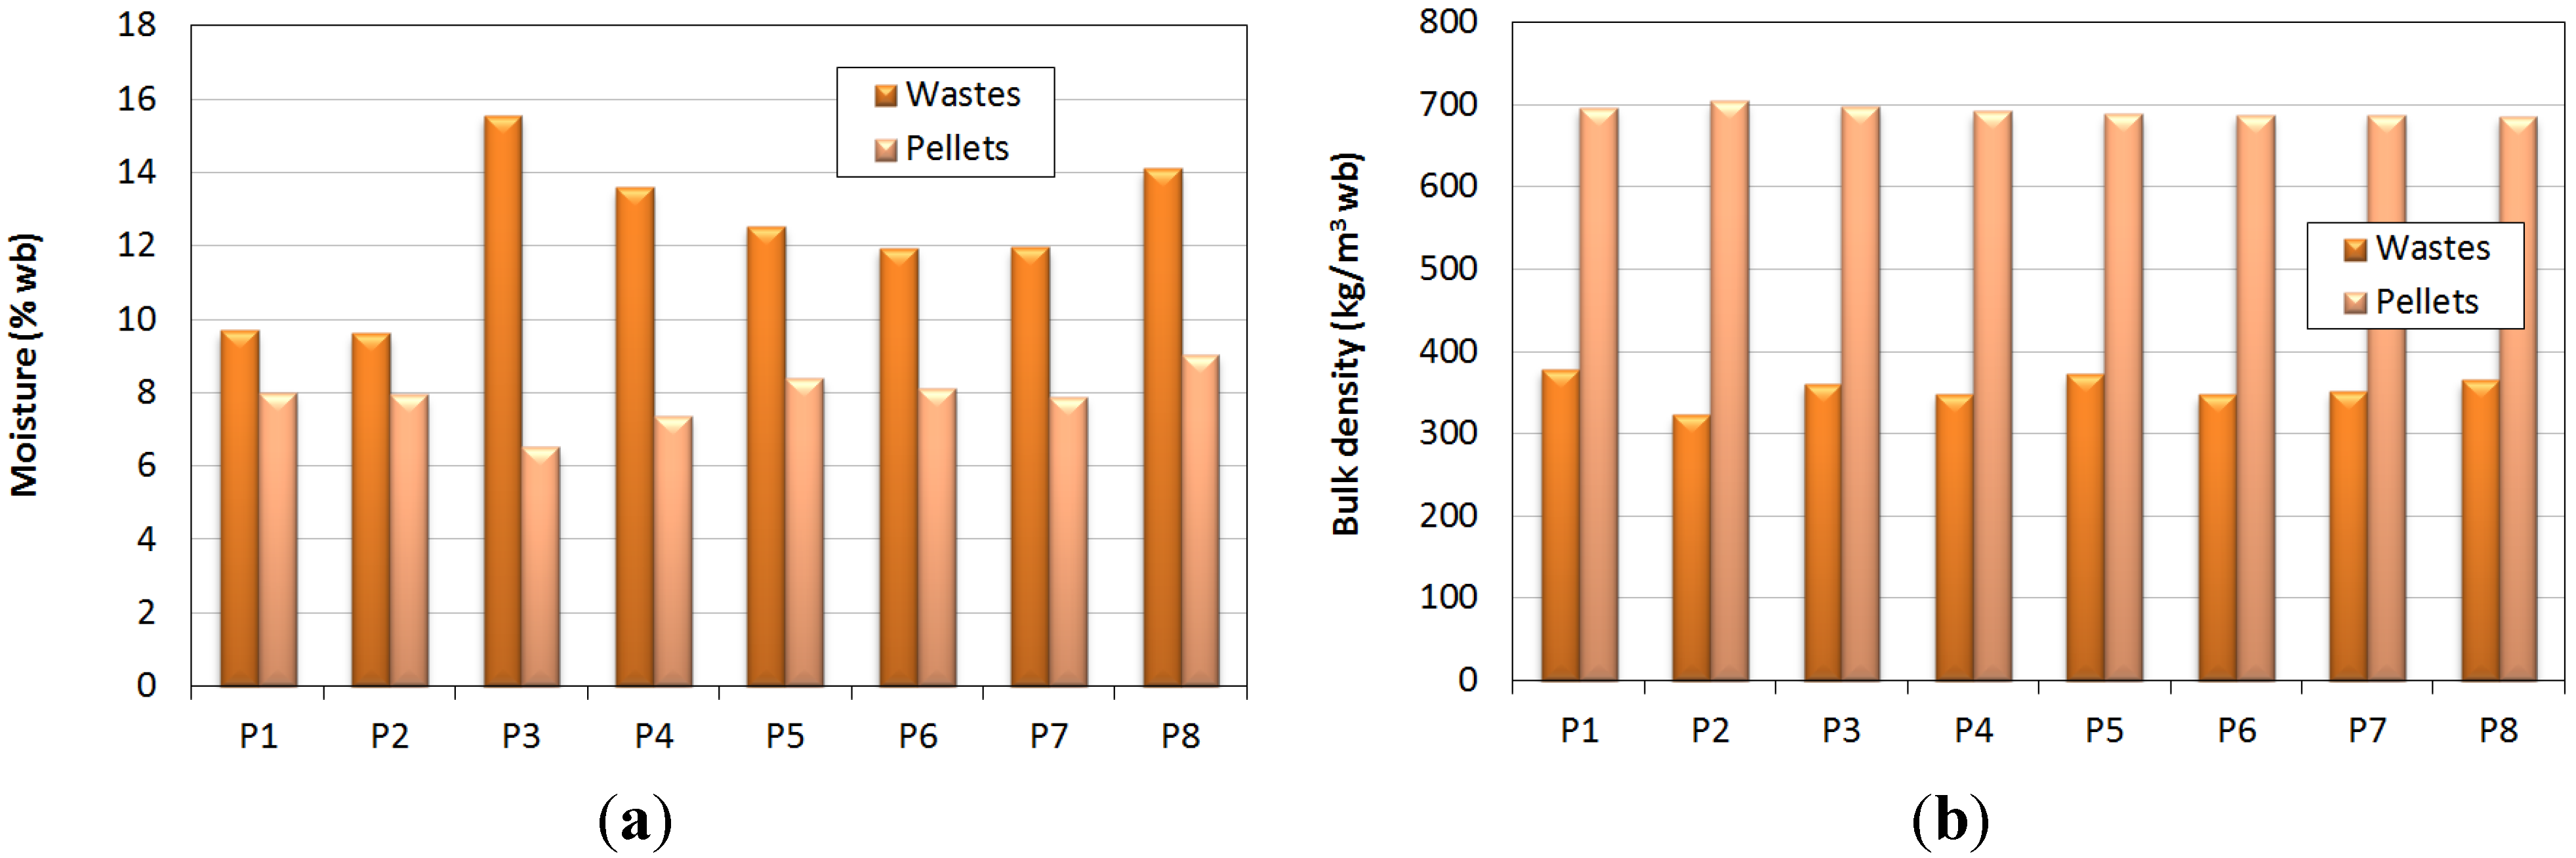
3.2. Densified Products Characterization
| Characterization | P1 | P2 | P3 | P4 | P5 | P6 | P7 | P8 |
|---|---|---|---|---|---|---|---|---|
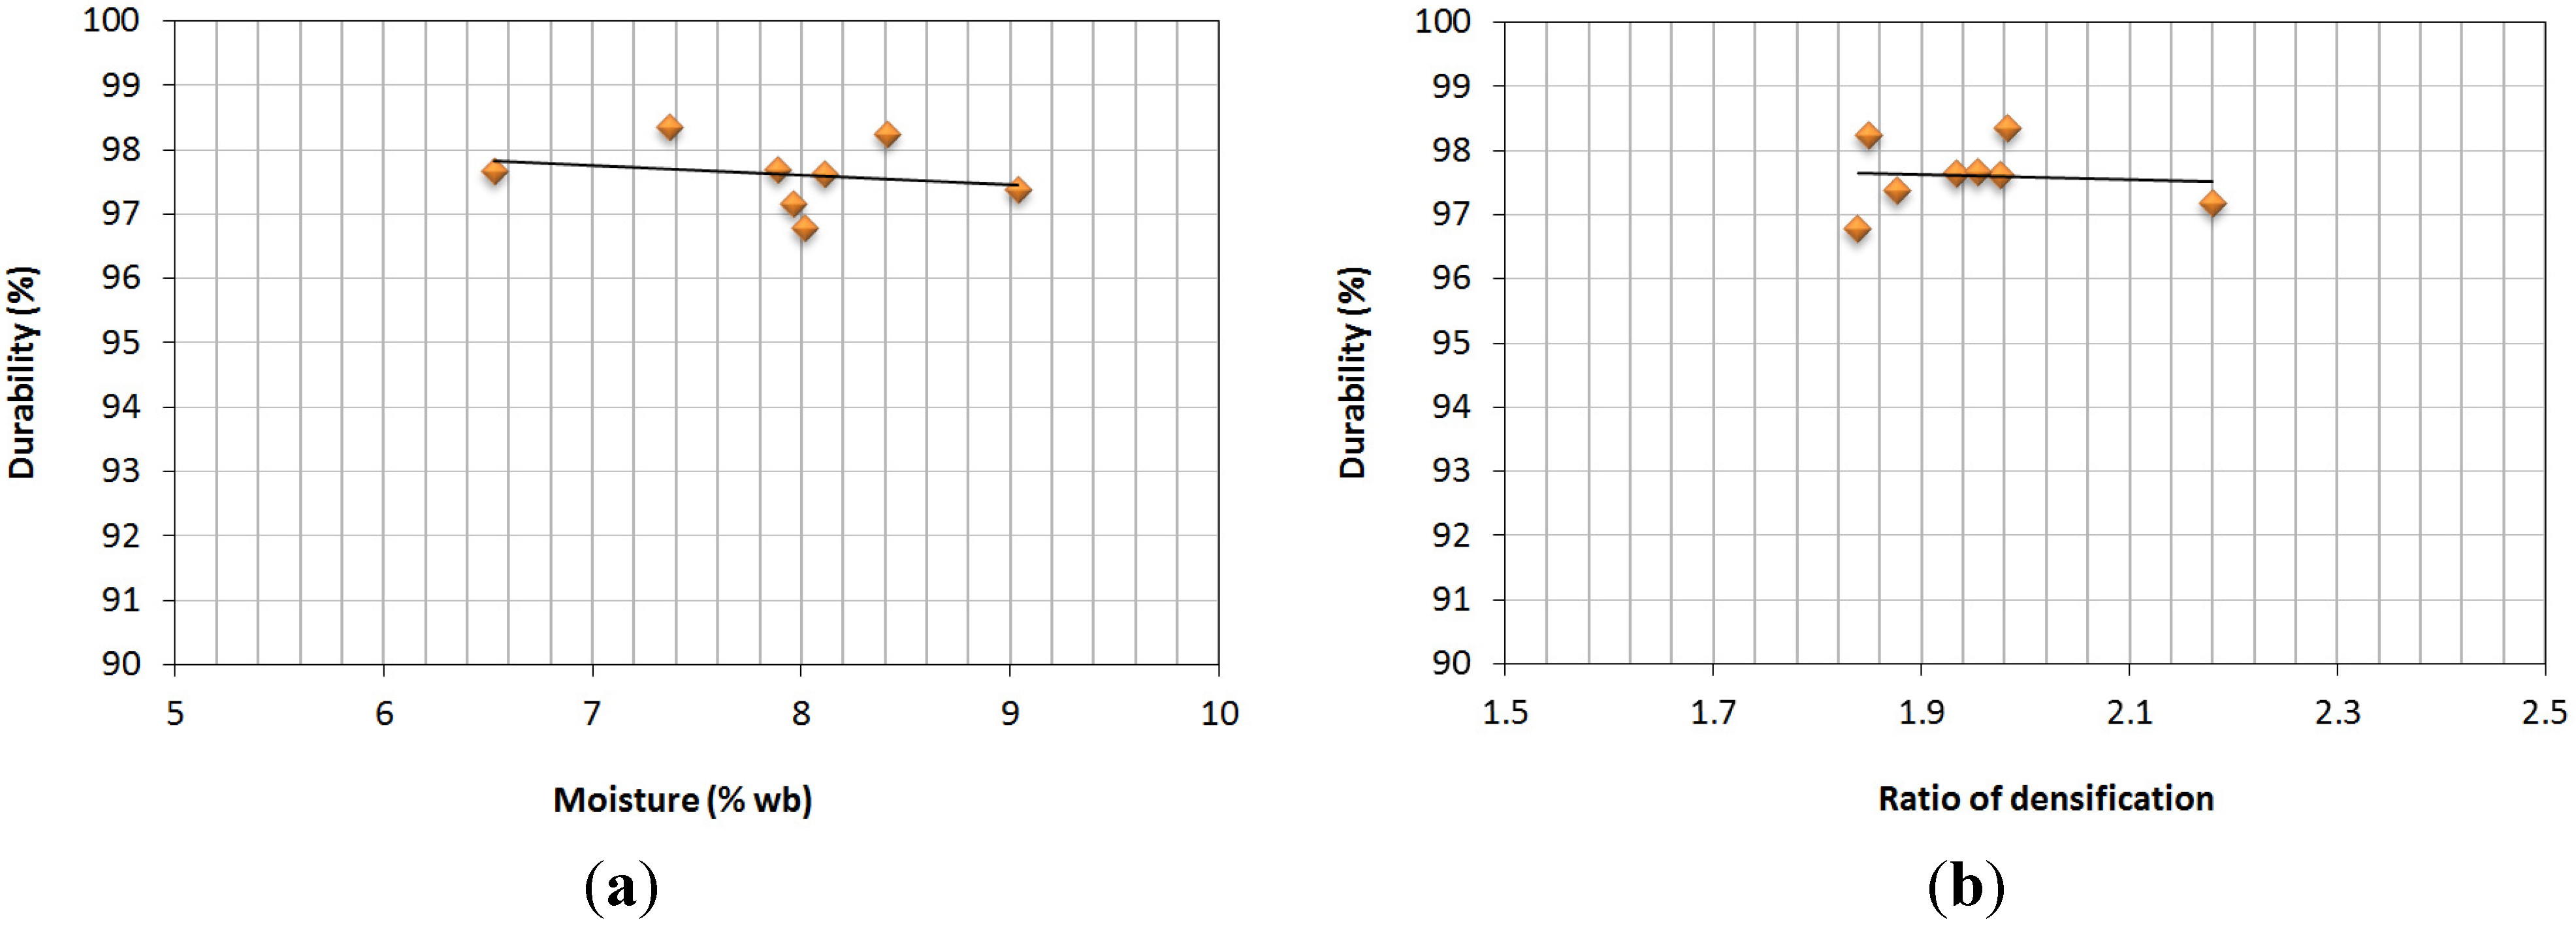
| Moisture (%wb) | 8.02 | 7.96 | 6.53 | 7.37 | 8.41 | 8.11 | 7.89 | 9.04 |
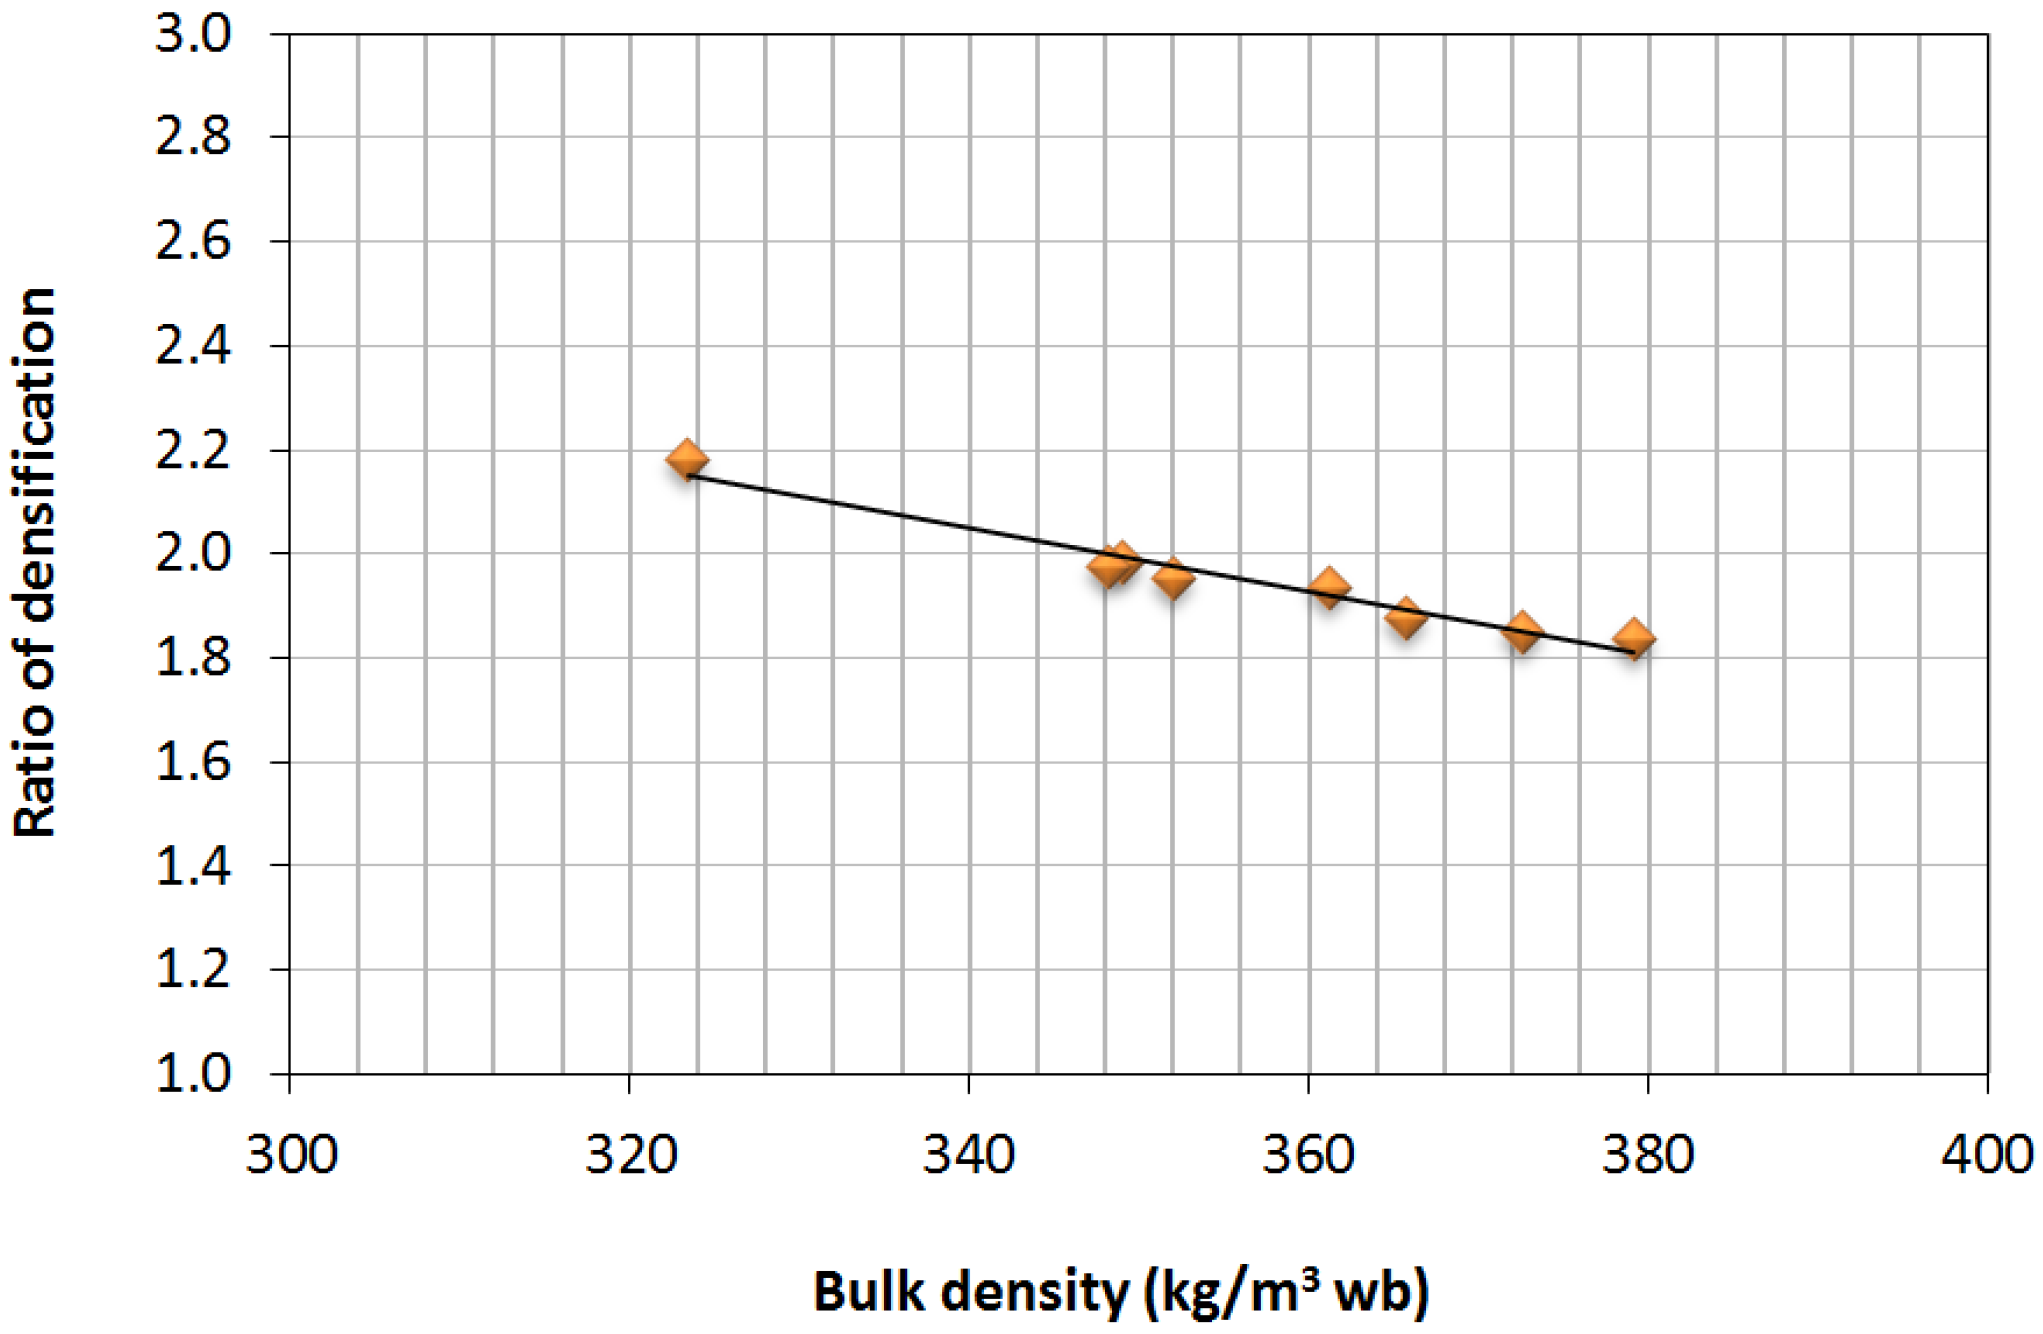
| Bulk density (kg/m3 wb) | 697.02 | 705.10 | 698.54 | 692.35 | 689.18 | 687.64 | 688.08 | 686.57 |
| Ratio of densification | 1.84 | 2.18 | 1.93 | 1.98 | 1.85 | 1.98 | 1.95 | 1.88 |
| Ultimate Analysis | ||||||||
| C (%db) | 50.50 | 52.97 | 54.52 | 51.69 | 52.61 | 55.09 | 54.36 | 53.92 |
| H (%db) | 5.80 | 6.15 | 6.61 | 6.98 | 7.16 | 7.75 | 7.19 | 6.54 |
| N (%db) | 0.43 | 0.38 | 0.75 | 0.52 | 0.52 | 0.54 | 0.51 | 0.74 |
| S (%db) | 0.03 | 0.02 | 0.00 | 0.02 | 0.02 | 0.00 | 0.01 | 0.00 |
| Proximate Analysis | ||||||||
| Volatile matter (%db) | 78.78 | 78.71 | 75.15 | 76.14 | 77.55 | 77.47 | 76.33 | 77.81 |
| Fixed carbon (%db) | 19.41 | 17.16 | 20.11 | 20.03 | 18.21 | 18.51 | 19.57 | 18.08 |
| Ash (%db) | 4.81 | 4.13 | 4.74 | 3.84 | 4.24 | 4.02 | 4.10 | 4.11 |
| HHV (MJ/kg db) | 21.41 | 24.21 | 21.56 | 21.85 | 22.12 | 20.93 | 21.68 | 21.61 |
| LHV (MJ/kg db) | 20.13 | 22.85 | 20.10 | 20.31 | 20.54 | 19.22 | 20.09 | 20.17 |
| LHV (MJ/kg wb) | 17.72 | 21.03 | 18.79 | 18.81 | 18.81 | 17.66 | 18.51 | 18.35 |
| Energy density (MJ/m3 wb) | 12,351 | 15,569 | 13,126 | 13,785 | 12,966 | 12,144 | 12,734 | 12,595 |
| Dimensions | ||||||||
| Length (mm) | 24.51 | 24.12 | 24.47 | 25.95 | 23.94 | 25.09 | 24.86 | 24.05 |
| Diameter (mm) | 5.88 | 5.96 | 5.90 | 5.88 | 5.87 | 5.84 | 5.95 | 5.86 |
| Durability (%) | 96.79 | 97.17 | 97.67 | 98.36 | 98.24 | 97.62 | 97.69 | 97.38 |


| Characterization | P1 | P2 | P3 | P4 | P5 | P6 | P7 | P8 | EN-Plus (B) |
|---|---|---|---|---|---|---|---|---|---|
| Moisture (%wb) |  | | | | | | | | ≤10 |
| Bulk density (kg/m3 wb) | | | | | | | | | ≥600 |
| N (%db) | | | | | | | | | ≤1.0 |
| S (%db) | | | | | | | | | ≤0.04 |
| Ash (%db) |  | | | | | | | | ≤3.0 |
| LHV (MJ/kg wb) | | | | | | | | | ≥16 |
| Length (mm) | | | | | | | | | 3.15–40 |
| Diameter (mm) | | | | | | | | | 6 ± 1 |
| Durability (%) | | | | | | | | | ≥96.5 |
4. Conclusions
- Pellets from granulometric separation powder satisfied all of the requirements in standard EN-Plus (B) for their use as a fuel for domestic application, except for ash content.
- Granulometry changes were not a determinant factor for obtaining a densified product, on account of the slight differences between the different size distributions that were used in this study, being under 3.15 mm.
- Pelletizing was not affected by the different moisture values in the wastes, due to the fact that they were within the recommended range (<15%wb), obtaining pellets with moisture under the allowed maximum in all cases (10%wb).
- Different particle size mixing was not an obstacle during pelletizing process, and no pre-treatments (drying, sifting, etc.) were required in any case, with the consequent cost reduction related to the process.
- Pellets from raw materials and the different mixtures in the study did not present significant differences regarding physical and energy characteristics. Thus, pelletizing might be dissociated from the real demand of granulated cork (0.5–1, 1–2 mm, etc.).
Acknowledgments
Author Contributions
Conflicts of Interest
References
- ASECOR (Ed.) Cork: ecological, sustainable and recyclable. 2007. Available online: http://www.asecor.com/doc/elcorcho.pdf (accessed on 22 July 2014).
- Silva, S.P.; Sabino, M.A.; Fernandes, E.M.; Correlo, V.M.; Boesel, L.F.; Reis, R.L. Cork: Properties, capabilities and applications. Int. Mater. Rev. 2005, 50, 345–365. [Google Scholar]
- Sepúlveda, F.J. Selective Use for the Integral Valorization of Wastes from Cork Industry. Ph.D. Thesis, University of Extremadura, Badajoz, Spain, 2014. [Google Scholar]
- Gil, L. Cork powder waste: An overview. Biomass Bioenergy 1997, 13, 59–61. [Google Scholar]
- Rojas, S.; Pérez, C.; Montero, I.; Cobos, J.G.; De Miguel, F. Energy recovery of waste from cork industries of San Vicente de Alcántara. Energía 2002, 166, 88–93. [Google Scholar]
- Stelte, W.; Holm, J.K.; Sanadi, A.R.; Barsberg, S.; Ahrenfeldt, J.; Henriksen, U.B. A study of bonding and failure mechanisms in fuel pellets from different biomass resources. Biomass Bioenergy 2011, 35, 910–918. [Google Scholar]
- Sultana, A.; Kumar, A.; Harfield, D. Development of agri-pellet production cost and optimum size. Bioresour. Technol. 2010, 101, 5609–5621. [Google Scholar]
- Nielsen, N.P.K.; Gardner, D.J.; Poulsen, T.; Felby, C. Importance of temperature, moisture content, and species for the conversion process of wood into fuel pellets. Wood Fiber Sci. 2009, 41, 414–425. [Google Scholar]
- Holm, J.K.; Henriksen, U.B.; Hustad, J.E.; Sørensen, L.H. Toward an understanding of controlling parameters in softwood and hardwood pellets production. Energy Fuels 2006, 20, 2686–2694. [Google Scholar]
- Montero, I.; Miranda, M.T.; Sepúlveda, F.J.; Arranz, J.I.; Trinidad, M.J.; Rojas, C.V. Analysis of pelletizing of wastes from cork industry. Dyna Energía y Sostenibilidad 2014. [Google Scholar] [CrossRef]
- Nunes, L.J.R.; Matias, J.C.O.; Catalão, J.P.S. Energy recovery from cork industrial waste: Production and characterisation of cork pellets. Fuel 2013, 113, 24–30. [Google Scholar]
- Arranz, J.I. Analysis of Densified of the Combination from Different Biomass Waste. Ph.D. Thesis, University of Extremadura, Badajoz, Spain, 2011. [Google Scholar]
- Mediavilla, I.; Fernández, M.J.; Esteban, L.S. Optimization of pelletisation and combustion in a boiler of 17.5 kWth for vine shoots and industrial cork residue. Fuel Process. Technol. 2009, 90, 621–628. [Google Scholar]
- UNE-EN 14772-2. Solid biofuels. Determination of moisture content. AENOR: Madrid, Spain, 2010.
- UNE-EN 15103. Solid biofuels. Determination of bulk density. AENOR: Madrid, Spain, 2010.
- UNE-EN 15149-2. Solid biofuels. Determination of particle size distribution. AENOR: Madrid, Spain, 2011.
- UNE-EN 15014. Plastics piping systems. Buried and above ground systems for water and other fluids under pressure. AENOR: Madrid, Spain, 2008.
- UNE-EN 15289. Solid biofuels. Determination of total content of sulfur and chlorine. AENOR: Madrid, Spain, 2011.
- UNE-EN 15148. Solid biofuels. Determination of the content of volatile matter. AENOR: Madrid, Spain, 2010.
- UNE-EN 14775. Solid biofuels. Determination of ash content. AENOR: Madrid, Spain, 2010.
- UNE-EN 14918. Solid biofuels. Determination of calorific value. AENOR: Madrid, Spain, 2011.
- UNE-EN 16127. Solid biofuels. Determination of length and diameter of pellets. AENOR: Madrid, Spain, 2012.
- UNE-EN 15210-1. Solid biofuels. Determination of mechanical durability of pellets and briquettes. AENOR: Madrid, Spain, 2010.
- UNE-EN 14961-2. Solid biofuels. Fuel Specifications and Classes. AENOR: Madrid, Spain, 2012.
- Van Loo, S.; Koppejan, J. Handbook of Biomass Combustion and Cofiring; Twente University Press: Enschede, The Netherlands, 2003. [Google Scholar]
- Granada, E. Study of the Influence of the Parameters of Moisture, Temperature and Pressure at the Densification Process through Self-Agglomeration of Residual Lignocellulosic Biomass. Ph.D. Thesis, University of Vigo, Vigo, Spain, 1999. [Google Scholar]
- Serrano, C.; Monedero, E.; Lapuerta, M.; Portero, H. Effect of moisture content, particle size and pine addition on quality parameters of barley straw pellets. Fuel Process. Technol. 2011, 92, 699–706. [Google Scholar]
- Mani, S.; Tabilb, L.G.; Sokhansanj, S. Effects of compressive force, particle size and moisture content on mechanical properties of biomass pellets from grasses. Biomass Bioenergy 2006, 30, 648–654. [Google Scholar]
- Wolf, A.; Vidlund, A.; Andersson, E. Energy efficient pellet production in the forest industry—A study of obstacles and success factors. Biomass Bioenergy 2006, 30, 38–45. [Google Scholar]
- Obernberger, I.; Thek, G. Physical characterisation and chemical composition of densified biomass fuels with regard to their combustion behaviour. Biomass Bioenergy 2004, 27, 653–669. [Google Scholar]
- Miranda, M.T.; Arranz, J.I.; Rojas, S.; Montero, I. Enerdy characterization of densified residues from Pyrenean oak forest. Fuel 2009, 88, 2106–2112. [Google Scholar]
- Miranda, M.T. Thermal Utilization of Biomass. Ph.D. Thesis, University of Extremadura, Badajoz, Spain, 2005. [Google Scholar]
- Lehtikangas, P. Quality properties of pelletised sawdust, logging residues and bark. Biomass Bioenergy 2001, 20, 351–360. [Google Scholar]
- Filbakk, T.; Jirjis, R.; Nurmi, J.; Hoibo, O. The effect of bark content on quality parameters of Scots pine (Pinus sylvestris L.) pellets. Biomass Bioenergy 2011, 35, 3342–3349. [Google Scholar]
- Nhuchhen, D.R.; Salam, P.A. Estimation of higher heating value of biomass from proximate analysis: A new approach. Fuel 2012, 99, 55–63. [Google Scholar]
- Mustelier, N.L.; Almeida, M.F.; Cavalheiro, J.; Castro, F. Evaluation of pellets produced with undergrowth to be used as biofuel. Waste Biomass Valor. 2012, 3, 285–294. [Google Scholar]
- Österreichs Norm. ÖNORM M 7135. Compressed wood and compressed bark in natural state—Pellets and Briquettes. Requirements and test specifications. Österreichisches Normungsinstitut: Vienna, Austria, 2000. [Google Scholar]
- Gillespie, G.D.; Everard, C.D.; Fagan, C.C.; McDonnell, K.P. Prediction of quality parameters of biomass pellets from proximate and ultimate analysis. Fuel 2013, 111, 771–777. [Google Scholar]
- Temmerman, M.; Rabier, F. Comparative study of durability test methods for pellets and briquettes. Biomass Bioenergy 2008, 30, 964–972. [Google Scholar]
© 2014 by the authors; licensee MDPI, Basel, Switzerland. This article is an open access article distributed under the terms and conditions of the Creative Commons Attribution license (http://creativecommons.org/licenses/by/3.0/).
Share and Cite
Montero, I.; Miranda, T.; Sepúlveda, F.J.; Arranz, J.I.; Nogales, S. Analysis of Pelletizing of Granulometric Separation Powder from Cork Industries. Materials 2014, 7, 6686-6700. https://doi.org/10.3390/ma7096686
Montero I, Miranda T, Sepúlveda FJ, Arranz JI, Nogales S. Analysis of Pelletizing of Granulometric Separation Powder from Cork Industries. Materials. 2014; 7(9):6686-6700. https://doi.org/10.3390/ma7096686
Chicago/Turabian StyleMontero, Irene, Teresa Miranda, Francisco José Sepúlveda, José Ignacio Arranz, and Sergio Nogales. 2014. "Analysis of Pelletizing of Granulometric Separation Powder from Cork Industries" Materials 7, no. 9: 6686-6700. https://doi.org/10.3390/ma7096686
APA StyleMontero, I., Miranda, T., Sepúlveda, F. J., Arranz, J. I., & Nogales, S. (2014). Analysis of Pelletizing of Granulometric Separation Powder from Cork Industries. Materials, 7(9), 6686-6700. https://doi.org/10.3390/ma7096686