3.1. Test Summary
The present study assessed the electrochemical characteristics of corrosion inhibitors in aqueous solution based on the inhibitor amounts added in order to perform a qualitative evaluation of their anti-corrosion effects. First, in terms of the electrochemical anti-corrosion properties,
Table 1 lists the physical properties of the tested corrosion inhibitors, and the chemical composition of the reinforcing steel is shown in
Table 2.
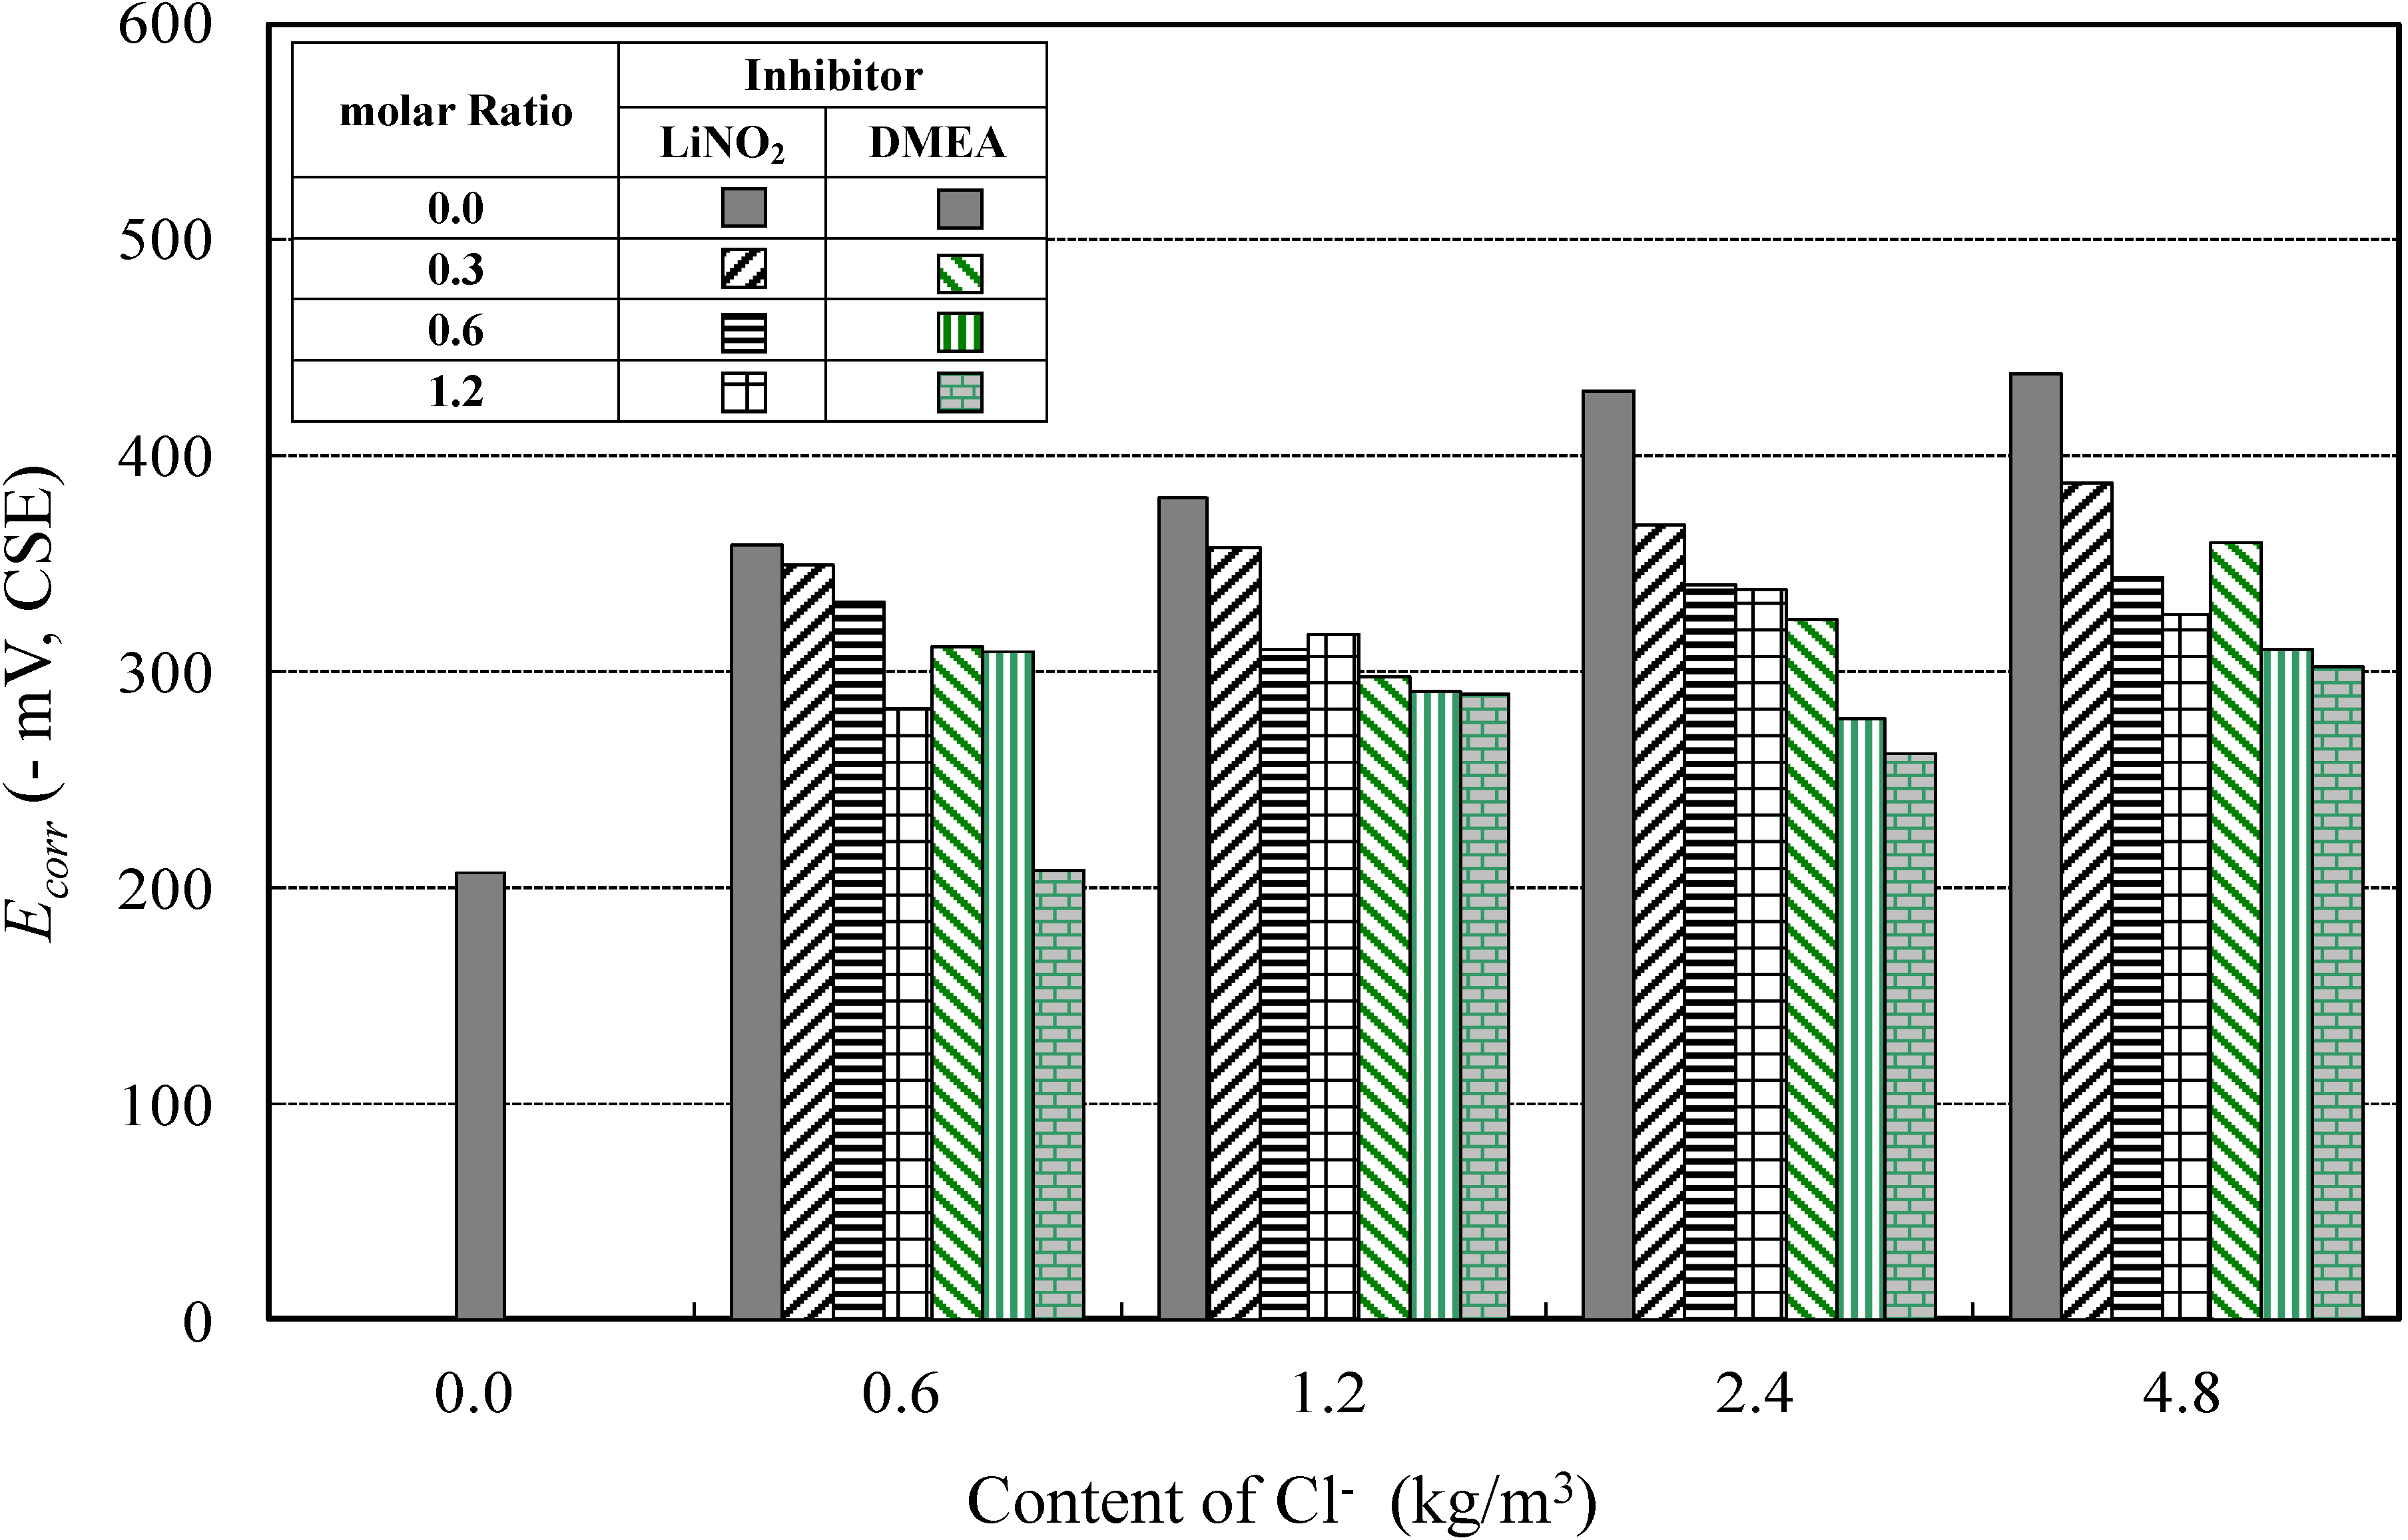
The potentiodynamic polarization curve, known as a Tafel plot, depicts the relationship between potential and corrosion current density. This plot exhibits a linear region, the slope of which is known as the Tafel constants (anodic and cathodic Tafel constants). The intersection of the projection of the linear region of the plot with the open circuit potential (
Ecorr) gives the cathodic or anodic corrosion current (
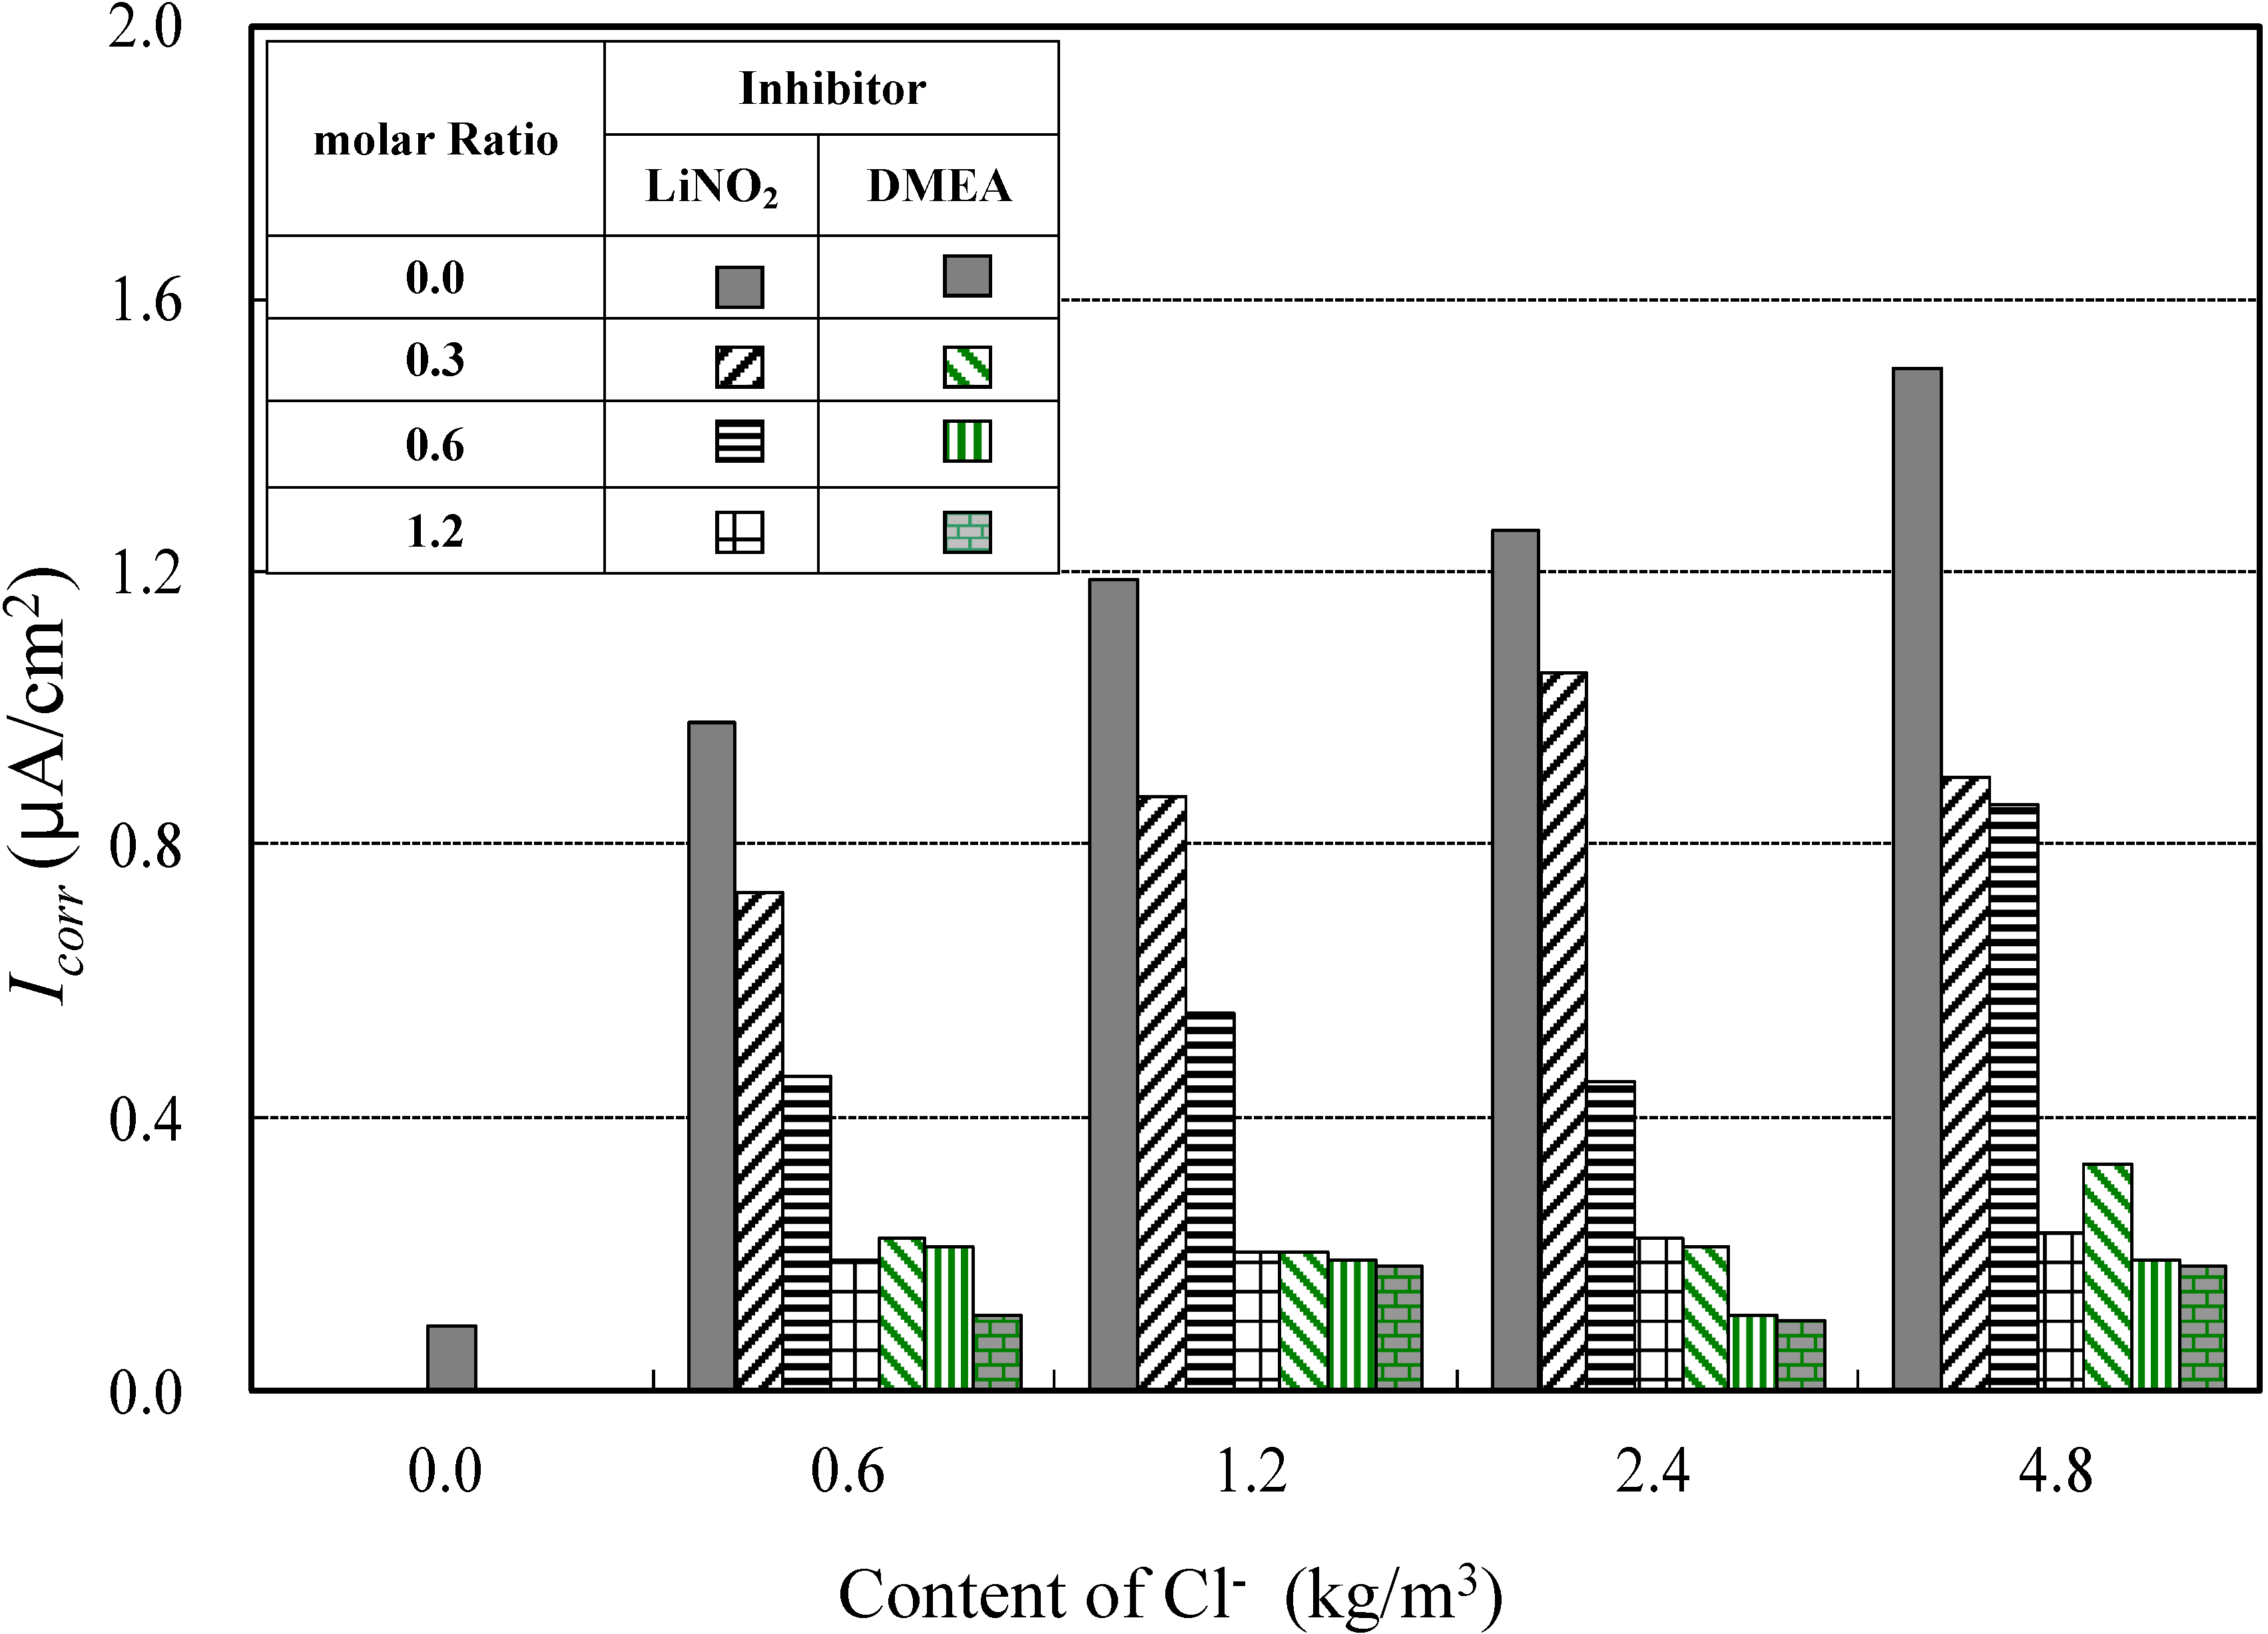
icorr). Once
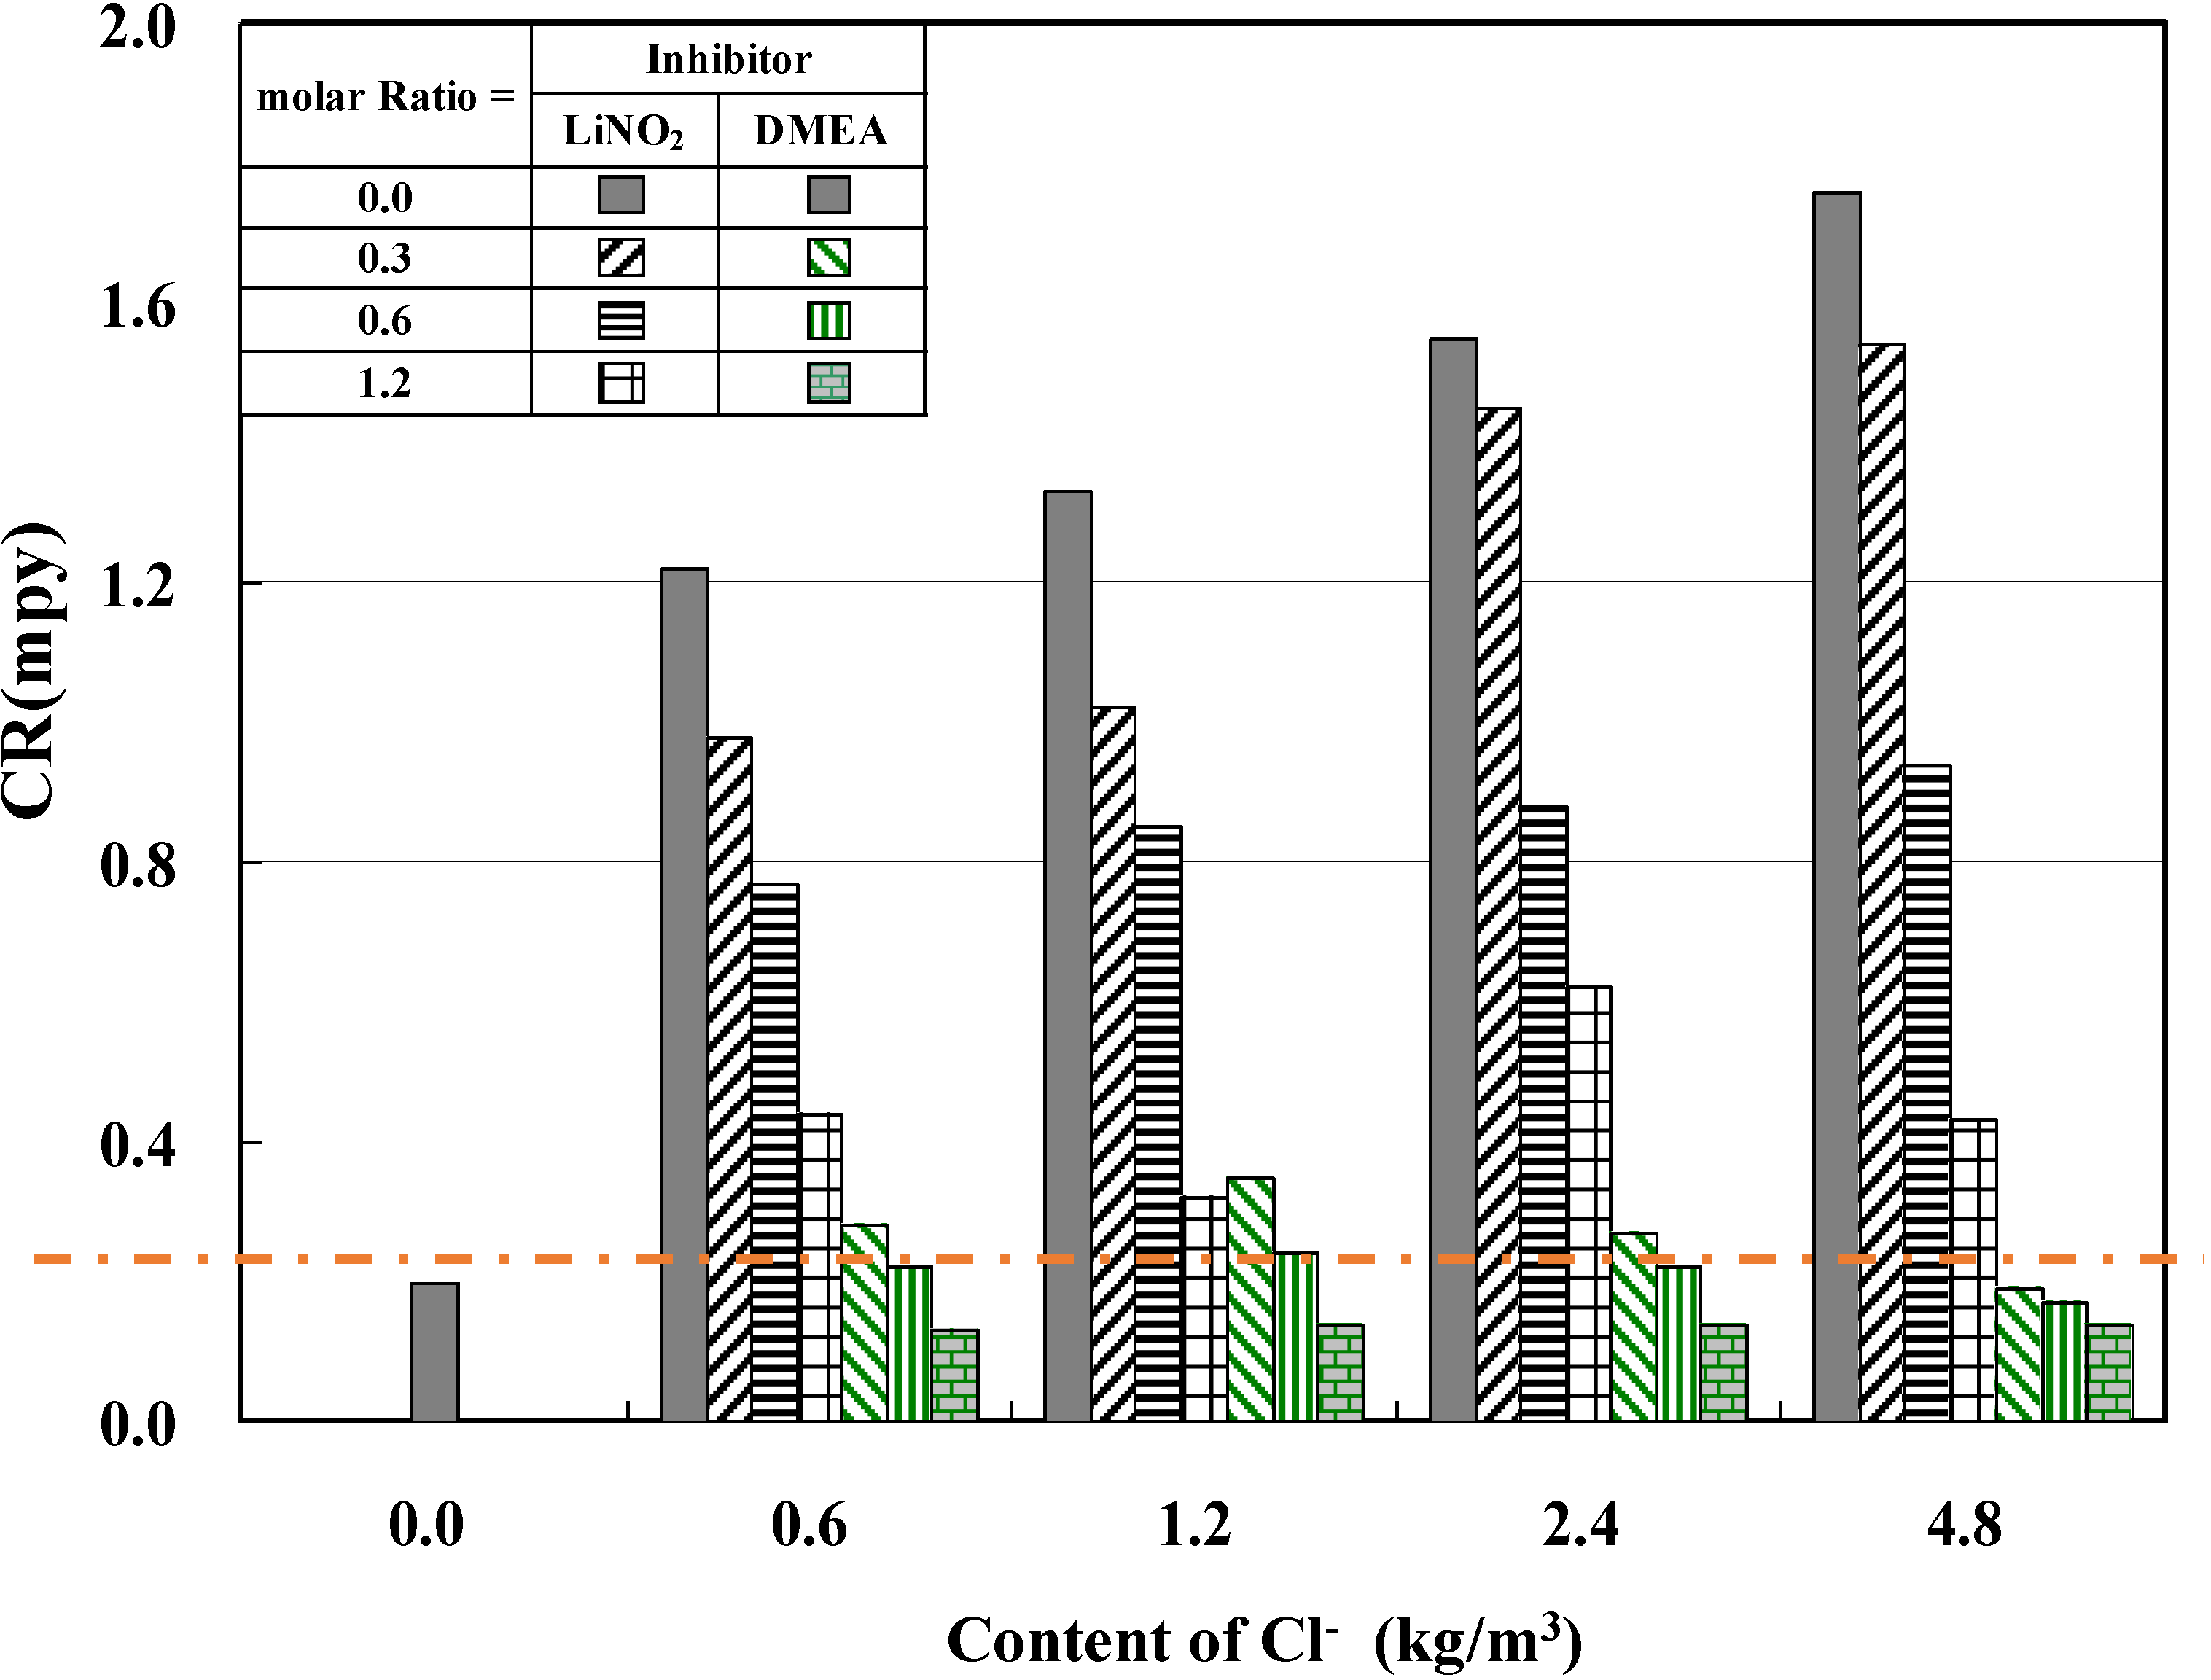
icorr is determined, the following equation, derived from Faraday’s law, can be used to calculate the corrosion rate [
25]:
The corrosion rate in Equation (2) is expressed in micrometers per year, μm/y. Icorr is the corrosion current density in µA·cm−2, obtained by dividing icorr with the exposed surface area of the measured specimen. E.W. is the equivalent weight of steel in g, and d is the density of steel in g/cm3.
The polarization resistance
Rp (Δ
E/Δ
I), which is the slope of the potential-current curve at
Ecorr, is related to
Icorr through the following Stern–Geary relationship [
26]:
βa and βc are the anodic and the cathodic Tafel constants, respectively, expressed in mV/decade of the current. Rp is expressed in KΩ·cm2. It is seen here that for the determination of Icorr in this technique, βa and βc are determined from the Tafel plot.
A potentiostat was used to measure the corrosion potential (Ecorr), corrosion current density (Icorr), and corrosion rate (CR). Also, the pore solution was prepared by adding NaCl to saturated calcium hydroxide (solubility of 0.173 g/100 mL at 20 °C). Concentrations of chloride ions (NaCl amount added) were set to 0.6 kg/m3, 1.2 kg/m3, 2.4 kg/m3, and 4.8 kg/m3, with the chloride-ion content used as standard for the prediction of the service life set to 1.2 kg/m3.
The types of corrosion inhibitors used were lithium nitrite (LiNO
2) and DMEA ((CH
3)
2NCH
2CH
2OH). The molar ratios of the anti-corrosion ingredients, based on the ratio of chloride to hydroxide ions, were set to 0.0, 0.3, 0.5, and 1.2 for the experiments. The lithium nitrite inhibitor used was a 25% solution of LiNO
2 and the amino alcohol inhibitor used was an 80% concentrated solution. The amounts to be added were calculated and the tests were performed accordingly.
Table 3 shows the different experimental parameters and their values. With respect to the chloride ion concentrations of 1.2 kg/m
3 and 2.4 kg/m
3, the chloride ion-dependent molar ratios of inhibitor to chloride were set to 0.0, 0.3, 0.6, and 1.2.
Table 1.
Physical properties of inhibitors.
Table 1.
Physical properties of inhibitors.
| Type | Main Component of Inhibitor | Specific Gravity | pH | Viscosity (cps) | Solid Content (%) |
|---|
| Lithium Nitrite inhibitor | LiNO2 | 1.12 | 11.5 | 13 | 25 |
| Amino Alcohol inhibitor | (CH3)2NCH2CH2OH | 1.07 | 11.9 | 11 | 80 |
Table 2.
Chemical composition of reinforcing steel (%).
Table 2.
Chemical composition of reinforcing steel (%).
| C | Si | Mn | P | S | Ni | Cr | Mo | Cu | Sn |
|---|
| 0.24 | 0.26 | 0.95 | 0.016 | 0.008 | 0.03 | 0.04 | 0.01 | 0.02 | 0.0005 |
Table 3.
Experimental testing parameters conditions.
Table 3.
Experimental testing parameters conditions.
| No. | Content of Cl− (kg/m3) | Lithium Nitrite Inhibitor | Amino Alcohol Inhibitor |
|---|
| LiNO2 | (CH3)2NCH2CH2OH |
|---|
| Molar Ratio | Addition | Molar Ratio | Addition |
|---|
| [Cl−]/[NO2−] | kg/m3 | [Cl−]/[OH−] | kg/m3 |
|---|
| 1 | 0.0 | 0.0 | 0.00 | 0.0 | 0.00 |
| 2 | 0.6 | 0.0 | 0.00 | 0.0 | 0.00 |
| 3 | 0.3 | 1.08 | 0.3 | 0.45 |
| 4 | 0.6 | 2.15 | 0.6 | 0.91 |
| 5 | 1.2 | 4.30 | 1.2 | 1.81 |
| 6 | 1.2 | 0 | 0.00 | 0.0 | 0.00 |
| 7 | 0.3 | 2.15 | 0.3 | 0.91 |
| 8 | 0.6 | 4.30 | 0.6 | 1.81 |
| 9 | 1.2 | 8.60 | 1.2 | 3.62 |
| 10 | 2.4 | 0.0 | 0.00 | 0.0 | 0.00 |
| 11 | 0.3 | 4.30 | 0.3 | 1.81 |
| 12 | 0.6 | 8.60 | 0.6 | 3.62 |
| 13 | 1.2 | 17.21 | 1.2 | 7.24 |
| 14 | 4.8 | 0.0 | 0.00 | 0.0 | 0.00 |
| 15 | 0.3 | 8.60 | 0.3 | 3.62 |
| 16 | 0.6 | 17.21 | 0.6 | 7.24 |
| 17 | 1.2 | 34.41 | 1.2 | 14.48 |
Tests were carried out first on reinforcing steel specimens in solutions that contain different inhibitor and NaCl concentrations to determine the best molar ratio for the inhibitor before the second stage was carried out. The second stage involved studying the effect of the best inhibitor molar ratio calculated from stage one on the anti-corrosion protection of reinforcing steel in concrete that was subjected to chloride attack.
To suggest an effective measure for reinforcing steel corrosion inhibition inside concrete, the reinforcing steel corrosion conditions were examined after corrosion acceleration of the reinforced concrete had taken place. The corrosion acceleration of the reinforcing steel in concrete was done using an autoclave. The autoclave method is an accelerated corrosion method that conforms to Korean standard KS F 2599-1 [
11].
For a reinforced concrete specimen, the corrosion potentials were measured by using the half-cell potential technique, and the corrosion-area ratio was calculated by confirming the reinforcing steel corrosion conditions after the application of the accelerated corrosion method for reinforced concrete. The amount of water-soluble chloride, which directly affects reinforcing steel corrosion, was measured using a potentiometric titration apparatus, in accordance with ASTM C 1218 [
27]. Then, the results were analyzed.
Table 4 shows the composition and the physical properties of the cement and
Table 5 shows the physical properties of the aggregates. The mix proportion of the concrete is indicated in
Table 6. The tests were conducted using coarse aggregate with a nominal maximum size of 25 mm, a water to cement ratio of 0.60, and a unit cement amount of 300 kg/m
3. The size of the test specimens was 40 × 40 × 160 mm
3.
Table 4.
Chemical composition and physical properties of cement. LOI: Loss on ignition.
Table 4.
Chemical composition and physical properties of cement. LOI: Loss on ignition.
| Chemical Composition (%) | Specific Surface (cm2/g) |
|---|
| SiO2 | Al2O3 | Fe2O3 | CaO | MgO | SO3 | LOI |
|---|
| 21.95 | 6.59 | 2.81 | 60.12 | 3.32 | 2.11 | 2.58 | 3.14 |
Table 5.
Physical properties of aggregates.
Table 5.
Physical properties of aggregates.
| Type | Density (kg/m3) | Absorption (%) | Fineness Modulus |
|---|
| Fine aggregate | 2.58 | 1.34 | 2.57 |
| Coarse aggregate | 2.70 | 1.4 | 6.83 |
Table 6.
Mix proportion of concrete. W/C: water–cement ratio; S/a: fine aggregate percentage.
Table 6.
Mix proportion of concrete. W/C: water–cement ratio; S/a: fine aggregate percentage.
| W/C (%) | Air (%) | S/a (%) | Weight Mixing (kg/m3) |
|---|
| Water (kg/m3) | Cement (kg/m3) | Fine Aggregates (kg/m3) | Coarse Aggregates (kg/m3) | Admixture (C × %) |
|---|
| 60 | 4.5 | 43 | 186 | 300 | 836 | 1033 | 0.5 |
3.2. Electrochemical Testing of Anti-Corrosion Properties
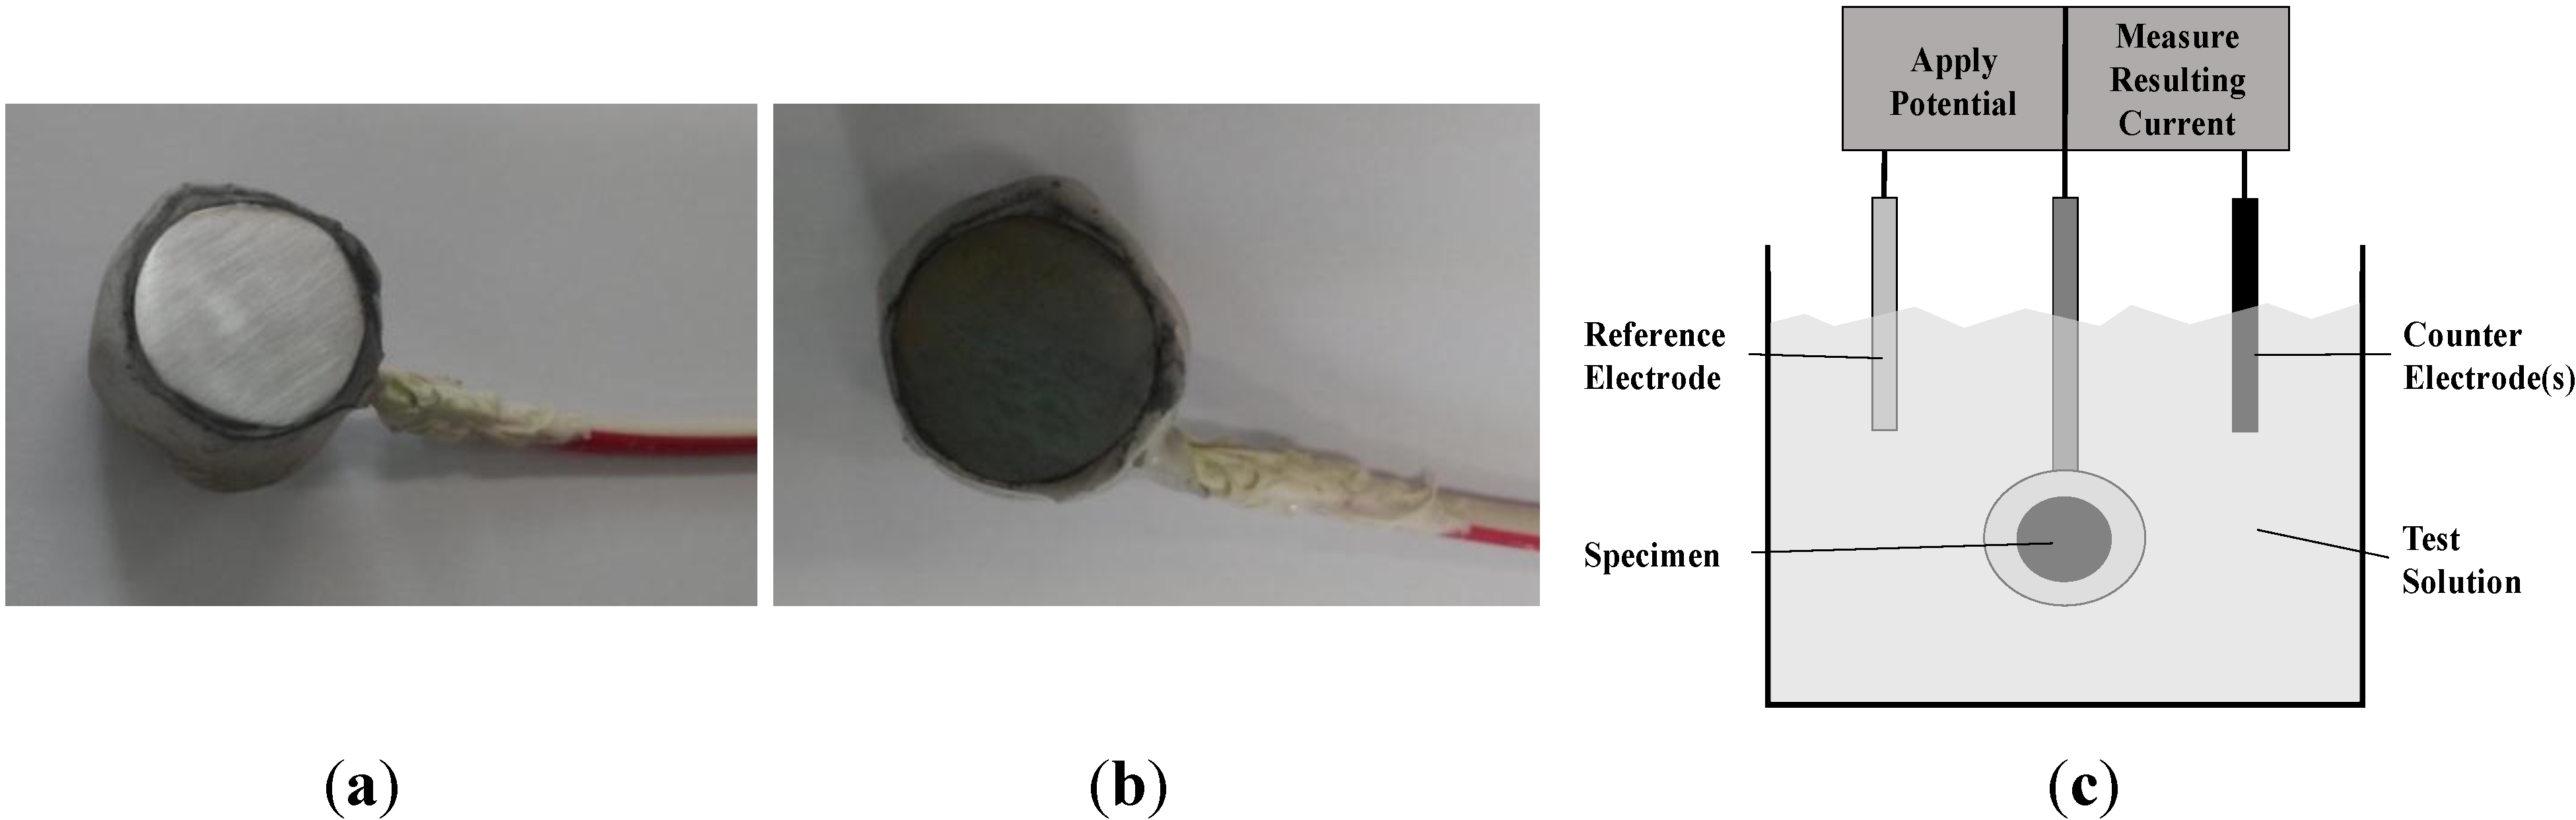
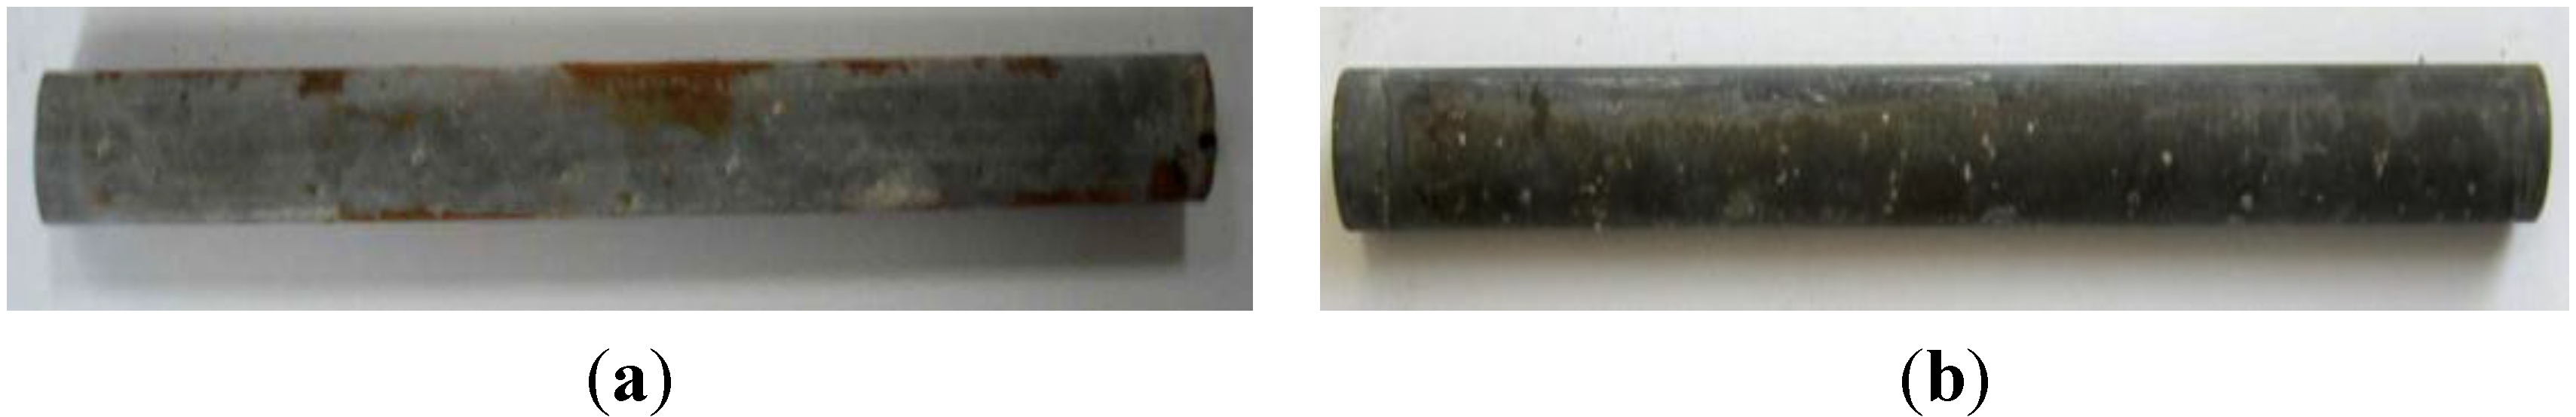
To measure the corrosion status of reinforcing steel in NaCl solution, a circular reinforcing steel section with a diameter of 10 mm was cut to a length of 10 mm and a wire was welded on one side to provide an electrical contact. After that, the entire specimen was insulated with a silicone coating except for the areas needed for the measurement of the electrochemical characteristics. The prepared specimen was soaked in CaOH
2 solution for 10 min in order to reach a stable state before testing. The electrochemical properties, such as the corrosion potential and corrosion rate, were then measured.
Figure 2 shows photos of the reinforcing steel specimen before and after the accelerated corrosion procedure and a schematic diagram of the test rig used in the experiments.
Figure 3 shows the details of the reinforced concrete specimen.
Figure 2.
Reinforcing steel specimen and schematic diagram of the test rig. (a) Specimen (Before); (b) Specimen (After); (c) Schematic diagram of the potentiostat.
Figure 2.
Reinforcing steel specimen and schematic diagram of the test rig. (a) Specimen (Before); (b) Specimen (After); (c) Schematic diagram of the potentiostat.
Figure 3.
Details of test specimen.
Figure 3.
Details of test specimen.
3.2.1. Interpretation of Tafel Plot Curves
Qualitative determination of the level of corrosion protection of the reinforcing steel can be done by calculating the corrosion current density as in Equation (2). The corrosion rate then can be calculated as in Equation (1). In the experiments, 10 mV/min was used as the potential sweep rate for the corrosion current density measurements and the potential-difference range was set to 0–1000 mV.
3.2.2. Experiments on Reinforcing Steel Anti-Corrosion Properties by the Accelerated-Corrosion Method
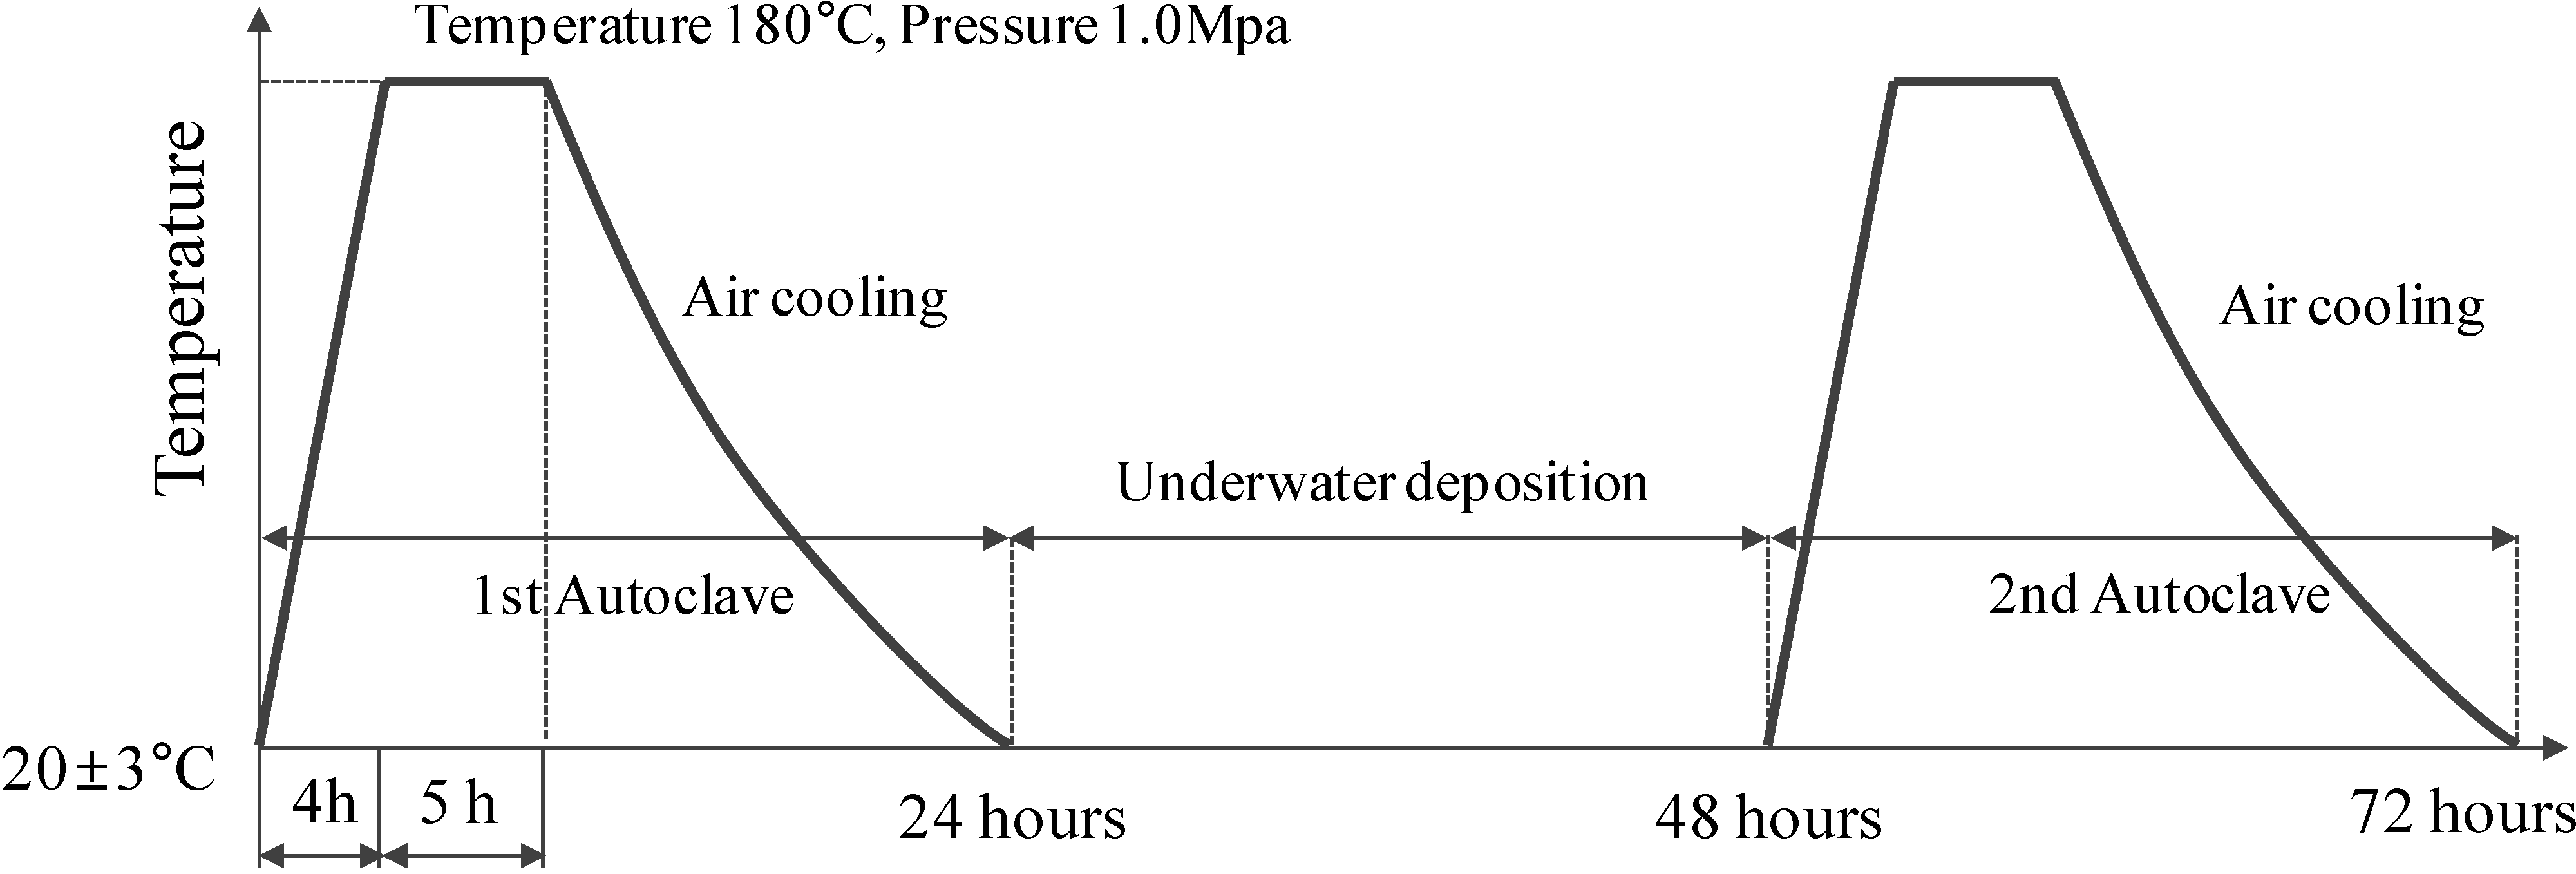
As shown in
Figure 4, the corrosion of a reinforced concrete specimen was accelerated by the autoclave accelerated method, in accordance with autoclave accelerated corrosion test [
11].
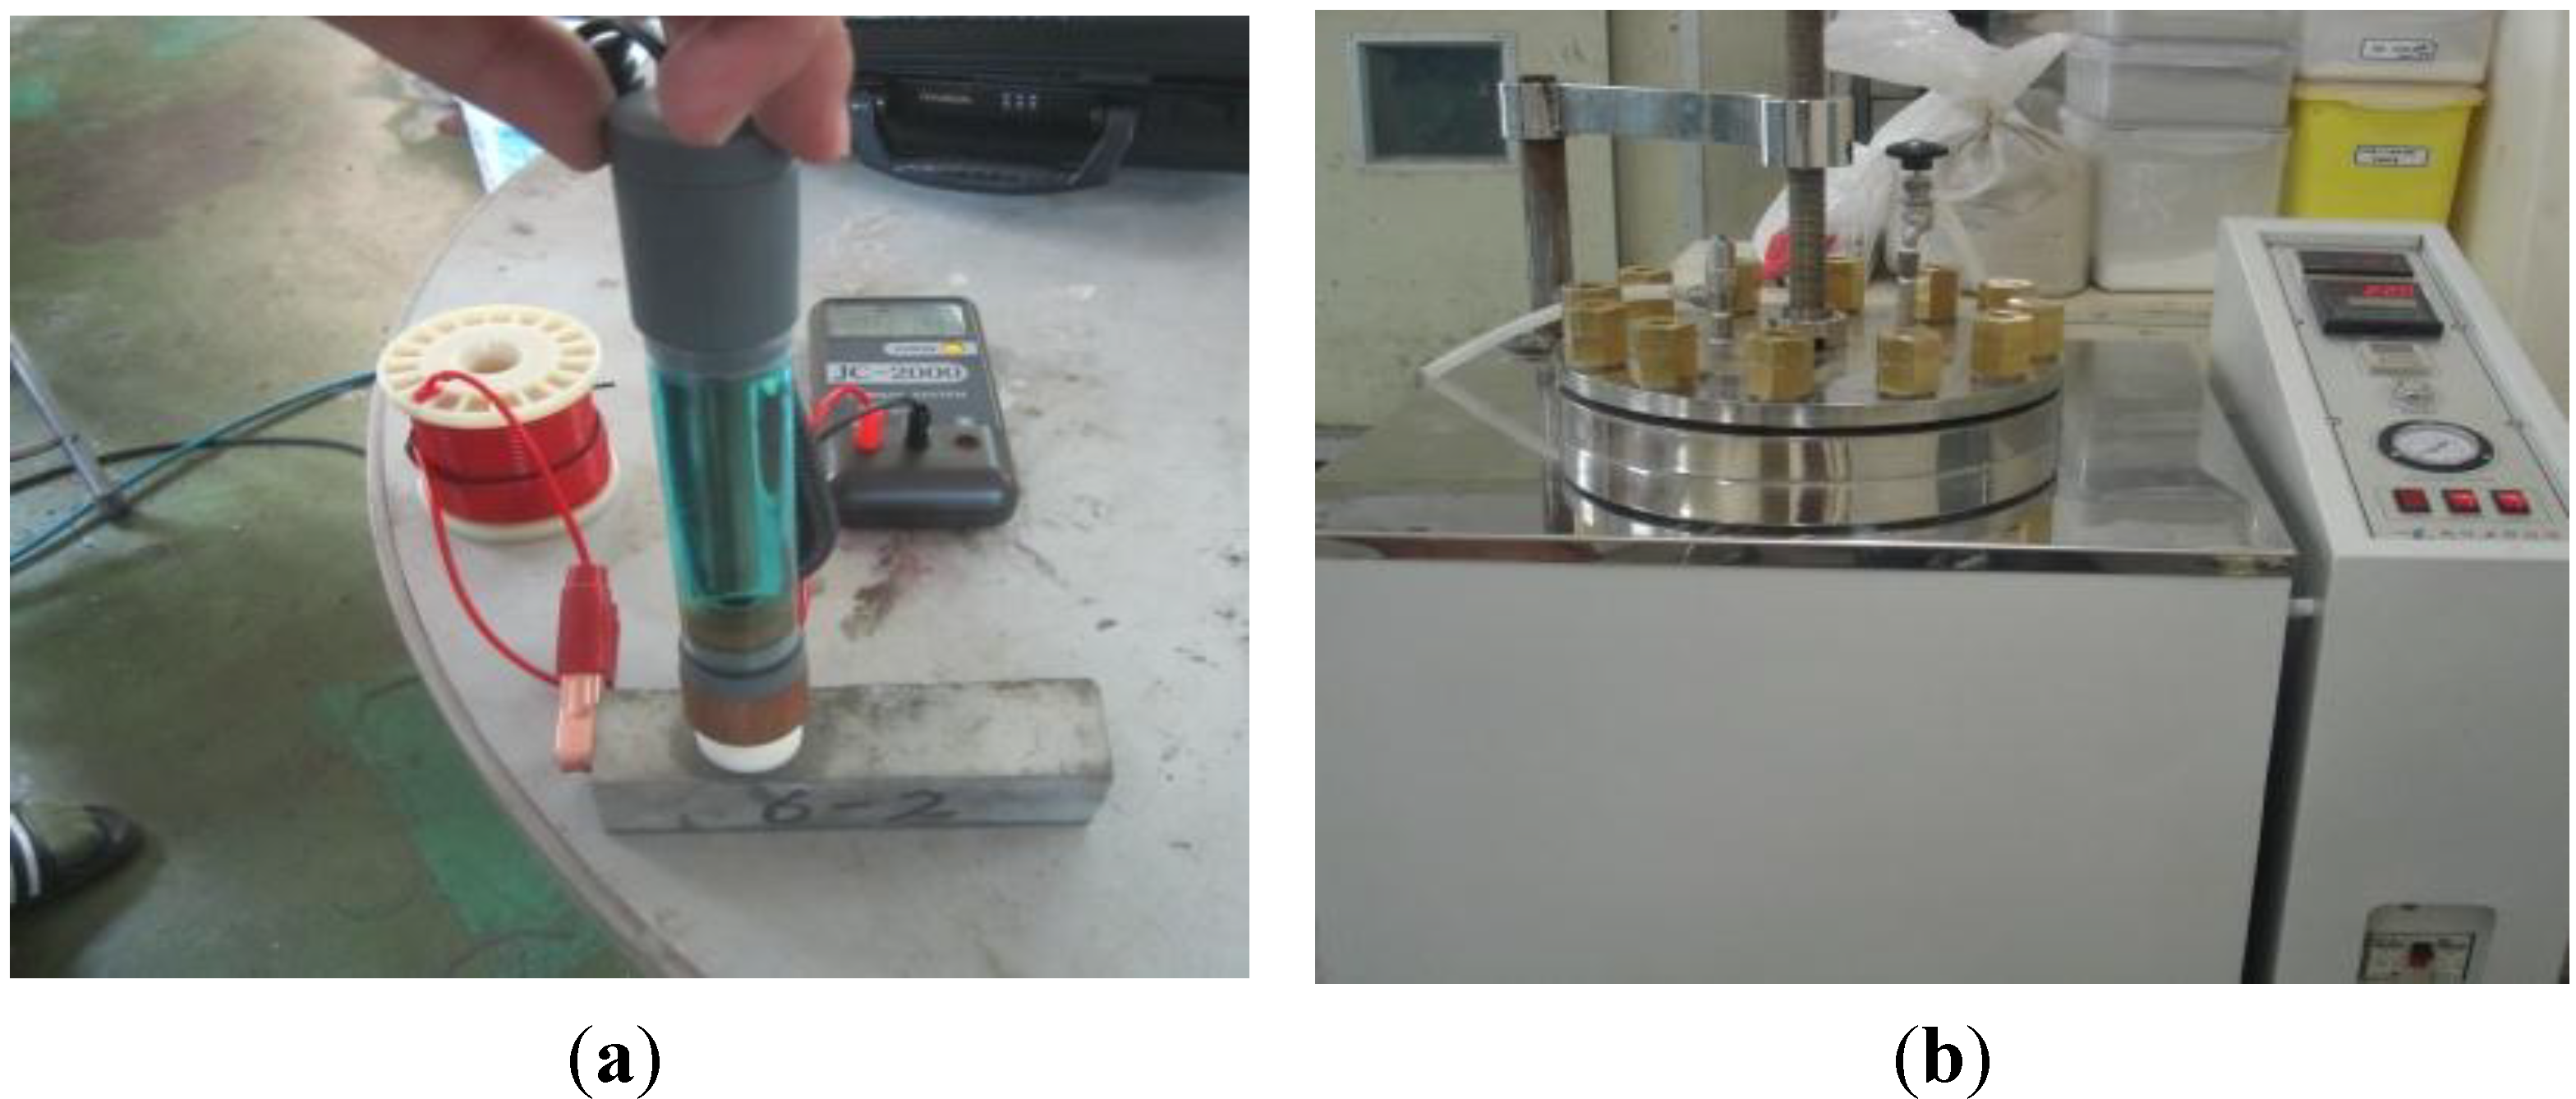
Figure 5 shows the procedure for measuring the reinforcing steel anti-corrosion properties with: “
Figure 5a” measuring the corrosion potential; “
Figure 5b” the autoclave-accelerated corrosion test, and then the determination of the soluble chloride content using the potentiometric titration apparatus.
After the completion of the accelerated corrosion tests, the corrosion potentials were measured by the half-cell potential technique, as shown in
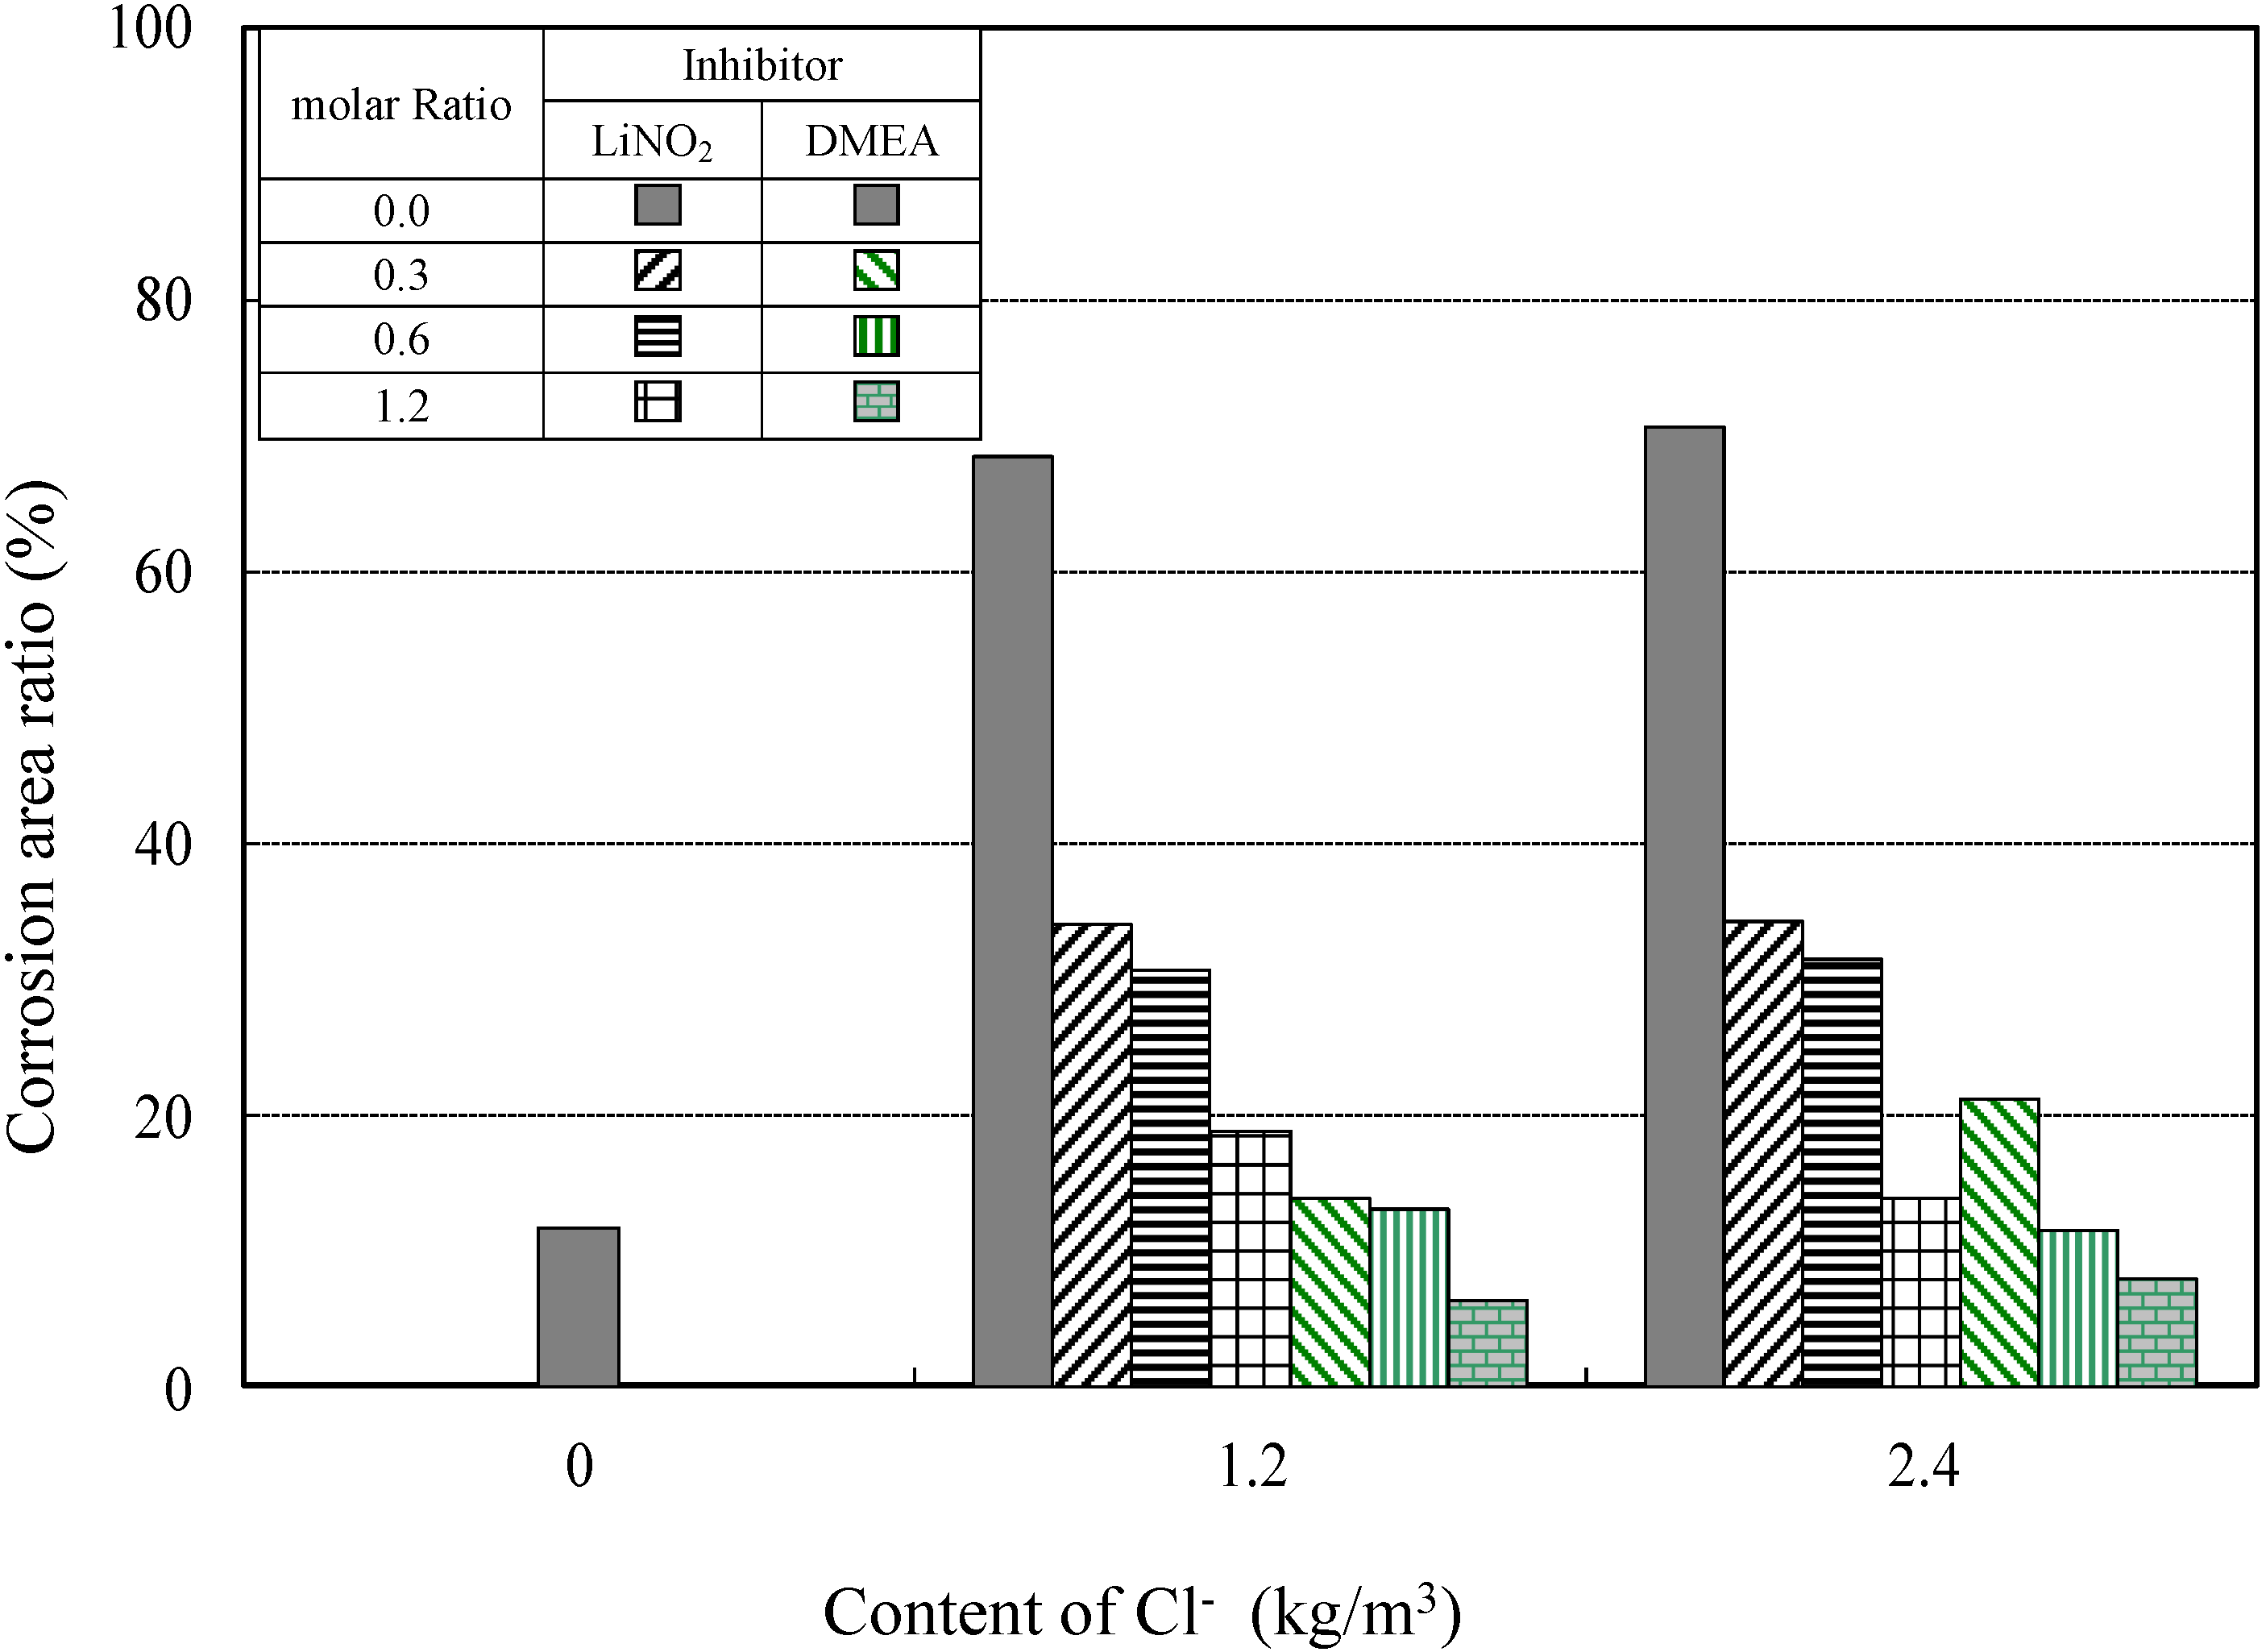
Figure 5, and the corrosion/area ratio was estimated by scanning the corrosion shape with a transparent sheet and using automated area-measurement software.
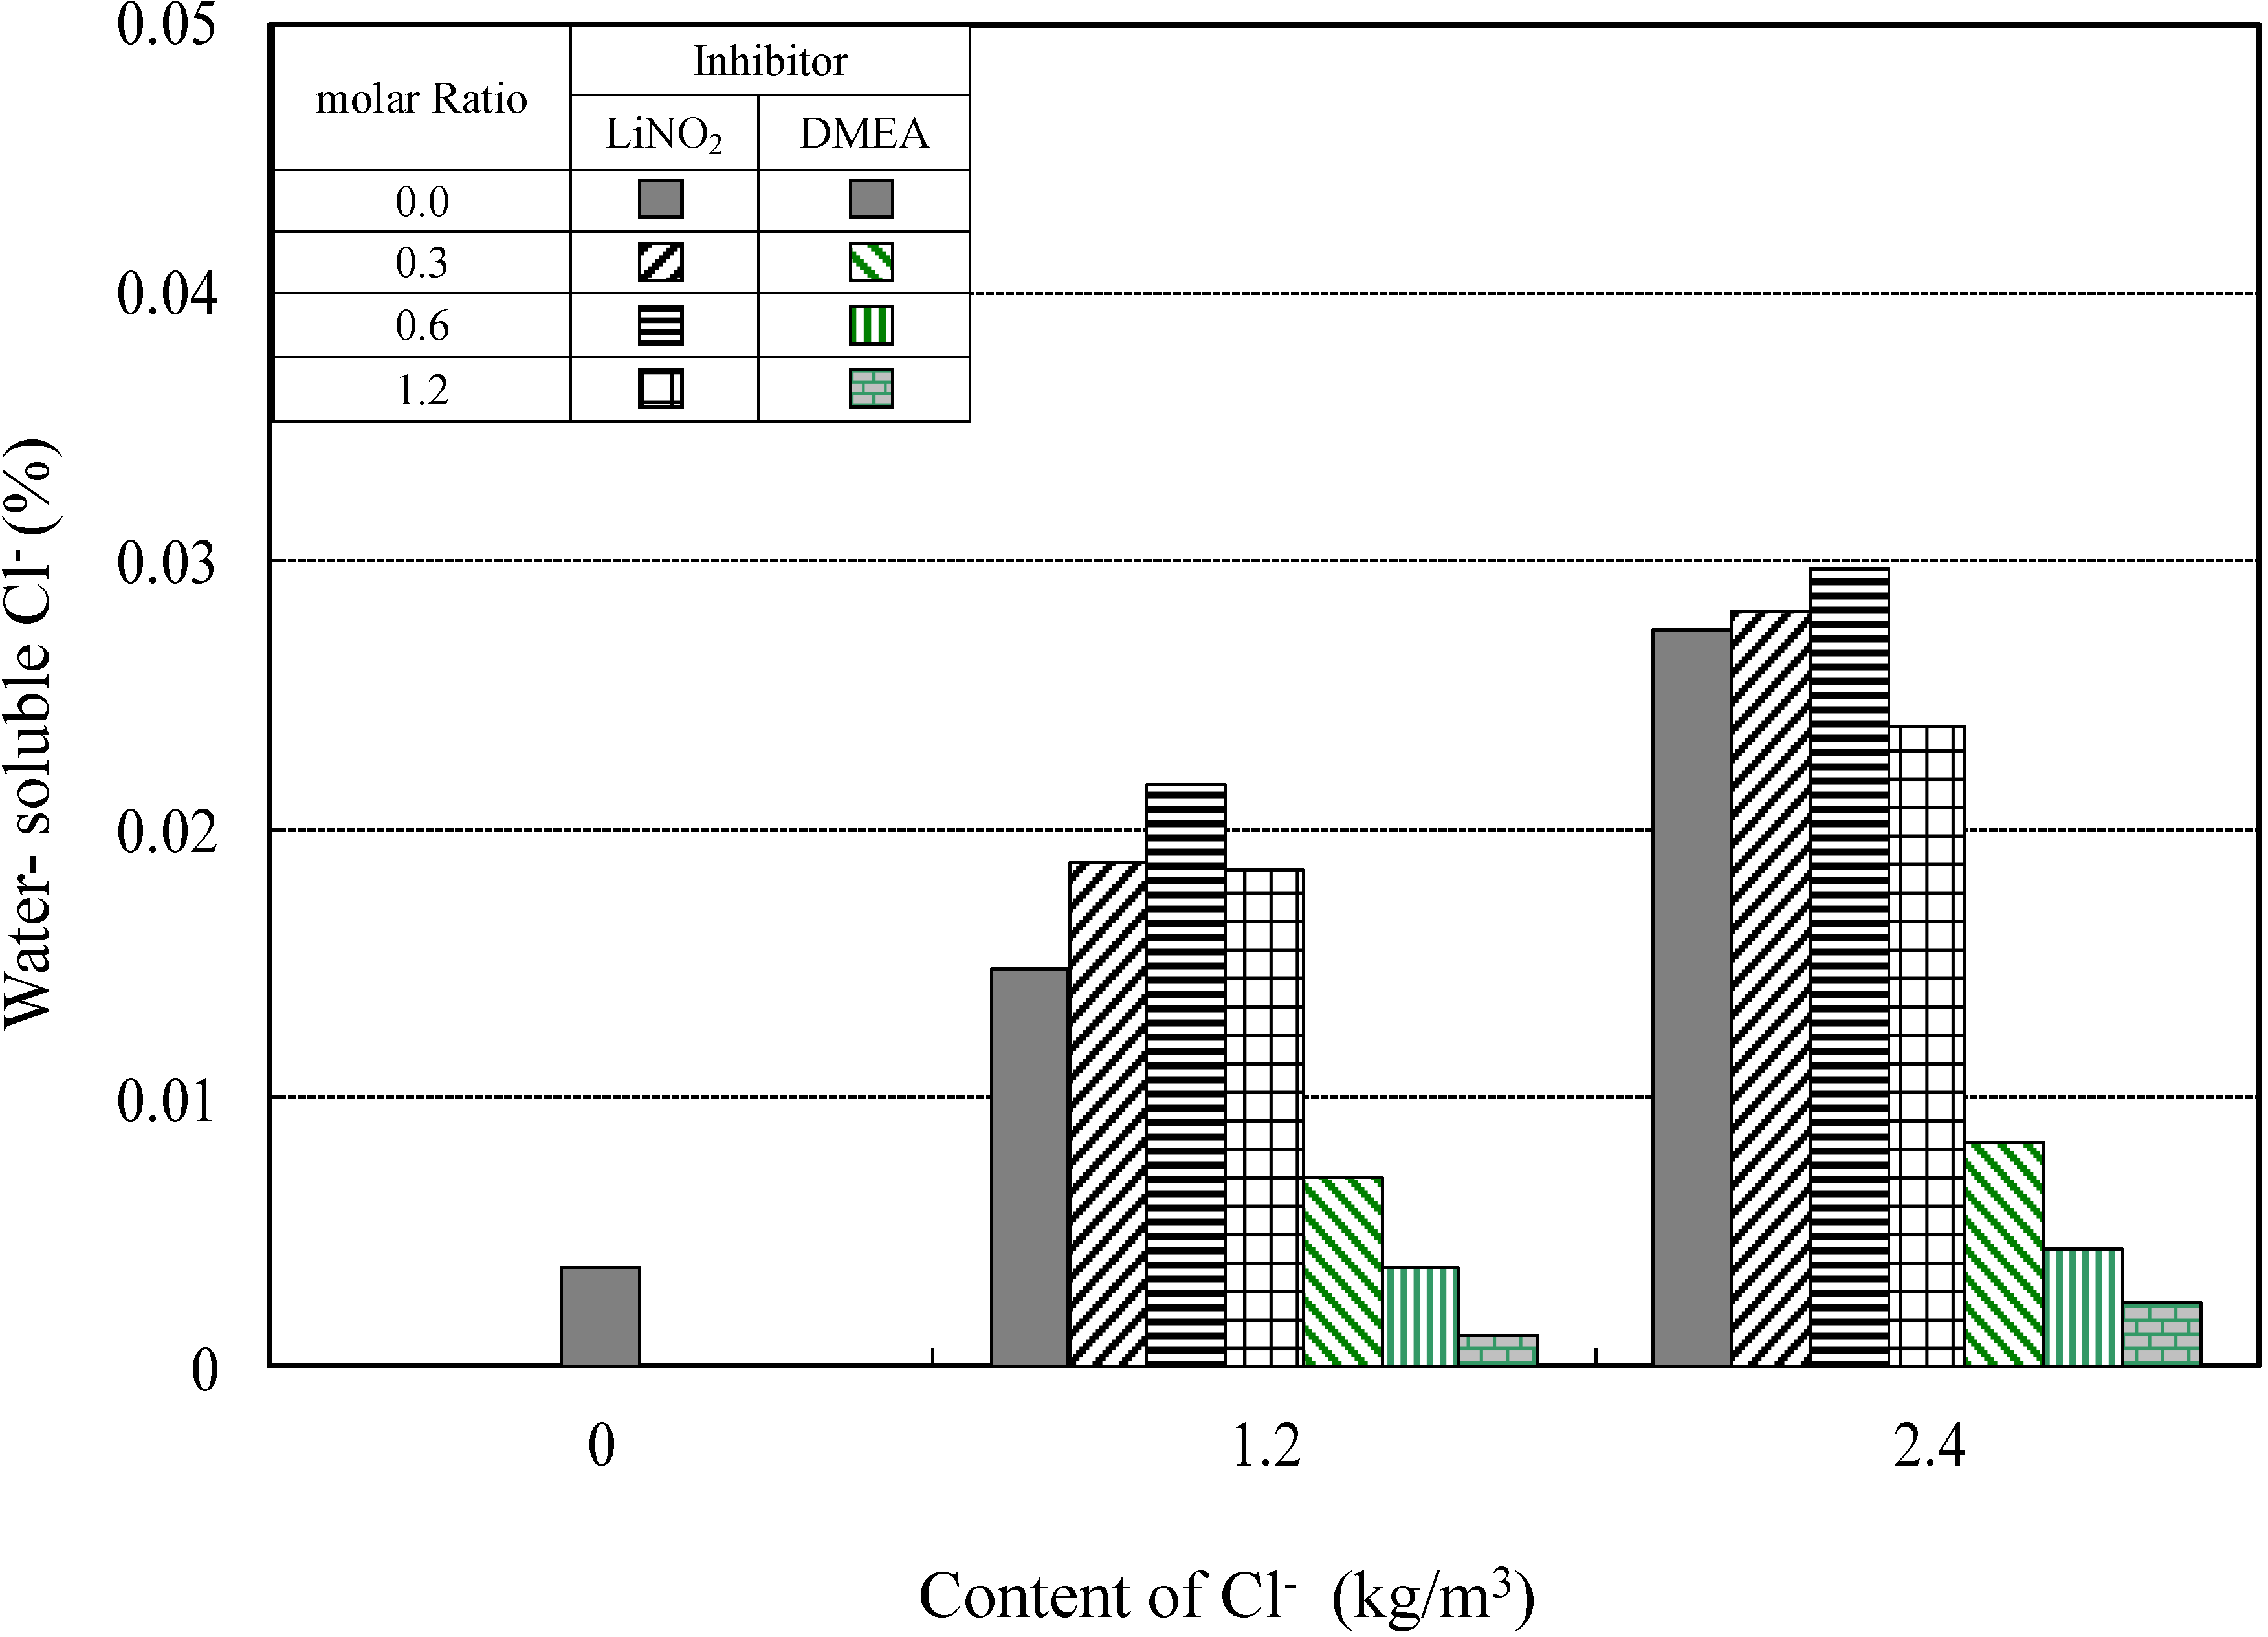
For measuring the water-soluble chloride content, which has a direct impact on reinforcing steel corrosion, a potentiometric titration apparatus was used in accordance with the ASTM C 1218 guidelines [
27]. For the measurements of the water-soluble chloride content after accelerated corrosion, the test specimen was split using a universal testing machine, and a 10 g powder sample at a distance of 10 mm from the surface of the concrete was collected, again in accordance with ASTM C 1218 [
27]. The 10-g powder sample was well mixed in a beaker with 50 mL of ion-exchange solution. Next, approximately 3 mL of hydrogen peroxide (H
2O
2) was added to eliminate any effects of sulfides. To prevent any changes in the chloride concentration originating from evaporation of the sample filtrate, heating for 5 min took place with a watch glass cover. The sample was then kept under atmospheric conditions for 24 h, after which the chloride extract was filtered with a filtering assembly. The chloride content was measured using a potentiometric titration apparatus and the water-soluble chloride content in the specimen was quantified.
Figure 4.
Temperature profile of autoclave-accelerated corrosion.
Figure 4.
Temperature profile of autoclave-accelerated corrosion.
Figure 5.
Procedures for testing the anti-corrosion characteristics. (a) Measurement of the corrosion potential; (b) Accelerated corrosion by autoclave.
Figure 5.
Procedures for testing the anti-corrosion characteristics. (a) Measurement of the corrosion potential; (b) Accelerated corrosion by autoclave.


