1. Introduction
Dressings are applied on open wounds to protect them from injuries and bacteria invasion. An ideal dressing should maintain a moist environment at the wound interface, allow gaseous exchange, act as a barrier to microorganisms, and remove excess exudates. It should also be non-toxic, non-allergenic, non-adherent and be easily removed without trauma; it should be made from a readily available biomaterial that requires minimal processing, possesses antimicrobial properties and promotes wound healing. Dressings made from natural or semisynthetic polymers are increasingly used to deliver drugs to acute, chronic and other types of wounds.
Chitin, chitosan, and their derivatives, prepared in various forms as hydrogels, nanofibers, membranes, micro/nanoparticles and sponges are promising biomaterials for wound dressing and other biomedical applications, such as drug and gene delivery, tissue engineering,
etc. [
1,
2,
3,
4,
5]. These have excellent properties being adhesive, biocompatible, biodegradable, nontoxic, hydrophilic, having also antimicrobial effect and oxygen permeability [
6,
7].
Chitosan stimulates cell proliferation and histoarchitectural tissue organization has hemostatic activity, which helps in natural blood clotting and blocks nerve endings, reducing pain. Chitosan gradually depolymerizes to release N-acetyl-beta-D-glucosamine, which initiates fibroblast proliferation, helps in ordered collagen deposition and stimulates increased levels of natural hyaluronic acid synthesis at the wound site. It also helps in faster wound healing and scar prevention [
8]. Both chitin and chitosan fibers show good mechanical properties as mechanical strength of 1.5–2.5 g/dtex and elongation at break 8%–20%, being unique as raw materials for hi-tech bandages [
9].
Hyaluronic acid (HA) exhibits an enhanced lubricating and water adsorption capacity influencing water retention and cellular events, such as attachment, migration and proliferation [
10]. It has been used in ophthalmic surgery, arthritis treatment, in tissue engineering, as component of scaffolds for wound healing and implant devices [
11]. The implants covered with HA and its derivatives reduce adsorption, adhesion and cellular proliferation of
Staphylococcus aureus at least 100 times [
12].
To further improve the chitosan (CS) properties and also to increase the ability as carriers for hydrophilic and lipophylic drugs, the chemical modification and copolymerization are applied, e.g., by reaction with thiazolidinone [
13] or by grafting with poly(N-isopropylacrylamide), to obtain temperature-responsive hydrogels [
14], by quaternization, grafting with alkyl aldehydes or alkyl ketones, to produce N-alkyl chitosan, with fatty acids, steroid derivatives, poly(ε-caprolactone) as was reviewed by Riva
et al. [
15,
16,
17]. CS-glutamate, CS-succinate, and CS-phthalate provide sustained release in basic medium [
18]. There are also studies on chitosan conjugation with different drugs, such as CS-5-fluorouridine conjugate [
19] or CS-alendronate conjugate [
20]. CS-doxorubicin conjugation was carried out using succinic anhydride as a crosslinker. Trastuzumab was conjugated to self-assembled CS-doxorubicin conjugate (CS-DOX) nanoparticles (particle size, 200 nm) via thiolation of lysine residues and subsequent linking of the resulted thiols to chitosan. The monoclonal antibody, trastuzumab, was used as a targeting agent in nanoparticles carrying the antitumor drug, doxorubicin, specifically to its site of action [
21]. The mucoadhesive property of CS, especially in an acidic (<pH 6.0) environment, was increased by conjugating an aromatic sulfonamide group at the C2-N position of chitosan. The CS-4-carboxybenzene sulfonamide conjugate showed antibacterial activity against
Escherichia coli and
Staphylococcus aureus [
22,
23].
Polyelectrolyte complexes (PECs) can be obtained by electrostatic interaction of amino groups C
2 position in glucopyranosic units of CS with anionic groups (e.g., carboxyl) of polyanions of natural origin (such as pectine, alginate, carrageenan, xanthan gum, carboxymethyl cellulose, chondroitin sulfate, dextran sulfate, hyaluronic acid) or synthetic origin (e.g., polyacrylic acid, polyphosphoric acid, poly(L-lactide) [
24]. PECs shows a very important sensibility at swelling, especially by pH modification, comparatively with covalently crosslinked hydrogels, which lead to the wide variety of applications [
25]. PECs protects HA against enzymatic hydrolysis but only at pH values different of the optimum for enzymatic activity. PEC CS/HA as sponges and films allow the culture of various specific cells as keratocytes, which produces skin matrix accelerating wound healing after skin ablation without inflammatory reactions and toxicity for animals [
26]. PEC obtained from chitosan and alginate can be applied to bandages or powders, which protect the wound, accelerates healing and prevent bacterial contamination [
27]. Increase of the HA amount weakened the water vapor permeability, bovine albumin adsorption, and fibroblast adhesion, which are desirable characteristics for wound dressing. Comparatively with Vaseline, CS/HA films are more efficient in wound healing because they do not cause damage to the wound when the bandage is removed [
28]. A wet treatment can be realized and both components of PEC contribute through their properties to the enhanced antimicrobial activity, and prevent wound damage during treatment. Polyelectrolyte complexation occurs under mild reaction conditions. PEC hydrogels exhibit a highly pH-sensitive swelling, therefore, they can be used for pH-controlled drug delivery in different conditions. The addition of HA to chitosans (chitosan hydrochloride and 5-methyl-pyrrolidinone chitosan) leads to a reduction in wound dressing hydration properties and a modulation of drug release [
29].
Sulfonamides and their derivatives are among the most useful antimicrobial agents because of their low cost, low toxicity and excellent activity against bacterial infections [
30]. Sulfadiazine (SDZ) is useful in the treatment of meningoccocal, staphyloccocal, streptococcal,
etc. infections.
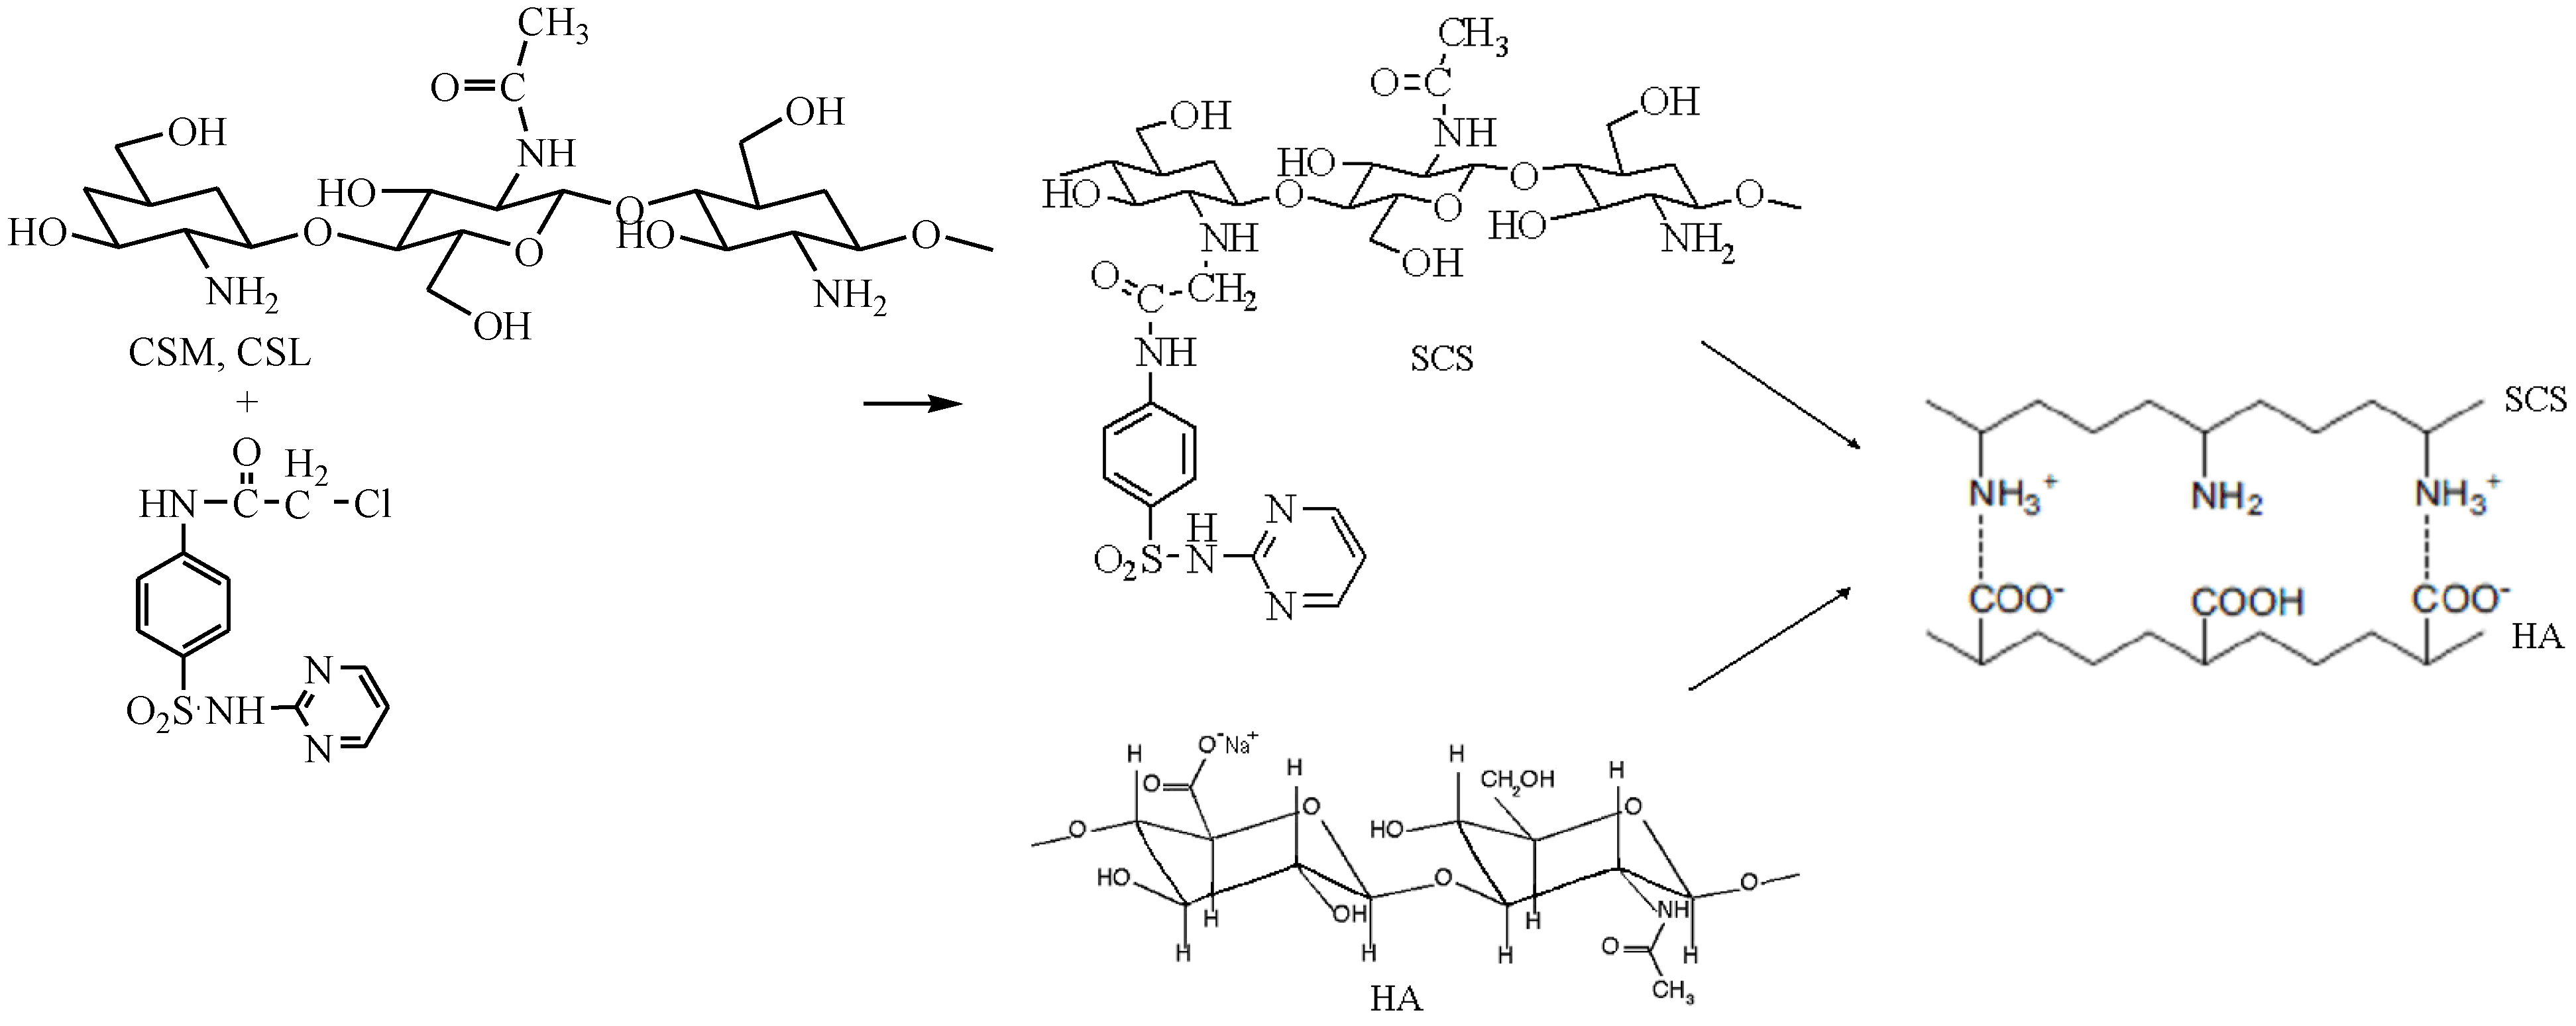
Based on this action, sulfadiazine was selected to modify CS and to obtain formulations with modified and retarded antimicrobial action. The aim of this study is to develop new polyelectrolyte complexes based on a new sulfadiazine-chitosan conjugate (SCS) with hyaluronic acid, as a new way to combine the bacteriostatic effect of chitosan with that of sulfadiazine, to control properties, drug release and also to improve the antimicrobial properties for wound healing application compared with CS/HA PECs in the treatment of the burn wounds.
2. Results and Discussion
2.1. Preparation of SCS/HA PEC Sponges
PECs are formed based on the ionic interactions established between two oppositely charged polyelectrolytes, thus the pH value of the solution has to be controlled in order to ensure that both molecules are on the charged form. The suitable pH of the buffer solution for obtaining CS/HA and SCS/HA PECs depends on the pKa of the two polymers, namely the value of 6.5 reported for chitosan [
31] and 2.9 for hyaluronate [
32]. Selecting a pH between these two values, the requirements for obtaining PECs should be accomplished (
Figure 1).
Figure 1.
Formation of polyelectrolyte complexes (PECs) with sulfadiazine-chitosan conjugate (SCS) and sodium hyaluronate (HA).
Figure 1.
Formation of polyelectrolyte complexes (PECs) with sulfadiazine-chitosan conjugate (SCS) and sodium hyaluronate (HA).
The pH of 4.12 was chosen for the acetate buffer solution used to obtain the PECs, due to the chitosan poor solubility or low reaction yields obtained at other pHs (3, 3.5, 4.5 and 5). For example, at pH ~3, a coacervate was formed as gel spheres but the dry product obtained resulted in a low reaction yield of ~40% showing that ionic interactions established between the two oppositely charged polyelectrolytes were not sufficient to accomplish PEC formation, because at this pH value the carboxylic groups of HA are still mostly protonated. Because of the low level of amino groups protonation, the chitosan with medium molecular weight (MMW, DD of 77.56%) and SCSM (DS of 31.36%) had both a poor solubility at pHs 5 and 4.5 because of a low level of amino groups protonation at this pH. SCS has a poor solubility due to the lower number of amino groups that can be protonated at acidic pH, being substituted with SDZ.
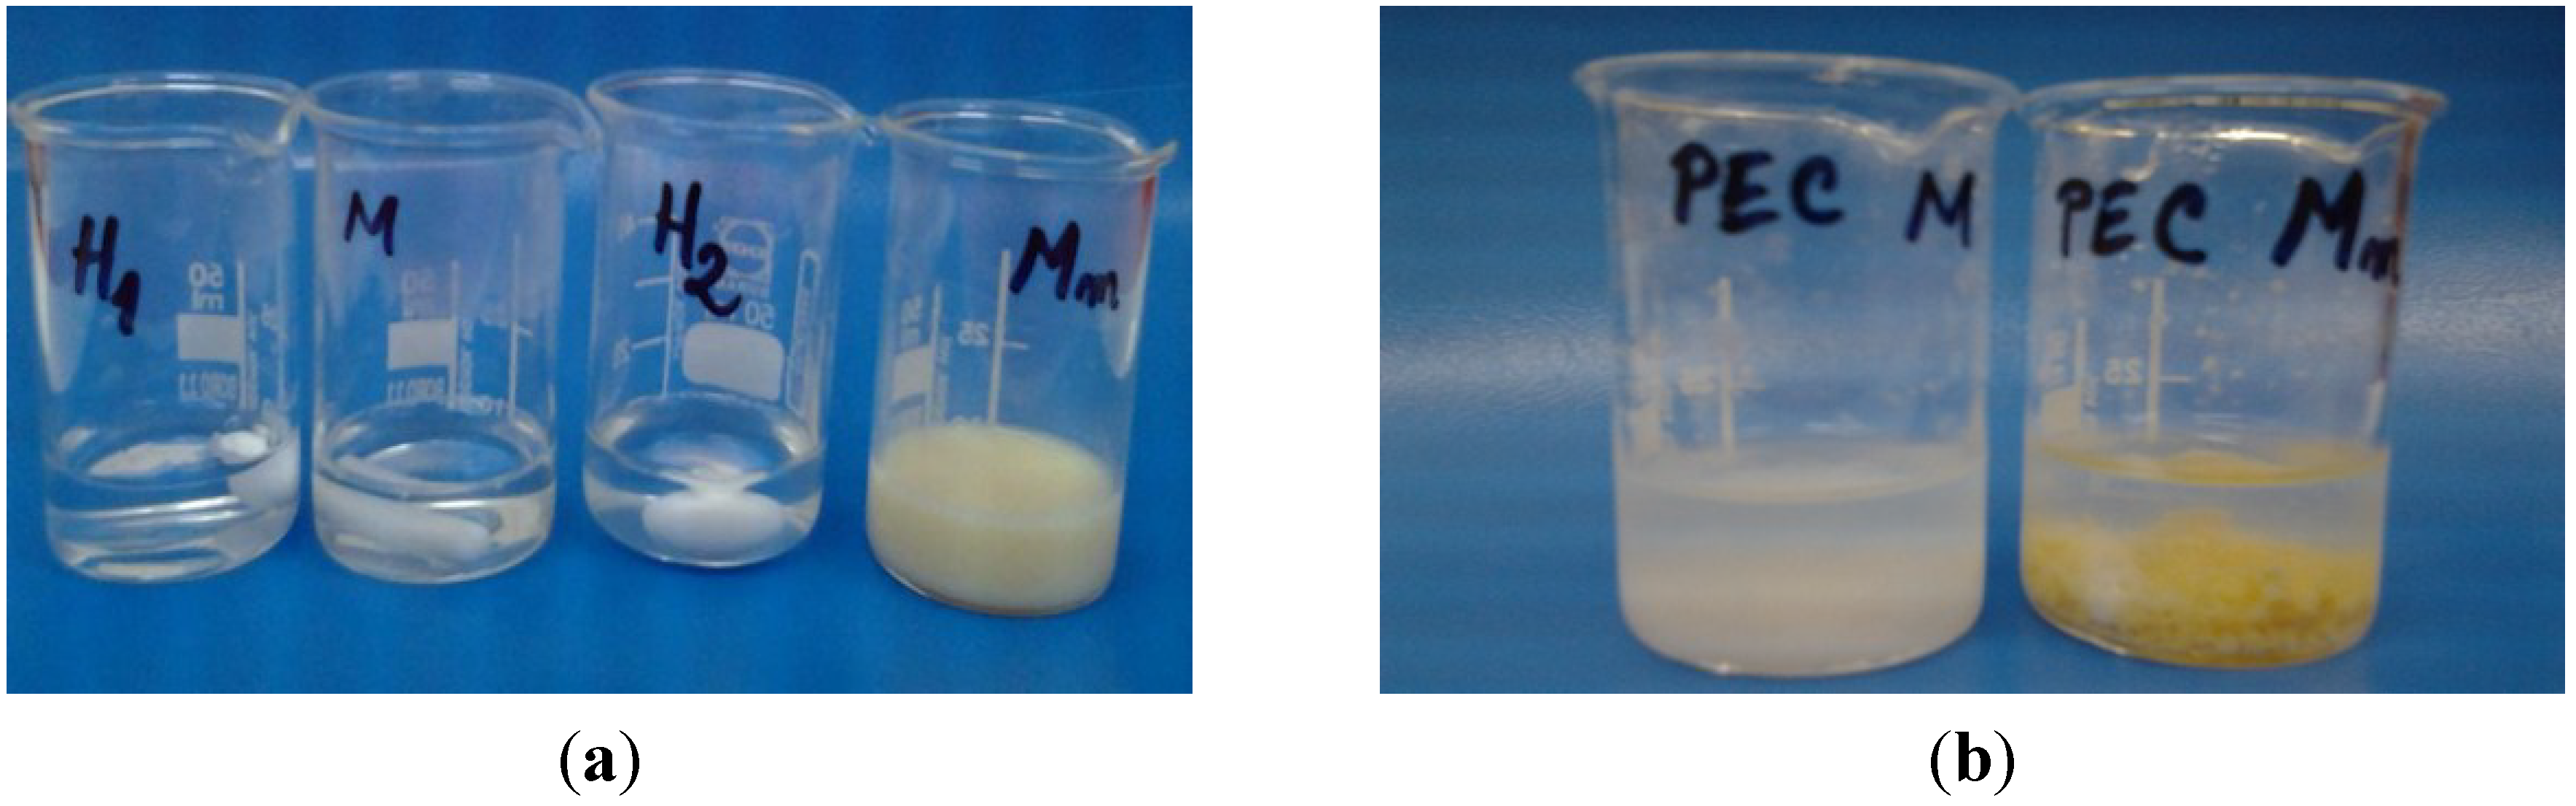
At pH 4.12, the CS and HA solutions were transparent and clear, while SCS (Mm) formed a turbid solution. In case of PECs prepared with chitosan the formation of a white precipitate was observed, while for PECs with sulfadiazine-modified chitosan (SCS) a light yellow precipitate was obtained (
Figure 2). The pH of the solution increased slightly, at 4.62 for PEC M formation and at 4.44 for PEC Mm, which is a proof that various bonds are involved in ionic complex formation. The reaction yields obtained at pH 4 after freeze-drying of the samples are given in
Table 1.
The aspect of the dried samples is like xerogels/aerogels for PEC L (chitosan low molecular weight—sodium haluronate) and PEC M (chitosan medium molecular weight—sodium hyaluronate), while PEC Lm (sulfadiazine modified chitosan low molecular weight—sodium hyaluronate) and PEC Mm (sulfadiazine modified chitosan medium molecular weight—sodium hyaluronate) are compact sponges. In the last case, it seems that in the case of sulfadiazine-modified chitosan complexes different kinds of specific interactions as ionic and hydrogen bonding are involved in complex formation therefore the PEC becomes more compact.
Figure 2.
Images of the chitosan (CS) -M, sulfadiazine modified chitosan (SCS) -Mm and sodium hyaluronate (HA) -H1, H2 solutions before mixing (a) and after polyelectrolyte complexes (PECs) formation (b).
Figure 2.
Images of the chitosan (CS) -M, sulfadiazine modified chitosan (SCS) -Mm and sodium hyaluronate (HA) -H1, H2 solutions before mixing (a) and after polyelectrolyte complexes (PECs) formation (b).
Table 1.
Reaction yields obtained at pH 4.12.
Table 1.
Reaction yields obtained at pH 4.12.
| PECs samples | Notation | Yield (%) |
|---|
| CSL:HA (1:1) | PEC L | 69.7 |
| CSM:HA (1:1) | PEC M | 65.9 |
| SCSL:HA (1:1) | PEC Lm | 71.6 |
| SCSM:HA (1:1) | PEC Mm | 78.7 |
2.2. FT-IR Spectroscopy
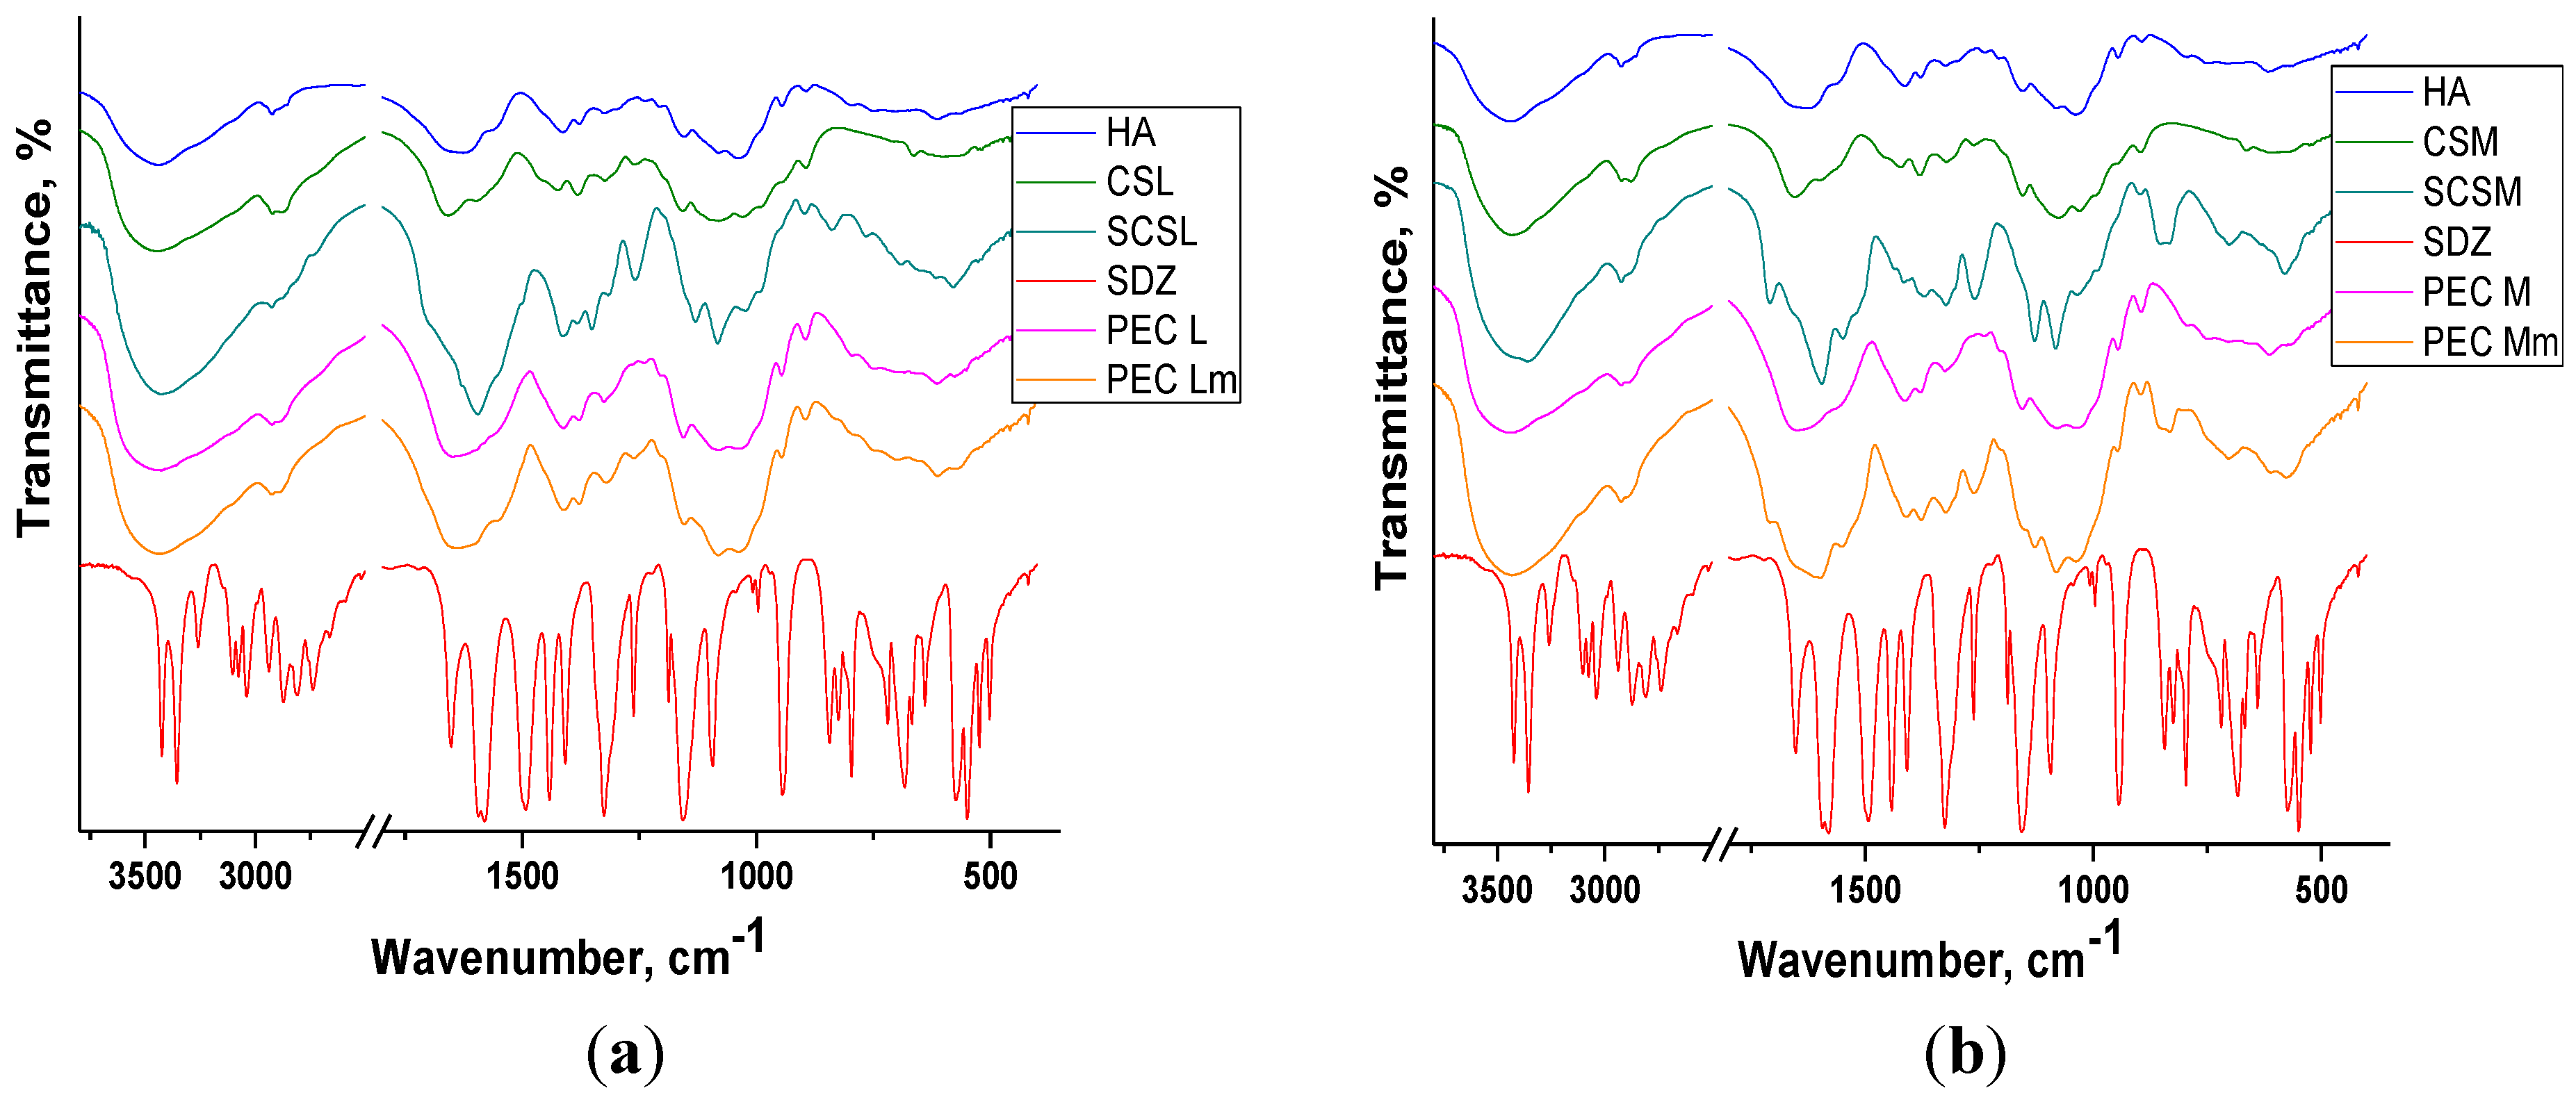
The FT-IR spectra obtained for the PECs prepared and their components are presented in
Figure 3a,b, in the spectral regions 2500–4000 cm
−1 and 900–1900 cm
−1, respectively. In the spectral region 2500–4000 cm
−1 there are two absorption bands typically exhibited by polysaccharides: the broad band situated between 3360–3450 cm
−1 assigned to the O–H stretching vibration (νOH) overlapped with the N-H stretching vibrations (νNH) and the band situated around 2921 cm
−1 assigned to C–H stretching vibrations (νCH).
The broad band assigned to polysacharidic OH groups from chitosan is shifted to lower wavenumbers in the spectra of both the sulfadiazine-modified CS (SCS) and of PECs showing the presence of interactions between components.
The spectrum of sodium hyaluronate (HA) and of chitosan (CS) exhibit a band at 1626–1658 cm−1 attributed to C=O stretching vibrations (amide I) from the acetylated units with a shoulder at 1562–1594 cm−1 corresponding to N–H bend of amide II overlapped with the N–H bending vibration of the amine groups present in the desacetylated units of chitosan.
In the spectra of sulfadiazine-modified chitosan (SCS) and of PECs prepared with SCS (PEC Lm and PEC Mm) the bands corresponding to sulfadiazine (SDZ) can be identified: C–H band (para) between 700–895 cm−1 or the more intense bands assigned to C–N stretch (aryl) at 1260 cm−1 and to S=O stretch at 1082 cm−1 and 1130 cm−1 and some other bands are shifted to lower wavenumbers. In the spectra of PEC Mm the bands assigned to SDZ are more intense than in PEC Lm spectra.
Figure 3.
FT-IR spectra of components and of PEC sponges based on (a) CSL/SCSL and (b) CSM/SCSM (PEG: polyelectrolyte complexes, CSL/SCSL: chitosan low molecular weight/sulfadiazine modified chitosan low molecular weight, CSM/SCSM: chitosan medium molecular weight/sulfadiazine modified chitosan medium molecular weight).
In PECs spectra the bands corresponding to components can be identified, frequently overlapped due to similar structures of the two polysaccharides, chitosan and hyaluronate. In all FT-IR spectra of PECs the bands are wider and slightly shifted compared with the corresponding bands assigned to components, which indicates the presence of interactions leading to PECs formation.
2.3. Swelling Study
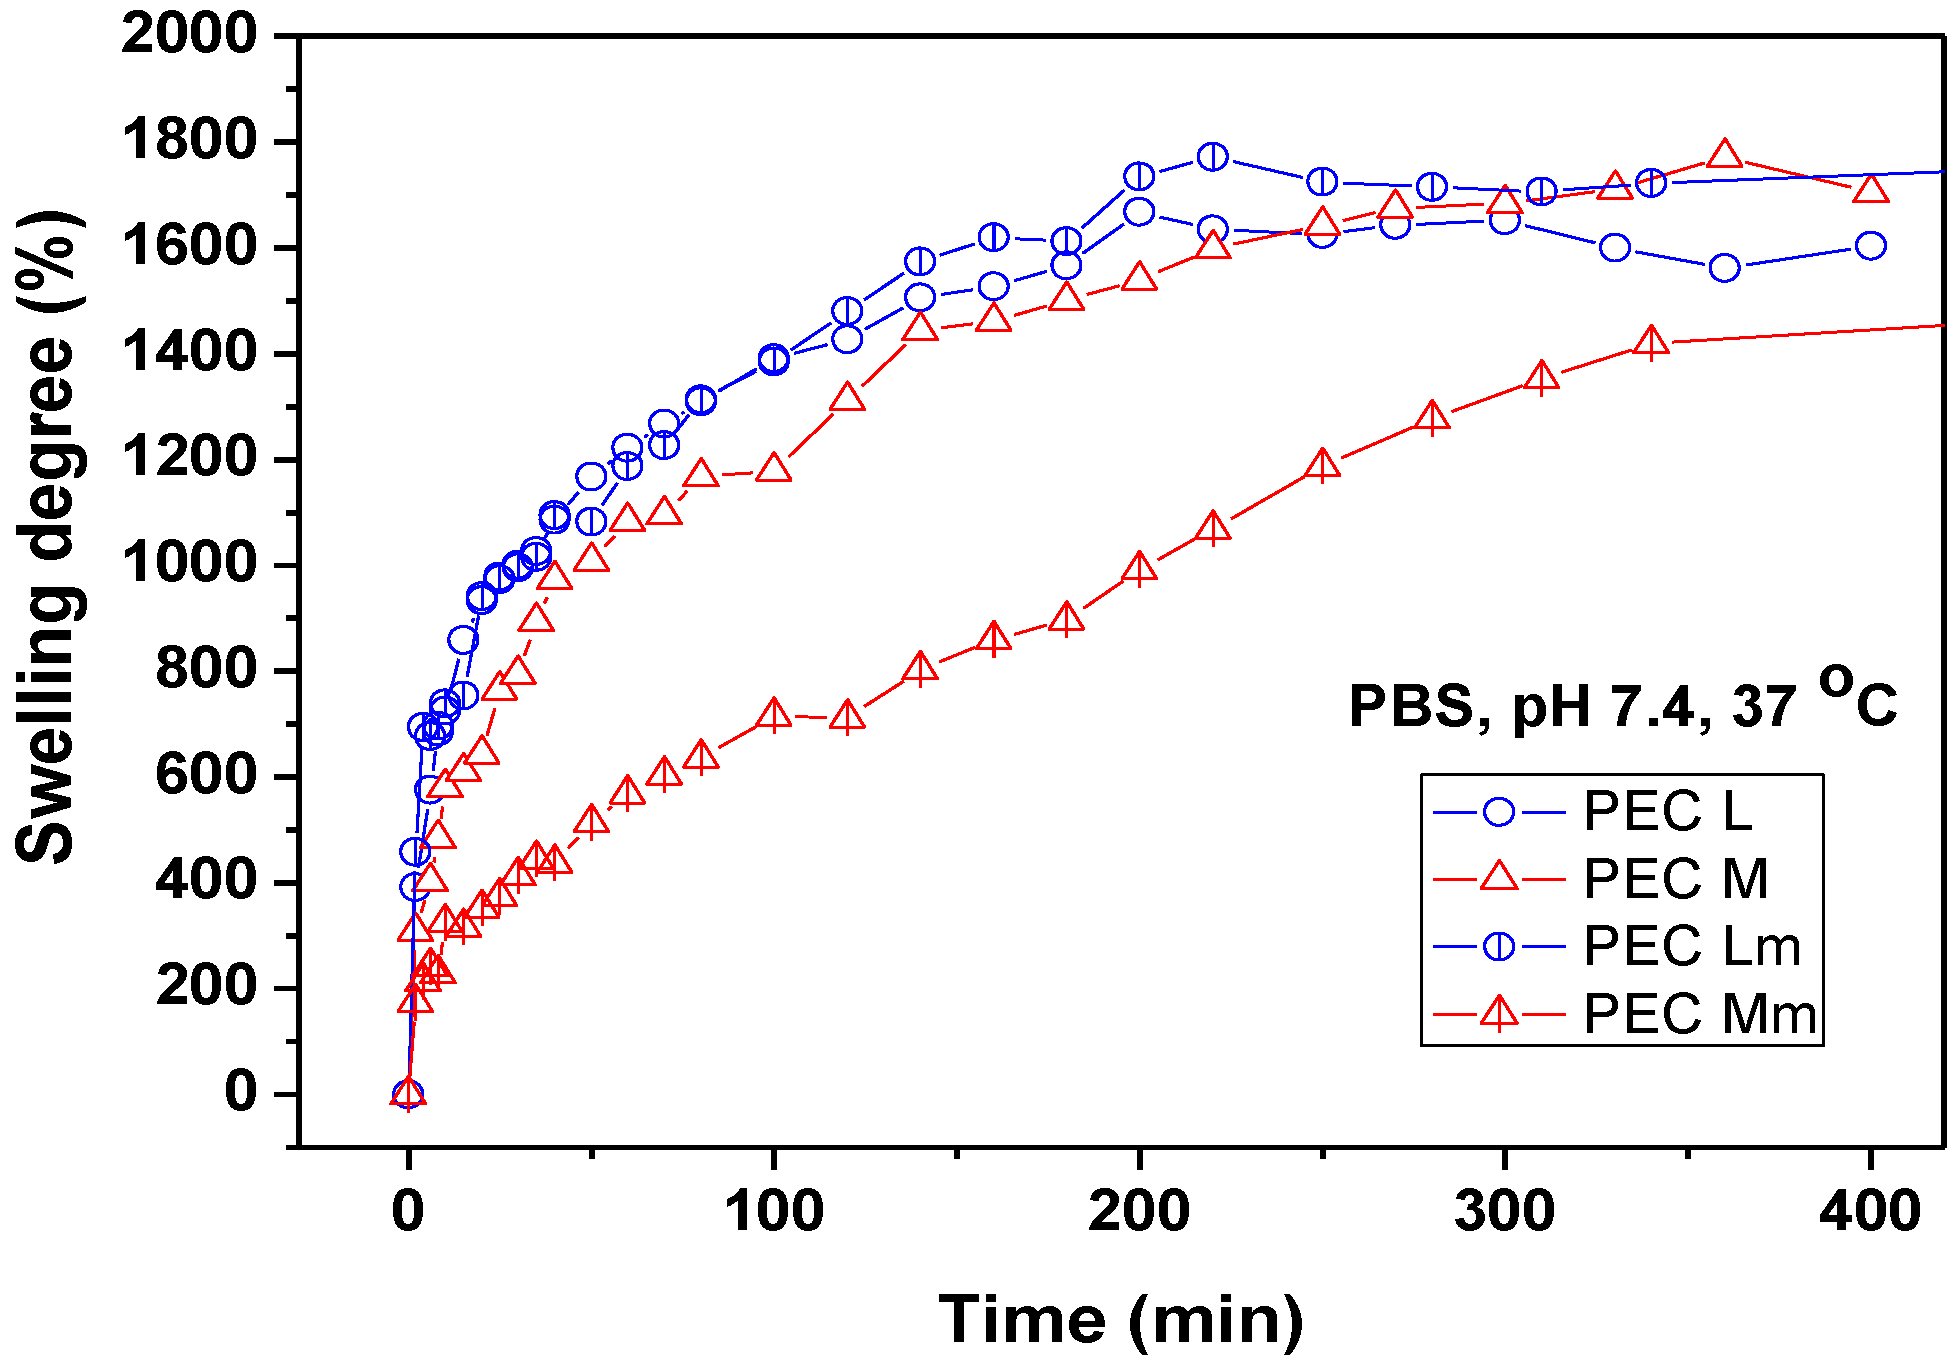
The swelling measurements performed for PEC samples in PBS of pH 7.4 at 37 °C (
Figure 4) showed the increased and faster swelling degree (SD) of PECs prepared with chitosan and PEC Lm up to ~1700% compared with PEC Mm, which reaches the maximum SD of ~1400% at a slower rate. The results obtained suggest that the prepared PEC sponges are quite hydrophilic, having an increased water uptake capacity. High swelling capacity is required for absorption of exudates and also to maintain a moist environment for good wound healing.
Figure 4.
Swelling behavior of PEC (polyelectrolyte complexe) sponges in PBS (phosphate buffered saline) pH 7.4 at 37 °C.
Figure 4.
Swelling behavior of PEC (polyelectrolyte complexe) sponges in PBS (phosphate buffered saline) pH 7.4 at 37 °C.
The swelling properties of the PECs can be explained based on the water-transfer mechanism and kinetics. The swelling kinetic parameters are summarized in
Table 2.
Table 2.
Swelling kinetic parameters of PEC sponges.
Table 2.
Swelling kinetic parameters of PEC sponges.
| Sample | n | R2 | k (minn) | R2 |
|---|
| PEC L | 0.33 | 0.999 | 18.76 × 10⁻² | 0.998 |
| PEC Lm | 0.3 | 0.998 | 20.69 × 10⁻² | 0.999 |
| PEC M | 0.36 | 0.999 | 13.45 × 10⁻² | 0.999 |
| PEC Mm | 0.43 | 0.998 | 6.32 × 10⁻² | 0.998 |
The diffusion exponent (n) values suggest that the swelling mechanism of PEC sponges takes place generally by an anomalous transport, which occurs by coupling Fickian diffusion with the relaxation of the hydrogel network. Exception is sample PEC Mm, which has a diffusion coefficient closer to 0.5 (n = 0.43), indicating the approach to a Fickian diffusion mechanism. PEC Mm presents the smoothest and slowest swelling profile among the investigated PECs, because of the lowest swelling rate constant value, of 6.32 × 10⁻² min−0.43, compared with the other three PECs investigated. This behavior upon swelling correlates with the slower release rate of the drug from this polymeric matrix.
The swelling behavior studies performed at pH 7.4 showed a lower stability of the PECs obtained with SCS compared with PECs prepared with neat CS. Both PEC Lm and PEC Mm maintained compact for weight measurements only up to 300–350 min at pH 7.4. Taking into consideration the results and observations from the swelling study, the drug release experiment was performed at acidic pH in order to be able to observe the prolonged SDZ release in time from SCS-based PECs.
2.4. Scanning Electron Microscopy (SEM)
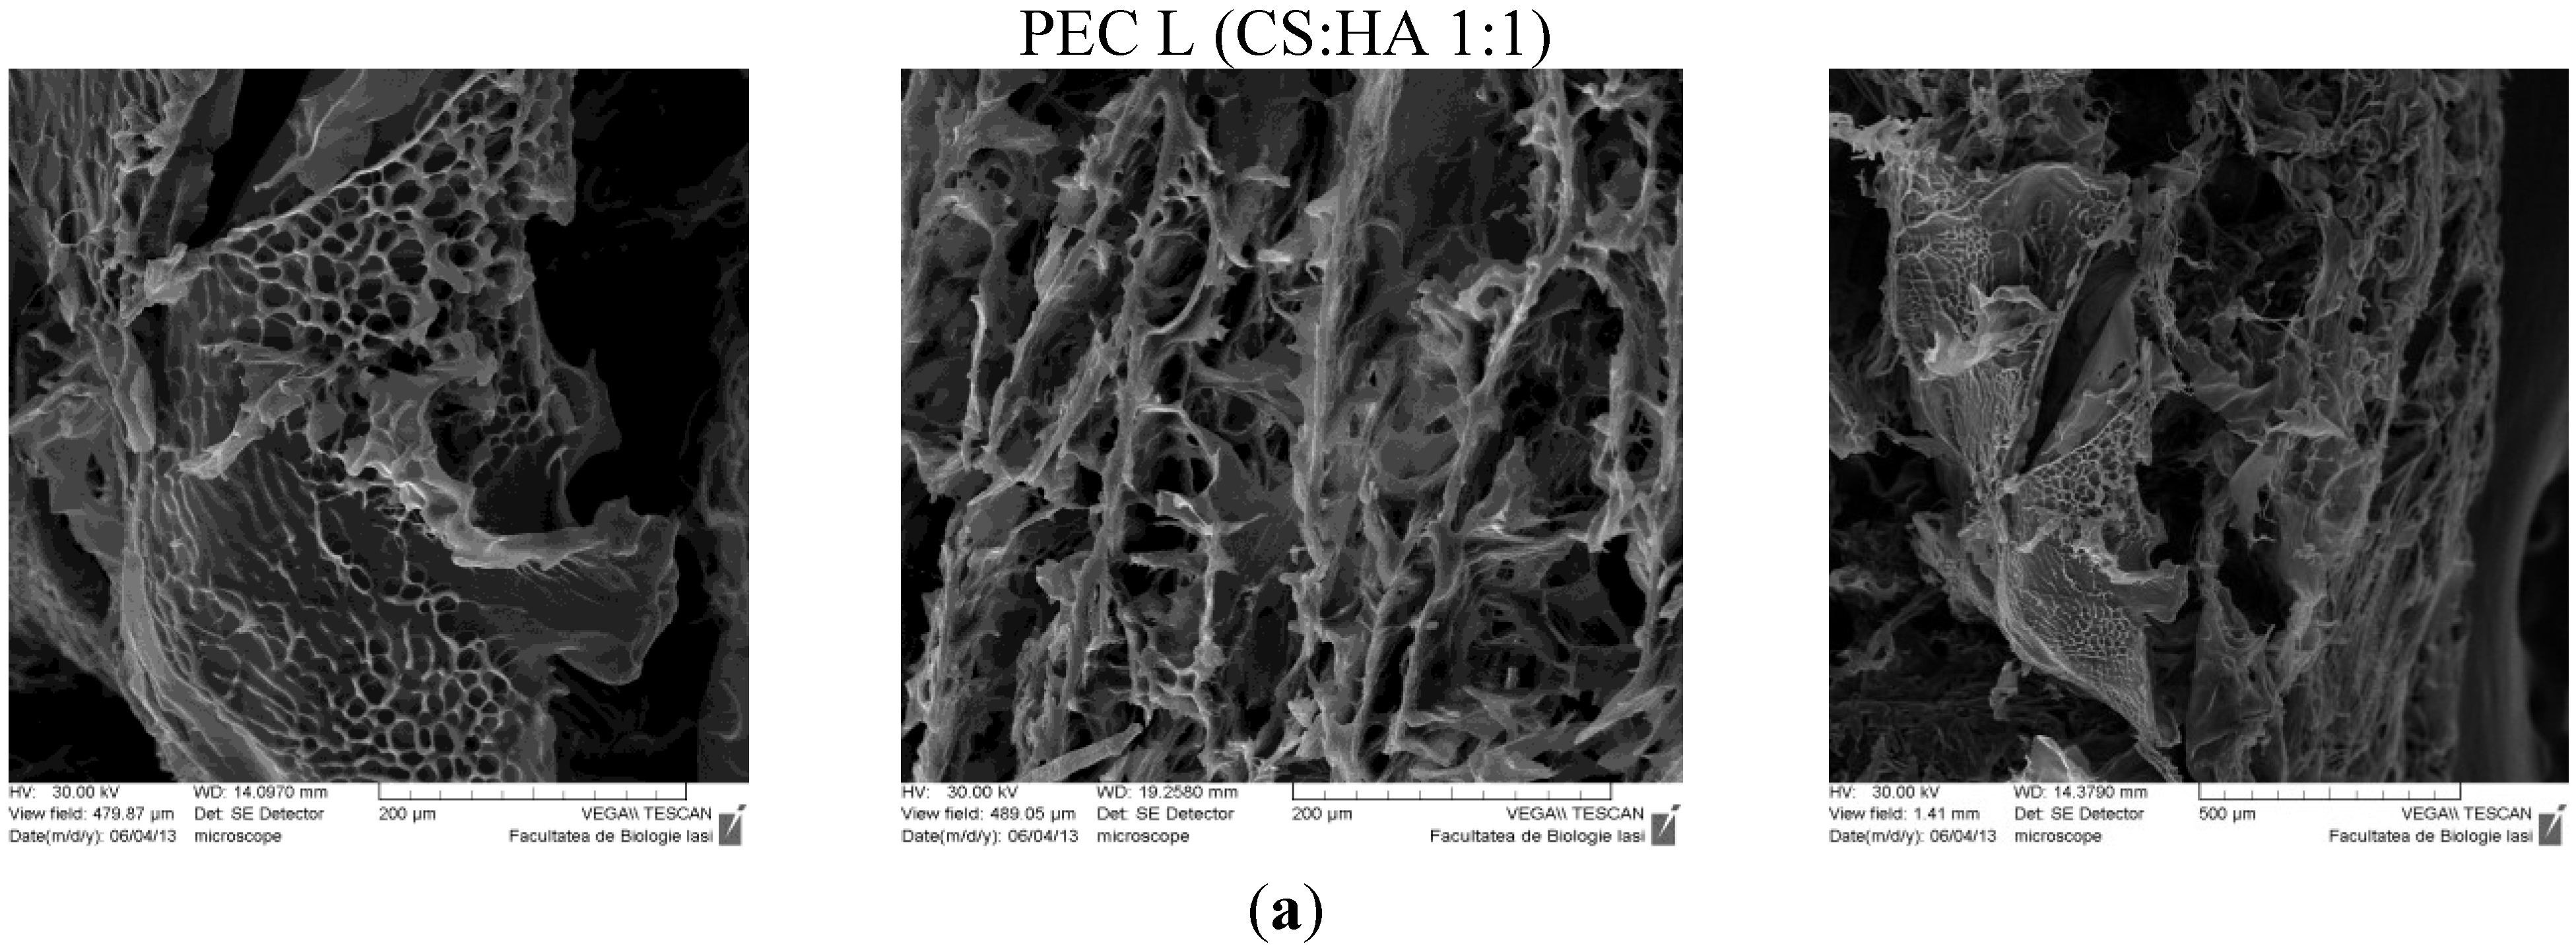
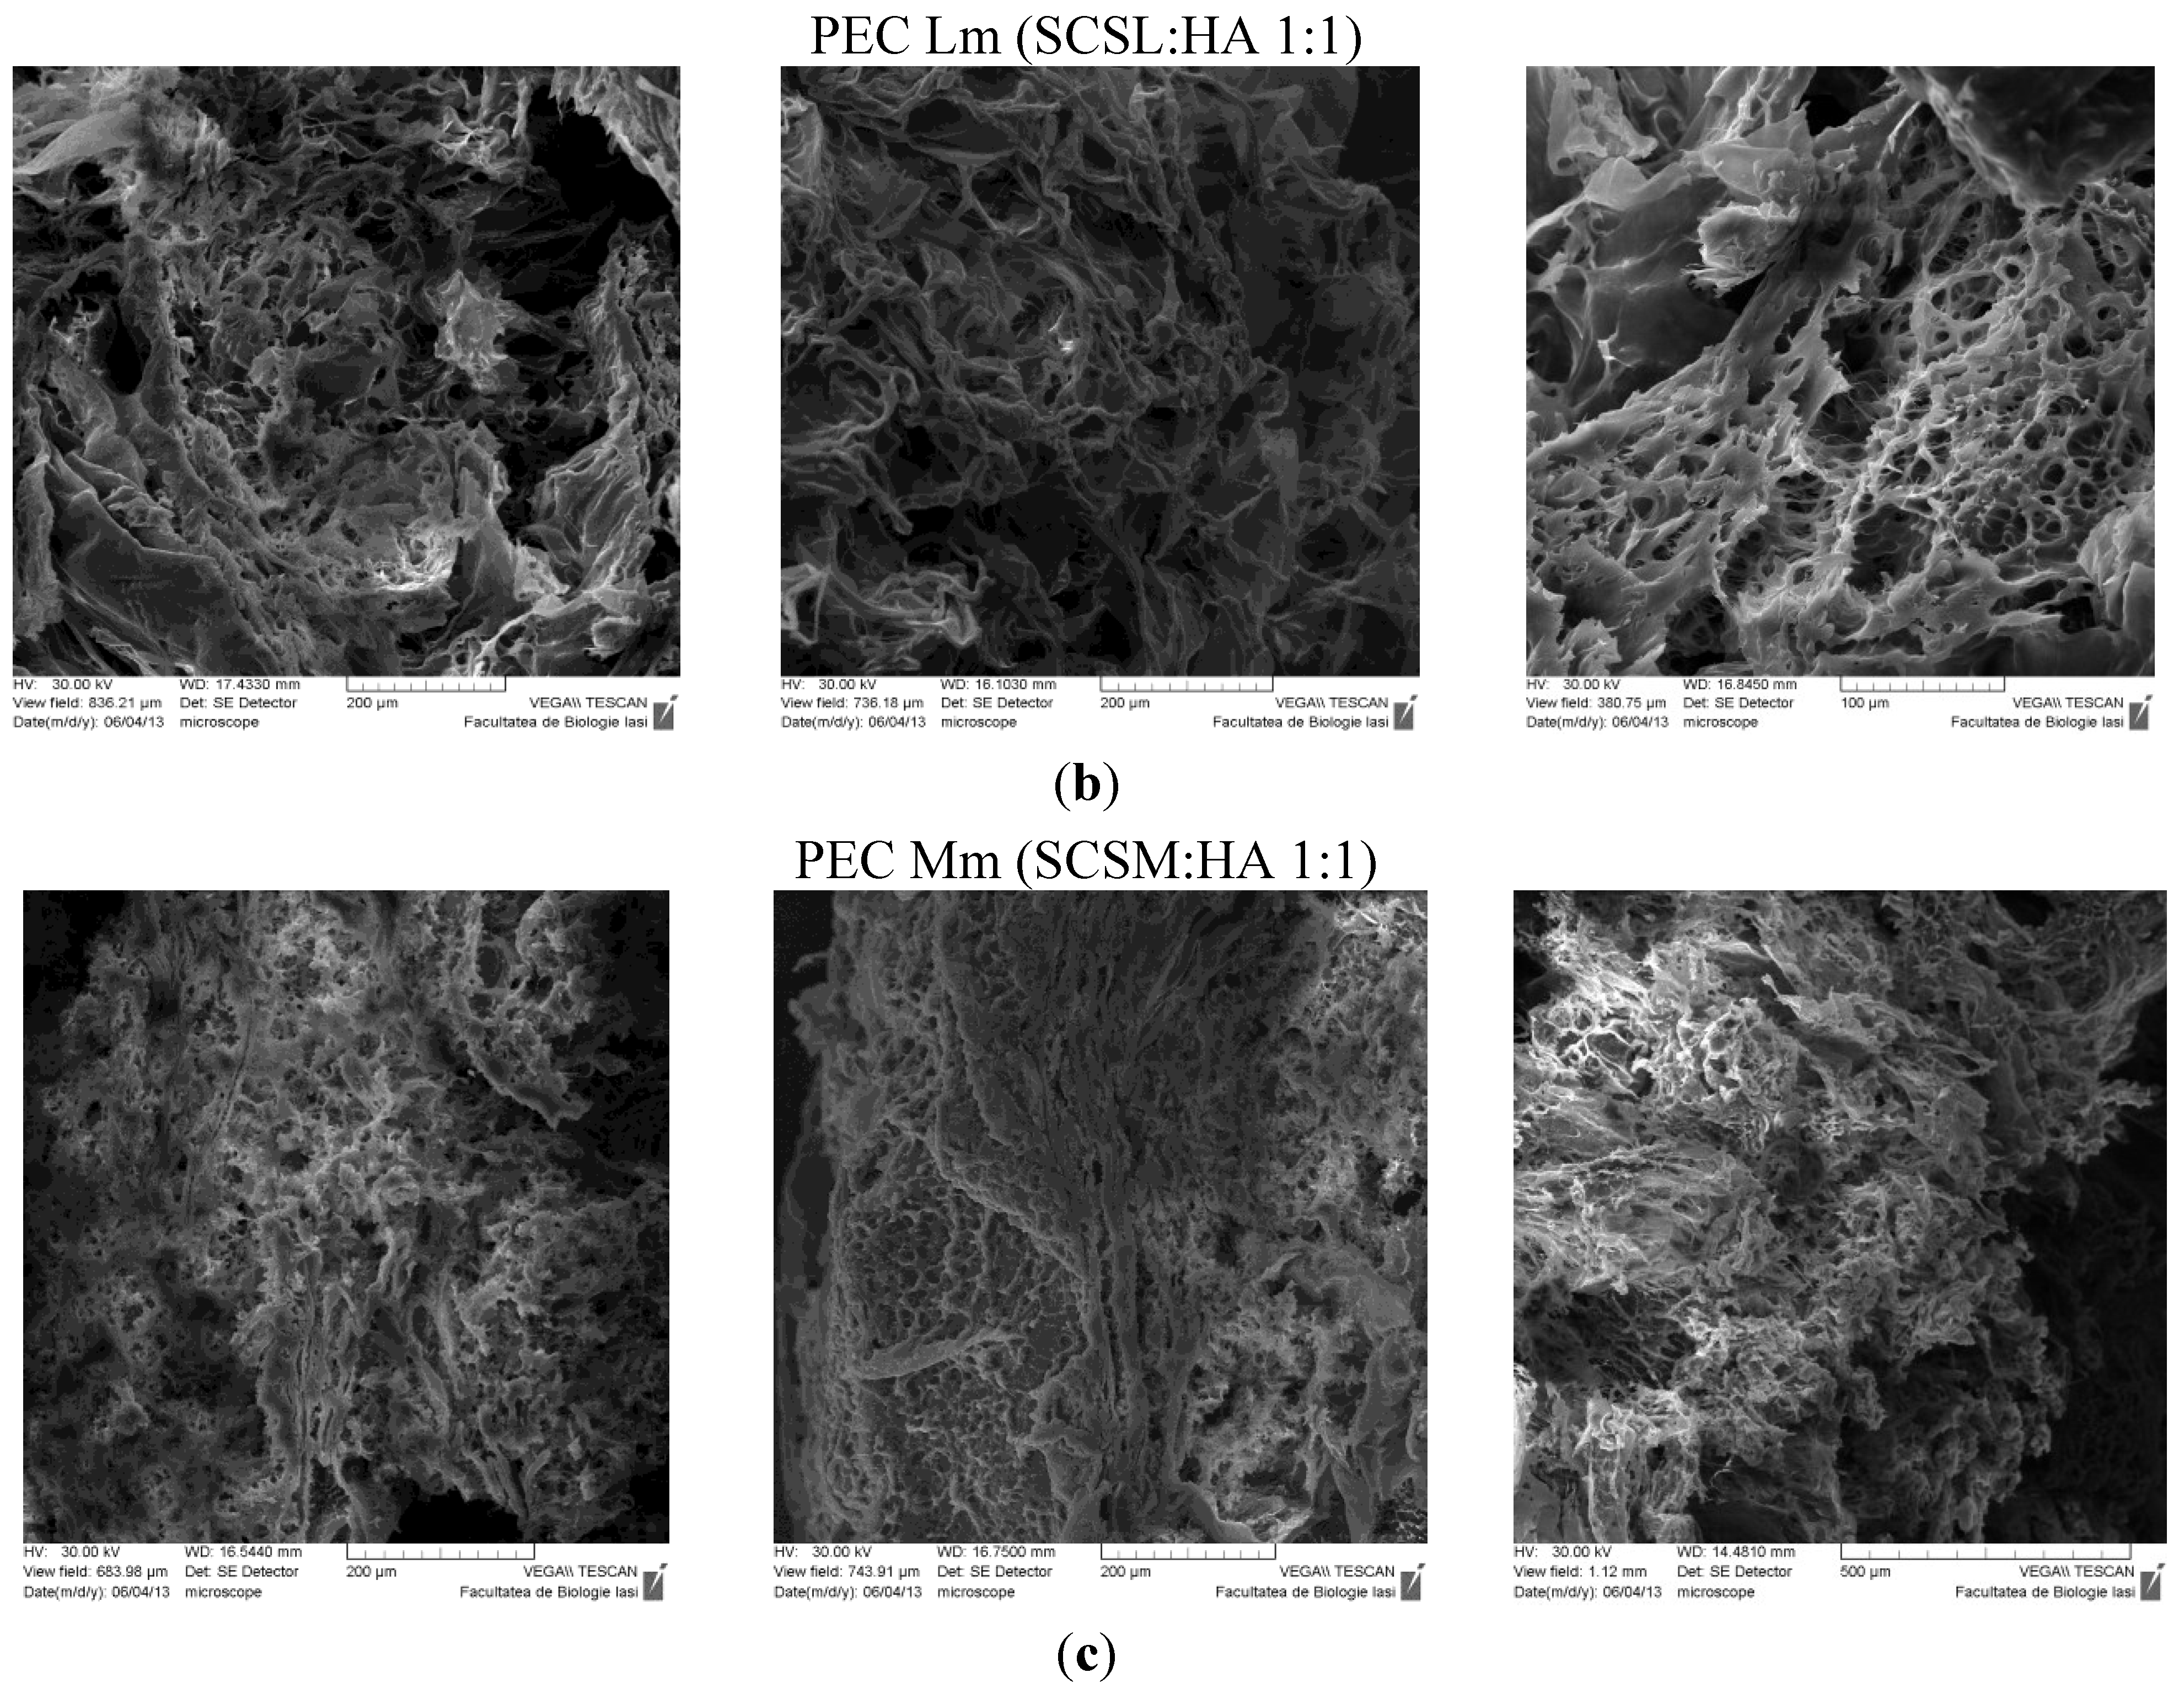
The SEM technique allowed observation of the morphologic details of the PEC sponges both on the surface and on the edge/in fracture. In
Figure 5 are presented the images obtained, showing a heterogeneous porous morphology with pores highly interconnected.
Figure 5.
SEM images of PECs (polyelectrolyte complexes): (a) PEC L (chitosan low molecular weight-sodium hyaluronate); (b) PEC Lm (sulfadiazine modified chitosan low molecular weight-sodium hyaluronate); and (c) PEC Mm (sulfadiazine modified chitosan medium molecular weight-sodium hyaluronate).
Figure 5.
SEM images of PECs (polyelectrolyte complexes): (a) PEC L (chitosan low molecular weight-sodium hyaluronate); (b) PEC Lm (sulfadiazine modified chitosan low molecular weight-sodium hyaluronate); and (c) PEC Mm (sulfadiazine modified chitosan medium molecular weight-sodium hyaluronate).
The sample PEC Mm seams to have an enhanced and more dense/compact porosity compared with the other samples, which allows an efficient entrapment of the drug within the 3D structure followed by a subsequent slower release.
2.5. Near Infrared Chemical Imaging (NIR-CI)
The NIR-CI method of analysis provides information about the spatial distribution of the components with the possibility to determine the degree of the chemical and/or physical heterogenity [
33]. The evaluation of the components distribution in samples was made by near infrared chemical imaging (NIR-CI) using chemometric analysis method.
Based on multivariate analysis techniques and principal component analysis (PCA), partial least squares regression (Partial Least Squares-Discriminant Analysis, PLS-DA) and soft independent modeling of class analogy (SIMCA), the quantitative and qualitative information was extracted from the NIR spectral variables data cube.
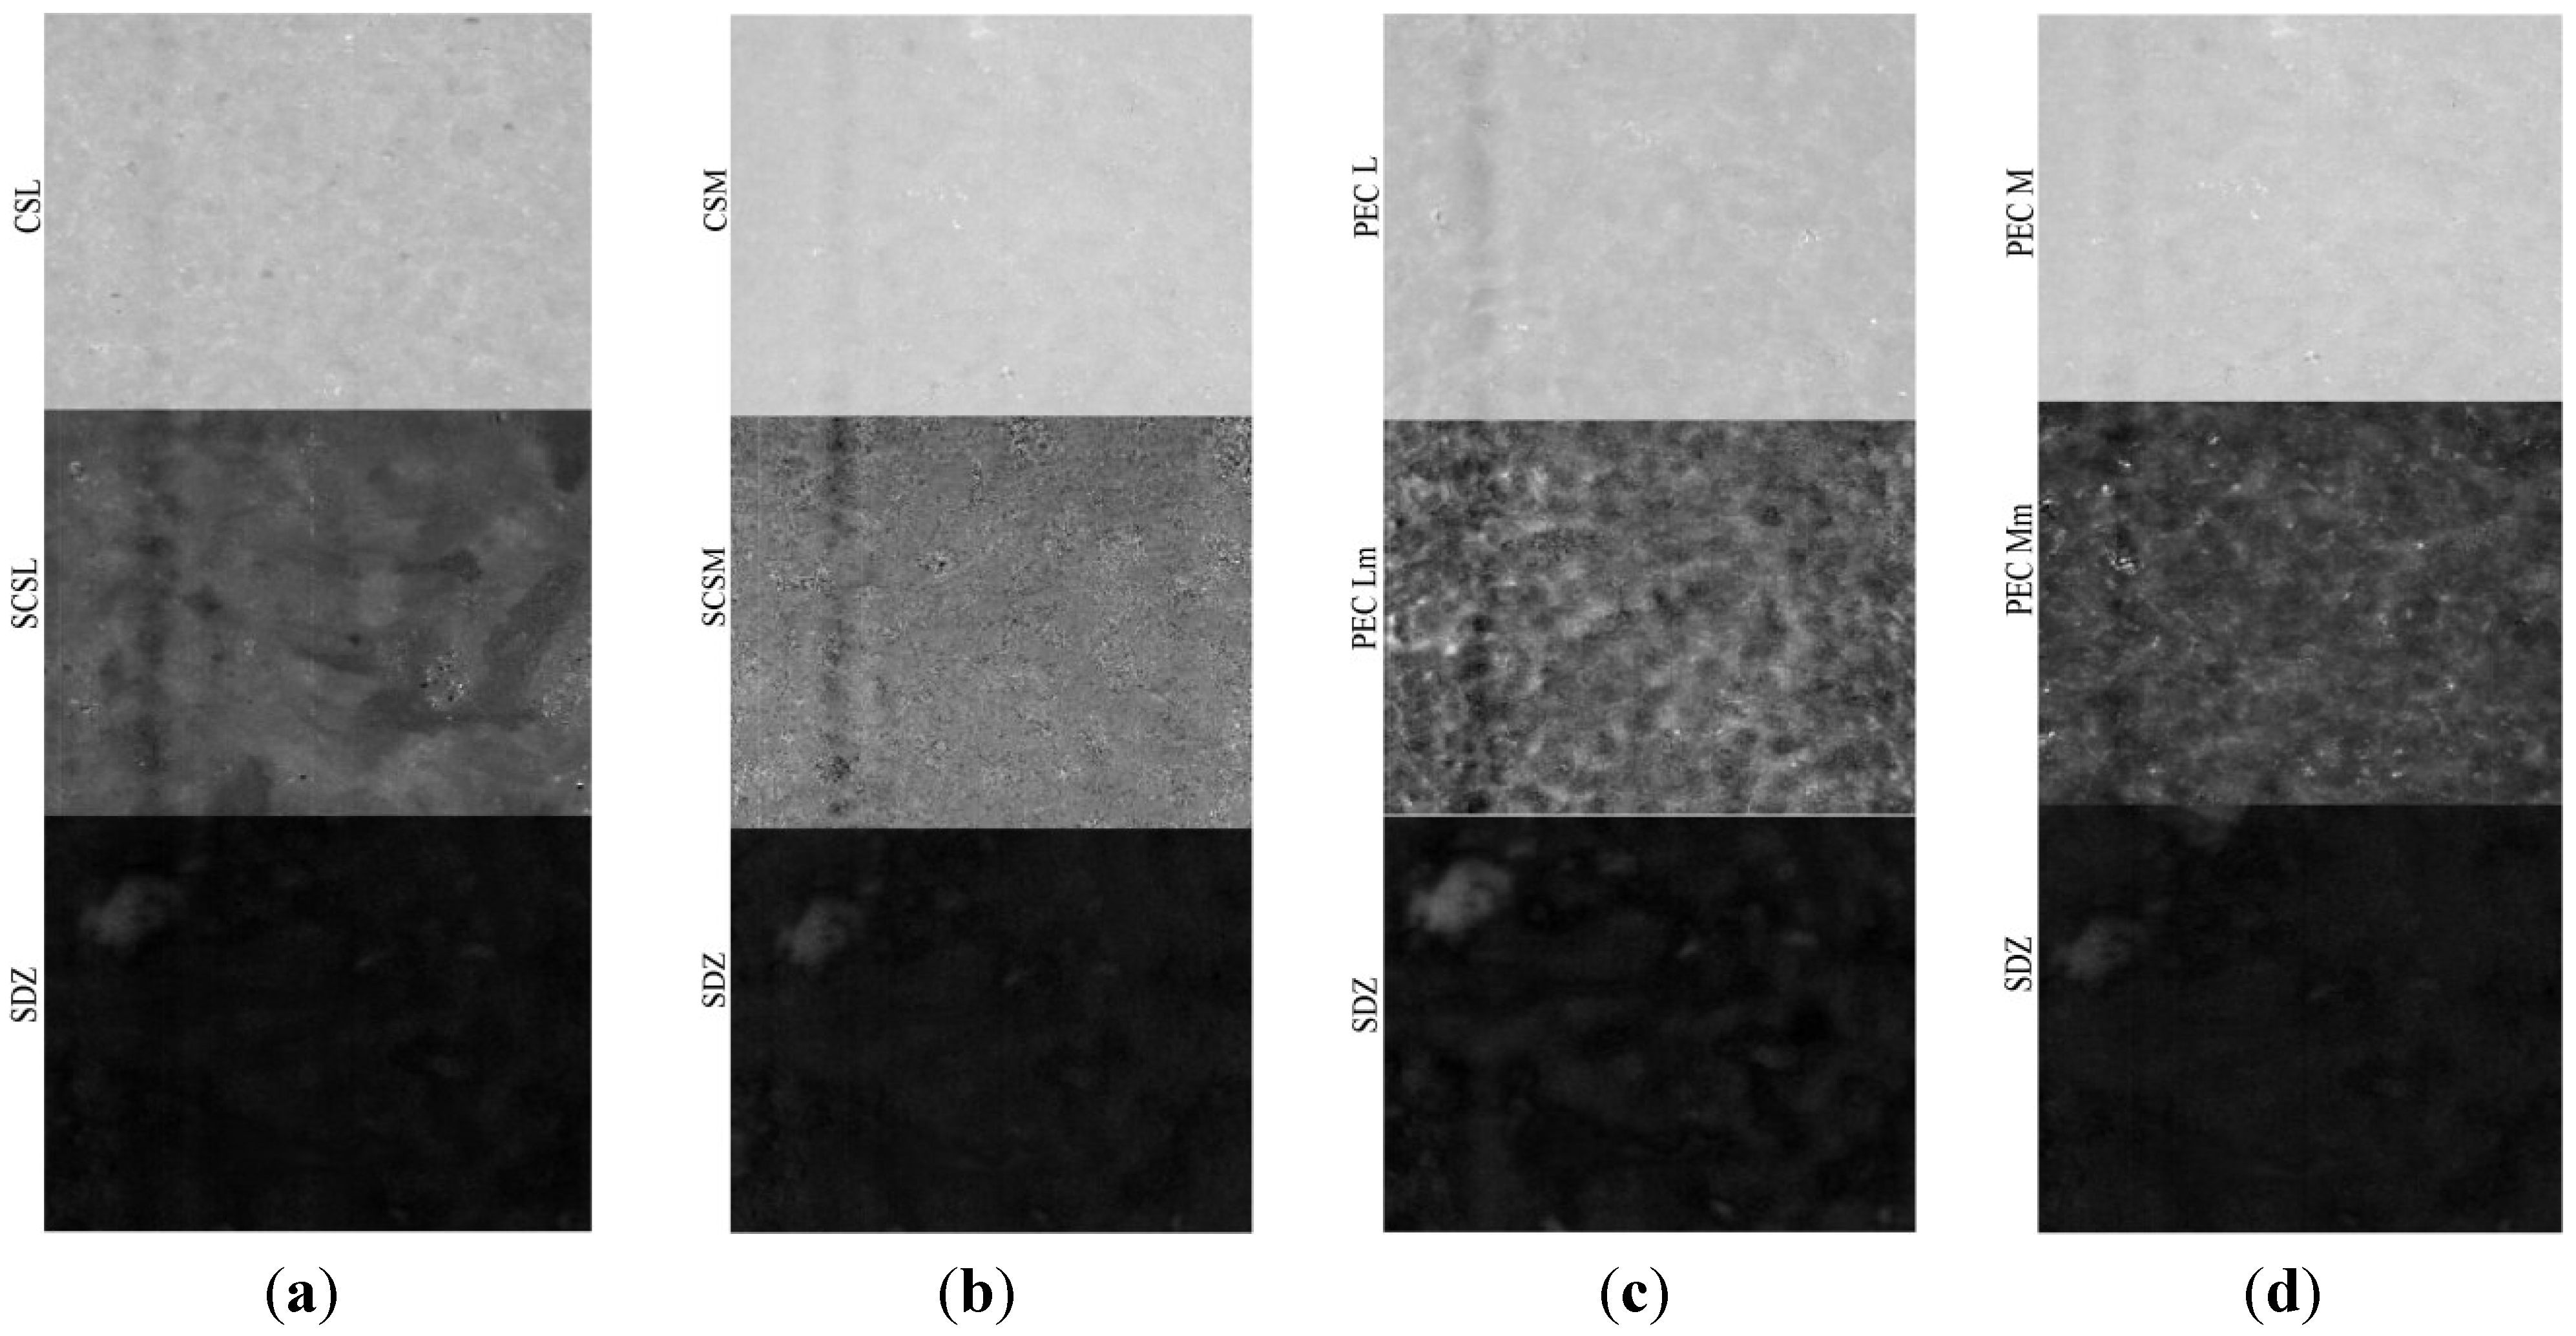
The PLS-DA models corresponding to the components (sulfadiazine-SDZ, sulfadiazine-modified chitosan and to PEC samples are depicted in
Figure 6. It can be noticed that both the sulfadiazine-modified chitosan samples (SCSL and SCSM) and the PECs obtained (PEC Lm and PEC Mm) have a good homogeneity, but samples SCSM and PEC Mm have a visibly higher homogeneity degree, which corresponds to a more uniform drug distribution within the matrix; data that correlates well with the drug release behavior.
Figure 6.
Partial Least Squares-Discriminant Analysis (PLS-DA) model for sulfadiazine (SDZ)-containing systems: (a) CSL-SCSL-SDZ (chitosan low molecular weight-sulfadiazine modified chitosan low molecular weight-sulfadiazine); (b) CSM-SCSM-SDZ (chitosan medium molecular weight-sulfadiazine modified chitosan medium molecular weight-sulfadiazine); (c) PEC L-PEC Lm-SDZ (chitosan low molecular weight:sodium hyaluronate-sulfadiazine modified chitosan low molecular weight:sodium hyaluronate-sulfadiazine); (d) PEC M-PEC Mm-SDZ (chitosan medium molecular weight:sodium hyaluronate-sulf adiazine modified chitosan medium molecular weight:sodium hyaluronate-sulfadiazine).
The prediction for these samples as non-classified (100% new compounds both as PEC and SDZ incorporated PECs noted as PEC L-SDZ, PEC Lm-SDZ and PEC M-SDZ, PEC Mm-SDZ, respectively, for low and medium average molecular weight unmodified and modified chitosan) shows that the conjugate with the SDZ was successfully obtained and the PECs were prepared as new and efficient drug release systems.
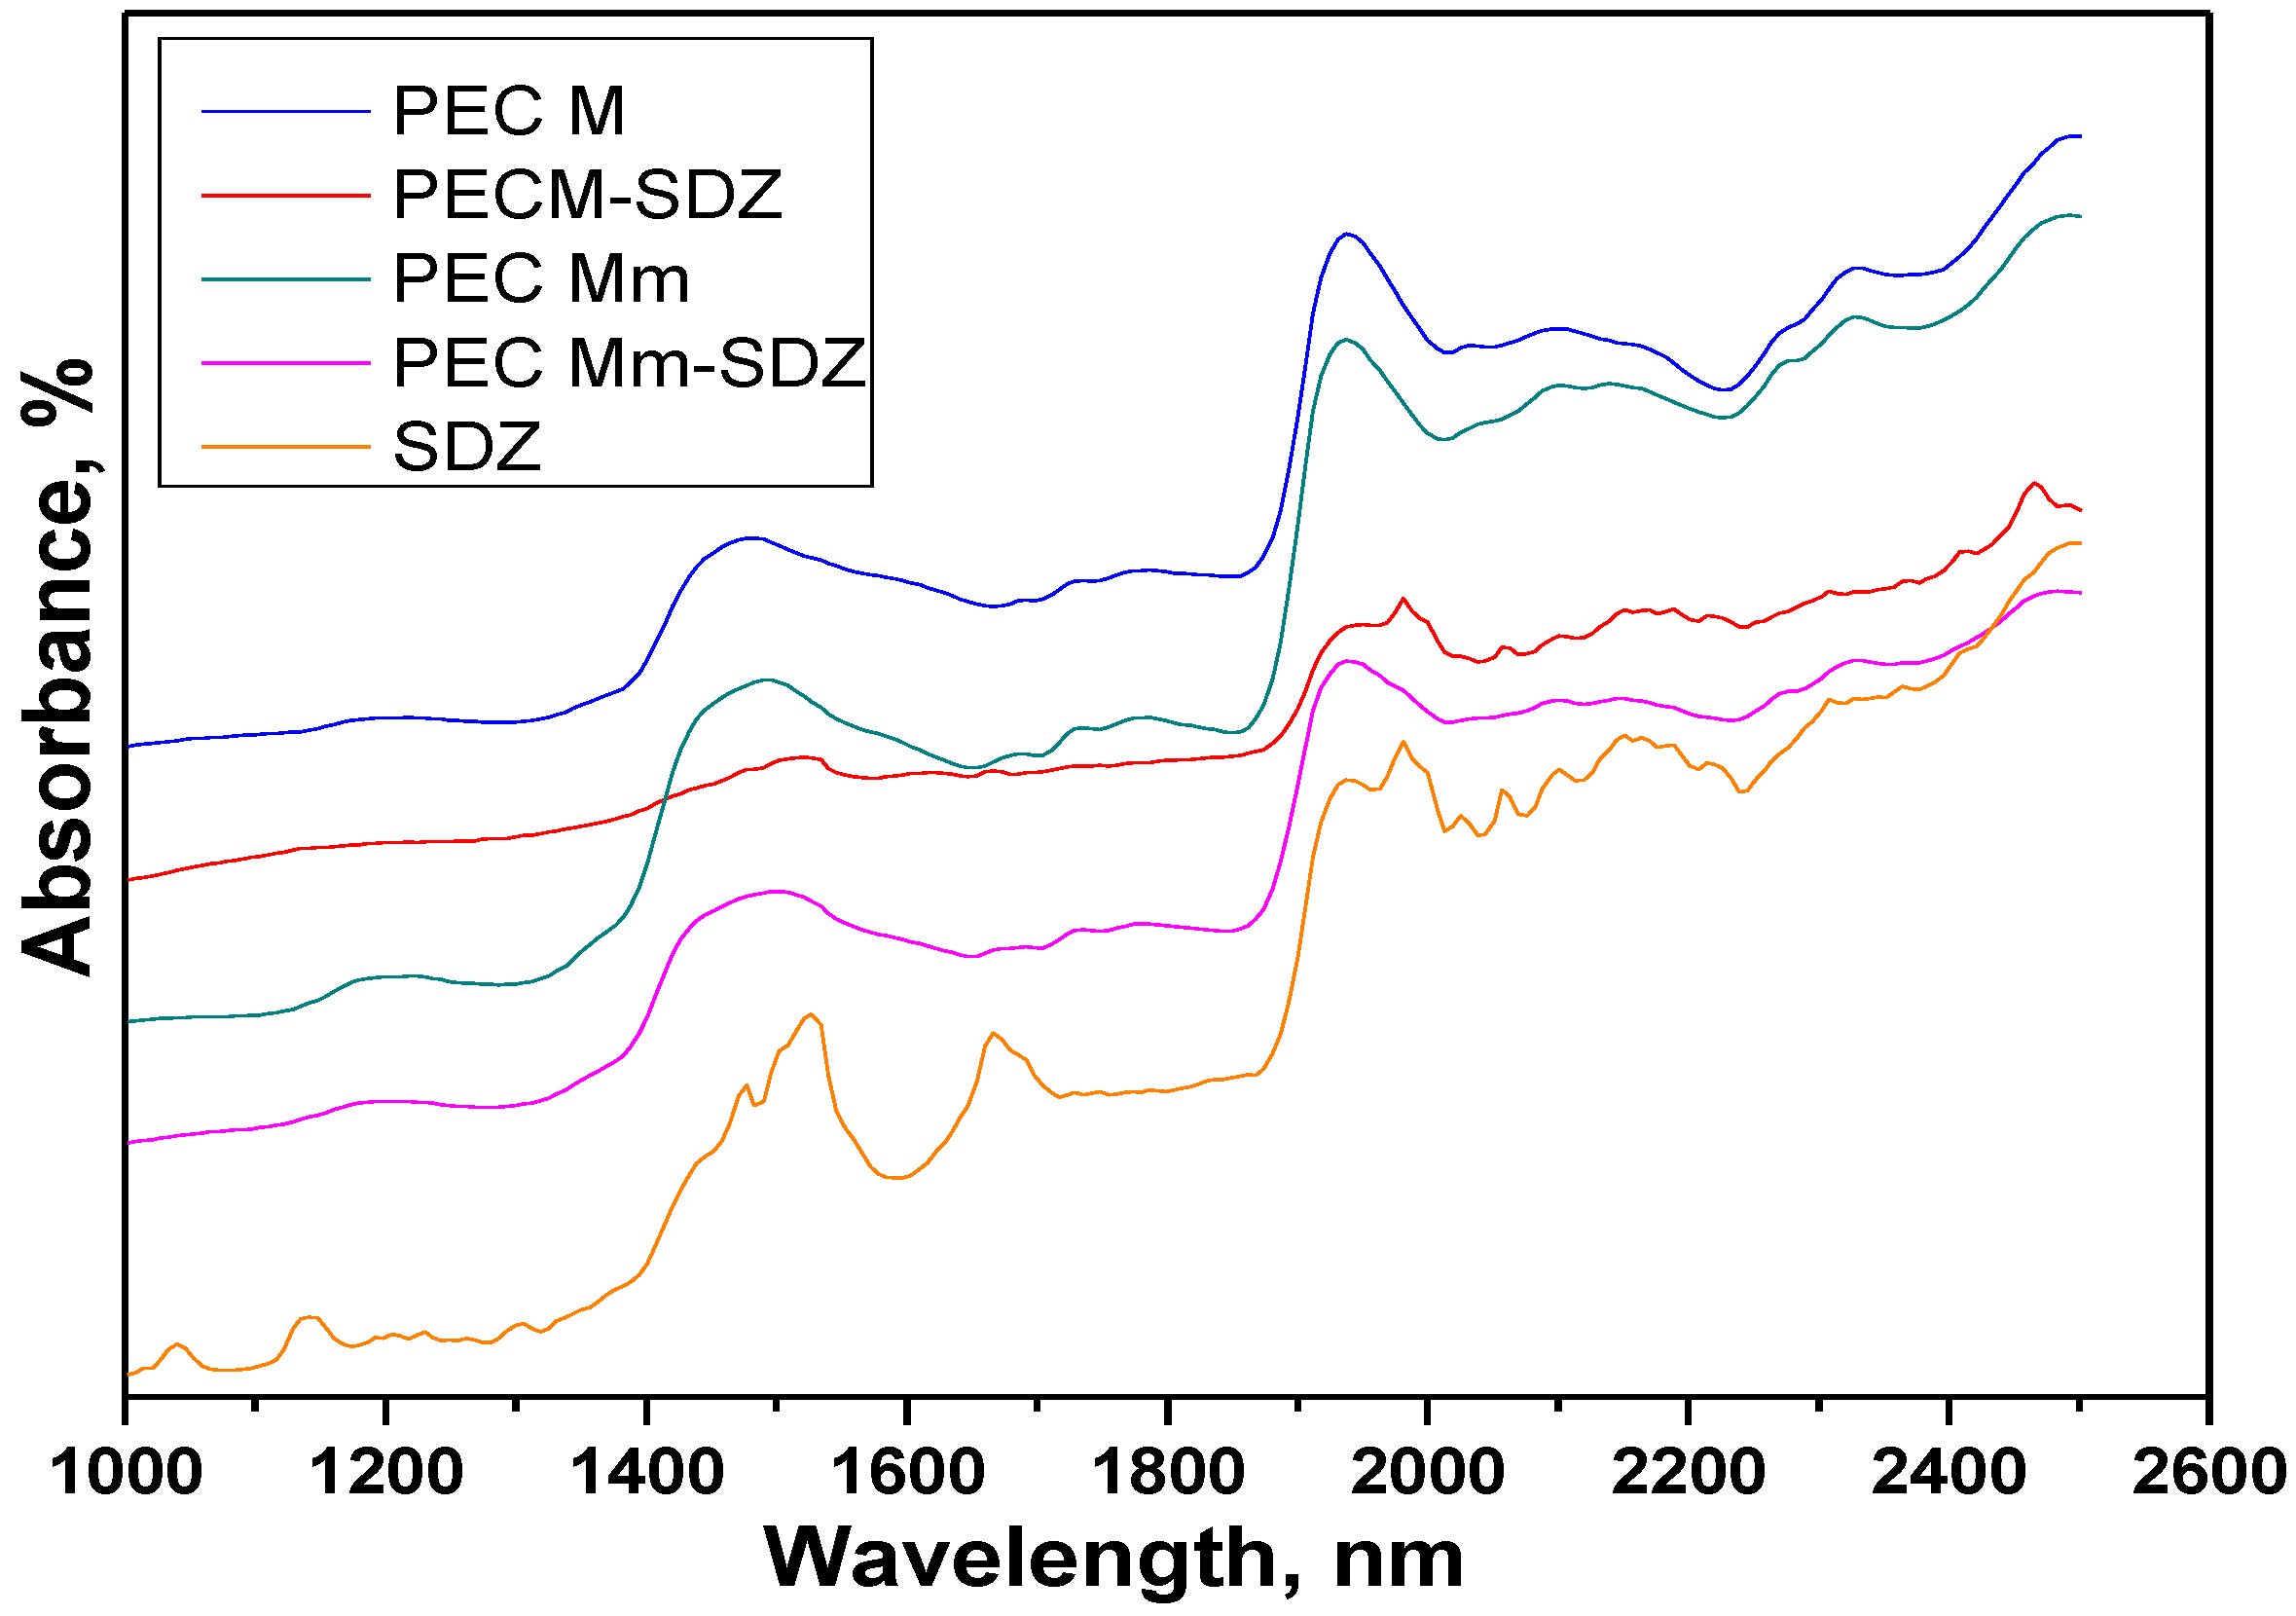
The Near infrared compared spectra of the PEC hydrogel sponges, sulfadiazine (SDZ) and drug-loaded PECs with an air background are presented in
Figure 7. Intense absorption bands corresponding to the functional groups of the components are observed in the full range of the spectra (
Table 3).
Table 3.
NIR-CI spectra bands (nm) assignment [
34,
35].
Table 3.
NIR-CI spectra bands (nm) assignment [34,35].
| SDZ | PEC M | PEC M-SDZ | PEC Mm | PEC Mm-SDZ | Bands Assignment |
|---|
| 1142, 1668, 1692 (shoulder) | | | | | C–H second overtone; C–H stretch first overtone |
| 1475,1525 | 1475 | 1524 | 1490 | 1502 | NH stretch first overtone, NH–CO groups (CO–NHR and RNH2 groups) |
| | 1938 (strong band) | | 1938 (strong band) | 1940 (wider band) | O–H bend second overtone, C=O stretch second overtone |
| 1938, 1982, 2000 (shoulder) | | 1938, 1982, 2000 (shoulder) | | | N–H stretch/N–H in plane bend C–N stretch combination, NH bend combination |
| | 2032 | | 2036 | 2034 (very weak band) | C=O stretch second overtone |
| 2057 | | 2059 | | | N–H combinations, N–H in plane bend C–N stretch |
| 2096, 2150 | 2096 | 2096, 2152 | 2098 | 2098 | C–H combination, R–NH2 overlapped O–H bend/C–O stretch combination |
| | 2170 | | 2145 | 2155 | C–H deformation combination, C=O stretch combination |
| | 2275 | | 2273 | 2273 | O–H stretch/C=O stretch combination |
| | 2326 | | 2326 | 2328 | C–H stretch |
Figure 7.
Compared Near-IR reflectance spectra of the polyelectrolyte complexe (PEC) sponges prepared without added sulfadiazine (SDZ) and of SDZ-loaded PECs (PEC M and PEC Mm).
Figure 7.
Compared Near-IR reflectance spectra of the polyelectrolyte complexe (PEC) sponges prepared without added sulfadiazine (SDZ) and of SDZ-loaded PECs (PEC M and PEC Mm).
Sulfadiazine (SDZ) near-IR spectra evidenced the bands at 1142 nm corresponding to C–H second overtone and the band at 1668 nm with a shoulder at 1692 nm corresponding to C–H stretch first overtone, which can be attributed to ArCH from benzene ring and pyrimidine ring, respectively. Specific for SDZ are the bands at 1475 nm and 1525 nm attributed to N–H stretch first overtone (CONHR and RNH2 groups) and the weak band at 1938 nm coupled with the sharp band at 1982 nm with a shoulder at 2000 nm for N–H stretch/N–H in plane bend C–N stretch combination corresponding to NH2 group and –NH bonded to pyrimidine ring.
In the spectra of PEC M (CHTM: HA 1:1), a broad band appears at 1475 nm corresponding to NH stretch first overtone assigned to amino/NH2 groups of chitosan and amide/NH–CO groups from both chitosan and hyaluronate and an intense/strong band at 1938 nm corresponding probably to both O–H bend second overtone (polysaccharidic OH groups) and to C=O stretch second overtone (from both COO− or amide NH-CO groups).
The spectra recorded for PEC Mm and PEC Mm-SDZ are quite similar with that of PEC M, but the broad band recorded at 1475 nm for PEC M is shifted to 1490 nm for PEC Mm and to 1502 nm for PEC Mm-SDZ and changes slightly the aspect for the last one showing the influence of the CONHR and RNH2 groups from SDZ with the peaks recorded at 1475 nm and 1525 nm. For PEC M-SDZ this band is shifted to 1524 nm and has a significantly modified aspect and decreased intensity.
The intense/strong band attributed to polysaccharidic OH groups at 1938 nm in PEC M spectra is shifted to 1940 nm and becomes larger and less intense in the spectra of PEC Mm-SDZ, being overlapped with the intense bands from SDZ corresponding to NH combinations. These particular bands and the ones recorded at 2057 nm and to 2096 nm, 2150 nm (corresponding to N–H in plane bend C–N stretch and to C–H combination) can be easily identified in the spectra of PEC M-SDZ at almost the same wavelengths as in SDZ spectra.
Meanwhile the spectra of PEC M, PEC Mm and PEC Mm-SDZ present larger bands, with lower intensity in the range 2000–2040 nm. The band at 2032 nm from PEC M spectra attributed to C=O stretch second overtone is slightly shifted to 2036 nm in the PEC Mm spectra and almost cannot be identified in the spectra of PEC Mm-SDZ which suggests the interactions between COO− groups from HA with NH2 groups of SDZ. The bands at 2096 nm and 2170 nm from PEC M spectra are slightly shifted in PEC Mm spectra, but became larger, with lower intensity and shifted at 2098 nm and 2155 nm, respectively, in PEC Mm-SDZ spectra, demonstrating the presence of additional SDZ in sample.
These findings show that SDZ bands can be identified in the spectra of the physically loaded PEC sample, while the spectra of the PEC prepared with SDZ-modified CS (PEC Mm) was quite similar with that of PEC M, with larger bands such as PECs present generally, demonstrating that SDZ was well-bonded in the SDZ-CS conjugate as the NIR predictions identified the PEC obtained as a new compound.
The presence of mainly broad bands in the spectra of the PECs obtained suggests the presence of the ionic interactions between the two oppositely charged polyelectrolytes, chitosan and hyaluronate, leading to the formation of PECs.
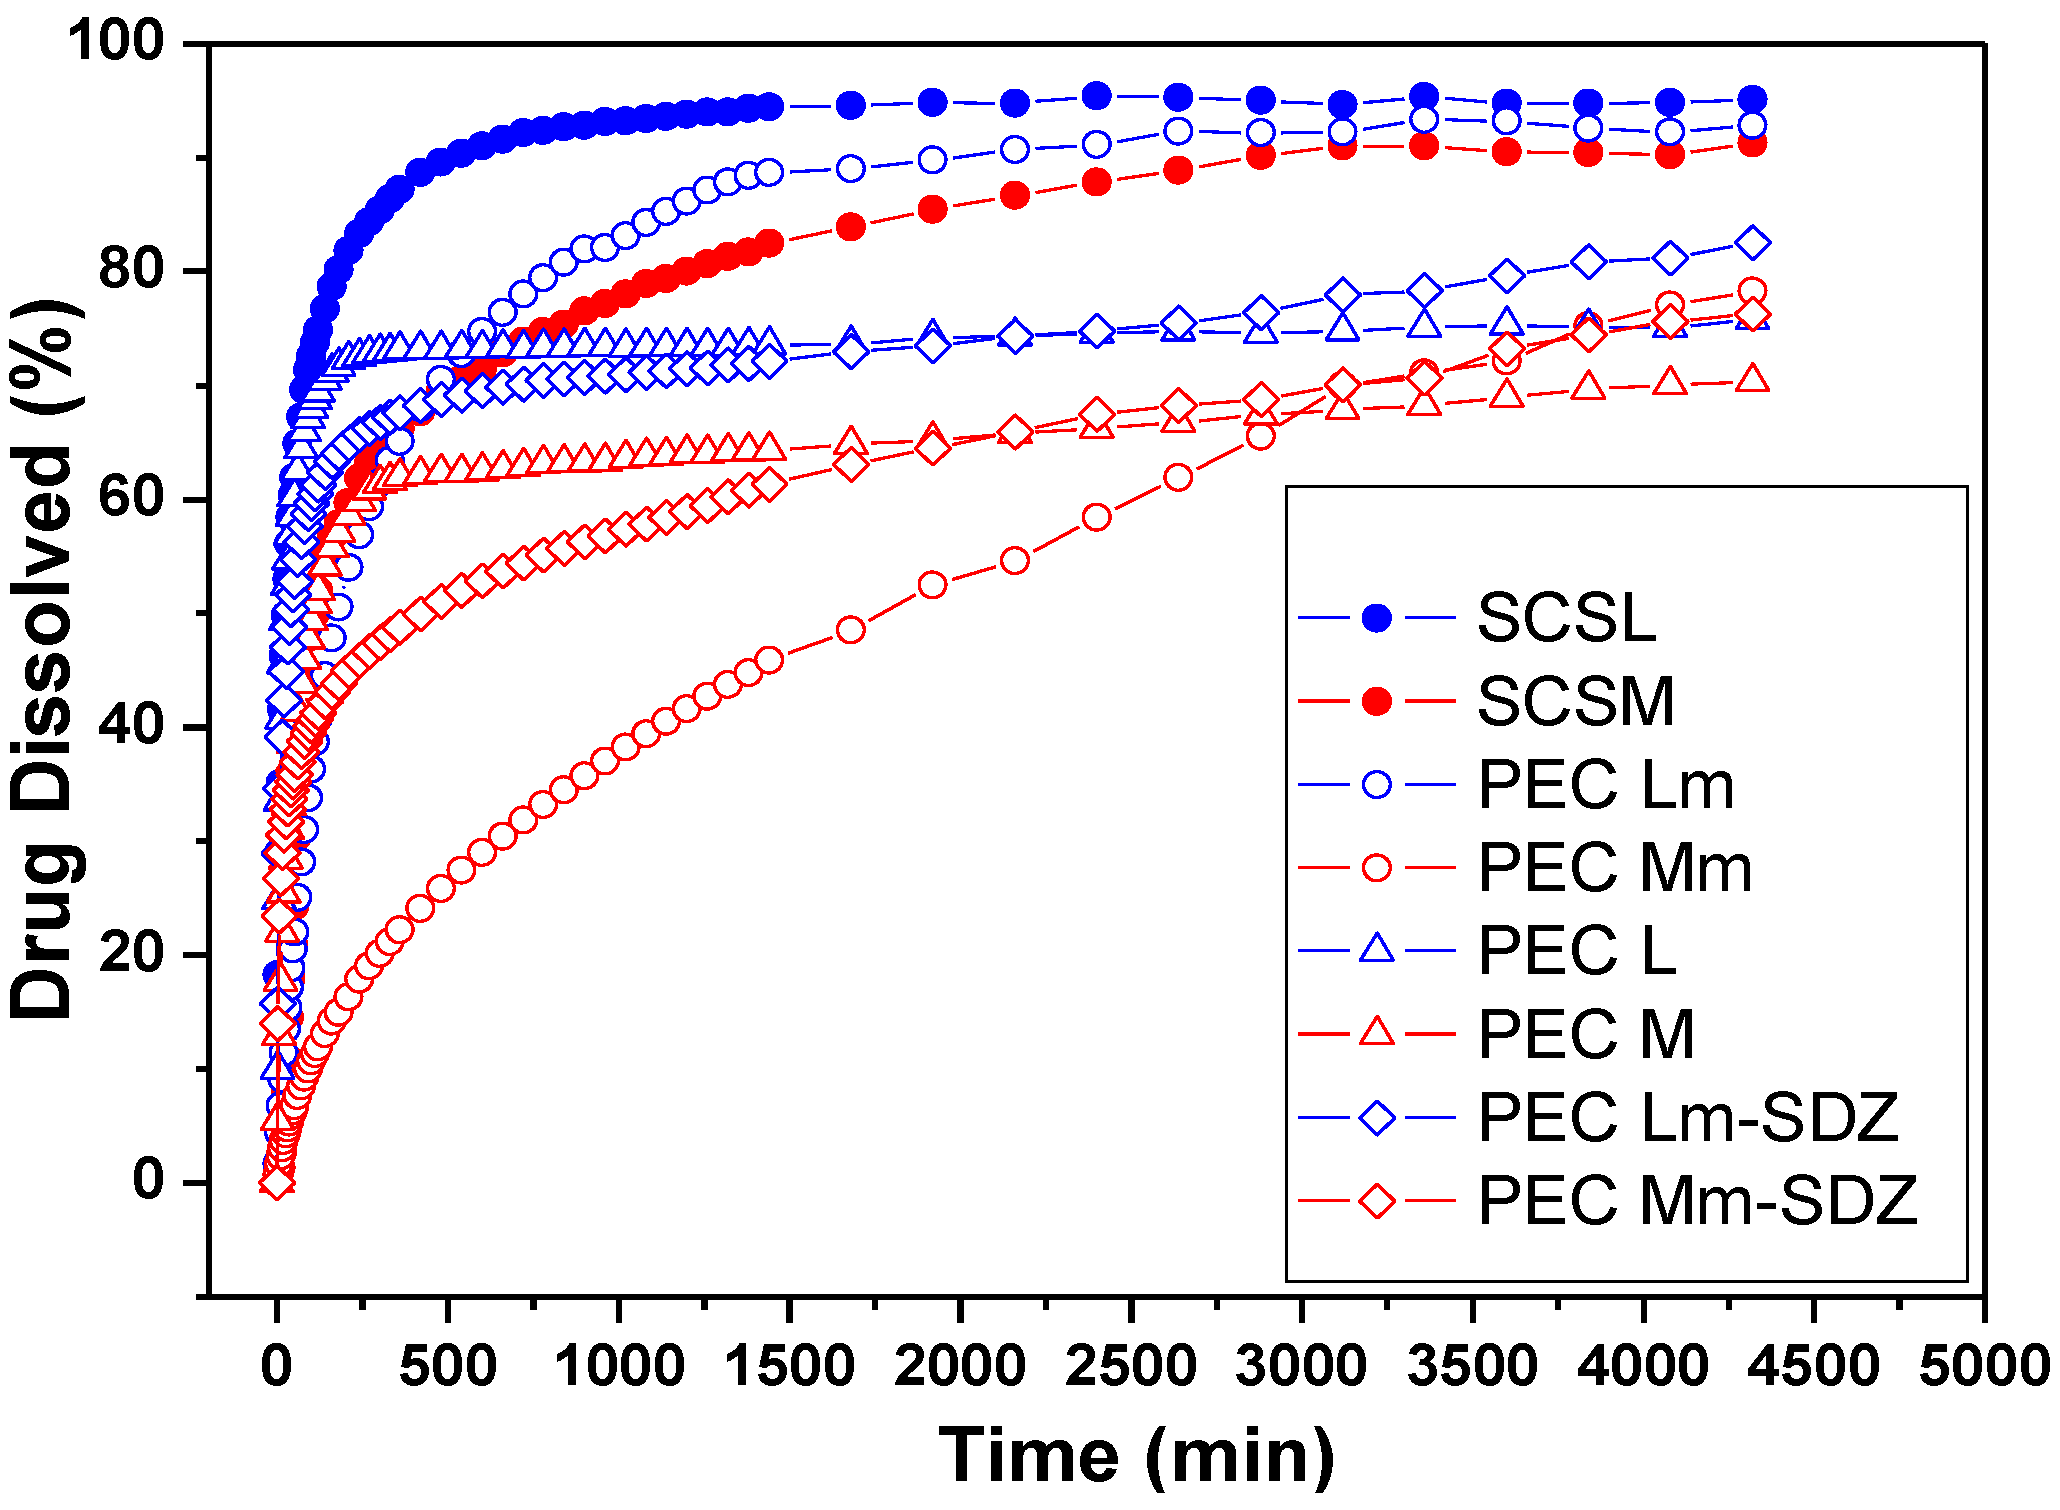
2.6. Drug Release Kinetic Studies
The
in vitro sulfadiazine release was investigated at 37 °C, in acidic solution of pH 2.7. The drug release profiles are depicted in
Figure 8. The sulfadiazine release kinetic parameters were calculated (
Table 4).
The acidic pH of 2.7 was chosen for the drug release study in order to be able to observe the prolonged SDZ release from PECs based on SCS, which demonstrated a reduced stability at pH 7.4 compared with CS-based PECs during swelling studies.
The release rate and the amount of sulfadiazine released depends on the type of sample, either it is a conjugate or a PEC. Also the stability of the PECs in the dissolution medium is affected by their composition.
Figure 8.
Sulfadiazine release profiles from chitosan (CS) conjugates (SCSL—sulfadiazine modified chitosan low molecular weight and SCSM—sulfadiazine modified chitosan medium molecular weight) and from SDZ-loaded PECs.
Figure 8.
Sulfadiazine release profiles from chitosan (CS) conjugates (SCSL—sulfadiazine modified chitosan low molecular weight and SCSM—sulfadiazine modified chitosan medium molecular weight) and from SDZ-loaded PECs.
Table 4.
Kinetic parameters for sulfadiazine (SDZ) release.
Table 4.
Kinetic parameters for sulfadiazine (SDZ) release.
| Sample | n | R | k·(minn) | R |
|---|
| PEC L-SDZ | 0.36 | 0.997 | 3.58 × 10⁻² | 0.999 |
| PEC Lm | 0.32 | 0.997 | 1.60 × 10⁻² | 0.999 |
| PEC Lm-SDZ | 0.24 | 0.999 | 4.34 × 10⁻² | 0.999 |
| SCSL | 0.30 | 0.999 | 3.53 × 10⁻² | 0.999 |
| PEC M-SDZ | 0.33 | 0.999 | 2.55 × 10⁻² | 0.999 |
| PEC Mm | 0.23 | 0.999 | 7.45 × 10⁻³ | 0.999 |
| PEC Mm-SDZ | 0.18 | 0.999 | 3.83 × 10⁻² | 0.999 |
| SCSM | 1.00 | 0.991 | 8.94 × 10⁻⁴ | 0.998 |
Previous studies performed on chitosan polyelectrolyte complexes and in particular PECs with hyaluronate have shown that complex stability is closely related with the chitosan DA (degree of acetylation), by decreasing when DA increases, the distance between charged groups (NH
3+) increases. Thus the complex is less cooperative for large DA [
36].
In our investigations the PECs obtained with SCS were more stable at acidic pH compared with the PECs obtained with neat CS, which disintegrate at pH 2.7 due to chitosan solubility by protonation of amino groups. SCSM has a DD (degree of desacetylation) of 77.56% (DA of 22.44%) so there was enough charge density at acidic pH to form a PEC with HA, but due to the increased DS of 31.36% a significantly lower number of NH2 groups were available for protonation in acidic media to induce solubility compared with CS or SCSL (DS of 16.66%). Thus by substitution with SDZ the PECs prepared with SCS became more stable at pH 2.7.
The SDZ release results showed a slower release rate from all samples containing CSM, either SCSM or PEC Mm, compared with samples containing CSL/SCSL. Also the release of up to 80% of SDZ in 72 h was recorded from almost all PEC samples, except PEC Lm, which has a similar behavior with SCSL. These findings demonstrate that the drug was well entrapped in the polymer matrix, facilitating its slower release.
For the PEC samples prepared with SCSM the release profiles are visibly smoother compared with the other samples, showing the slowest release rate and the lowest release percent during 50 h/~2 days. In particular the PEC Mm samples had a significantly slower release rate compared with PEC M and SCSM.
The slowest release rate was recoded for PEC Mm sample. The enhanced chains length/entanglement in CSM is favorable for keeping the drug inside the polymer matrix for longer time and releasing it slowly subsequently. Additionally, the presence of interchain hydrogen bonding might be also responsible for a better entrapment of the drug within the polymeric matrix and its slower release.
The values obtained for the diffusion exponent (n) at pH 2.7 correspond to an anomalous, non-Fickian mechanism for all samples, except sample SCSM (n = 1) when a case II transport mechanism is involved with zero order kinetics.
The decrease of the release rate constant values (k) for all SCSM-containing samples corresponds to a slower release rate and indicates a significantly prolonged delivery from samples containing CSM and especially SCSM.
The release studies were performed at pH 2.7 were all PECs show the approximately the same resistance and aspect. PECs of both modified chitosans are stable over a wide range of pH from pH 2.7 to 7.4 as also other authors reported [
37] while PECs containing SDZ chitosan although they disintegrate at pH 7.4 still remain non-soluble. Therefore both types of PECs matrices could be useful for wound dressing where pH is higher than 4.
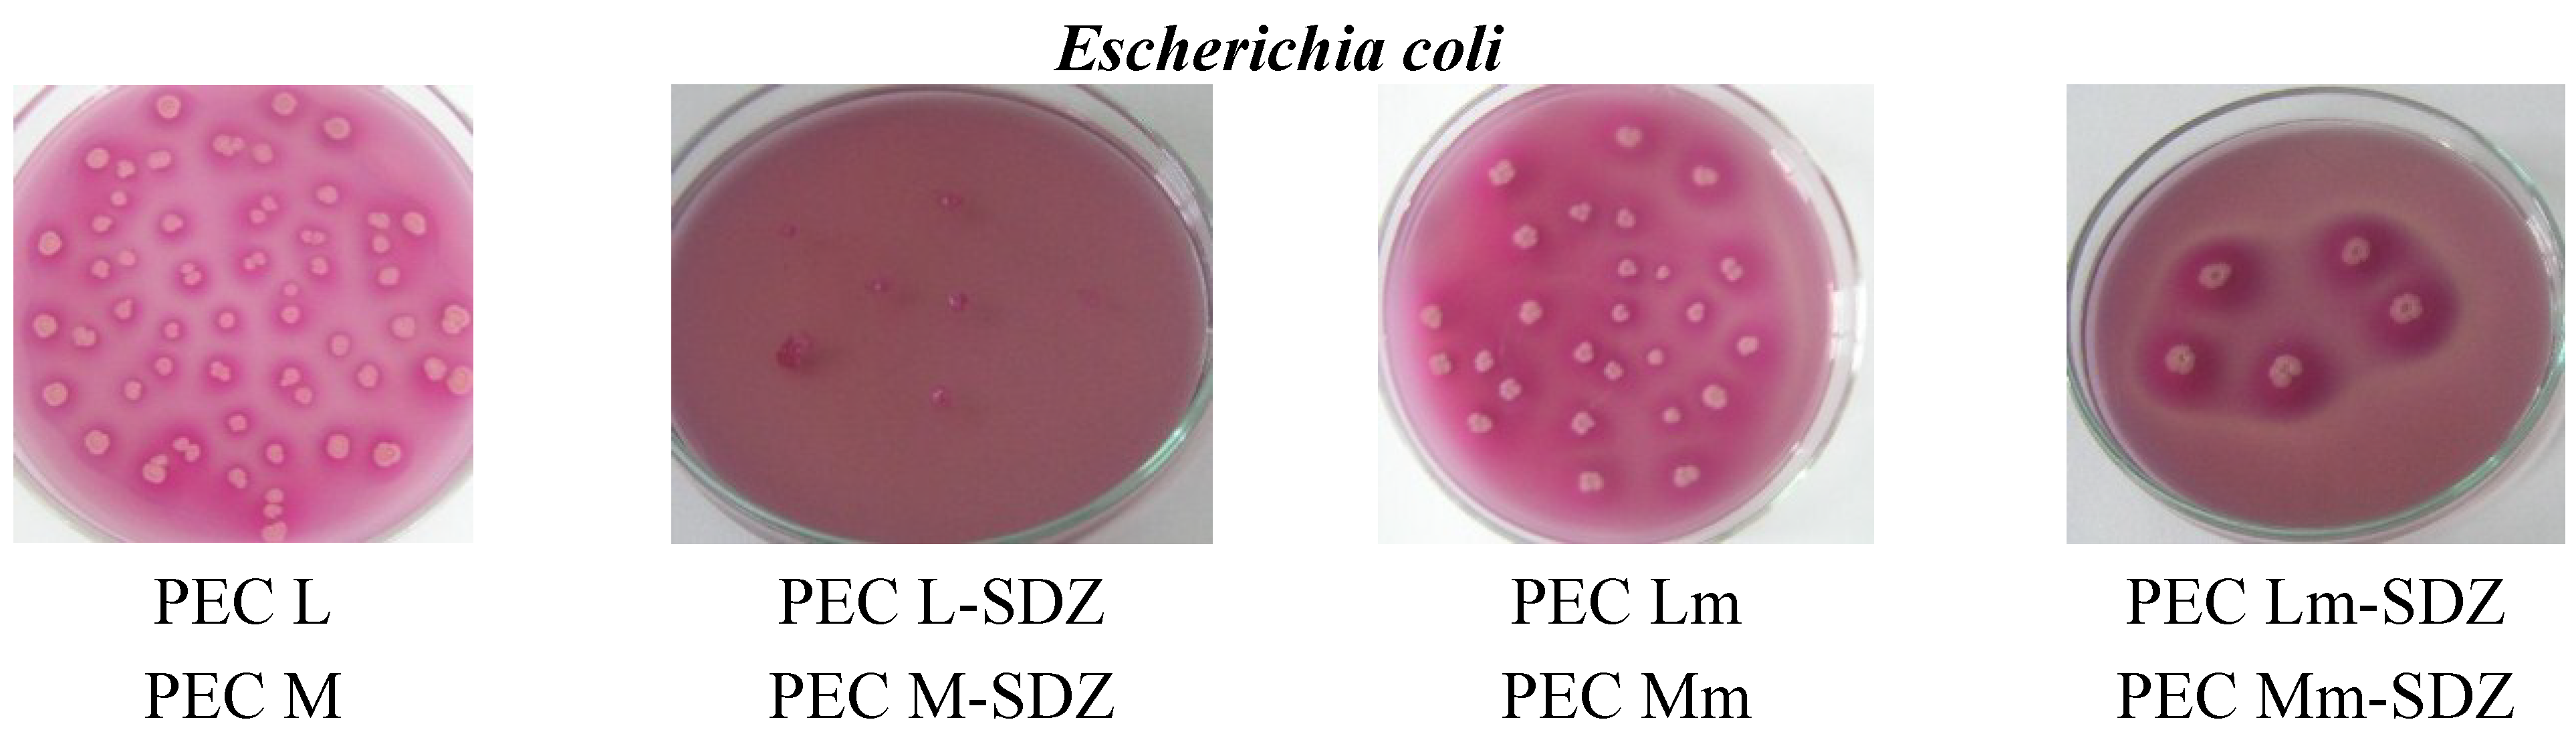
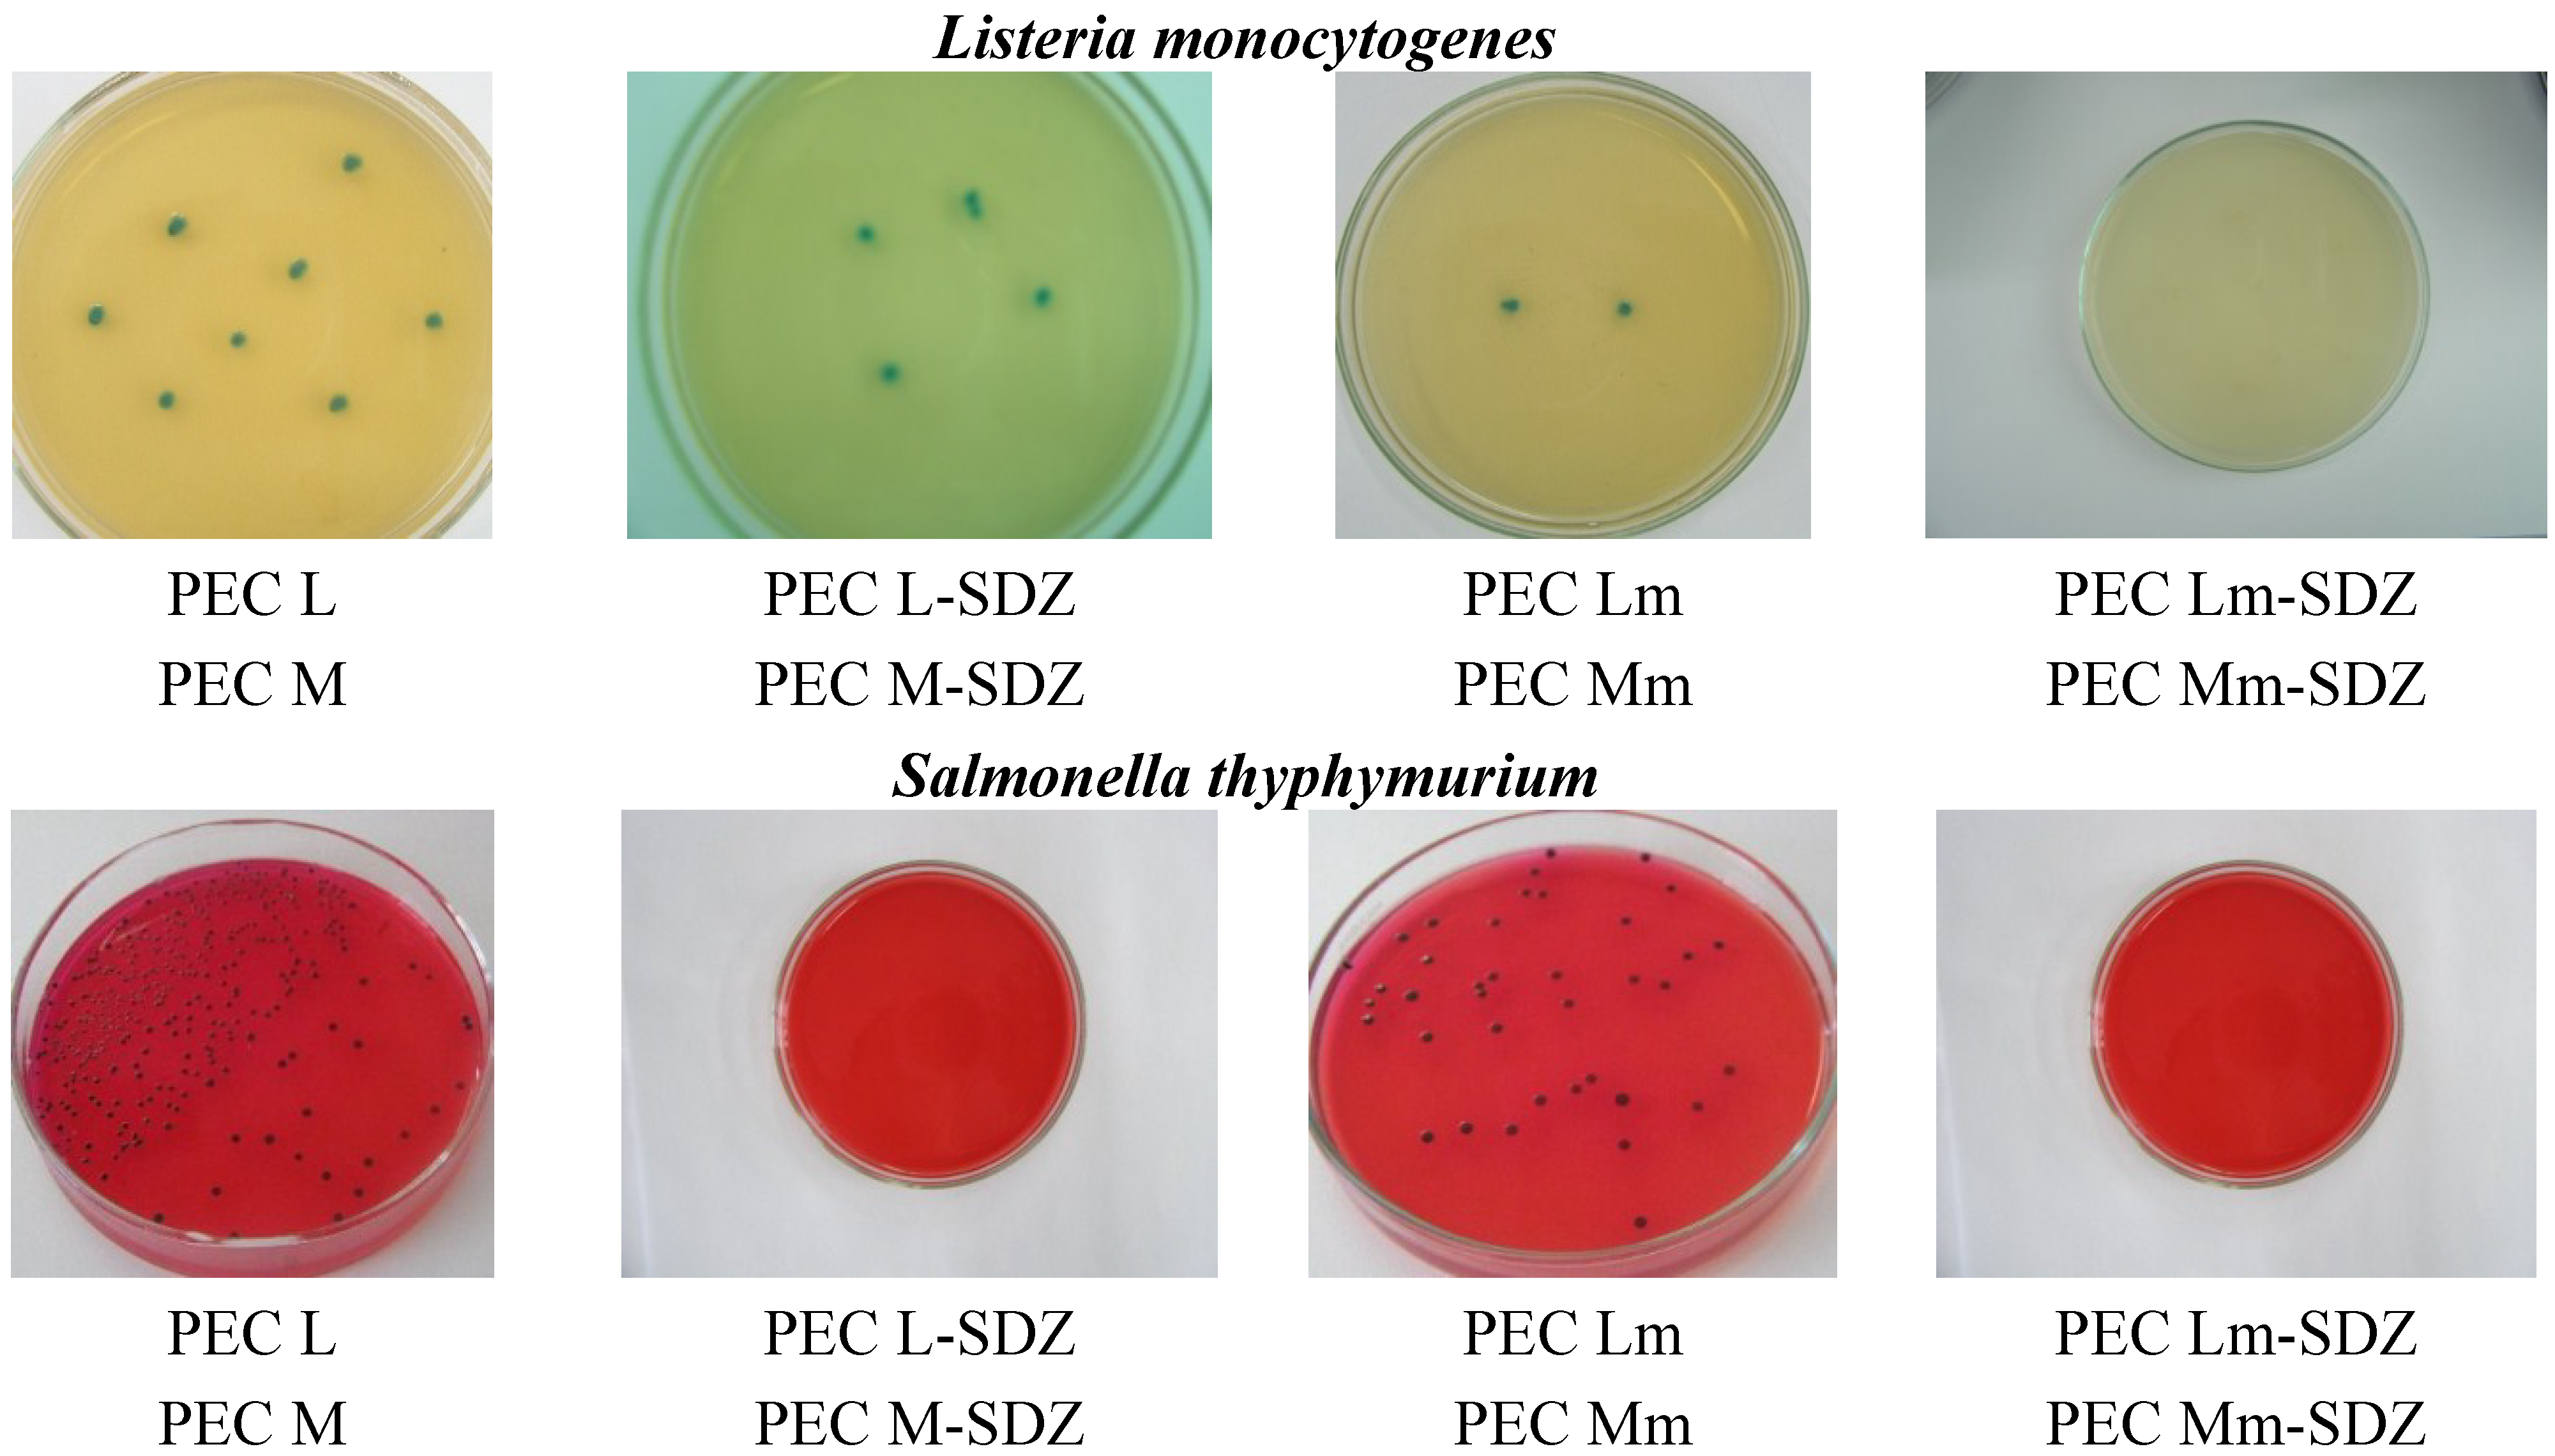
2.7. Antimicrobial Tests
The antimicrobial activity of the PECs obtained with CS, with SDZ-modified CS and with added SDZ to the PECs prepared was studied comparatively on three bacterial strains:
Escherichia coli,
Listeria monocytogenes and
Salmonella thyphymurium. The results obtained are presented in
Table 5.
Table 5.
Antimicrobial tests results.
Table 5.
Antimicrobial tests results.
| Sample | Inhibition (%) |
|---|
| Escherichia coli | Listeria monocytogenes | Salmonella thyphymurium |
|---|
| 24 h | 48 h | 24 h | 48 h | 24 h | 48 h |
|---|
| PEC L | 29 | 38 | 58 | 89 | 17 | 43 |
| PEC M | 49 | 67 | 66 | 83 | 39 | 52 |
| PEC Lm | 59 | 63 | 77 | 100 | 100 | 100 |
| PEC Mm | 52 | 79 | 64 | 92 | 31 | 81 |
| PEC L-SDZ | 49 | 71 | 45 | 77 | 25 | 50 |
| PEC M-SDZ | 68 | 90 | 74 | 100 | 87 | 100 |
| PEC Lm-SDZ | 83 | 95 | 100 | 100 | 94 | 100 |
| PEC Mm-SDZ | 72 | 94 | 70 | 94 | 96 | 88 |
The results obtained confirm the antimicrobial effect of CS-containing PECs ranging from 17% to 67% while SDZ has an inhibitory capacity of 70%–78%, while the SDZ/CS-containing samples have a significantly enhanced efficiency in activity, reaching even 100% inhibition of bacteria growth—mostly for samples with added SDZ proving their synergistic effect. For all three bacterial strains investigated, PECs Lm and Mm have an increased inhibition effect compared with CS-based PECs (PEC L and PEC M), while for the PECs with added SDZ, in particular PEC Lm-SDZ and PEC Mm-SDZ, the inhibition percent is even higher. Also the increase of antimicrobial activity was observed for PEC L and PEC M when SDZ was added (
Figure 9). No differences are found in antimicrobial activity of the PECs containing CS with low and medium average molecular weight.
Figure 9.
Representative microscopical aspects of the colonies of Escherichia coli, Listeria monocytogenes and Salmonella thyphymurium grown over polyelectrolyte complexes based chitosan/sodium hyaluronate (CS/HA PECs) without and with sulfadiazine (SDZ) modification.
Figure 9.
Representative microscopical aspects of the colonies of Escherichia coli, Listeria monocytogenes and Salmonella thyphymurium grown over polyelectrolyte complexes based chitosan/sodium hyaluronate (CS/HA PECs) without and with sulfadiazine (SDZ) modification.


 ,
, 


