1. Introduction
In structures, concrete is usually associated with steel rebar to form reinforced concrete or prestressed concrete. The structure will interact with the environment around it and, as a consequence, its materials are willing to develop reactions that may alter its initial conditions, not fulfilling the role that they were designed to perform, endangering, in this way, its durability.
According to Neville [
1], concrete must be able to withstand the expected process of deterioration due to the surrounding environment. When that is achieved, it is possible to say that the concrete will be durable. However, undefined life cycle does not mean durability, and also it is not related to the ability to bear any mechanical or aggressive load on the concrete. Neville [
1] recognizes that the main importance was always given to mechanical strength of concrete. However, nowadays it is assumed that strong concrete is a durable concrete, and both properties, mechanical strength and durability, must be considered explicitly in the design phase.
It is understood that, with the exception of mechanical damage, adverse influences on the durability involve the transportation of fluids, such as pure water or water carrying chloride ions, carbon dioxide and oxygen. These fluids, liquids and gases, can penetrate and move inside the concrete by different paths through the porous media, not only because of the fluidity, but also because of diffusion and absorption. The interconnected pores contribute to increase the permeability. The absorption occurs because of the capillarity effect in the concrete pores that are open to the environment; suction may only occur in a partially dry concrete, and no water can be absorbed in a completely dry or saturated concrete. On the other hand, diffusion occurs when the transportation of a gas or steam through concrete is the result of a concentration gradient and not from a pressure difference, like where carbon dioxide leads to the carbonation of the hydrated paste and oxygen allows the corrosion progress of the reinforcements involved in the concrete. Therefore, an impermeable and dense concrete will greatly reduce the entrance of aggressive agents in its interior, limiting corrosive attacks only on its surface. The water/cement ratio, temperature, level of hydration, cement compounds and mineral additions incorporation, capillary porosity, permeability, among other factors, influence the durability properties of the self-compacting concrete (SCC) and conventional vibrated concrete (CC) [
2,
3,
4,
5].
In Brazil, since 2003, with the new standard NBR 6118,
Design of structural concrete—Procedure [
6], technicians who design concrete structures are more concerned about the concept and the ways to obtain a higher durability in concrete construction sites.
Recife, a coastal city, capital of Pernambuco state, is considered the fifth largest metropolitan population in Brazil, with 4,046,845 citizens [
7]. It combines harmful conditions for reinforced concrete structures, such as annual average high temperatures of 29.1 °C, relative humidity of 79.8%, pluviometric precipitation of 2417.6 mm, 2550.7 h sunny hours, besides marine atmosphere according to National Weather Institute (INMET) [
8]. Thus, there is an adequate environment to increase the chloride diffusion rate and of contamination by carbonation in the concrete, among other factors that contribute to the deterioration of reinforced concrete elements. The amount of conventional concrete construction sites that does not reach the project expected service life tends to be higher if mitigating actions are not adopted in the steps of design, execution, and maintenance [
9,
10]. Another relevant aspect in Recife’s region was the occurrence of pathologies typical of an alkali-aggregate reaction [
11].
De Schutter [
2] verified that much is known about durability of CC, but there are still problems once a vibration operation is needed to promote the densification. Because of the self-compacting ability, SCC does not need any vibration and therefore will not be affected by these problems, although less is known about its durability. Therefore it is necessary to study the durability of SCC in comparison to CC in tropical coastal environments, which have more aggressive climates and higher temperatures [
12].
The present work presents studies applied to hardened concrete, developed in research laboratories associated with studies applied to a construction site of the Pernambuco Arena. The Pernambuco Arena was constructed between 2011 and 2013 to receive the Confederations Cup in 2013 and the World Cup in 2014, both sponsored by FIFA. The Arena has a constructed area of 128,000.0 m
2, capacity of 46,105 people, with an approximate total volume of applied concrete of 58,000.0 m
3, being 40% (23,200.0 m
3) SCC and 60% (34,800.0 m
3) CC. The goal was to identify possible differences between SCC and CC, allowing establishing which one of the concretes presents higher durability indicators [
13].
The literature presents some recent specific studies of durability and resistance applied to SCC and CC related to the effect of water/cement ratio, cement, binder composition variation, and especially addition of metakaolin, according to the authors of these studies [
11,
14,
15,
16]. The objective was to study the behavior of SCC and CC, comparing their performance to sulfate resistance, carbonation, porosity, electrical resistance, permeability and chloride penetration. The results showed that, in general, SCC presents better performance than CC. It is also possible to establish a more adequate composition of each concrete with determined resistance and durability characteristics demanded by mechanical requirements and environmental conditions [
17,
18,
19,
20,
21].
2. Experimental Methodology
2.1. Concrete Composition for Specimen Molding
For the laboratory studies, two compositions of concrete were established: one for SCC (SCC_Lab) and another for CC (CC_Lab), with constituents usually found and applied to the selected region, in order to ensure similarity with the concretes used there. This similarity between the compositions of SCC_Lab and CC_Lab was considered on account of both the same water/binder and cement/fine ratios and the use of the same constituents in both compositions. In respect to the Pernambuco Arena construction sites, SCC (SCC_AP) and CC (CC_AP) compositions were chosen among the largest applied volume with similar characteristics [
22].
In the laboratory, the following tests were performed on SCC_Lab and CC_Lab samples: compressive strength, electrical resistivity, diffusion of chloride ions, accelerated carbonation, open porosity, and water absorption by capillarity. Another aspect to be considered is the microstructure of SCC compared to CC. The absence of vibration, associated with the possible existence of a higher amount of paste in SCC, does cause modifications in the interfacial transition zone between aggregates and paste in comparison to CC. Thus, scanning electron microscopy (SEM) and microtomography (MT) techniques were used to study and compare the microstructure of both types of concrete [
23,
24,
25,
26].
The experiments developed at the construction site of the Pernambuco Arena were carried out with samples of SCC_AP and CC_AP. For the hardened concrete, the following experiments were performed: compressive strength, elasticity modulus, diffusion of chloride ions, open porosity and water absorption. In order to simulate as close as possible the conditions of the construction sites used, the samples of SCC_AP and CC_AP were divided in two types: those stored at the construction site in the same conditions as in the laboratory (SCC_AP-CP and CC_AP-CP); and those ones extracted as concrete cores from concrete elements deliberately produced for these tests and cast, cured and exposed to the same conditions as the concrete applied to the structural elements of the construction work (SCC_AP-TE and CC_AP-TE).
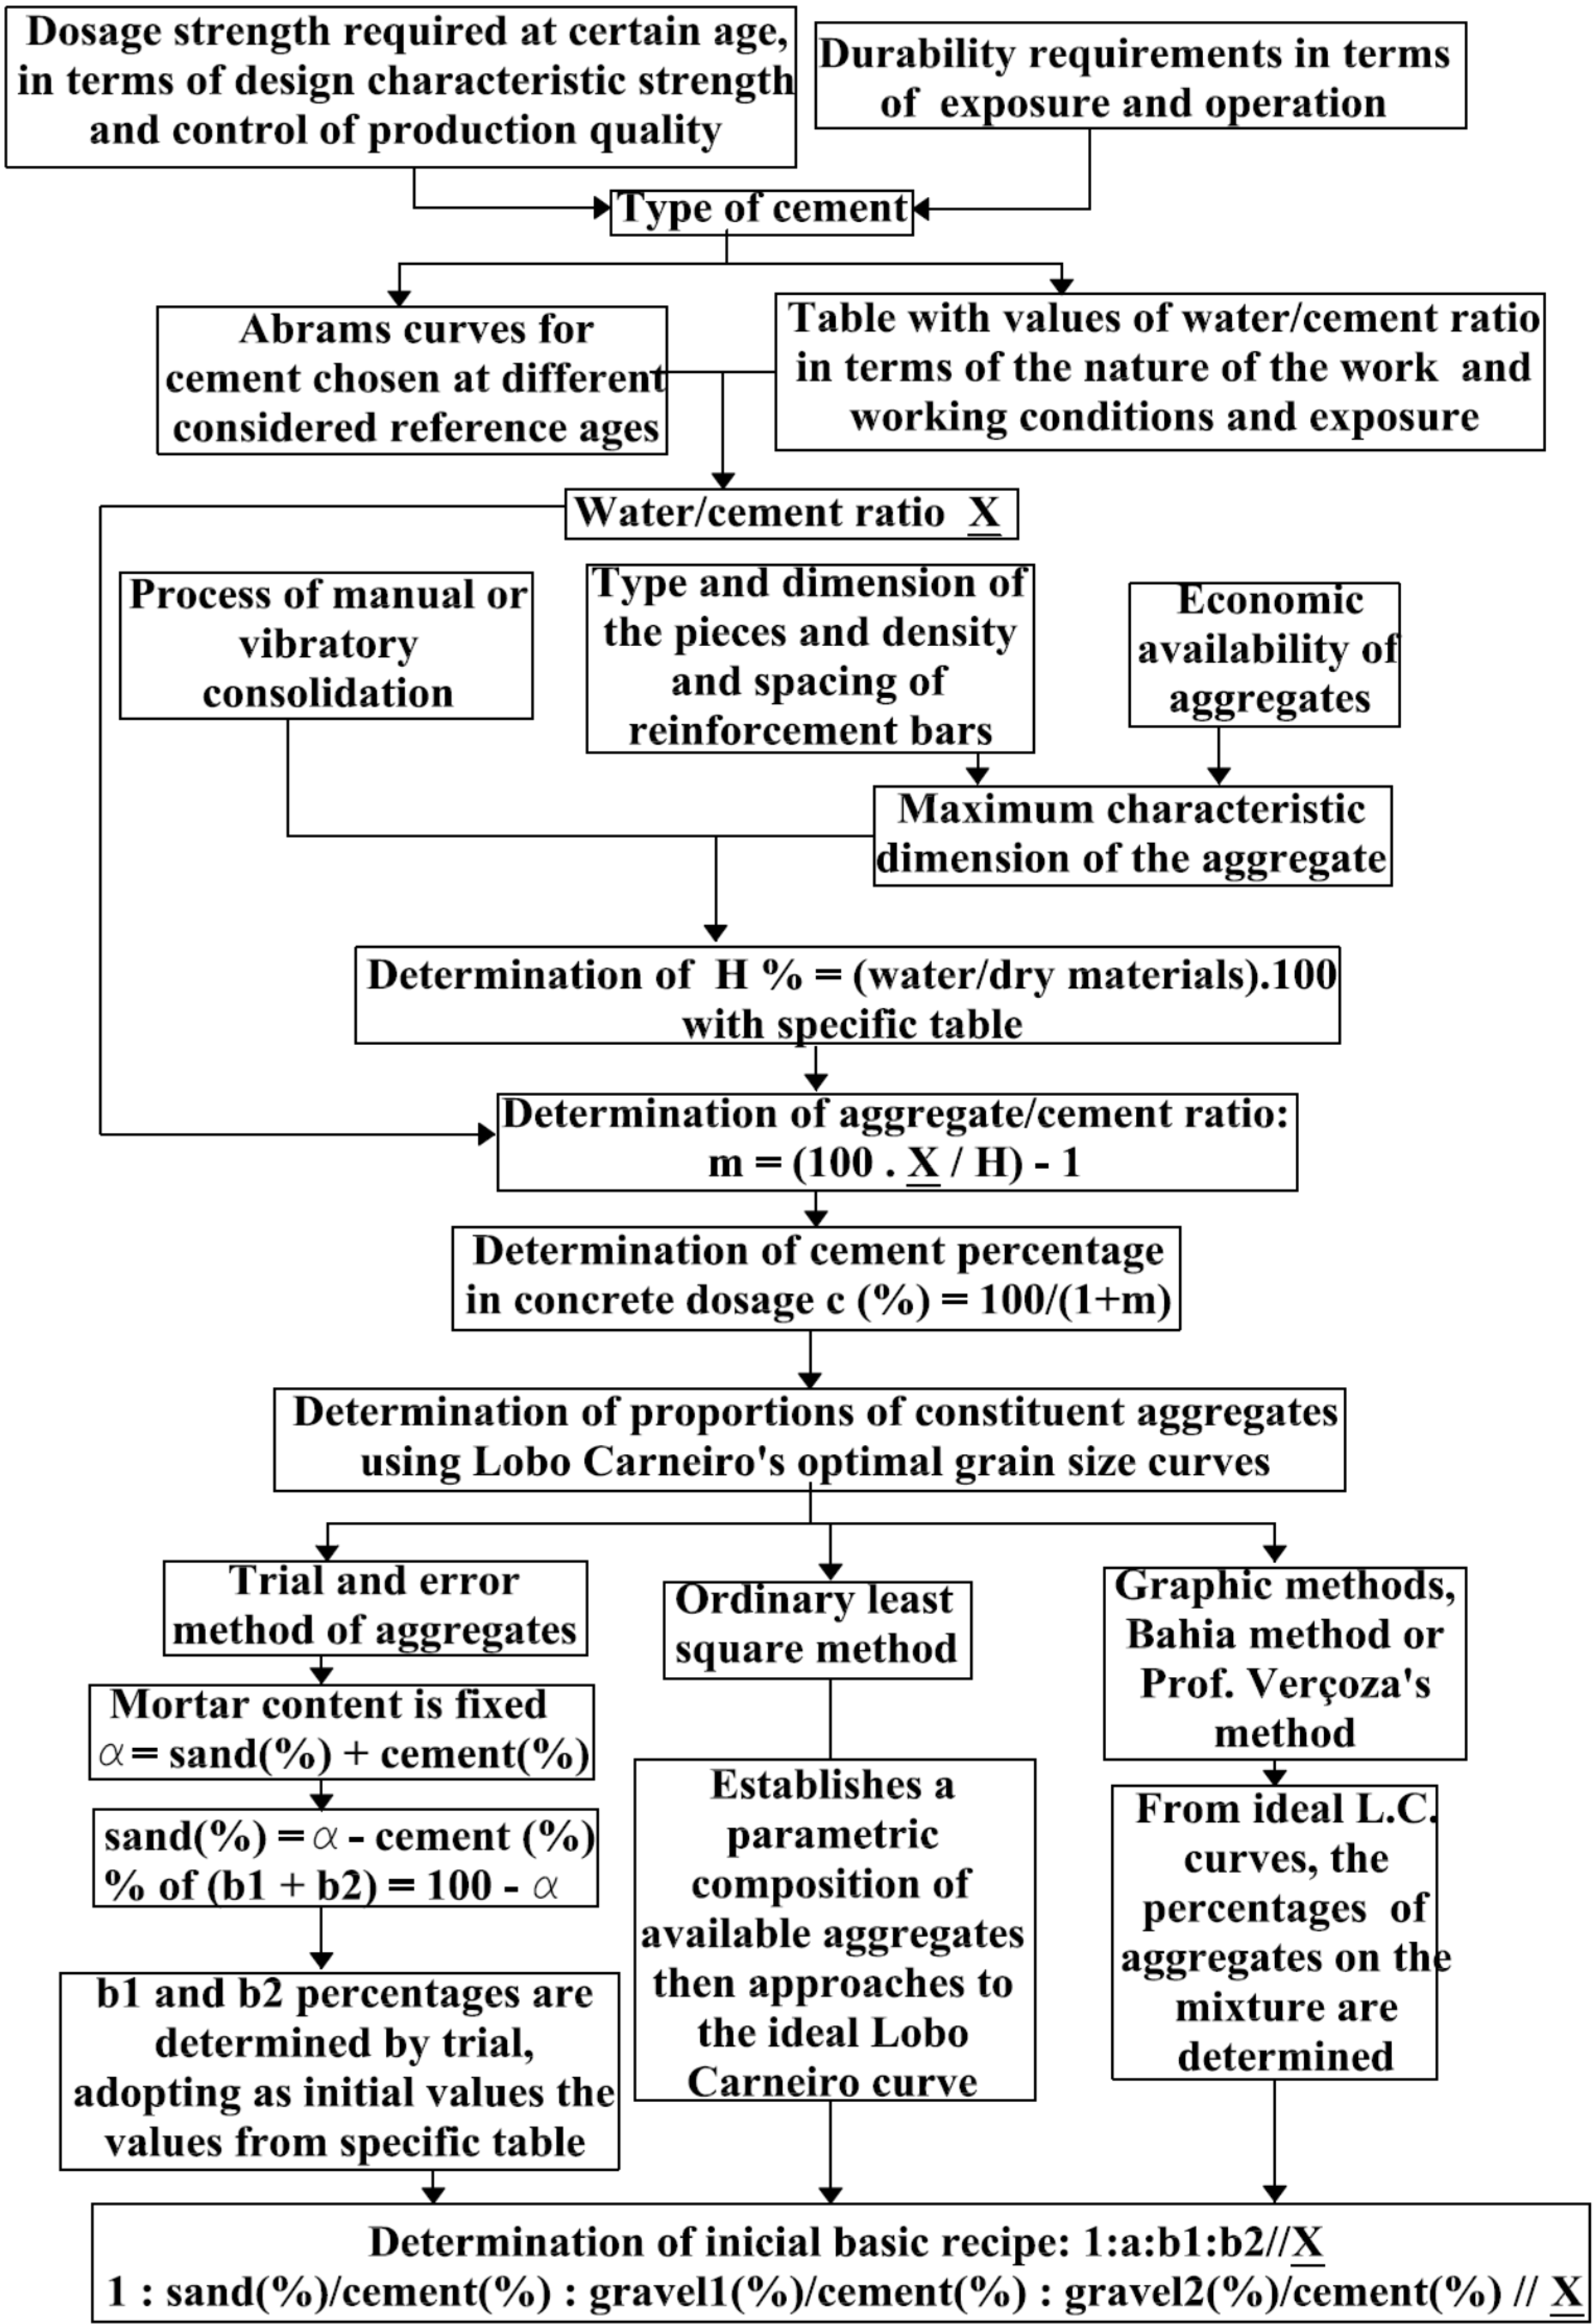
The concrete mix-design methodology, known as INT and proposed by Lobo Carneiro [
27,
28], was used in this study. This method searches for an optimum particle size proportion of the selected aggregates, with the intent of obtaining the maximum compactness of the concrete mixture. The activities, variables and input information of the method may be summarized in this way: the concrete strength required at a certain age and the durability requirements lead to the selection of the type of cement; Abrams curves and water/cement ratio, as a function of workability, lead to an appropriate water/cement ratio; the densification process and maximum dimension of the aggregate lead to a water/dry materials ratio that, associated to a water/cement ratio, leads to an aggregate/cement ratio; then, a percentage of cement in the composition of the concrete and the determination of the proportions of the mixture aggregate components are determined by optimum particle size curves proposed by Lobo Carneiro (see
Figure 1).
The SCC and CC compositions were chosen in order to ensure high similarity between them. Thus, the appropriate cement content in each composition was determined so that the same water/cement and cement/fine ratios were obtained. Thereby, for the laboratory tests, 419 kg/m
3 and 416 kg/m
3 of cement were used for SCC and CC, respectively. For the construction site of the Pernambuco Arena, 499 kg/m
3 and 451 kg/m
3 of cement were used for SCC and CC, respectively. Also, the other components used, such as aggregates, mineral additions and chemical admixtures, were the most commonly used in the region. Metakaolin was added to SCC_Lab and CC_Lab compositions used in the research laboratory, as it has been used as an alternative to avoid preventively deleterious reactions verified in the region, such as alkali-aggregated type according to [
14,
15,
16].
2.2. Materials and Components Applied in the Concretes
For the research laboratory studies, used Portland cement CP-V ARI was used, with high initial resistance, which is equal to the CEM I 42.5 cement in Europe. For the studies in the Pernambuco Arena construction site, the selected compositions were the Portland compound cement with limestone filler CP-II F 32, which is equal, in Europe, to CEM II/A-L 32.5 cement. The chemical admixtures applied were: (a) a plasticizer with a high water reduction effect composed of sulfonated salt and carbohydrates in aqueous medium, with density of 1190 kg/m
3 and pH of 5.5; and (b) a liquid superplasticizer of third generation normal grip, composed of polycarboxylates in aqueous medium, density of 1060 kg/m
3 and pH of 5.0. The thin and coarse aggregates used were the ones available in the market, and the same ones were applied in the SCC_Lab, CC_Lab, SCC_AP, and CC_AP compositions. The coarse aggregate was crushed from granitic stone, and the thin aggregate was obtained from a quartz origin, extracted from riverbed deposits. The water used to prepare the compositions for the experiments in the laboratory were provided by Compesa, a local company of treated water for public consumption. The water for the tests in the Pernambuco Arena was provided by a drilled well at the location [
29].
Figure 1.
Simplified flowchart of the dosage method, known as INT/Lobo Carneiro [
27].
Figure 1.
Simplified flowchart of the dosage method, known as INT/Lobo Carneiro [
27].
Table 1 presents the compositions of SCC and CC used in our experiments, for both studies in the research laboratory, SCC_Lab and CC_Lab, and in the Pernambuco Arena, SCC_AP and CC_AP. The amounts of each constituent are indicated per cubic meter of concrete, but it is worth mentioning that all of them are commonly employed regionally. The site concrete mixtures shown were used in the superstructure construction, where metakaolin is usually not applied locally. The other differences from laboratory mixtures result from the analysis of the present studies and site construction experience, which indicated the need for at least 90 minutes from output of the concrete plan to actual casting.
The workability of the fresh compositions is also presented in
Table 1, where the obtained results of slump flow for SCC or slump for CC are shown.
Table 1.
Compositions of SCC and CC.
Table 1.
Compositions of SCC and CC.
| Components | Unit | Laboratory concrete | Construction site concrete |
|---|
| SCC_Lab | CC_Lab | SCC_AP | CC_AP |
|---|
| Cement (1) | kg/m3 | 419 | 416 | 499 | 451 |
| Metakaolin | kg/m3 | 36 | 36 | - | - |
| Sand | kg/m3 | 947 | 661 | 856 | 815 |
| Aggregate 1 12.5 mm | kg/m3 | 227 | - | - | - |
| Aggregate 2 19.1 mm | kg/m3 | 529 | 1028 | 830 | 917 |
| Water | kg/m3 | 205 | 203 | 199 | 180 |
| Superplasticizer | kg/m3 | 5 | - | 4.9 | 2.1 |
| Plasticizer | kg/m3 | 4.20 | 2.60 | 3.40 | 4.40 |
| water/binder | | 0.45 | 0.45 | 0.40 | 0.40 |
| cement/fine | | 0.92 | 0.92 | 1.00 | 1.00 |
| Slump flow or Slump | mm | 700 | 416 | 499 | 451 |
2.3. Types of Specimens Used in the Experiments in the Pernambuco Arena Construction Site
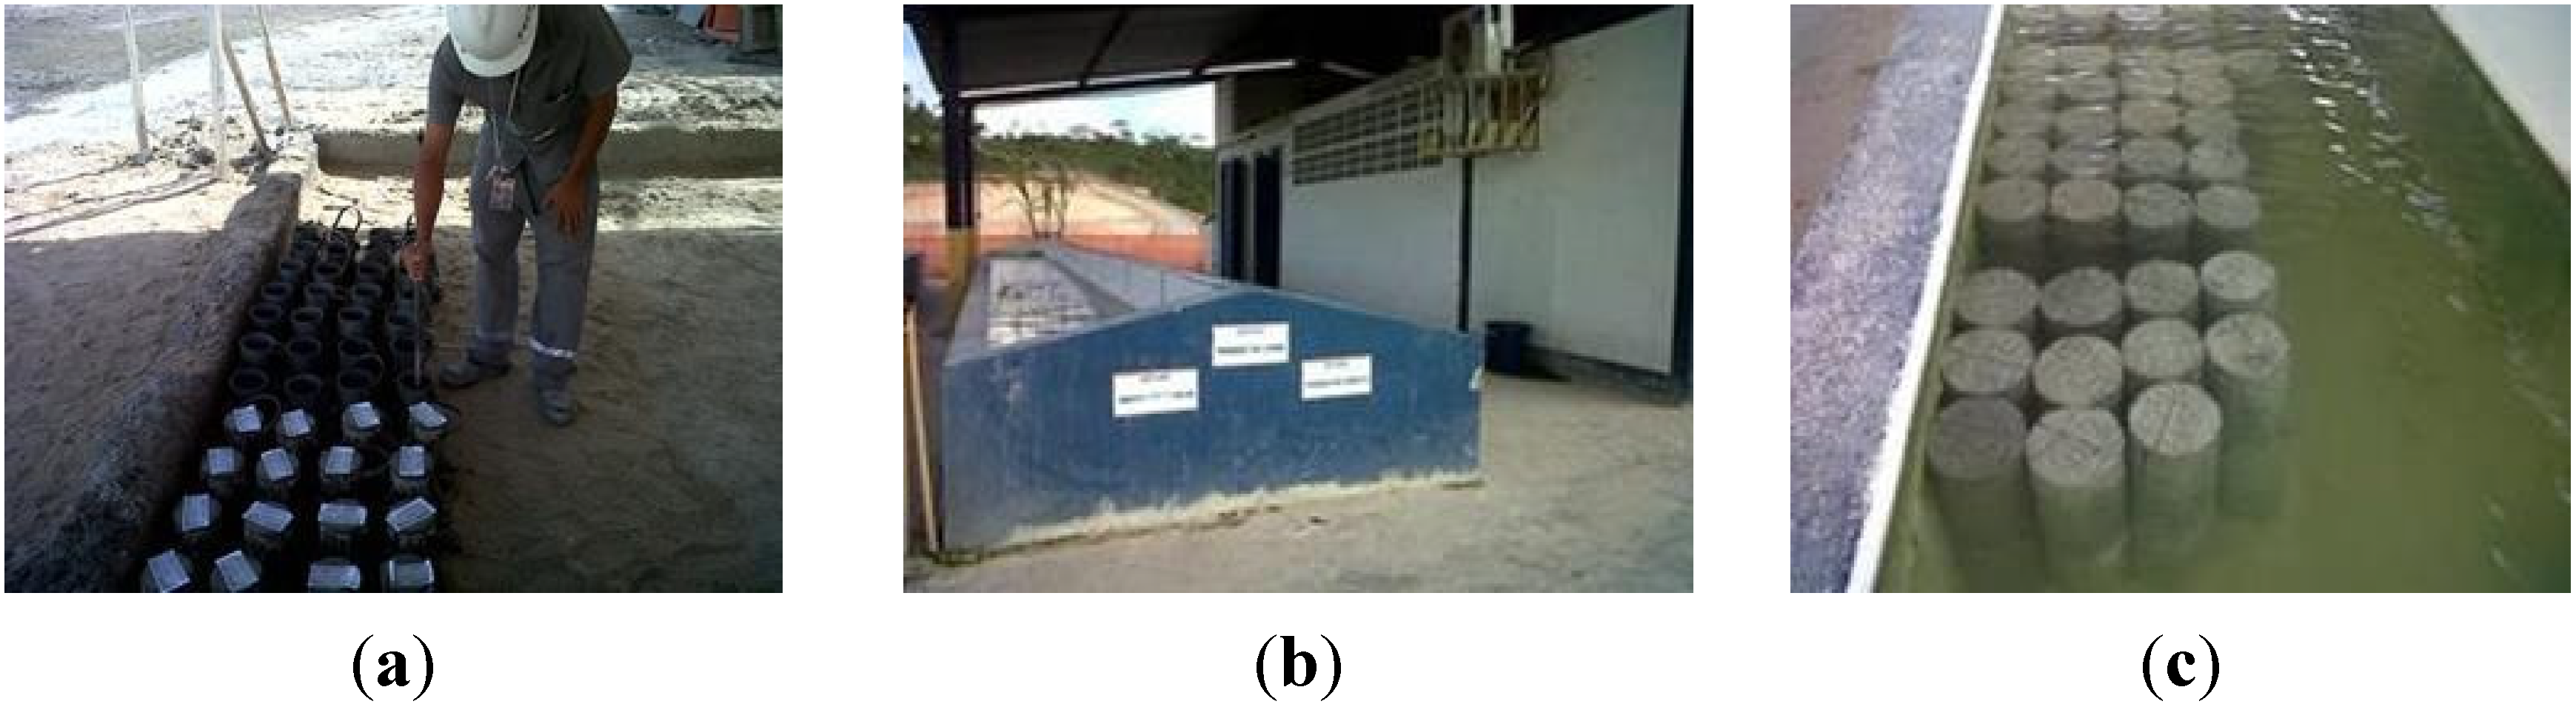
The experiments were carried out with two types of samples collected from the concrete that would be used in the structural elements of the construction work. The first type of sample was specimens molded and stored in laboratory conditions at the construction site (named SCC_AP-CP and CC_AP-CP), according to EN 12390-2:2009 Testing hardened concrete—Part 2: Making and curing specimens for strength tests, as presented in
Figure 2a–c. The curing process was water immersion. The curing process was done during the coldest months of the year,
i.e., May, June and July, with maximum, average, and minimum temperatures equal to 29 °C, 25 °C and 21 °C, respectively. The average relative humidity was 80%.
Figure 2.
Cure of the samples at laboratory conditions. (a) specimen’s casting; (b) curing tank; (c) specimens immersed in the curing tank.
Figure 2.
Cure of the samples at laboratory conditions. (a) specimen’s casting; (b) curing tank; (c) specimens immersed in the curing tank.
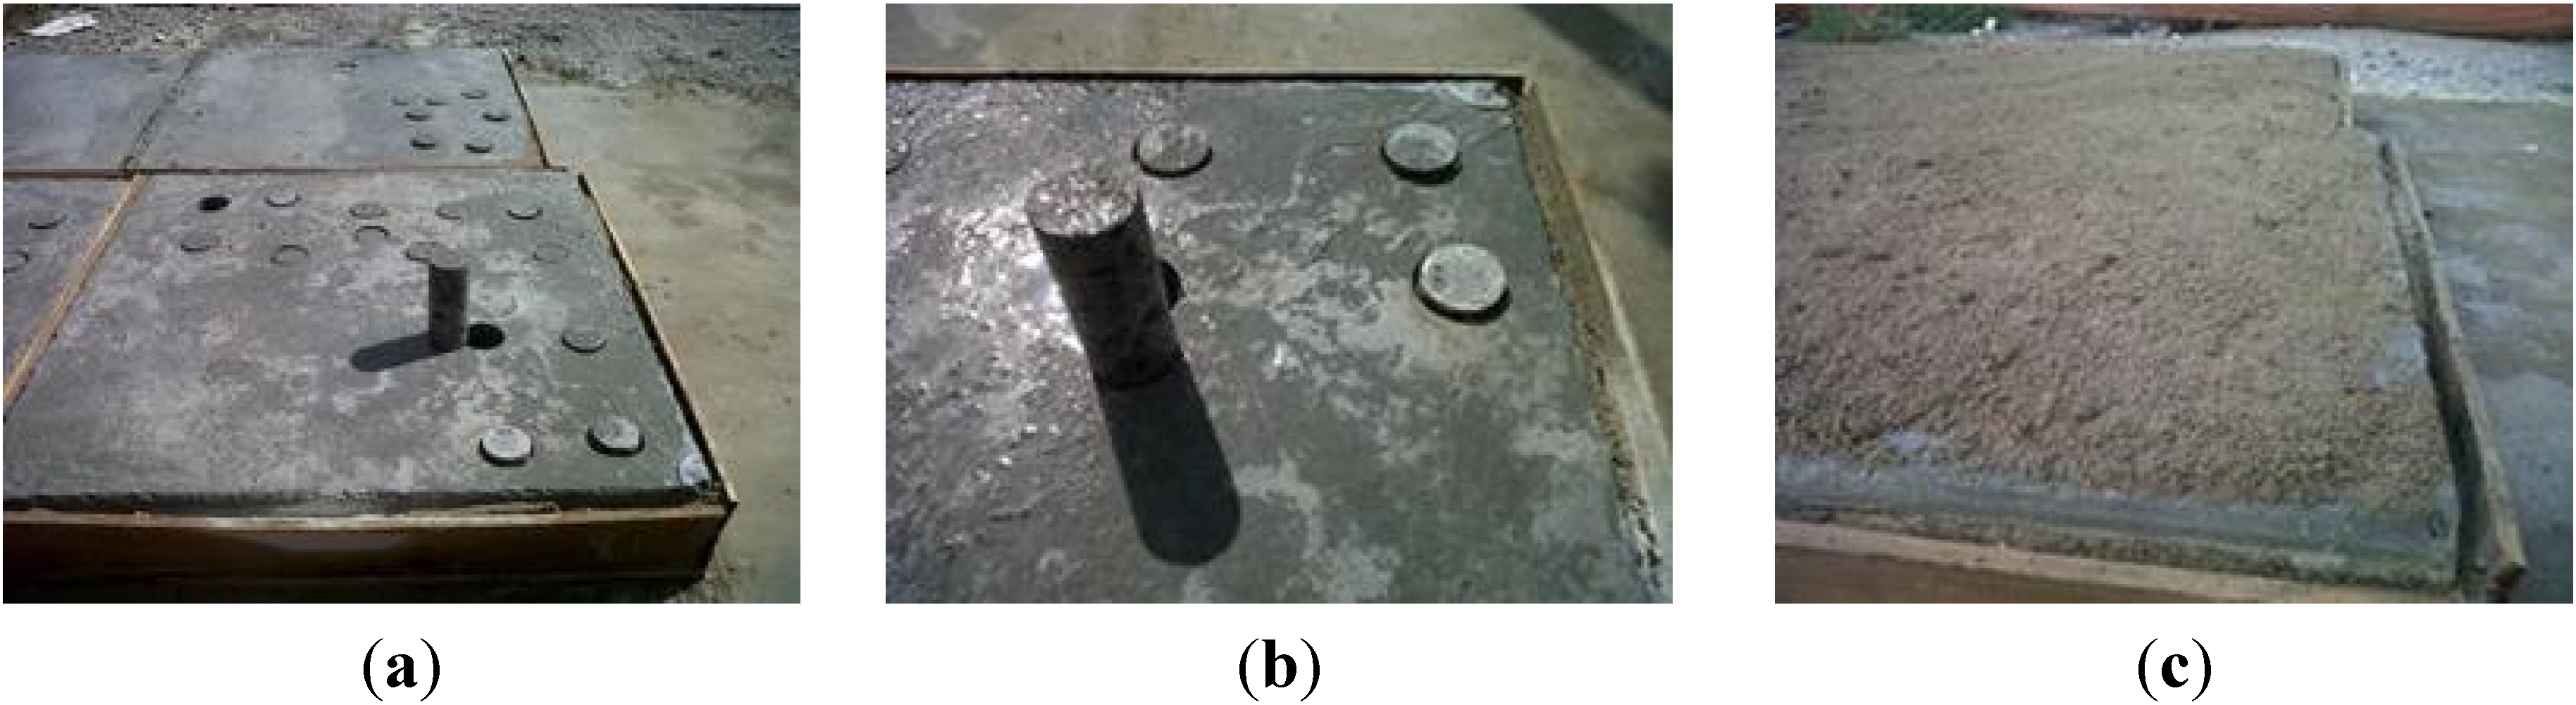
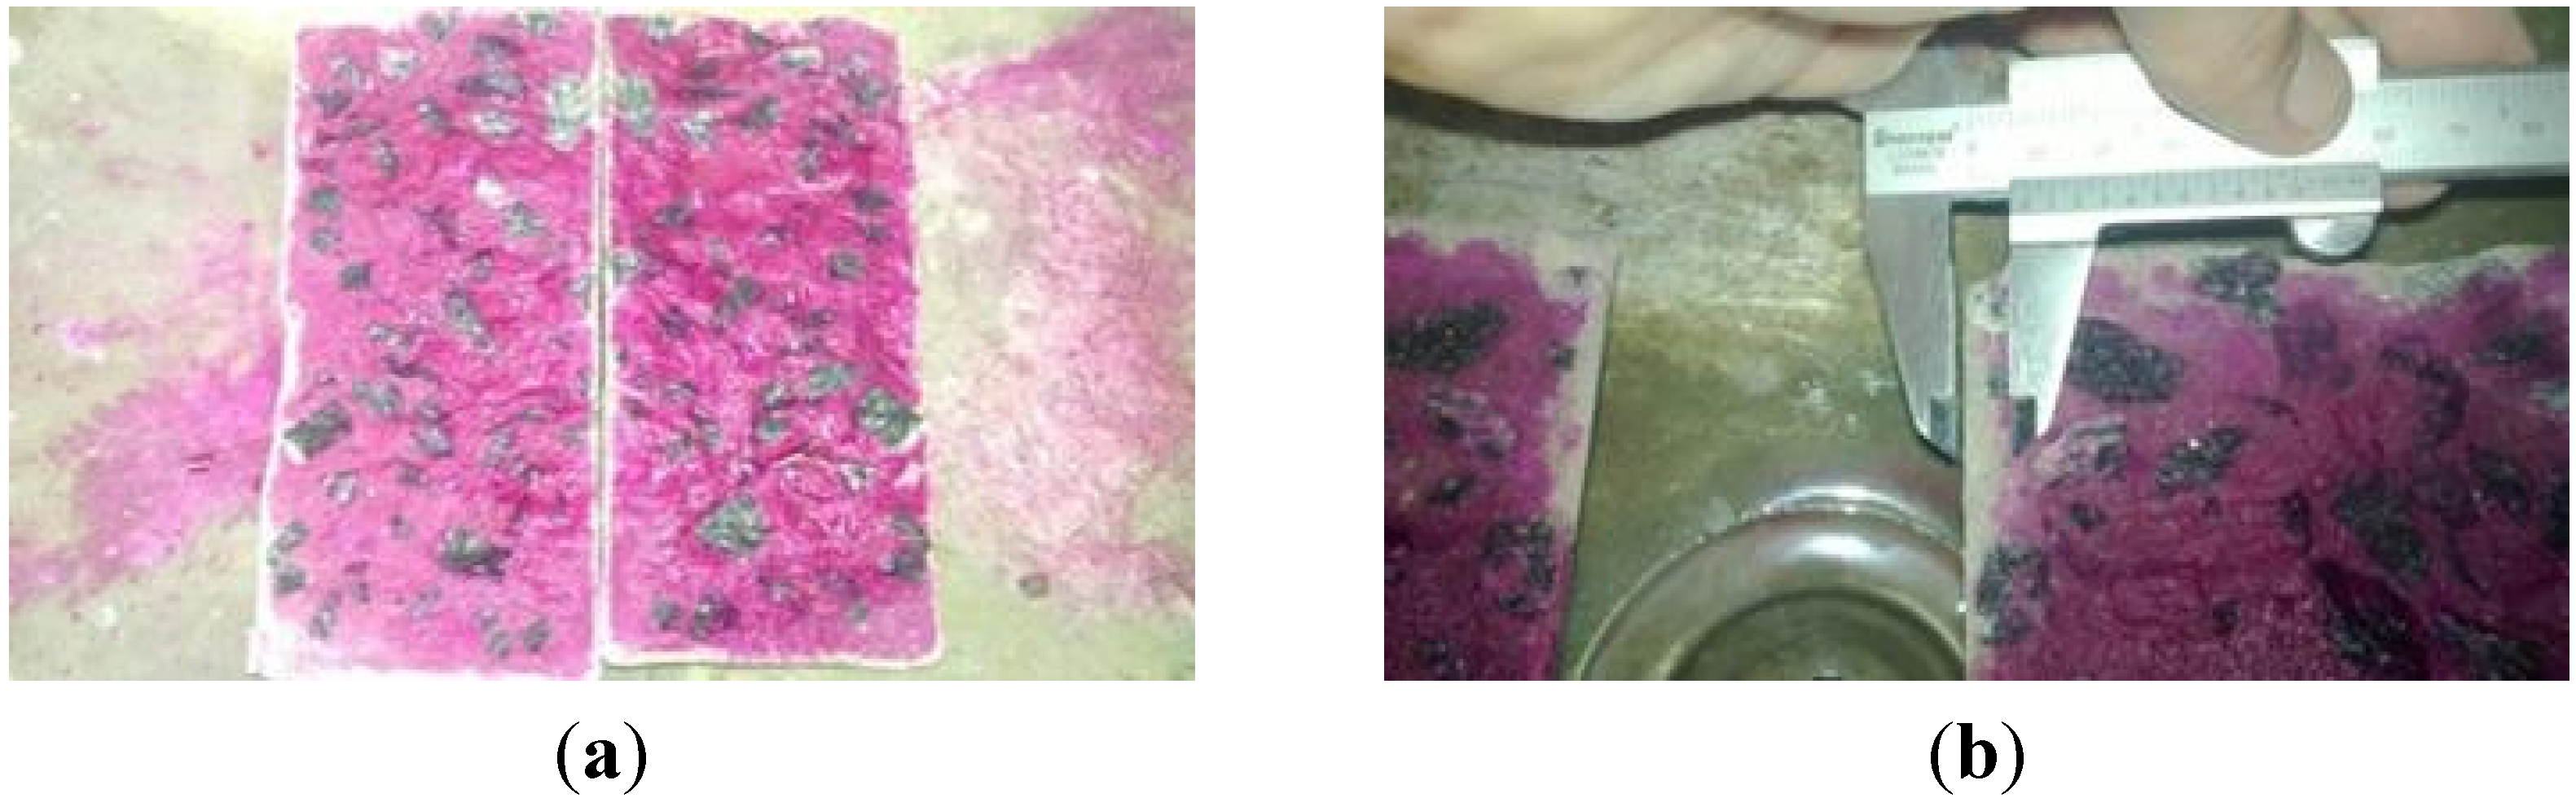
The second type of samples was obtained by the extraction of specimens from molded and cured concrete elements (named SCC_AP-TE and CC_AP-TE) at the same conditions as the one applied in the construction work, at the same local environment, as can be seen in
Figure 3.
Figure 3.
Cure of the specimens at local atmospheric conditions. (a) concrete core; (b) detail of concrete core; (c) concrete block.
Figure 3.
Cure of the specimens at local atmospheric conditions. (a) concrete core; (b) detail of concrete core; (c) concrete block.
From the group of compositions really used in the Pernambuco Arena, two of the most applied ones were selected: one SCC (SCC_AP) and one CC (CC_AP), which together represent 55% of the total amount of concrete applied during May, June and July, 2012. Both compositions may be considered similar, since they have the same water/cement ratio (W/C = 0.40) and the same constituents, despite different proportions. SCC_AP composition was applied to walls and columns, and CC_AP composition was applied in beams.
3. Results and Discussion
For the research laboratory studies (SCC_Lab and CC_Lab) and for the construction site of the Pernambuco Arena (SCC_AP and CC_AP), the specimens were molded at room temperature, 32 °C, with the goal of representing the real conditions of the region studied herein. Thus, if the results of the performed tests show that the durability of SCC is compatible or even higher than CC, its utilization may represent an advantageous option to be applied in structures constructed in the region.
3.1. Compressive Strength and Elasticity Modulus
Table 4 presents the average results of the compressive strength for the research laboratory concretes.
Table 4.
Results of the compressive strength (fcm) for the research laboratory concretes.
Table 4.
Results of the compressive strength (fcm) for the research laboratory concretes.
| Age (days) | fcm (MPa) |
|---|
| SCC_Lab | CC_Lab |
|---|
| 3 | 33.98 ± 1.71 | 32.32 ± 1.33 |
| 7 | 36.19 ± 4.87 | 33.03 ± 2.70 |
| 14 | 44.69 ± 1.31 | 40.39 ± 0.90 |
| 28 | 45.86 ± 2.33 | 42.69 ± 0.25 |
| 56 | 45.36 ± 2.38 | 43.28 ± 1.55 |
| 90 | 54.44 ± 2.57 | 43.80 ± 0.52 |
Analyzing
Table 1, it is noted that the compositions used for SCC and CC are very similar; practically the same cement amount (419 kg/m
3 for SCC and 416 kg/m
3 for CC) and the same content of metakaolin (36 kg/m
3), water/binder (0.45), and cement/fine (0.92). Because of this fact, very close compressive strengths for SCC and CC were expected. The main difference between both concretes was: 0.58% of plasticizer/binder for CC and 0.92% of plasticizer/binder plus 1.10% of superplasticizer/binder for SCC. Therefore, the hypothesis can be established that SCC achieves better packing, because of self-compactability that reduces the porosity, enhances the interfacial transition zone between the binder paste and the aggregates, and improves the strength in SCC mixtures [
40,
41,
42]. Desnerck [
43], based on a database with over 250 results of published papers, compared the 28 days compressive strength (f
c,28) for SCC and CC and found values 10% higher for SCC, related to its higher microstructure density. Vita
et al. [
44], studying cracking of SCC at initial ages, obtained a better mechanical performance and a higher durability of SCC, because of its resistance to segregation and its fluidity eliminate macro defects, air bubbles and concreting failures. It is understood that these defects are directly responsible for losses in the mechanical and durability performance of the concrete structure.
Table 5 presents experimental average results of the compressive strength and elasticity modulus performed at the research laboratory and at the construction site of the Pernambuco Arena, in concretes at an age of 33 days.
It is verified that the average compressive strength of molded specimens in comparison with the cores was 1.2% higher for SCC and 3.6% for CC, which indicates a possible improvement of the stored concrete in laboratory conditions. However, the small difference only works as an indicative. For the average elasticity modulus of SCC, the cores were 3.1% higher than the specimens, contrary to the CC, whose average elasticity modulus of the molded specimens was 3% higher than the cores. So, the results are compatible with non-significant differences, as they are in the error range of the experiments.
Table 5.
Compressive strength (fcm) and modulus of elasticity (Ecm) for the Pernambuco Arena.
Table 5.
Compressive strength (fcm) and modulus of elasticity (Ecm) for the Pernambuco Arena.
| Composition | fcm (MPa) | Ecm (GPa) |
|---|
| SCC_AP-CP | 62.58 ± 1.72 | 41.10 ± 0.87 |
| SCC_AP-TE | 63.14 ± 3.22 | 39.90 ± 1.17 |
| CC_AP-CP | 57.42 ± 1.69 | 38.20 ± 1.31 |
| CC_AP-TE | 56.73 ± 3.65 | 39.40 ± 2.32 |
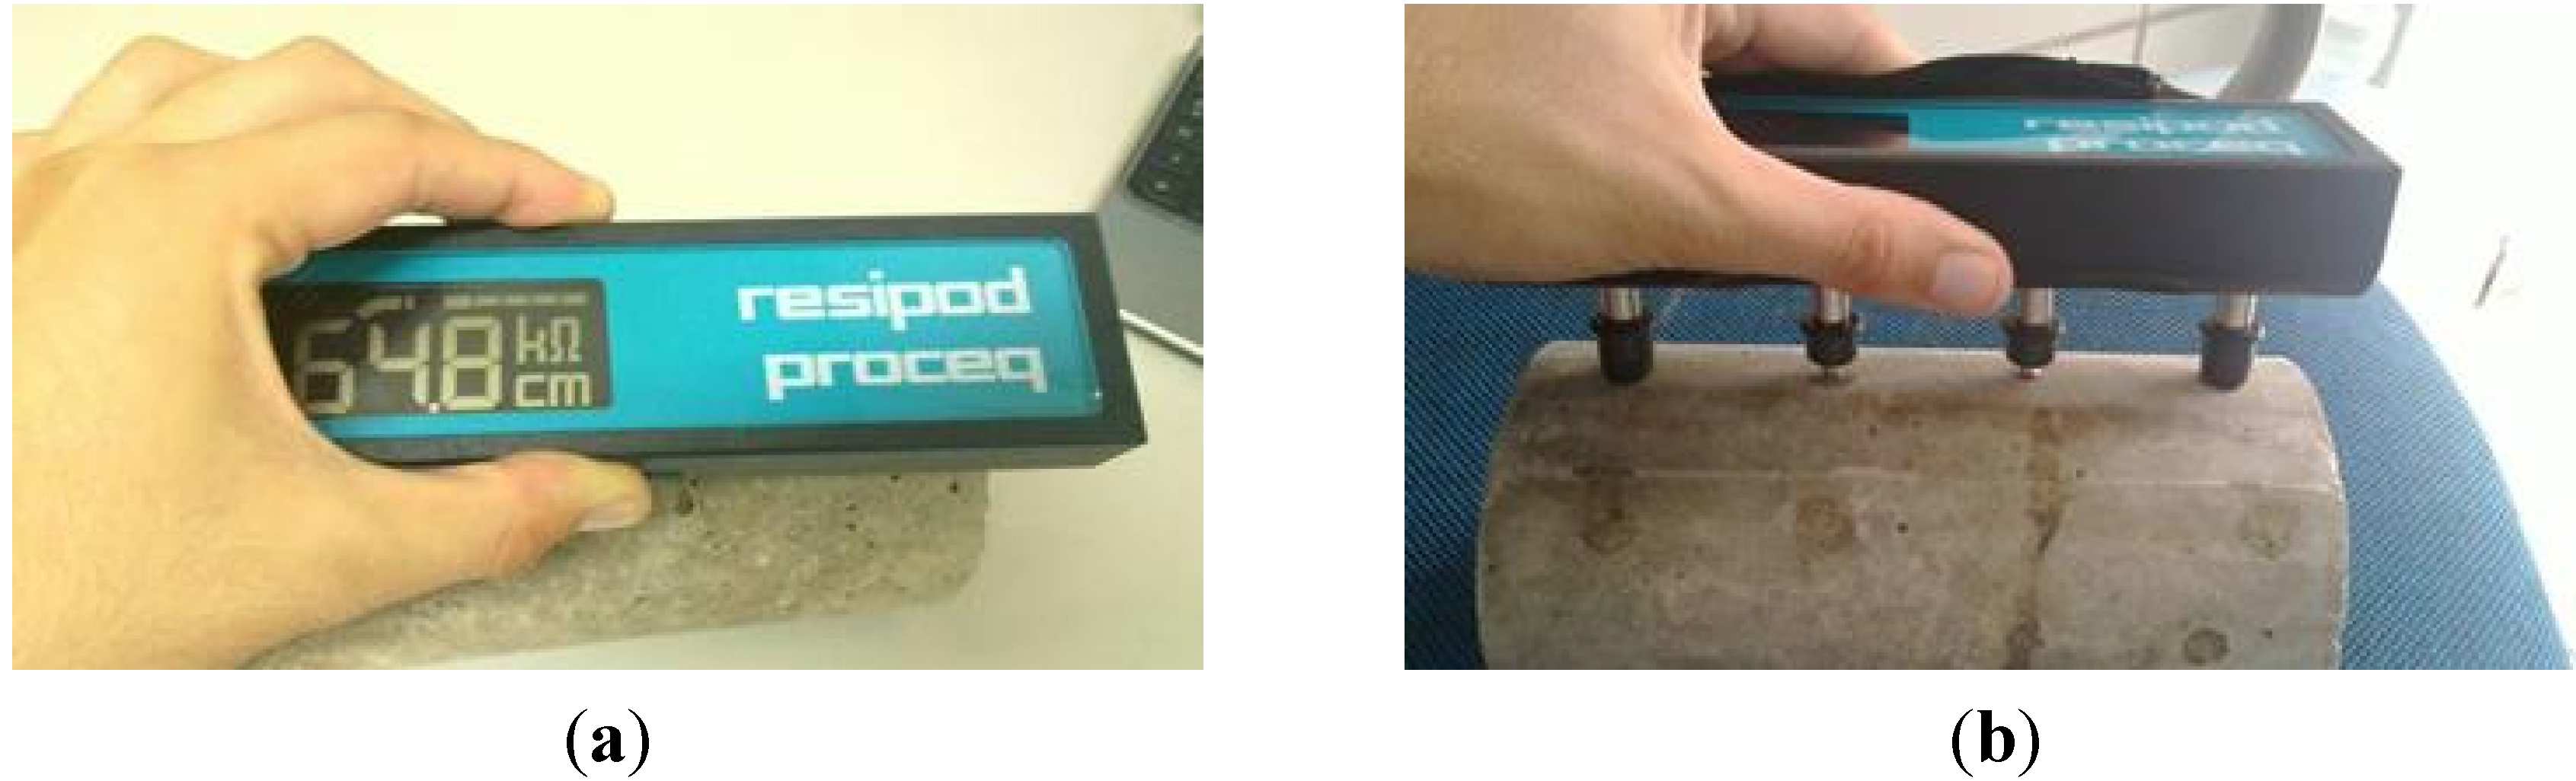
3.2. Electrical Resistivity Experiment in the Research Laboratory
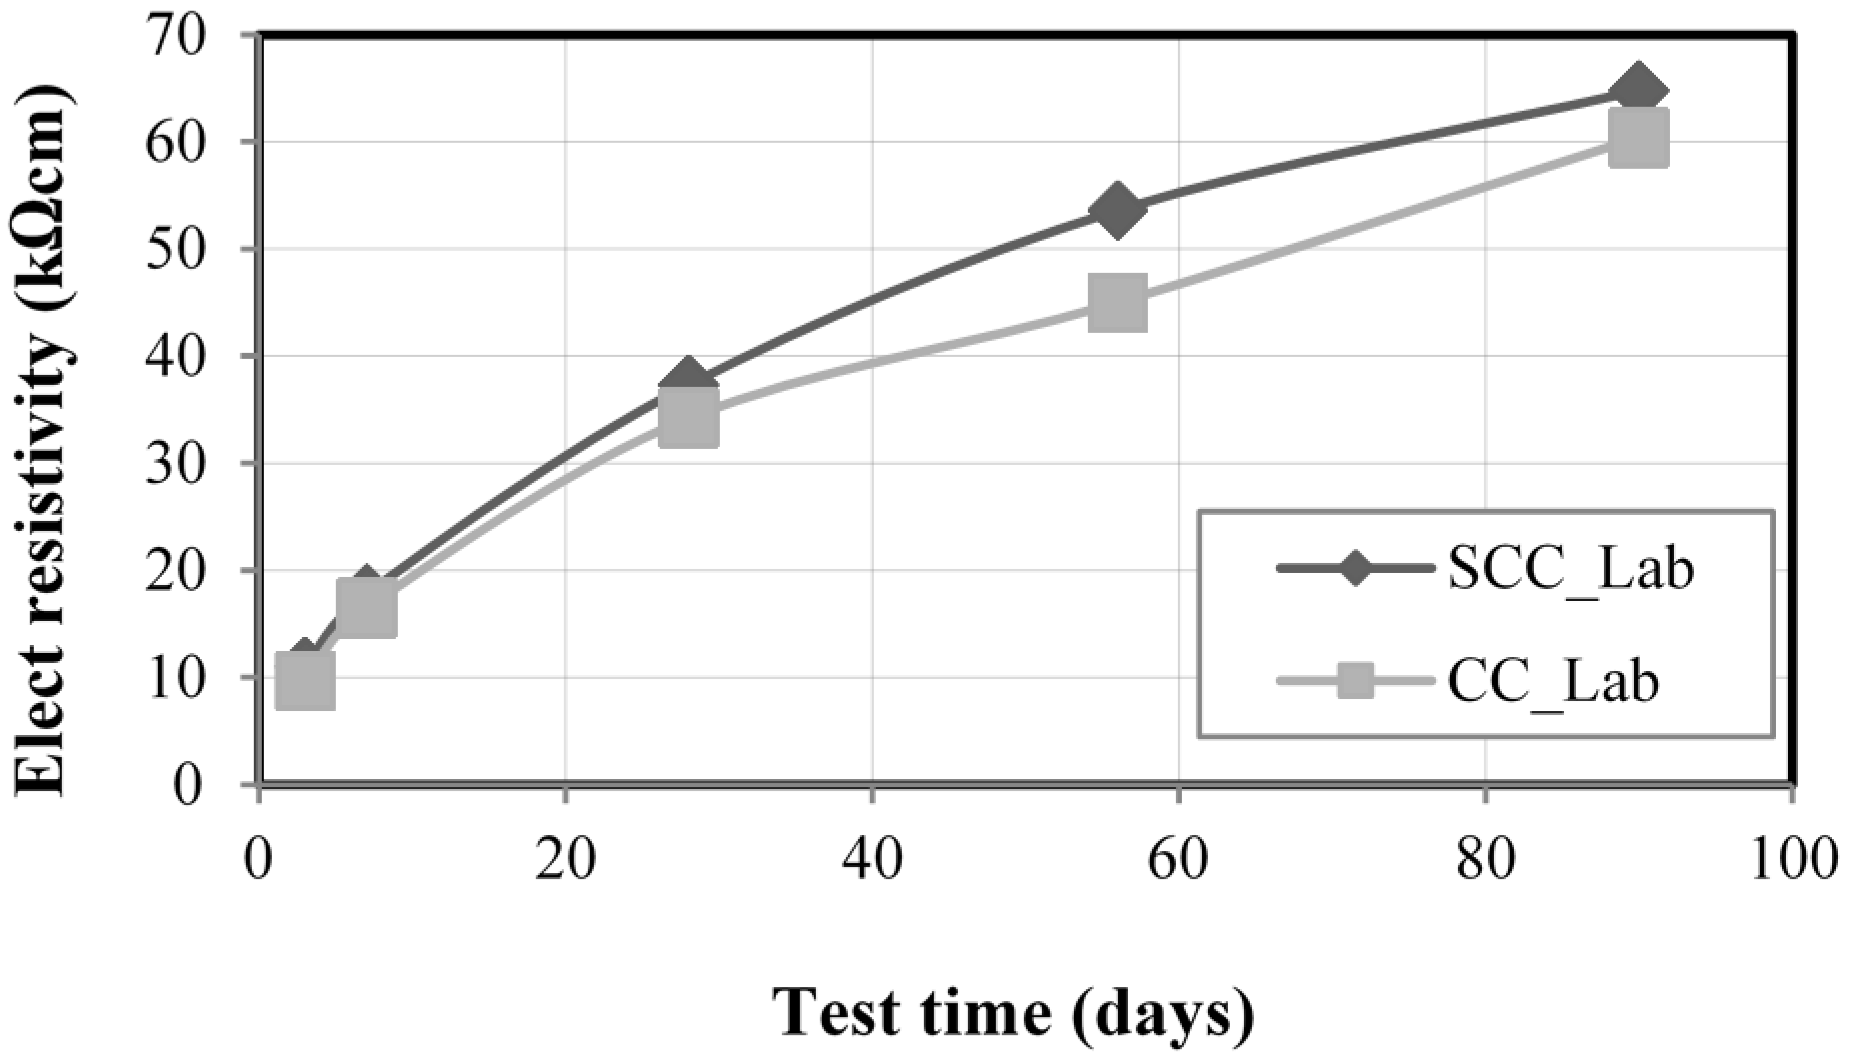
Figure 7 presents the average results of the electrical resistivity (in kΩcm) experiments, considering three measurements for each age and each concrete, for SCC_Lab and CC_Lab samples, at ages of 3, 7, 28, 56 and 90 days. At 28 and 90 days, SCC presented higher resistivity (9.1% and 7.3%, respectively) than CC. A slightly better performance of SCC can be explained by its higher hydration when comparing to CC. However, considering
Table 2 that presents the corrosion probability as a function of the electric resistivity of the concrete based on CEB 192 [
32], it is verified that SCC and CC, at both 28 days and 90 days, presented negligible probability of corrosion, despite a little higher resistivity of SCC in relation to CC. Therefore, it was found that, considering electric resistivity, SCC_Lab samples presented better performance than the CC_Lab ones, as the higher the electric resistivity of the concrete, the smaller the probability of having corrosion in the reinforced concretes. The increase of the electric resistivity as a function of age for both SCC and CC may be explained by a higher humidity inside concrete pores at lower ages.
Figure 7.
Electrical resistivity test results.
Figure 7.
Electrical resistivity test results.
3.3. Accelerated Carbonation Experiments for Research Laboratory
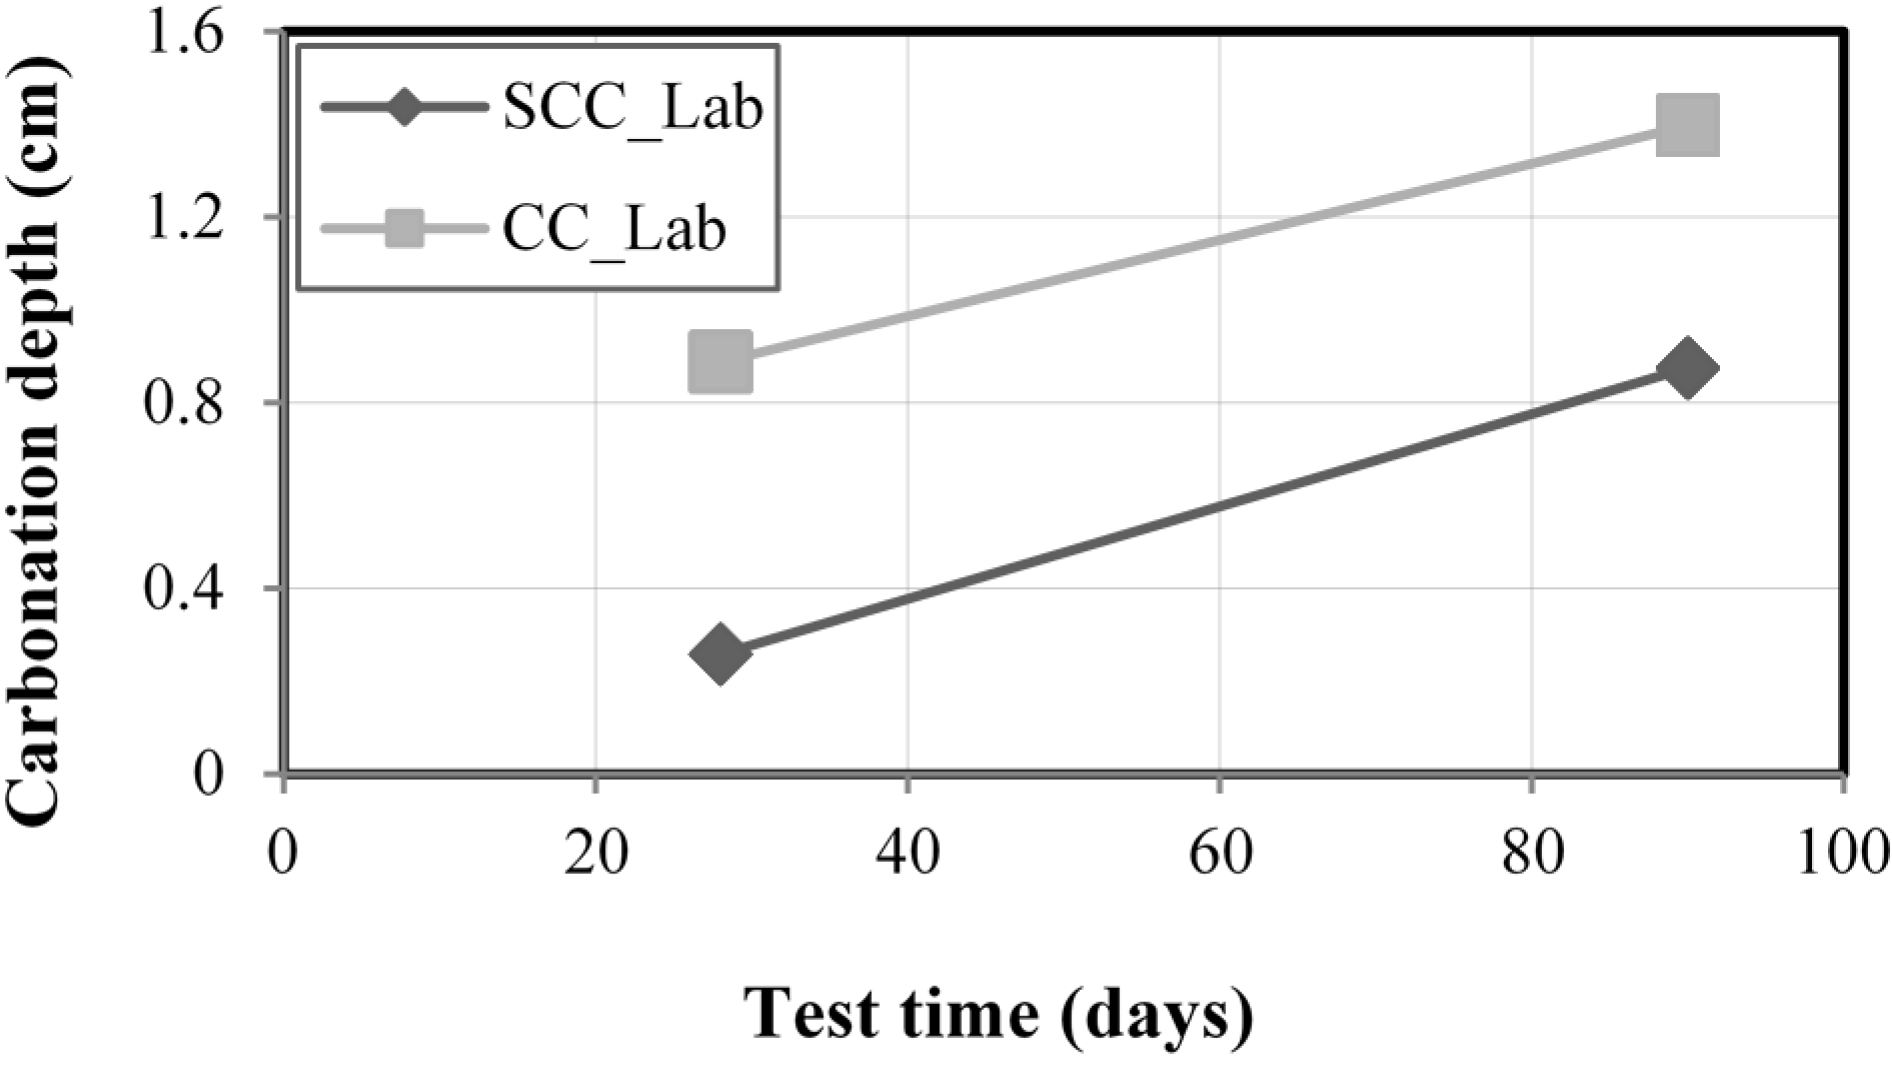
Figure 8 shows the results for the carbonation depth in concrete based on the accelerated carbonating experiments performed in SCC_Lab and CC_Lab samples, at 28 and 90 days. The results are average values for each group of four samples. Coherence in the results obtained was noted. For SCC and CC, the carbonating front was higher in 90 days than in 28 days. As commented previously for the analysis of the electric resistivity, a higher humidity for SCC and CC samples at 28 days was verified. Based on this fact, it is possible to say that the carbonation is less probable in concretes with higher humidity, because the pores are filled with water, hindering the entrance of CO
2. So, the statement that the carbonation front for SCC and CC was superior at 90 days can be explained by the humidity of the concrete. It is known that for humidity around 50% to 75%, there is more penetration of CO
2 according to BRE DIGEST 263 [
45]. On the other hand, the CC carbonation front values obtained were higher, on average, than SCC values, for 28 days (242%) and 90 days (59%). These results are also better than the ones found by Hartmann and Helene [
46] for conventional concrete (33 MPa), whose carbonation depth was 2.8 cm, when subjected to accelerated carbonation process at 25 °C, relative humidity of 65% and CO
2 of 5%. Thus, it was noticed that, regarding accelerated carbonation, SCC_Lab samples presented better performance than CC_Lab samples, as the higher the carbonation front of the concrete, the smaller the durability of concrete.
Figure 8.
Accelerated carbonation test results.
Figure 8.
Accelerated carbonation test results.
3.4. Chloride Ions Diffusion Experiments from the Research Laboratory and from the Construction Site of the Pernambuco Arena
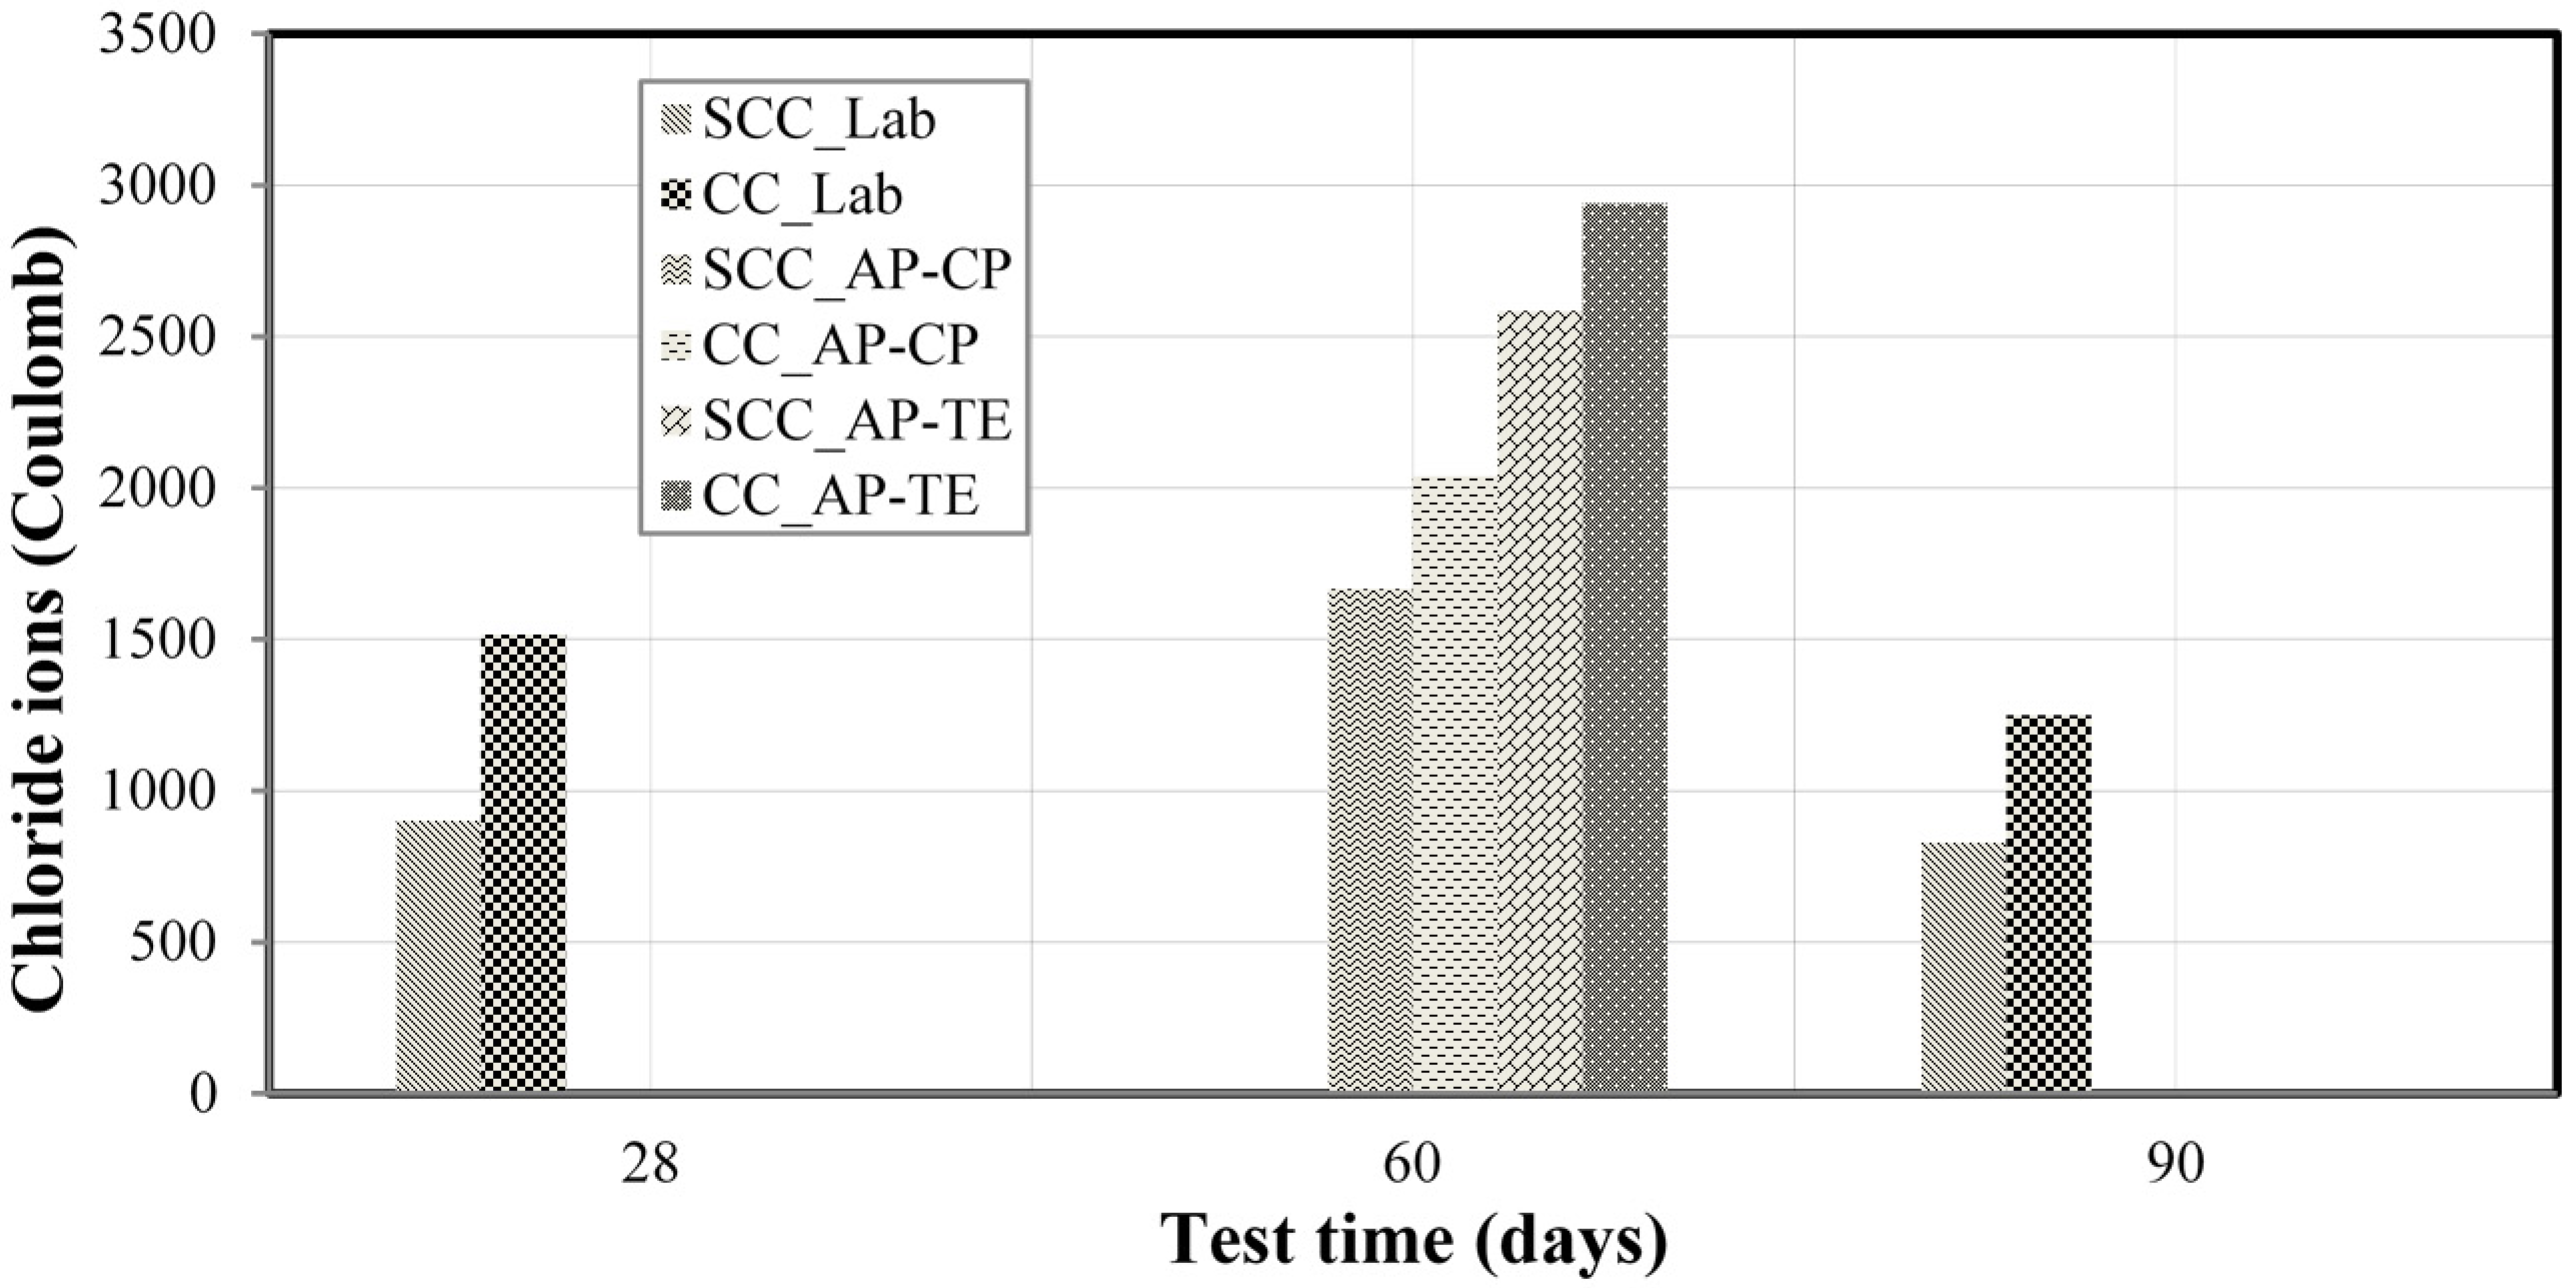
Figure 9 presents the results of the chloride diffusion coefficients obtained from the diffusion experiments in the non-steady state performed in the research laboratory for SCC_Lab and CC_Lab samples at 28 and 90 days. The result of the chloride diffusion coefficients for molded specimens and cores at 60 days for the construction site of the Pernambuco Arena is also presented. All values represent the average between the measurements for each sample studied and the result (C) represents the average charge flow in Coulombs.
With respect to the results of the experiments performed in the research laboratory (LP) shown in
Figure 9, at 28 days, CC presented average charge flow in Coulombs 68.6% higher than SCC, while at 90 days this percentage was 51.0%. The higher the charge flow in Coulombs, the higher the penetration of chloride ions, which causes a decrease in the concrete durability and its reinforcements. The better performance of the SCC_Lab samples with respect to CC_Lab ones, despite the same water/binder ratio (0.45), can be explained because SCC samples are better sealed, internally, than CC ones. Based on ASTM C 1202 [
33], the results showed very low chloride ions diffusion for SCC and low for CC, for both 28 and 90 days. The results for chloride ions penetration by diffusion experiments, obtained by Hartmann and Helene [
46], were 43 C for 125 MPa concrete, and 8000 C for a 33 MPa concrete. Thus, we can affirm that SCC showed excellent performance.
For the experiments performed at the construction site of the Pernambuco Arena, it is verified that molded specimens and cores presented higher chloride ions diffusion for SCC and CC, even at 60 days, compared to the results at 28 days for SCC and CC from the research laboratory experiments (see
Figure 9). The possible differences to be highlighted between the compositions used are: water/binder ratio of 0.45, CEM I 42.5 cement and addition of metakaolin, for the research laboratory experiments; water/cement ratio of 0.40 and CEM II/A-L 32.5 composed cement with limestone filler, for the experiments at the construction site of the Pernambuco Arena. It is observed that, possibly, the addition of metakaolin contributed to the reduction of chloride ions diffusion, which leads to an improvement in its durability.
Figure 9.
Results of chloride ions diffusion.
Figure 9.
Results of chloride ions diffusion.
3.5. Open Porosity for the Research Laboratory and for the Construction Site of the Pernambuco Arena
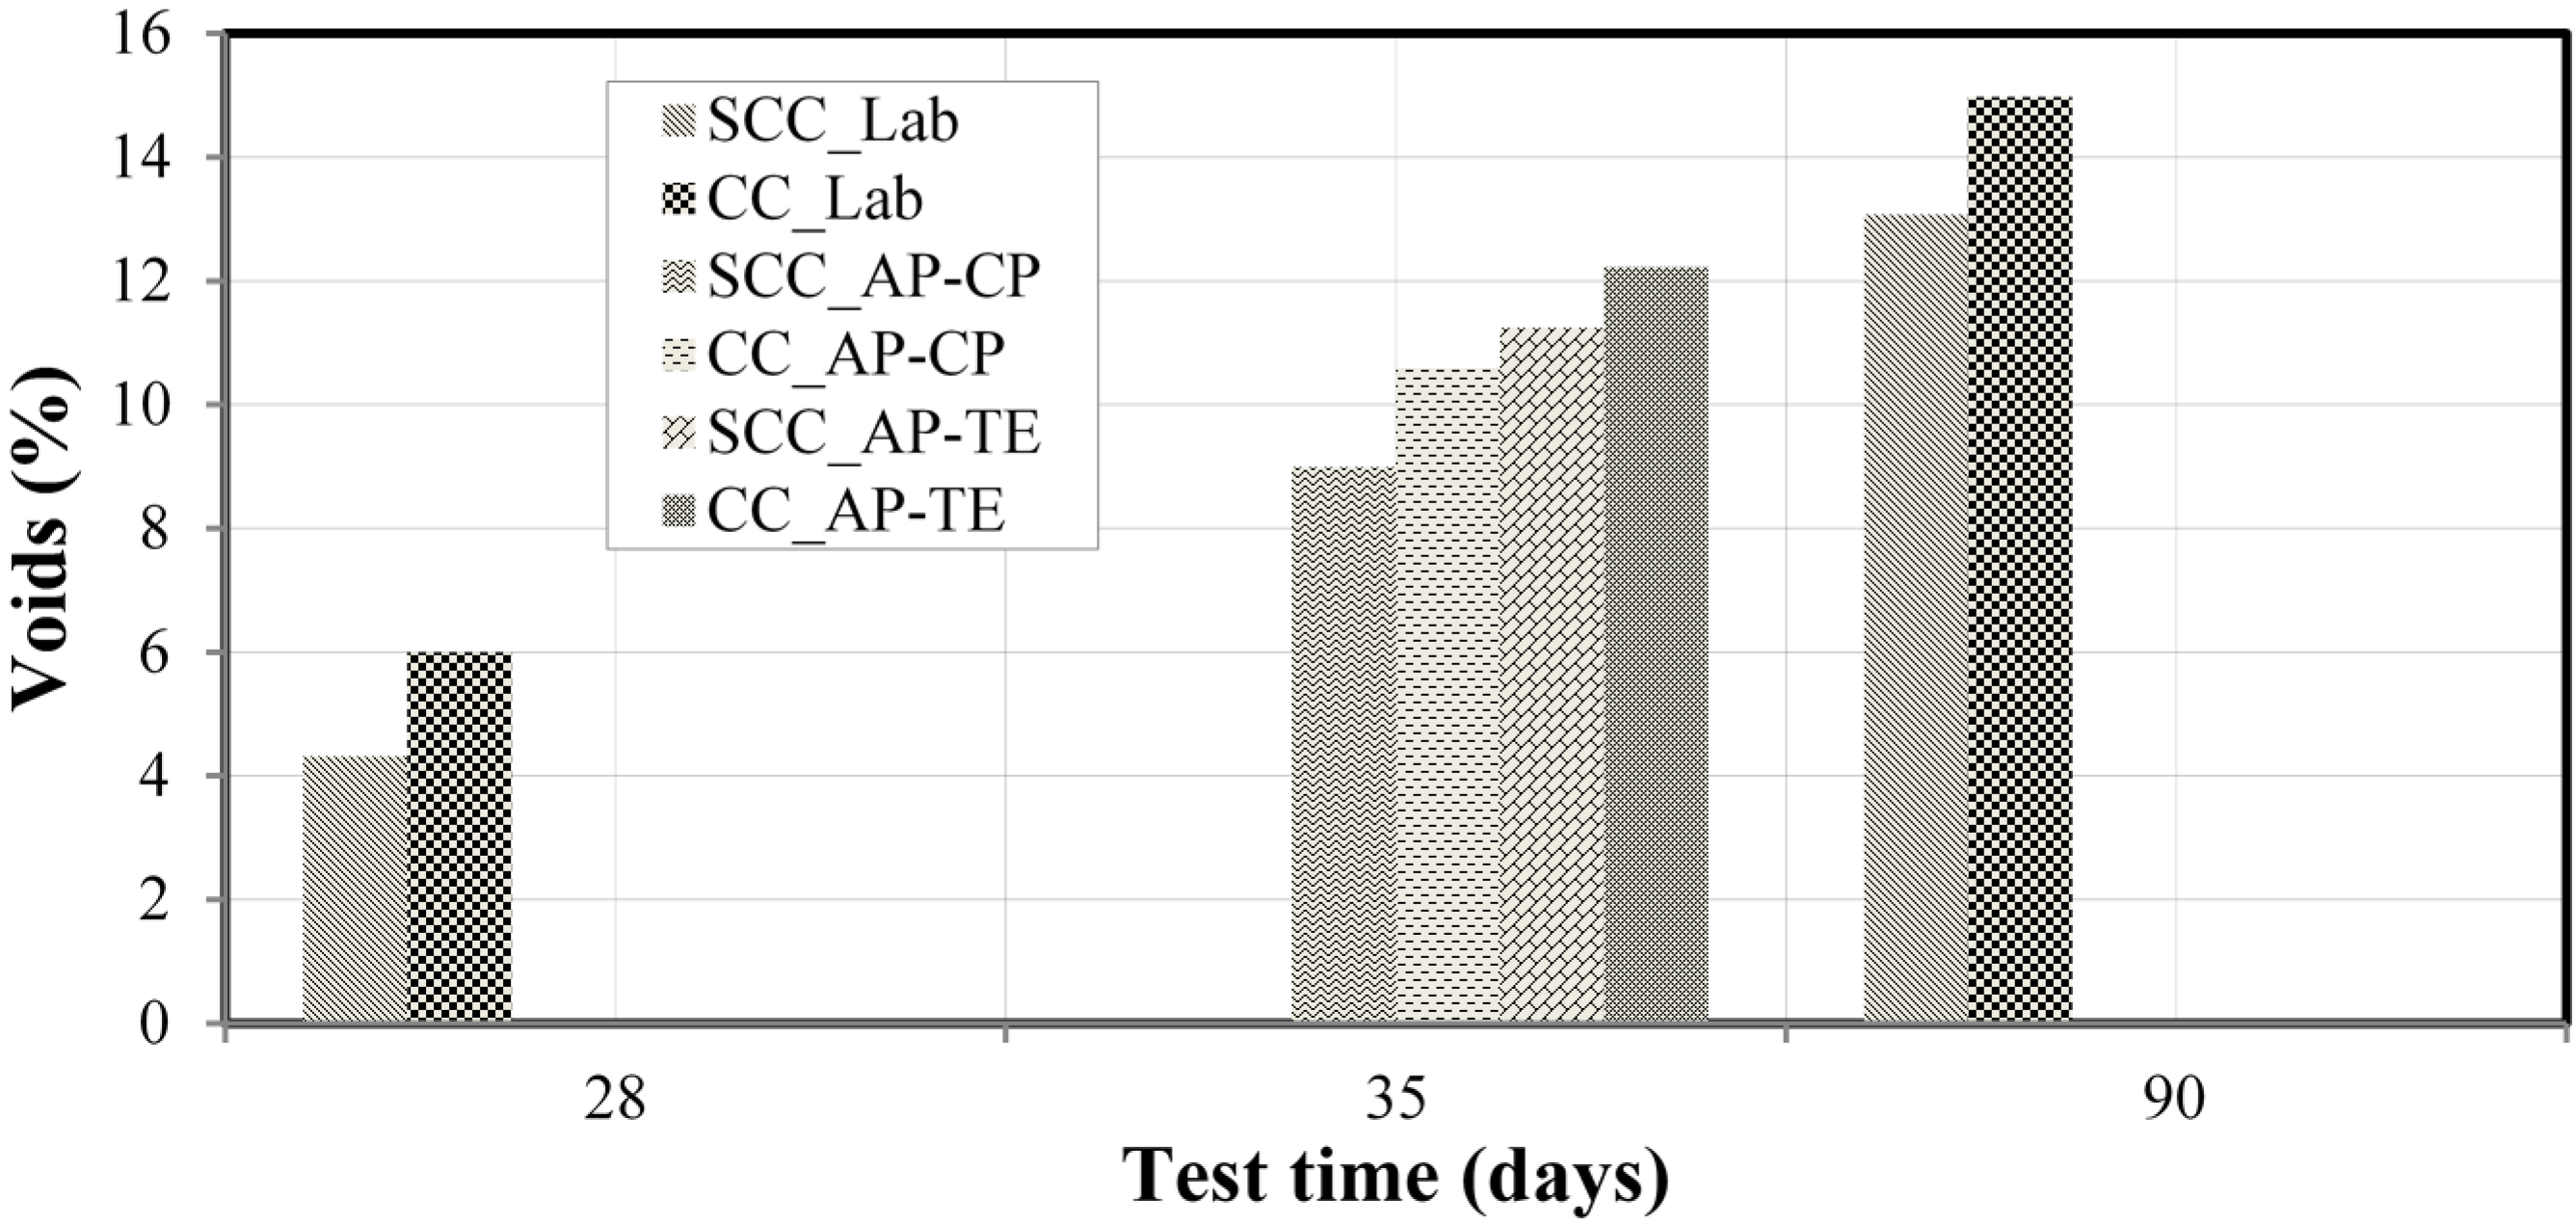
In
Figure 10, one can see the results of the void ratio calculation experiments performed in research laboratory, for SCC and CC samples, at ages of 28 and 90 days, such as in the construction site of the Pernambuco Arena, applied in molded and core specimens, at the age of 35 days. The average measurements of each of the samples experimented were considered, and the results are shown in percentage (%). For the samples aged 28 days and 90 days, the void ratios obtained were higher for the CC in relation to the SCC, to the order of 39% at 28 days and 15% at 90 days. The results found were better than the results obtained by Helene [
46] in the experiments with conventional concrete of 33 MPa compressive strength, where the obtained results of 5.8% of absorption after immersion and boiling and void ratios, after saturation and boiling, of 15.1%.
Figure 10.
Results of void rate.
Figure 10.
Results of void rate.
3.6. Capillarity Water Absorption Experiment in Research Laboratory and at the Construction Site of the Pernambuco Arena
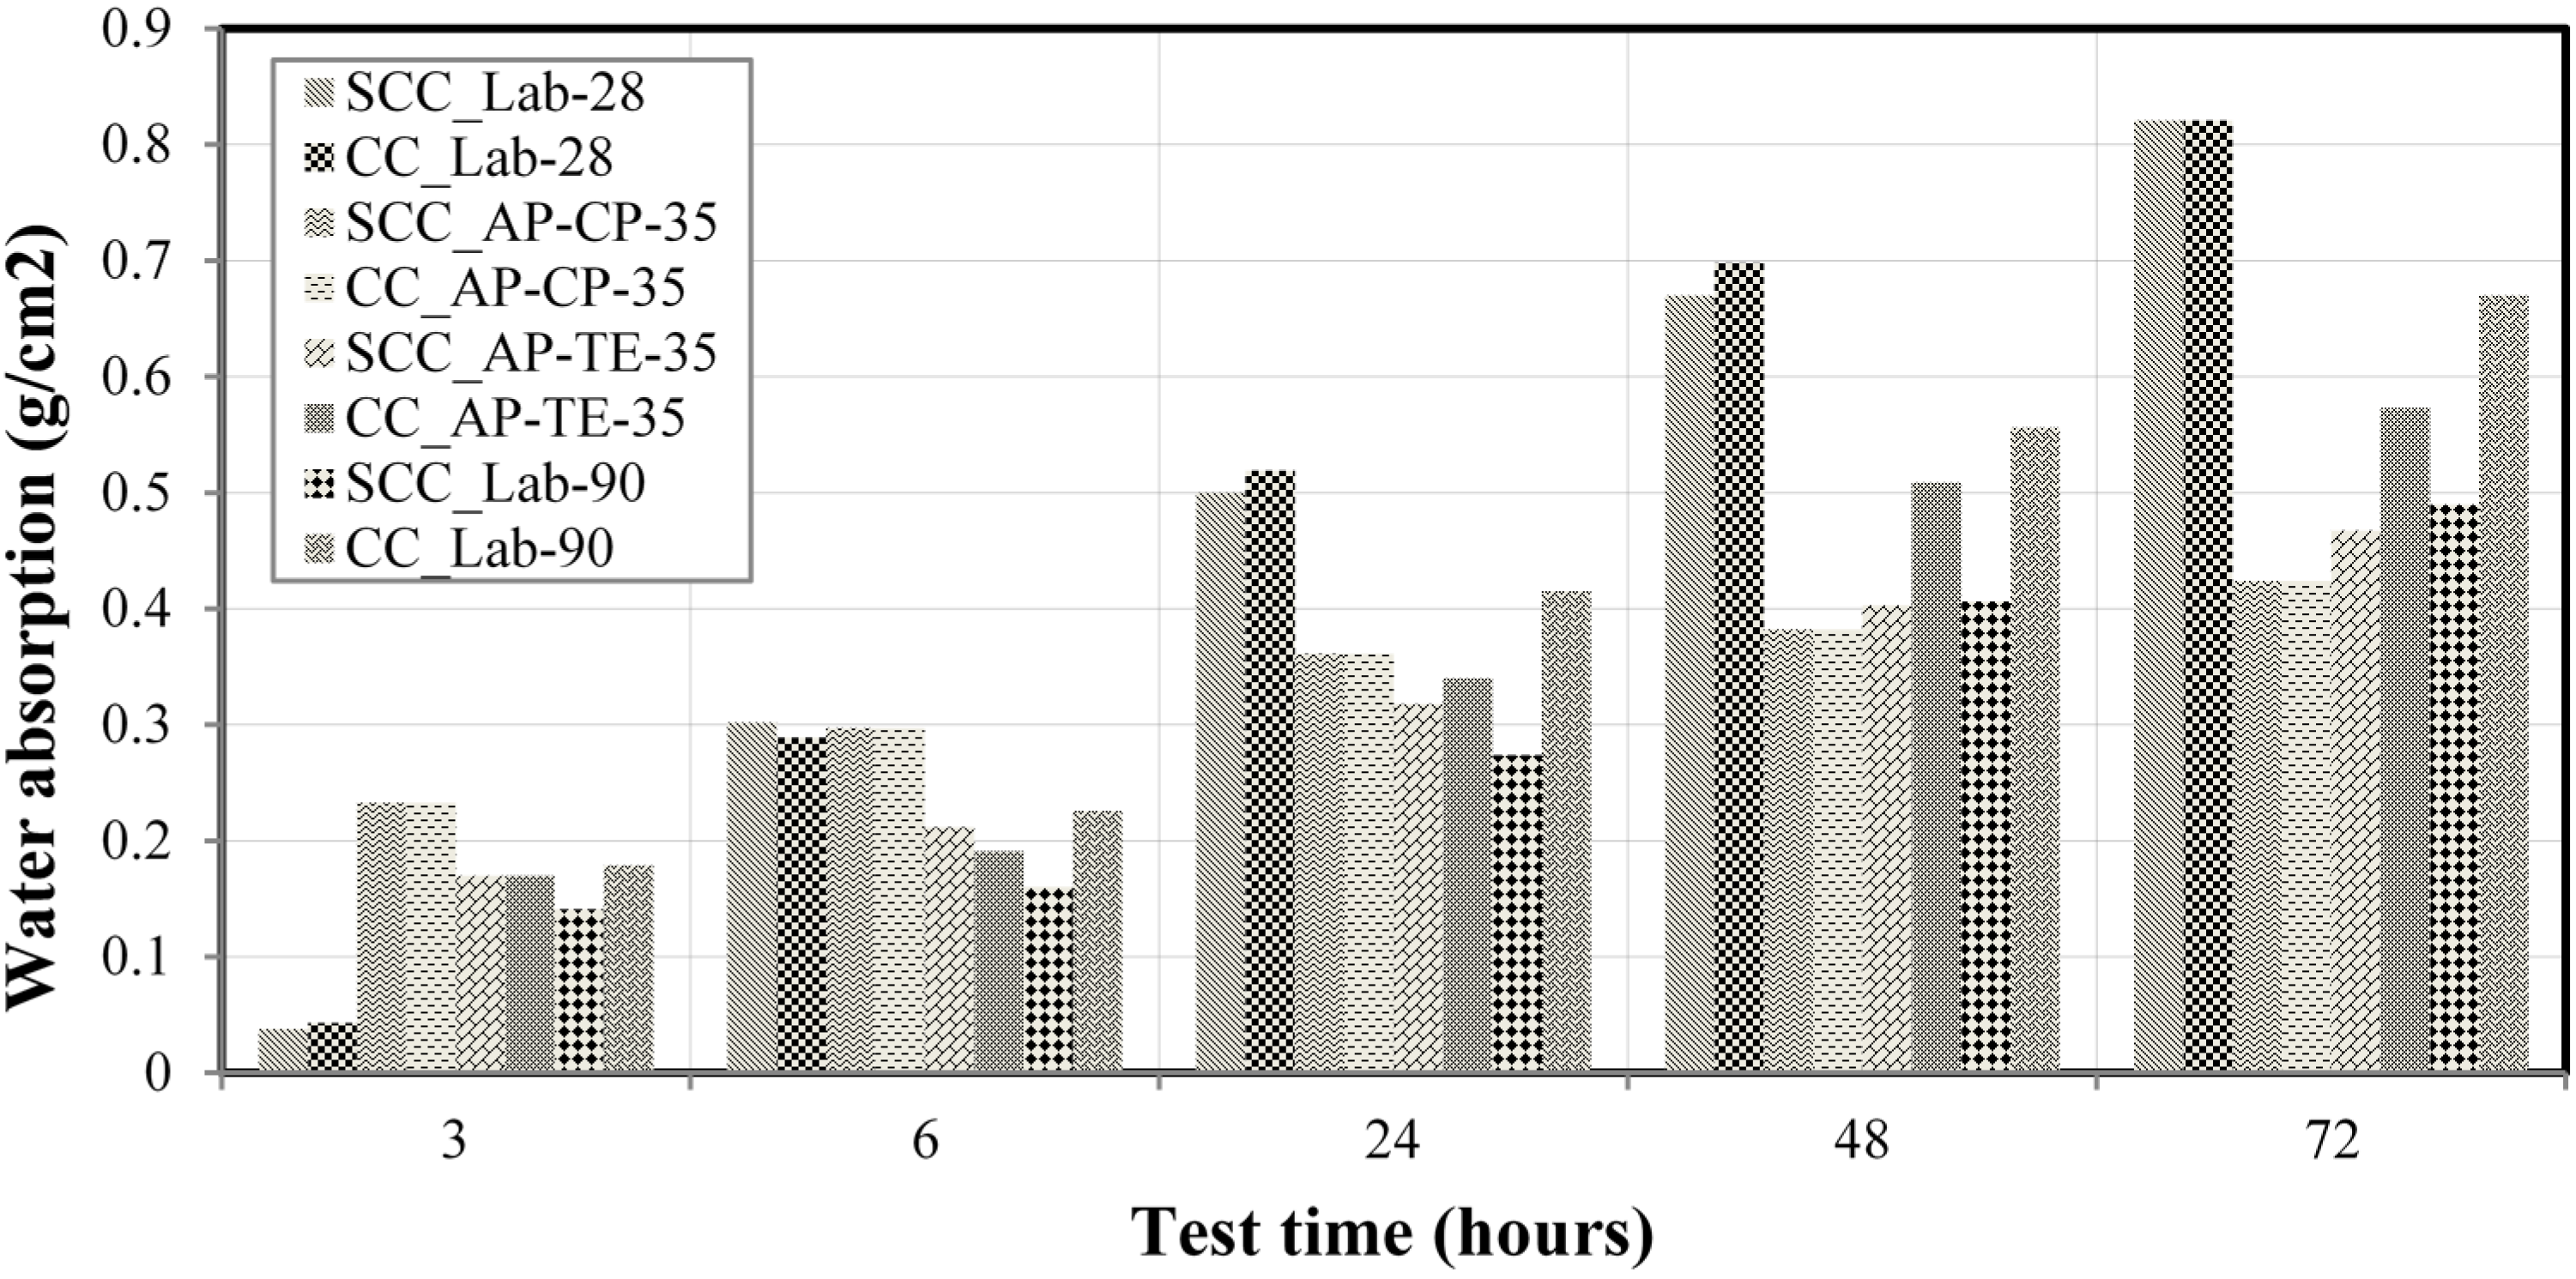
In
Figure 11, the results of the capillarity water absorption experiments performed in research laboratory is presented in samples of SCC and CC at ages of 28 and 90 days and in the construction site of the Pernambuco Arena, applied in molded and cored specimens of 35 days. The average of the measurements in each of the experimented samples was considered, and the results of water absorption are shown in g/cm
2. In this case: LP 28 means experiments performed in the research laboratory with 28 days of age samples, and LP 90 with 90 days; CP 35 means experiments performed in the construction site of the Pernambuco Arena with molded specimens of 35 days; and TE 35 with cored specimens at 35 days of age. In the research laboratory trials, it was verified that the results for 28 days were approximately equal for both SCC and CC, as well as in the results of 90 days, which did not present significant differences between SCC and CC. Monteiro [
47] also observed in his experiments of capillary absorption in three kinds of cement studied no significant difference for the specimens tested at different ages. This is also concluded from analyzing the results presented in the same figure of the experiments performed in the construction site of the Pernambuco Arena with molded and cored specimens, at age of 35 days, using distinct compositions from the ones applied in the research laboratory.
Figure 11.
Results of capillarity water absorption in the performed experiments.
Figure 11.
Results of capillarity water absorption in the performed experiments.
3.7. Scanning Electron Microscopy and Microtomography Experiments at Research Laboratory
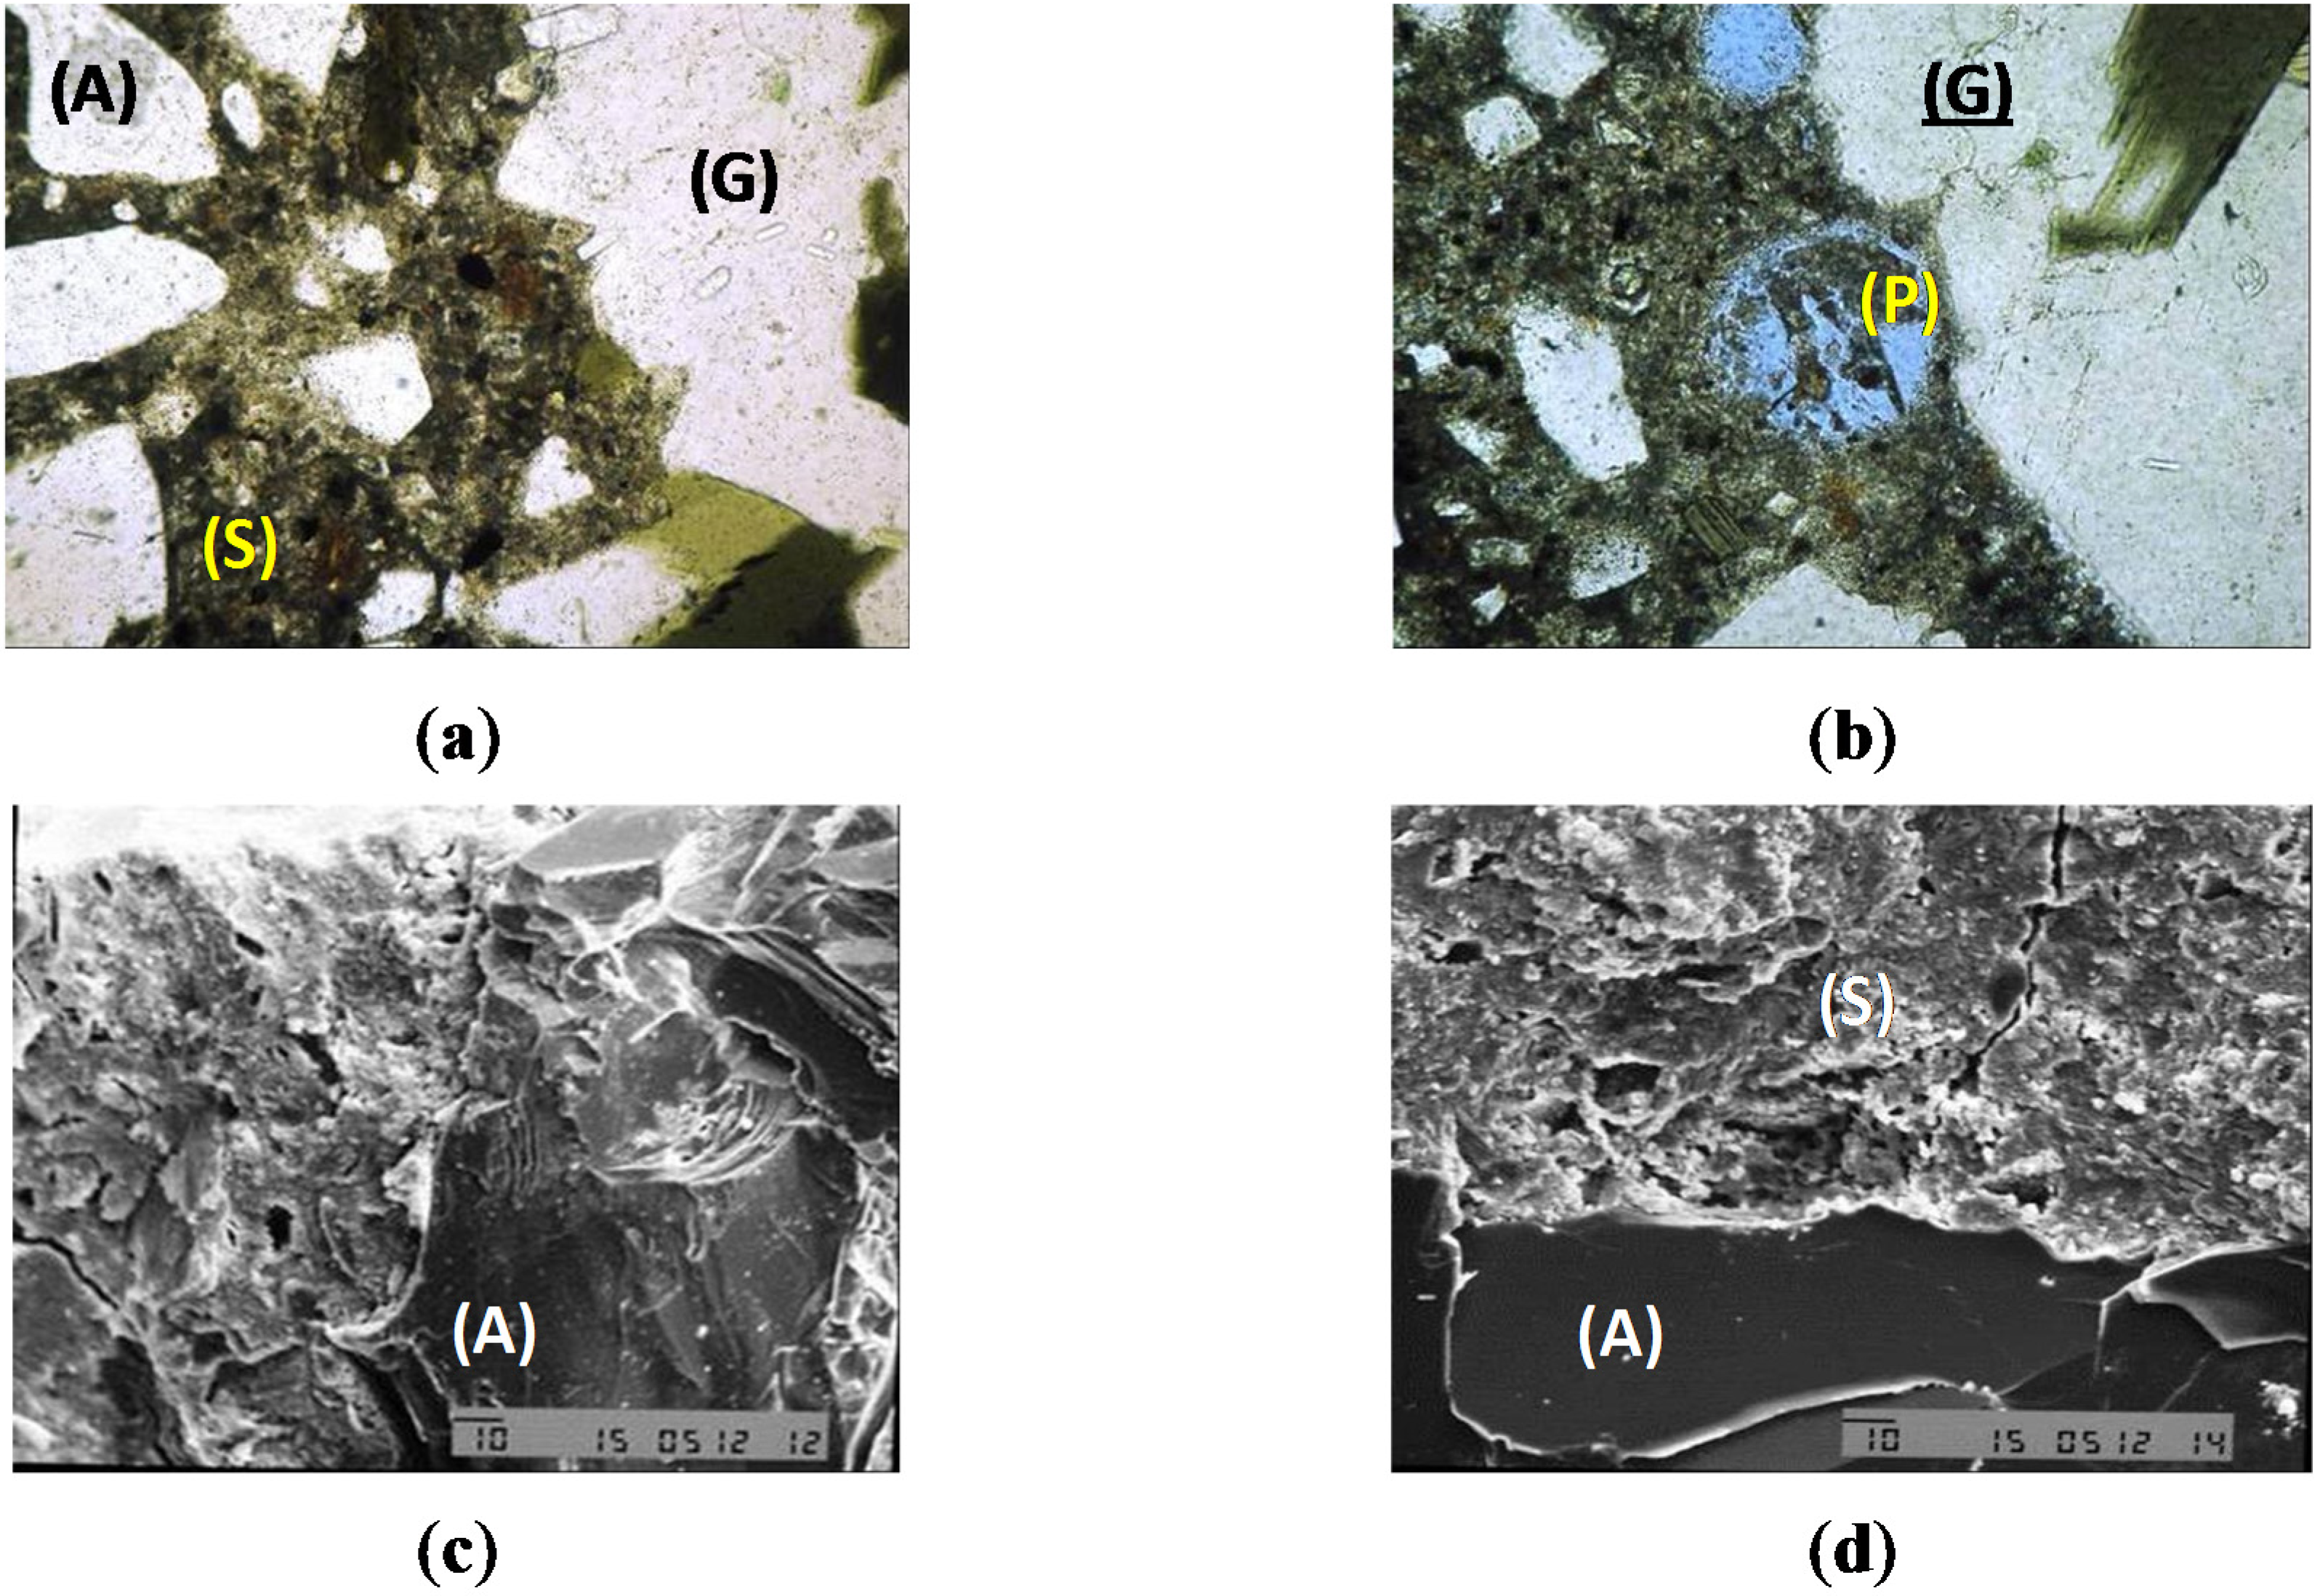
Figure 12a presents the images of the analysis of the SCC_Lab sample though a light microscope, highlighting details of contact of the mortar phase with the great aggregate (G), the paste (S) and sand grains (A).
Figure 12b presents the images of the CC_Lab sample analysis through an optical microscope, highlighting the aspect of a pore in the mortar (P) that develops itself in the edge of the great aggregate (G).
Figure 12c presents the images of the analysis of the CC_Lab through SEM, highlighting the contact of the paste with sand grains (A).
Figure 12d presents the images of the analysis of the CC_Lab sample through SEM, highlighting the contact of the paste with sand grains (A), where the higher porosity of the paste (S) can be observed.
Figure 12.
(a) SCC_Lab optical microscope image; (b) CC_Lab optical microscope image; (c) SCC_Lab SEM image; (d) CC_Lab SEM image.
Figure 12.
(a) SCC_Lab optical microscope image; (b) CC_Lab optical microscope image; (c) SCC_Lab SEM image; (d) CC_Lab SEM image.
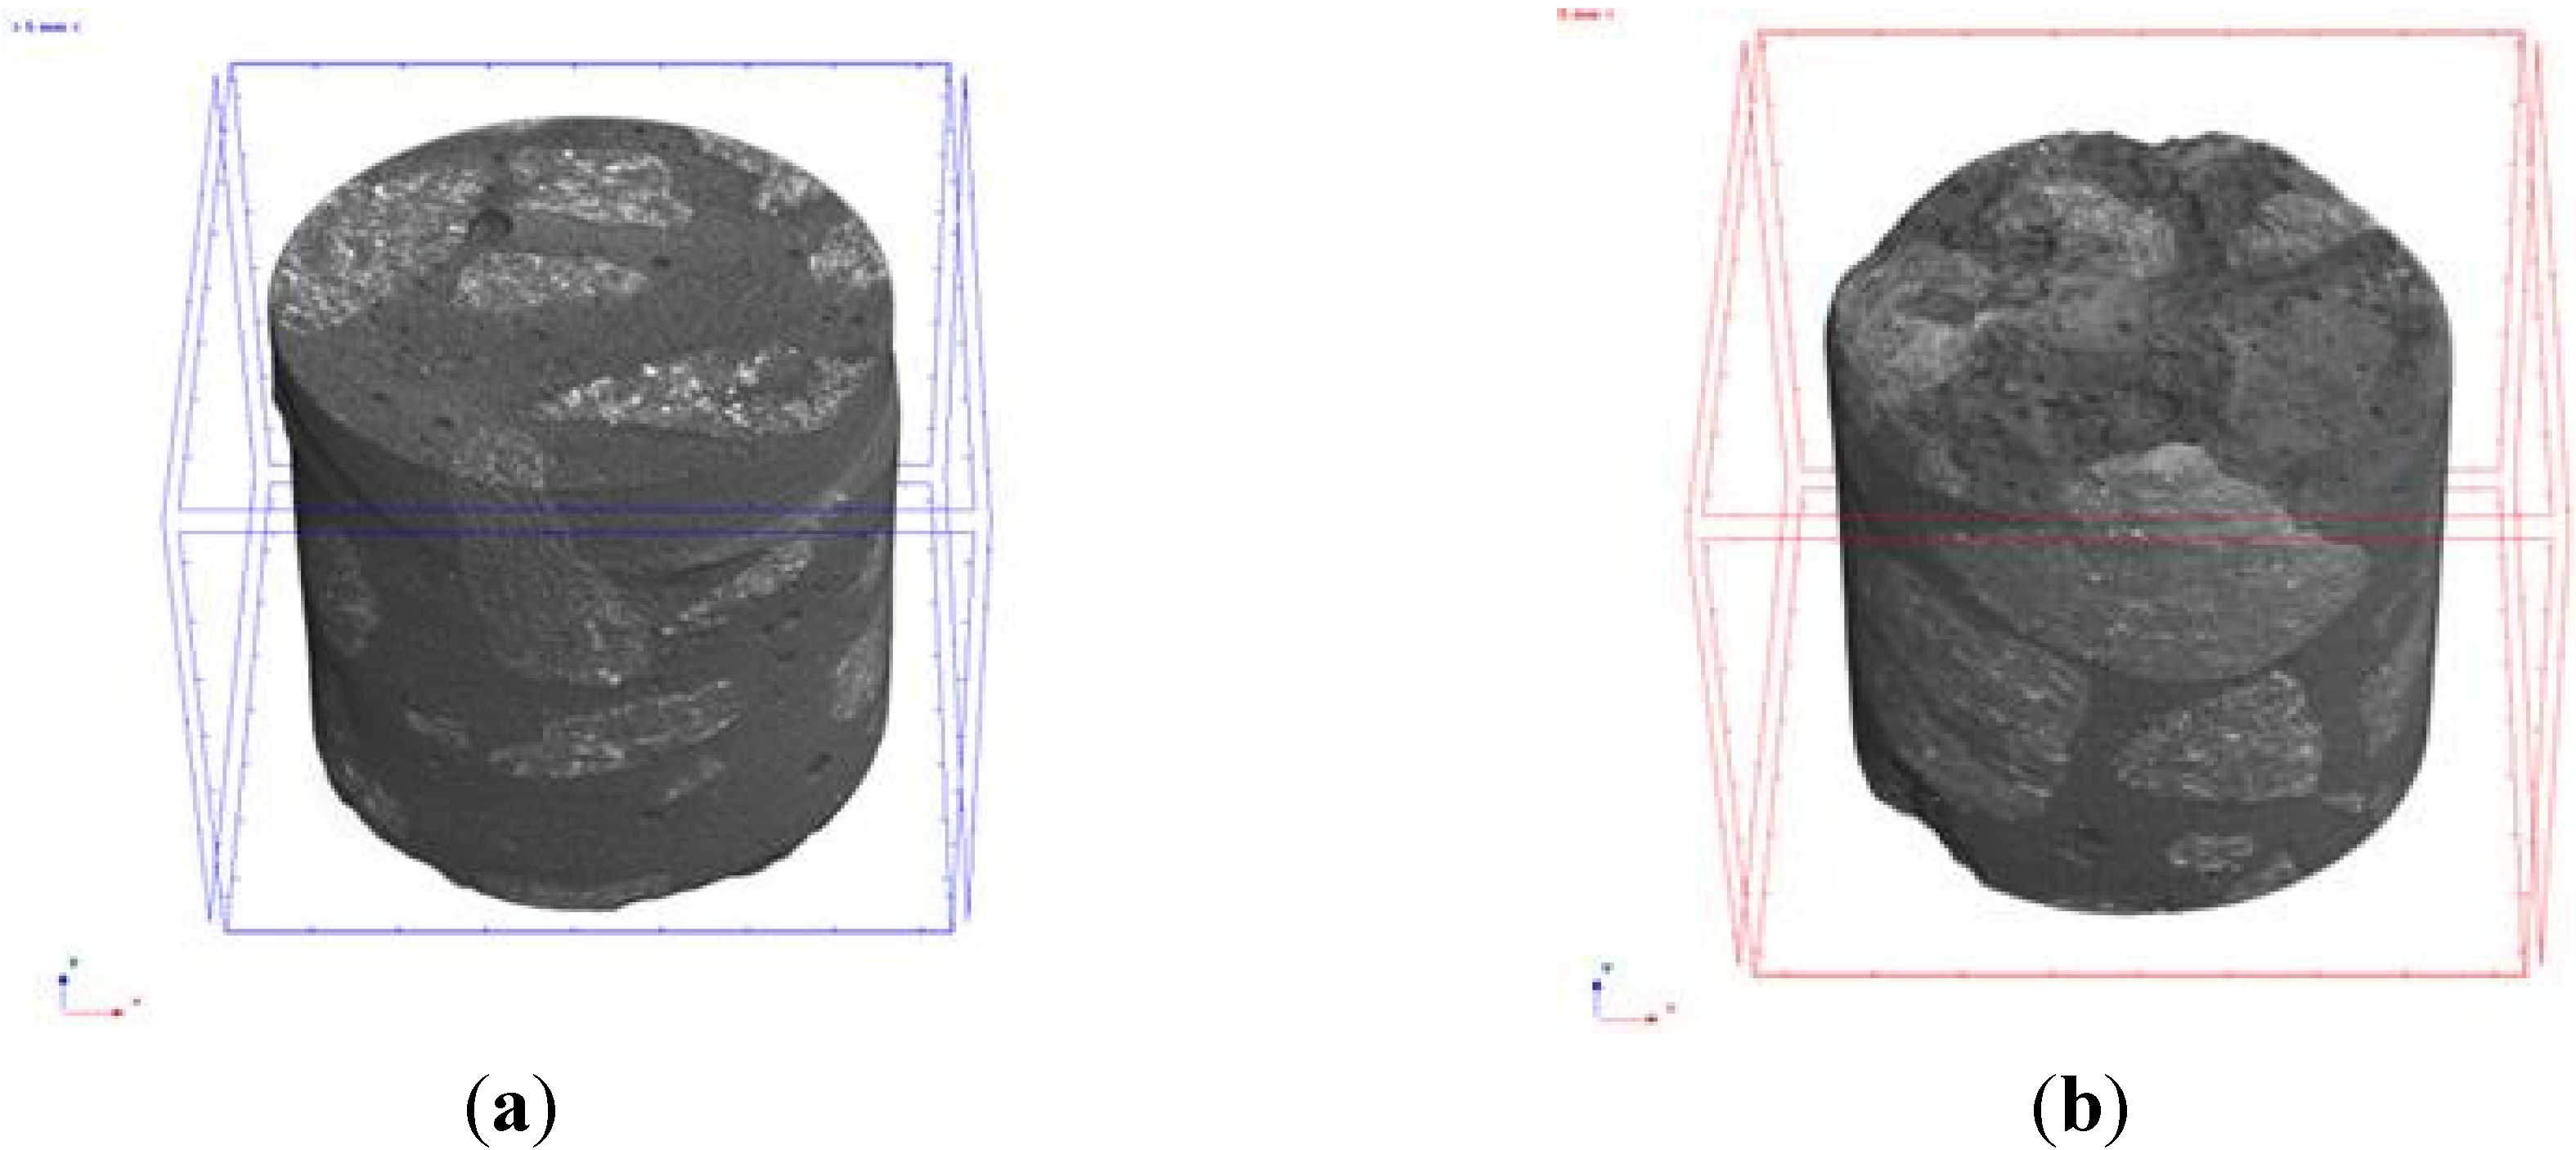
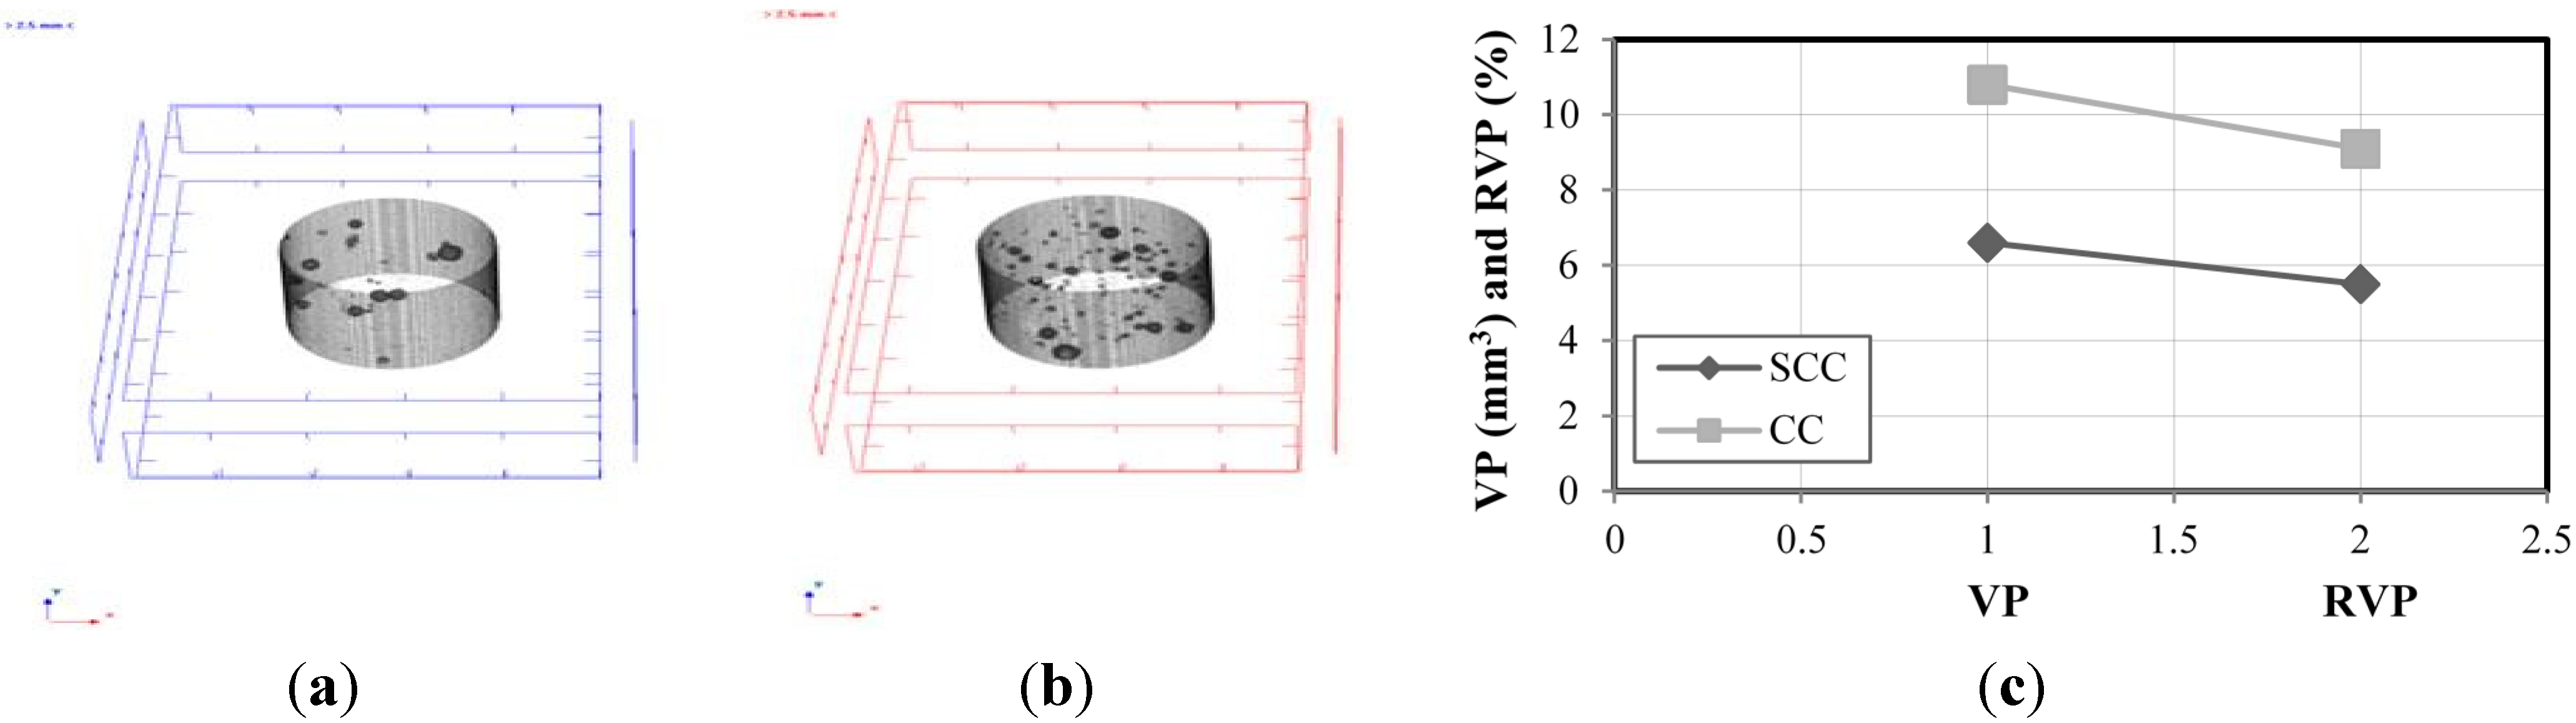
Figure 13a,b presents the relationship between pore volume and volume of the samples of the SCC_Lab and CC_Lab, respectively, obtained through microtomography (MT) images.
Figure 13c presents the results of pore volume (VP) (mm
3) and the relation between pore volume and quantified volume of the samples (RVP) (%) of SCC and CC.
Figure 13.
Results of the microtomography (MT) experiments. (a) SCC_Lab MT image; (b) CC_Lab MT image; (c) pore volume and total volume plot ratio.
Figure 13.
Results of the microtomography (MT) experiments. (a) SCC_Lab MT image; (b) CC_Lab MT image; (c) pore volume and total volume plot ratio.
Based on the results obtained, it is verified that CC_Lab porosity was 65% higher than the SCC_Lab. Professor Geert De Schutter [
26], developed research concerning durability of SCC
vs. CC using micro-tomography (MT) was approached. In his study, the composition of SCC in relation to CC had an addition of limestone filler with an increase of the paste volume and reduction of the granular skeleton volume. The obtained result was that the porosity of CC, using the CC paste, was 74% superior to SCC using the limestone filler paste. Thus, the coherence of both studies seems to be verified.
3.8. Summary of Experimental Results
Table 6 presents a summary of all durability results, making it easier to compare the two types of concrete.
Table 6.
Summary of results of durability experiments.
Table 6.
Summary of results of durability experiments.
| Experiment | Unit | Place of the Studies | Age | SCC | CC |
|---|
| Electrical resistivity | ρ(kΩcm) | RL (1) | 03 days | 11.0 | 9.7 |
| 07 days | 17.8 | 16.5 |
| 28 days | 37.3 | 34.2 |
| 56 days | 53.6 | 45.0 |
| 90 days | 64.8 | 60.4 |
| Diffusion of chloride ions | (C) | RL (1) | 28 days | 900 | 1517 |
| 90 days | 828 | 1250 |
| PA-BP (2) | 60 days | 1665 | 2040 |
| PA-ET (3) | 60 days | 2585 | 2940 |
| Accelerated carbonation | (cm) | RL (1) | 28 days | 0.26 | 0.89 |
| 90 days | 0.88 | 1.40 |
| Water absorption by capillarity | (g/cm2) | RL (1) | 28 days | 3 hours | 0.038 | 0.043 |
| 6 hours | 0.302 | 0.289 |
| 24 hours | 0.500 | 0.519 |
| 48 hours | 0.670 | 0.698 |
| 72 hours | 0.821 | 0.821 |
| 90 days | 3 hours | 0.141 | 0.179 |
| 6 hours | 0.160 | 0.226 |
| 24 hours | 0.274 | 0.415 |
| 48 hours | 0.406 | 0.556 |
| 72 hours | 0.490 | 0.670 |
| PA-BP (2) | 35 days | 3 hours | 0.233 | 0.233 |
| 6 hours | 0.297 | 0.297 |
| 24 hours | 0.361 | 0.382 |
| 48 hours | 0.382 | 0.403 |
| 72 hours | 0.424 | 0.446 |
| Water absorption by capillarity | (g/cm2) | PA-ET (3) | 35 days | 3 hours | 0.170 | 0.170 |
| 6 hours | 0.212 | 0.191 |
| 24 hours | 0.318 | 0.340 |
| 48 hours | 0.403 | 0.509 |
| 72 hours | 0.467 | 0.573 |
| Voids | (%) | RL (1) | 28 days | 4.31 | 6.00 |
| 90 days | 13.07 | 14.97 |
| PA-BP (2) | 35 days | 8.99 | 10.59 |
| PA-ET (3) | 35 days | 11.24 | 12.22 |
| Microtomo graphy | (mm3) | | Pore volume | 6.60 | 10.80 |
| (%) | | Pore Relation/VOI | 5.50 | 9.10 |
It is interesting to observe that self-compacting concrete presented better results in comparison to the conventional vibrated concrete demonstrating that besides the advantage in its application in a fresh state at a construction site due to its self-compacting quality, it presented good results in relation to the selected durability indicators of hardened concrete, demonstrating to be a better option in environments of higher aggressiveness.


