Abstract
The tension-tension fatigue behavior of unidirectional C/SiC ceramic-matrix composite at room temperature and 800 °C under air has been investigated. The fatigue hysteresis modulus and fatigue hysteresis loss energy corresponding to different number of applied cycles have been analyzed. The fatigue hysteresis loops models for different interface slip cases have been derived based on the fatigue damage mechanism of fiber slipping relative to matrix in the interface debonded region upon unloading and subsequent reloading. The fiber/matrix interface shear stress has been estimated for different numbers of applied cycles. By combining the interface shear stress degradation model and fibers strength degradation model with fibers failure model, the tension-tension fatigue life S-N curves of unidirectional C/SiC composite at room temperature and 800 °C under air have been predicted.
1. Introduction
Ceramic materials possess high strength and modulus at elevated temperature. But their use as structural components is severely limited because of their brittleness. The continuous fiber-reinforced ceramic-matrix composites, by incorporating fibers in ceramic matrices, however, not only exploit their attractive high-temperature strength but also reduce the propensity for catastrophic failure. The carbon fiber-reinforced silicon carbide ceramic-matrix composites (C/SiC CMCs) are one of the most promising candidates for many high temperature applications, particularly as aerospace and aircraft thermostructural components [1,2,3].
Compared with ceramic materials and whisker-reinforced CMCs, the fatigue behavior of fiber-reinforced CMCs has many different characteristics, i.e., there exist many matrix microcracks in the fabrication process [4], these microcracks propagated slowly under fatigue loading and matrix failure is not the direct reason for fatigue failure [5]. Ruggles-Wrenn et al. [6] investigated the tension-compression fatigue behavior of a SiC/SiC composite at 1200 °C in air. It was found that the tension-compression cycling is much more damaging than tension-tension fatigue, due to more extensive matrix cracking. Under tensile loading, matrix cracks normal to the loading direction; under compression loading, matrix cracks parallel to the loading direction. When matrix cracking and fiber/matrix interface debonding occur, fiber slipping relative to matrix in the interface debonded region leads to interface wear [7,8], i.e., the interface frictional shear stress and fibers strength decrease with the increase of cycle number [9,10,11,12]. Under fatigue loading, fibers fail due to interface wear [13,14]. When the fibers failure probability approaches critical value, the composite would fatigue fracture [15].
In this paper, the tension-tension fatigue behavior of unidirectional C/SiC composite at room temperature and 800 °C under air has been investigated. The fatigue hysteresis modulus and fatigue hysteresis loss energy have been analyzed for different numbers of applied cycles. The fatigue hysteresis loops models corresponding to different interface slipping cases have been derived based on the fatigue damage mechanism of fiber slipping relative to matrix in the interface debonded region upon unloading/reloading. The fatigue hysteresis loss energy for strain energy lost per volume during corresponding cycle is formulated in terms of interface shear stress. By comparing experimental hysteresis loss energy with theoretical computational values, fiber/matrix interface shear stress under fatigue loading has been estimated. The fiber failure probabilities versus cycle number curves for different peak stresses are obtained considering interface wear. The tension-tension fatigue life S-N curves have been predicted.
2. Material Fabrication and Experimental Procedures
The T-700™ carbon (Toray Institute Inc., Tokyo, Japan) fiber-reinforced silicon carbide matrix composites were provided by Shanghai Institute of Ceramics, People’s Republic of China. The fibers have an average diameter of 7 μm and come on a spool as a tow of 12 K fibers. The unidirectional C/SiC composite was manufactured by hot-pressing method, which offered the ability to fabricate dense composites via a liquid phase sintering method at a low temperature. The volume fraction of fibers was approximately 42%. Low-pressure chemical vapor infiltration was employed to deposit approximately 5–20 layers PyC/SiC with a mean thickness of 0.2 μm in order to enhance the desired non-linear/non-catastrophic tensile behavior. The nano-SiC powder and sintering additives were ball milled for 4 h using SiC balls. After drying, the powders were dispersed in xylene with polycarbonsilane (PCS) to form the slurry. Carbon fiber tows were infiltrated by the slurry and wound to form aligned unidirectional composite sheets. After drying, the sheets were cut to a size of 150 mm × 150 mm and pyrolyzed in argon. Then the sheets were stacked in a graphite die and sintered by hot pressing.
The dog-bone shaped specimens, with dimensions of 120 mm length, 3.2 mm thickness and 4.5 mm width in the gage section, were cut from 150 mm × 150 mm panels by abrasive water jet machining (AWJM) [16,17], in which carborundum abrasive with a size of 150 μm along with a jet pressure of 120 MPa and cutting speed of 100 mm/min. The specimens were further coated with SiC of about 20 μm thick by chemical vapor deposition to prevent oxidation at elevated temperature. These processing steps resulted in a material having bulk density of about 2 g/cm3, and an open porosity below 5%.
The tension-tension fatigue experiments at room temperature and 800 °C under air were conducted on a MTS Model 809 servo hydraulic load-frame (MTS Systems Corp., Minneapolis, MN, USA) equipped with edge-loaded grips. The fatigue experiments were in a sinusoidal waveform and a loading frequency of 10 Hz to investigate the evolution of stress-strain hysteresis loops and hysteresis loss energy [18,19]. The fatigue load ratio was 0.1, and the fatigue limit was defined to be 1,000,000 cycles. Under fatigue loading, the gage-section strains were measured using a clip-on extensometer (Model No. 634.12F‒24 at room temperature and Model No. 632.53F‒11 at 800 °C, MTS systems Corp.; modified for a 25 mm gage-length), as shown in Figure 1. The tensile fatigue tests were conducted in load control in accordance with the procedure in ASTM standard C 1360 at room and elevated temperatures. The displacement, strain and load were recorded for each cycle. The fatigue hysteresis modulus E is calculated by Equation (1).
where σmax and σmin denote the fatigue peak and valley stresses, respectively; and εmax and εmin denote the fatigue peak and valley strains, respectively.
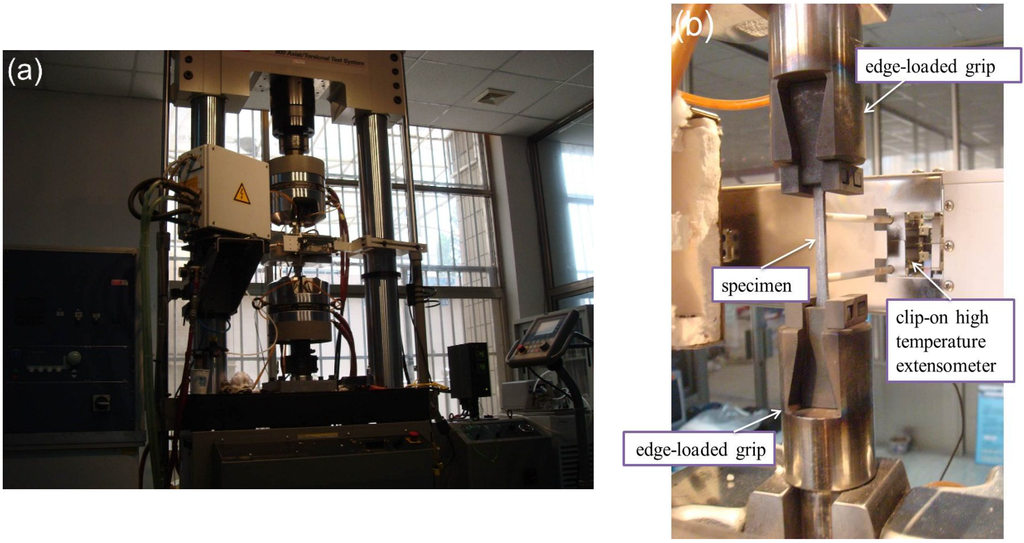
Figure 1.
Photograph of fatigue experimental device of unidirectional C/SiC composite (a) the MTS Model 809 servohydraulic load-frame; and (b) the edge-loaded grips, specimen and clip-on extensometer.
Figure 1.
Photograph of fatigue experimental device of unidirectional C/SiC composite (a) the MTS Model 809 servohydraulic load-frame; and (b) the edge-loaded grips, specimen and clip-on extensometer.

The direct observations of matrix multicracking at room temperature were made using HiROX optical microscope. The matrix crack densities were determined by counting the number of cracks in a length of about 15 mm. After specimens fatigue failure, the fracture surfaces were observed under optical microscope.
3. Experimental Results
3.1. Room Temperature
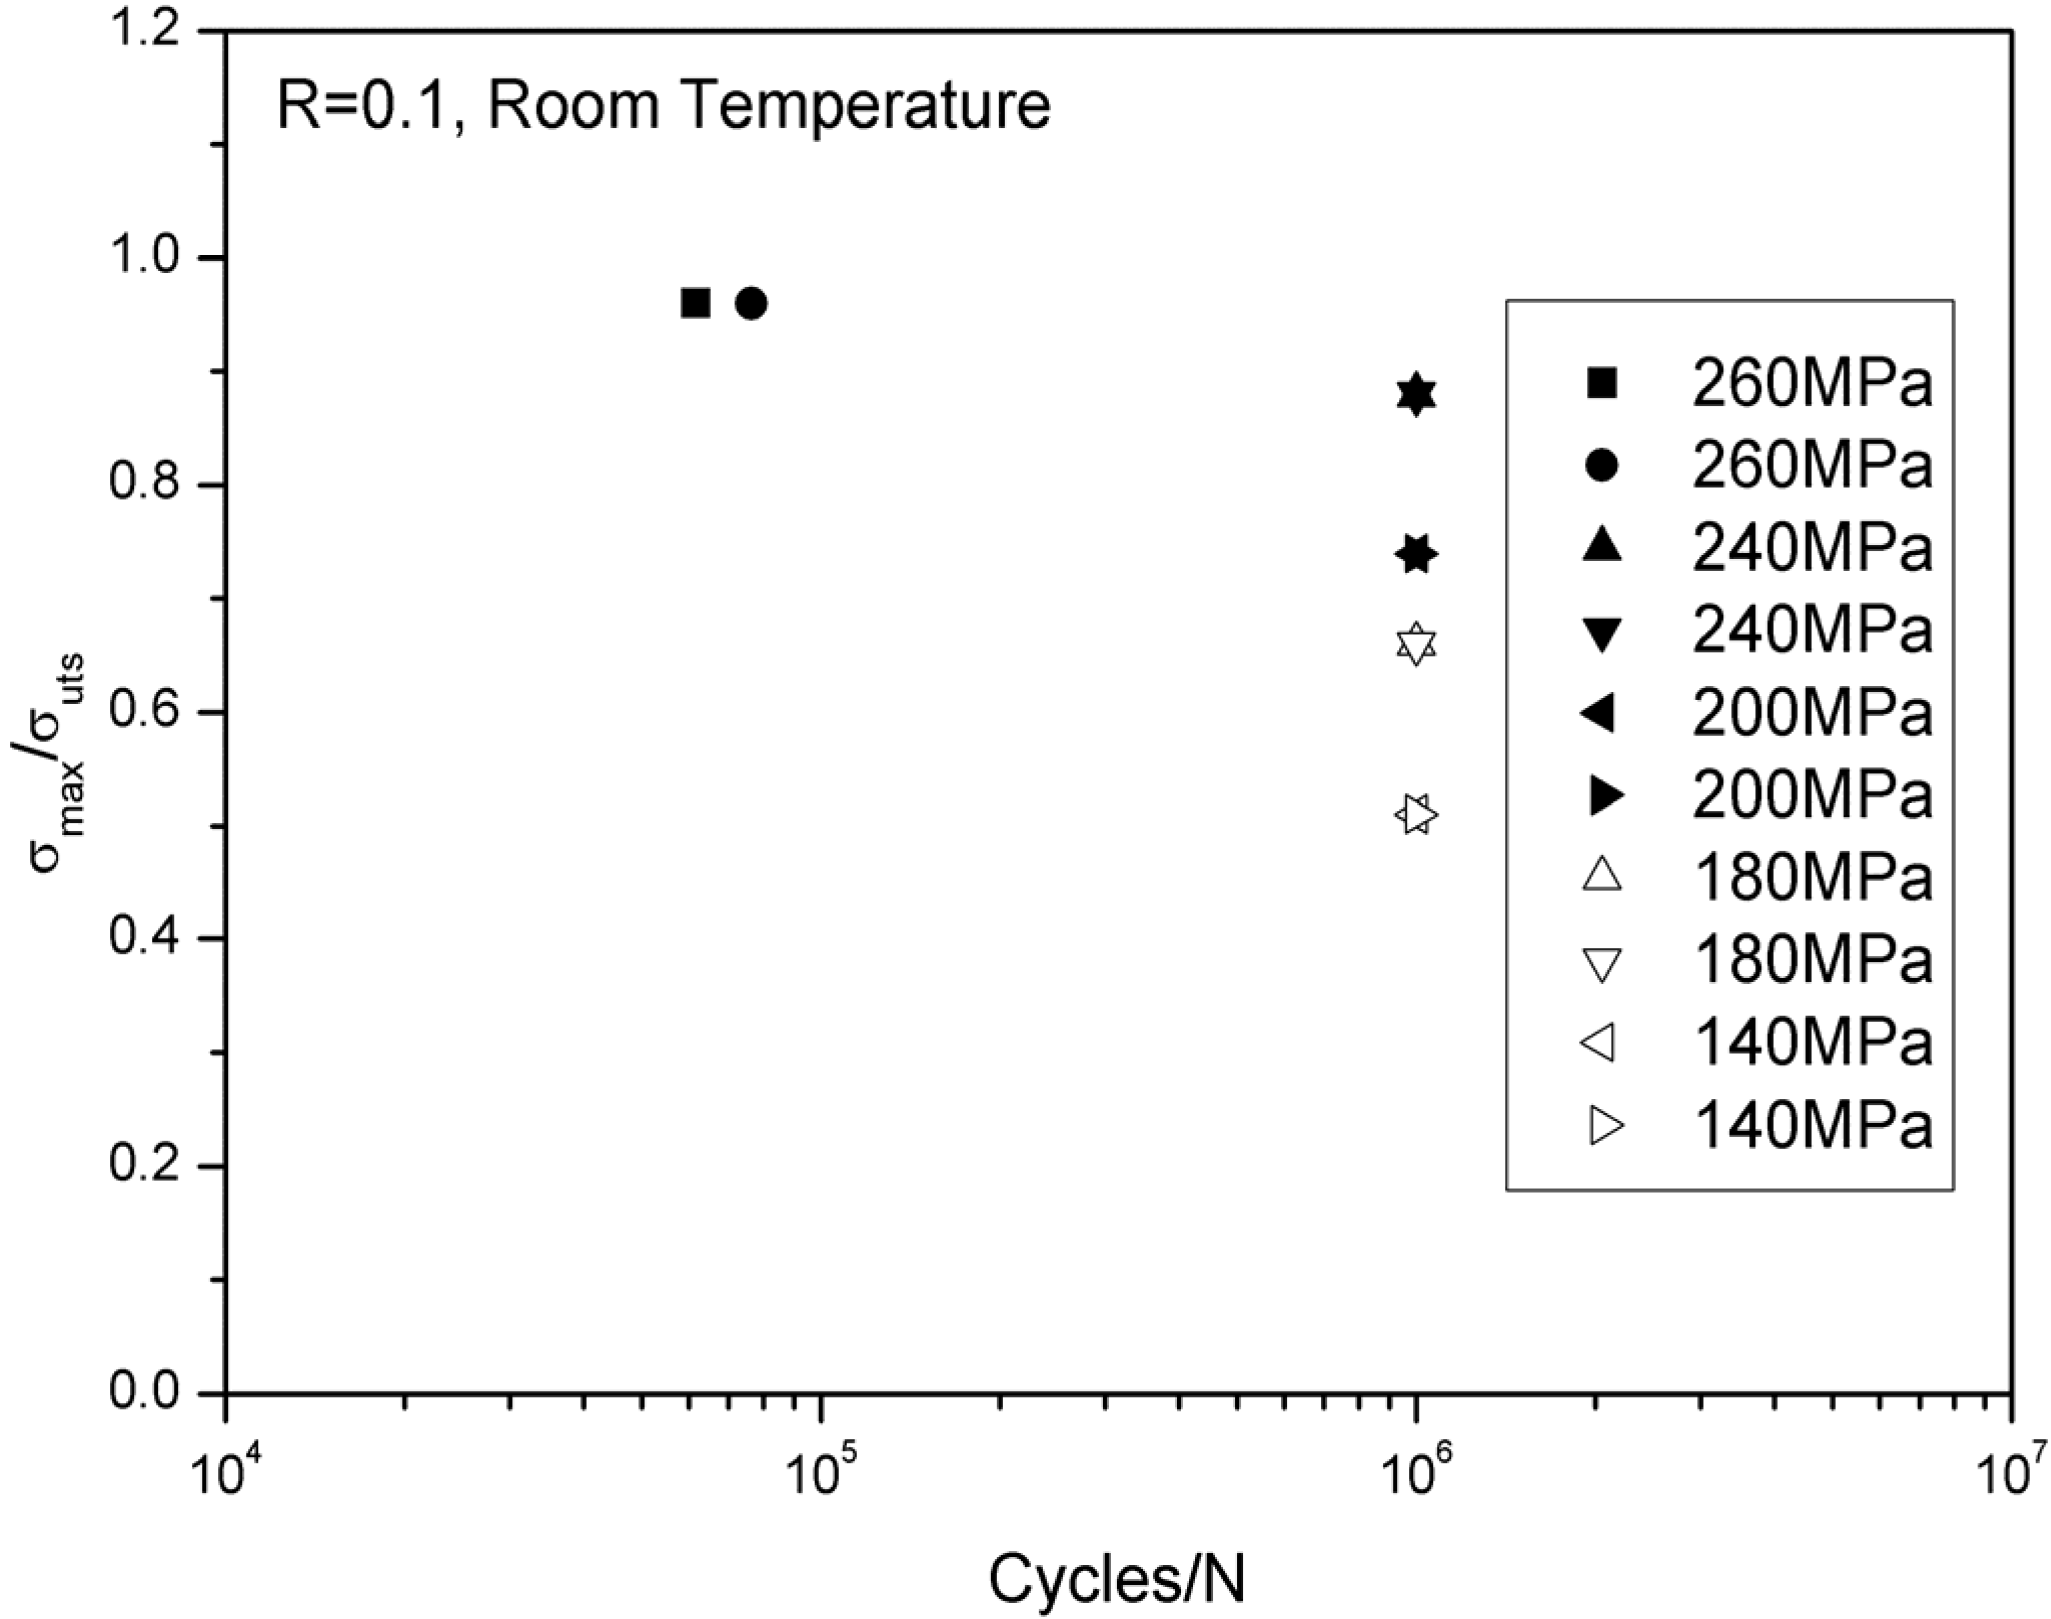
The monotonic tensile strength is approximately 270 ± 5 MPa at room temperature. The cyclic tensile stress–strain curves are shown in Figure 2. The specimen was loading/unloading/reloading at the peak stresses of 20, 40, 60, 80, 100, 120, 140, 160, 180, 200, 220, 240 and 260 MPa, and failed at the applied stress of 265 MPa, with the failure strain of 0.27%. The tension-tension fatigue peak stresses at room temperature were 260 MPa (96% tensile strength), 240 MPa (88% tensile strength), 200 MPa (74% tensile strength), 180 MPa (66% tensile strength) and 140 MPa (51% tensile strength), respectively. The fatigue life S-N curve at room temperature is illustrated in Figure 3.

Figure 2.
The loading/unloading tensile stress-strain curves of unidirectional C/SiC composite at room temperature.
Figure 2.
The loading/unloading tensile stress-strain curves of unidirectional C/SiC composite at room temperature.
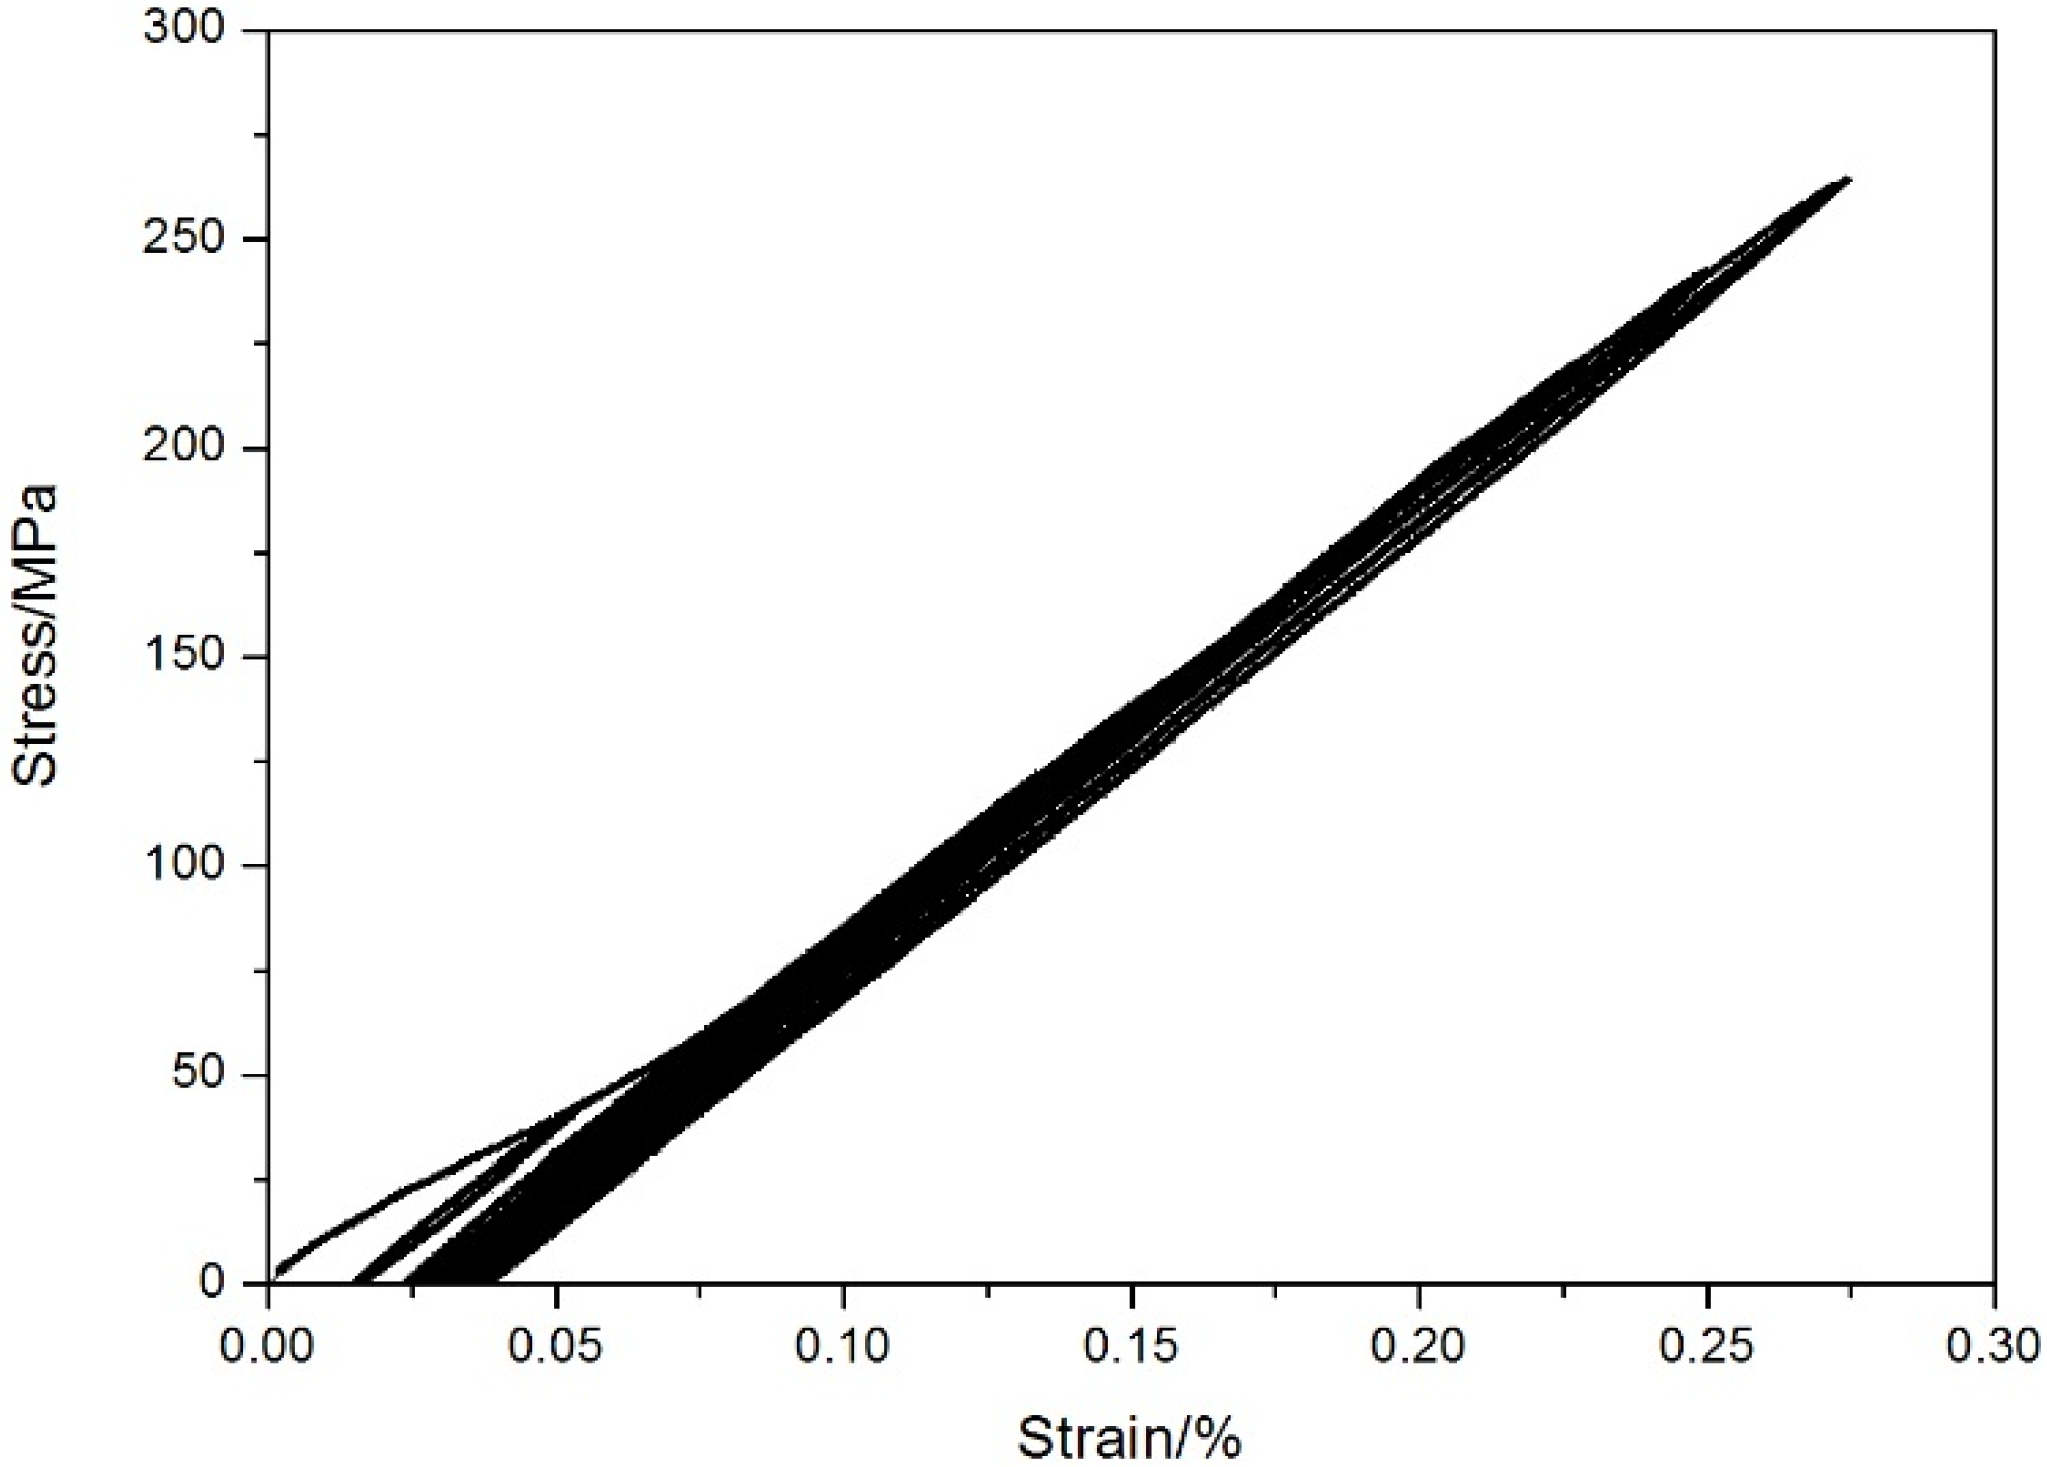

Figure 3.
The fatigue life S-N curve of unidirectional C/SiC composite at room temperature.
Figure 3.
The fatigue life S-N curve of unidirectional C/SiC composite at room temperature.
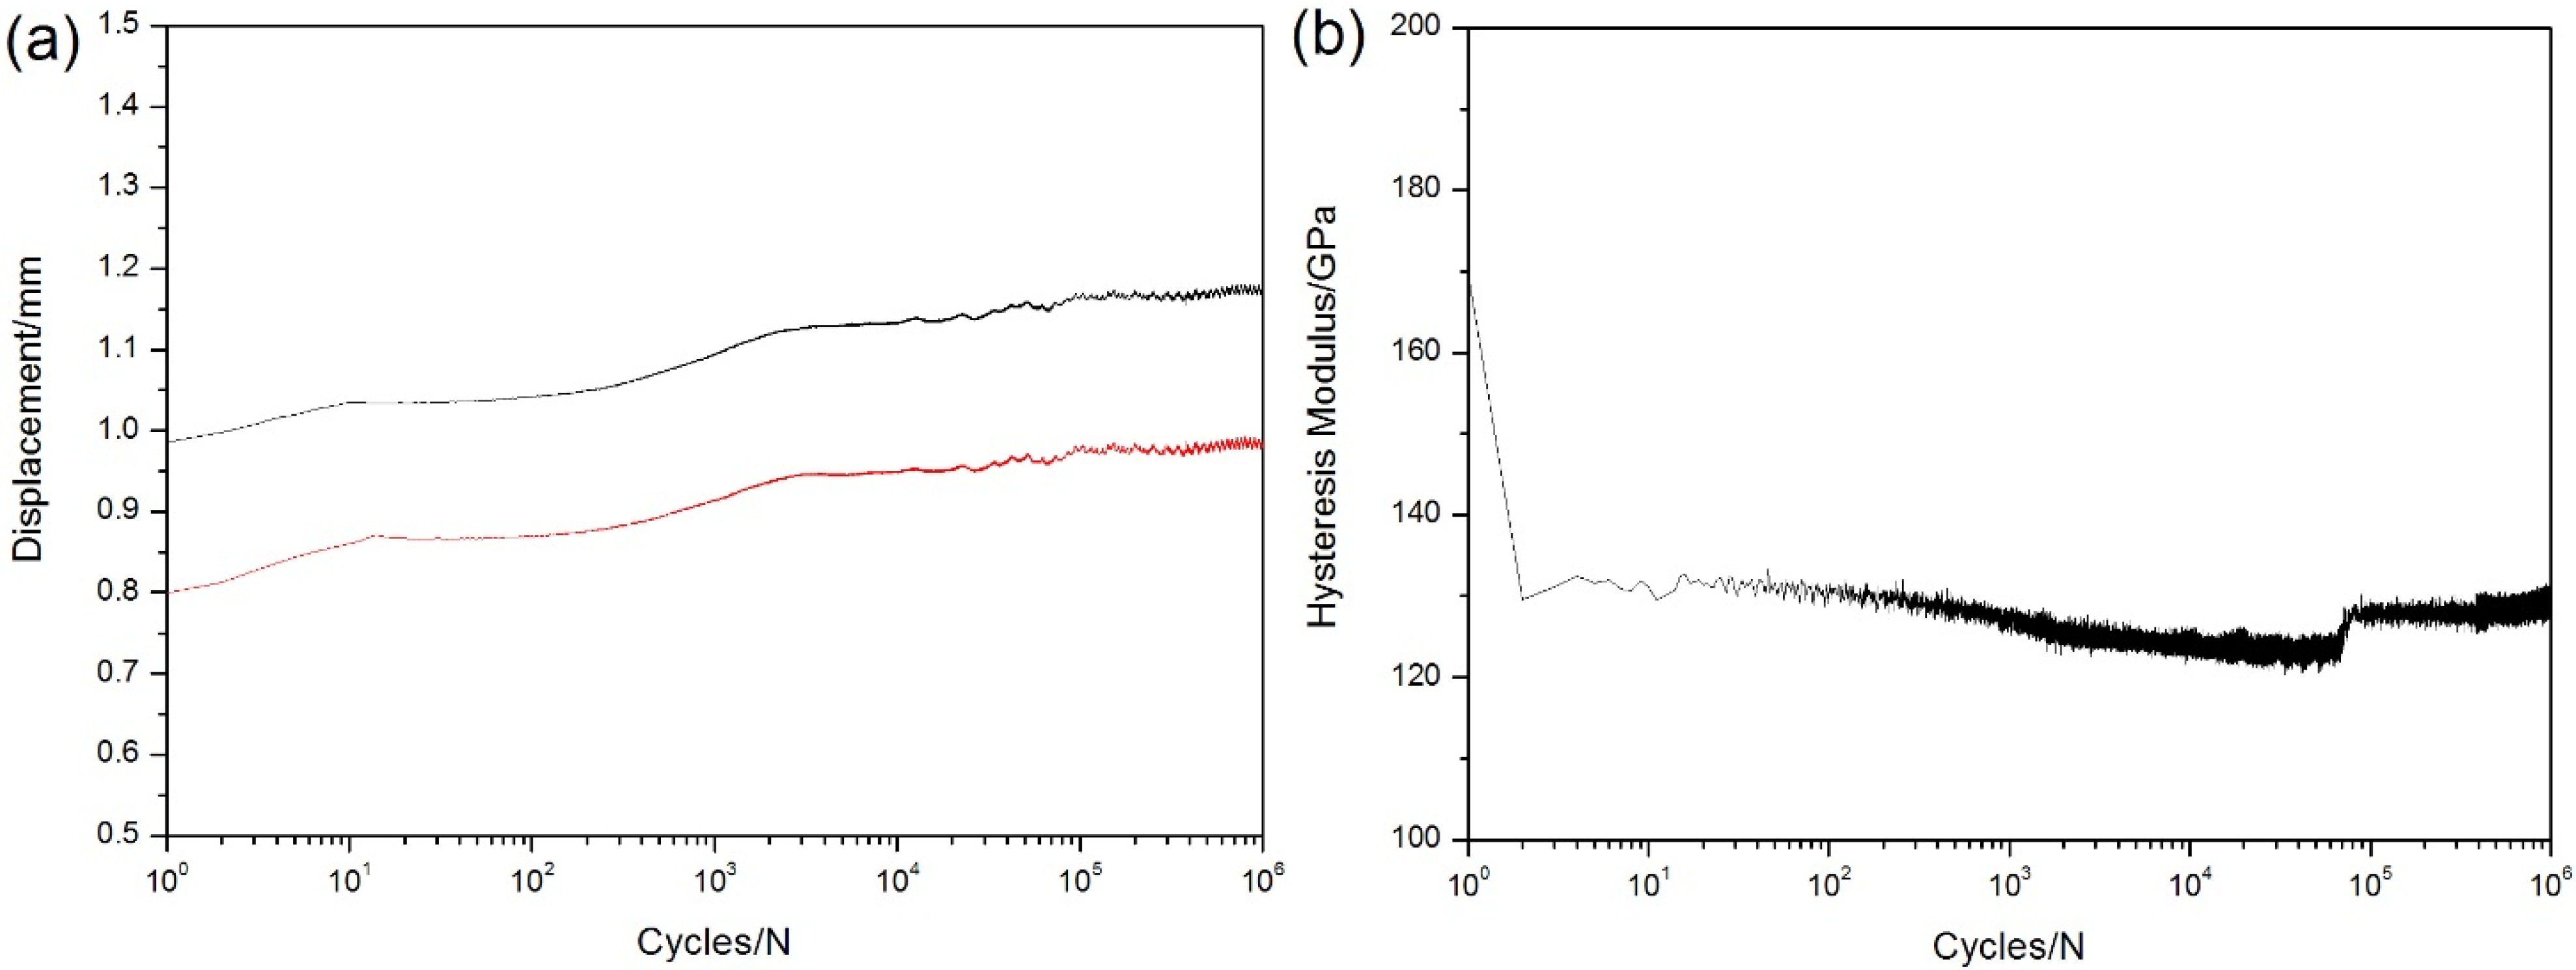
When σmax = 240 MPa, the specimen experienced 1,000,000 cycles without fatigue failure. The displacements corresponding to peak and valley stresses increase with the increase of applied cycles, as shown in Figure 4a. Under fatigue loading, the strain and load were recorded for each cycle and the hysteresis modulus E is calculated by Equation (1). The hysteresis modulus decreases rapidly at the initial stage of fatigue loading, as shown in Figure 4b, i.e., from 169 to 128 GPa during the first 10 cycles. The occurrence of matrix multicracking and fiber/matrix interface debonding is the main reason for hysteresis modulus degradation during the initial cycles. When matrix cracks approach saturation and interface shear stress degrades to steady-state value, the hysteresis modulus decreases slowly due to fibers failure.
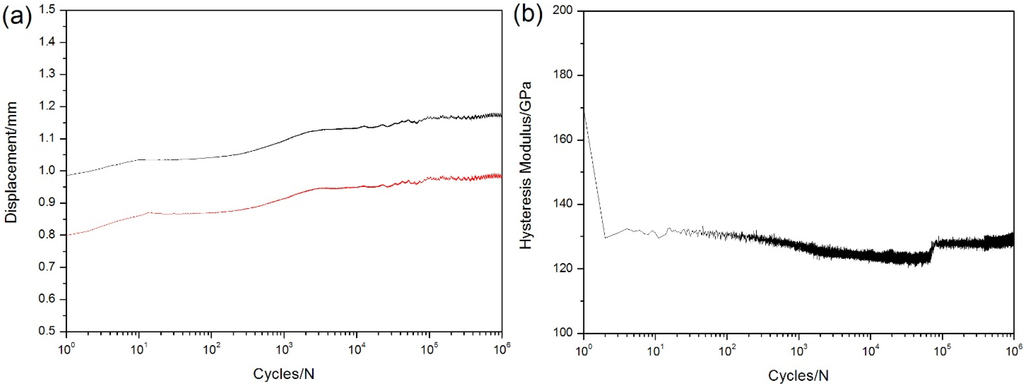
Figure 4.
(a) The peak and valley displacements versus applied cycles; and (b) the hysteresis modulus versus applied cycles of unidirectional C/SiC composite under σmax = 240 MPa at room temperature.
Figure 4.
(a) The peak and valley displacements versus applied cycles; and (b) the hysteresis modulus versus applied cycles of unidirectional C/SiC composite under σmax = 240 MPa at room temperature.
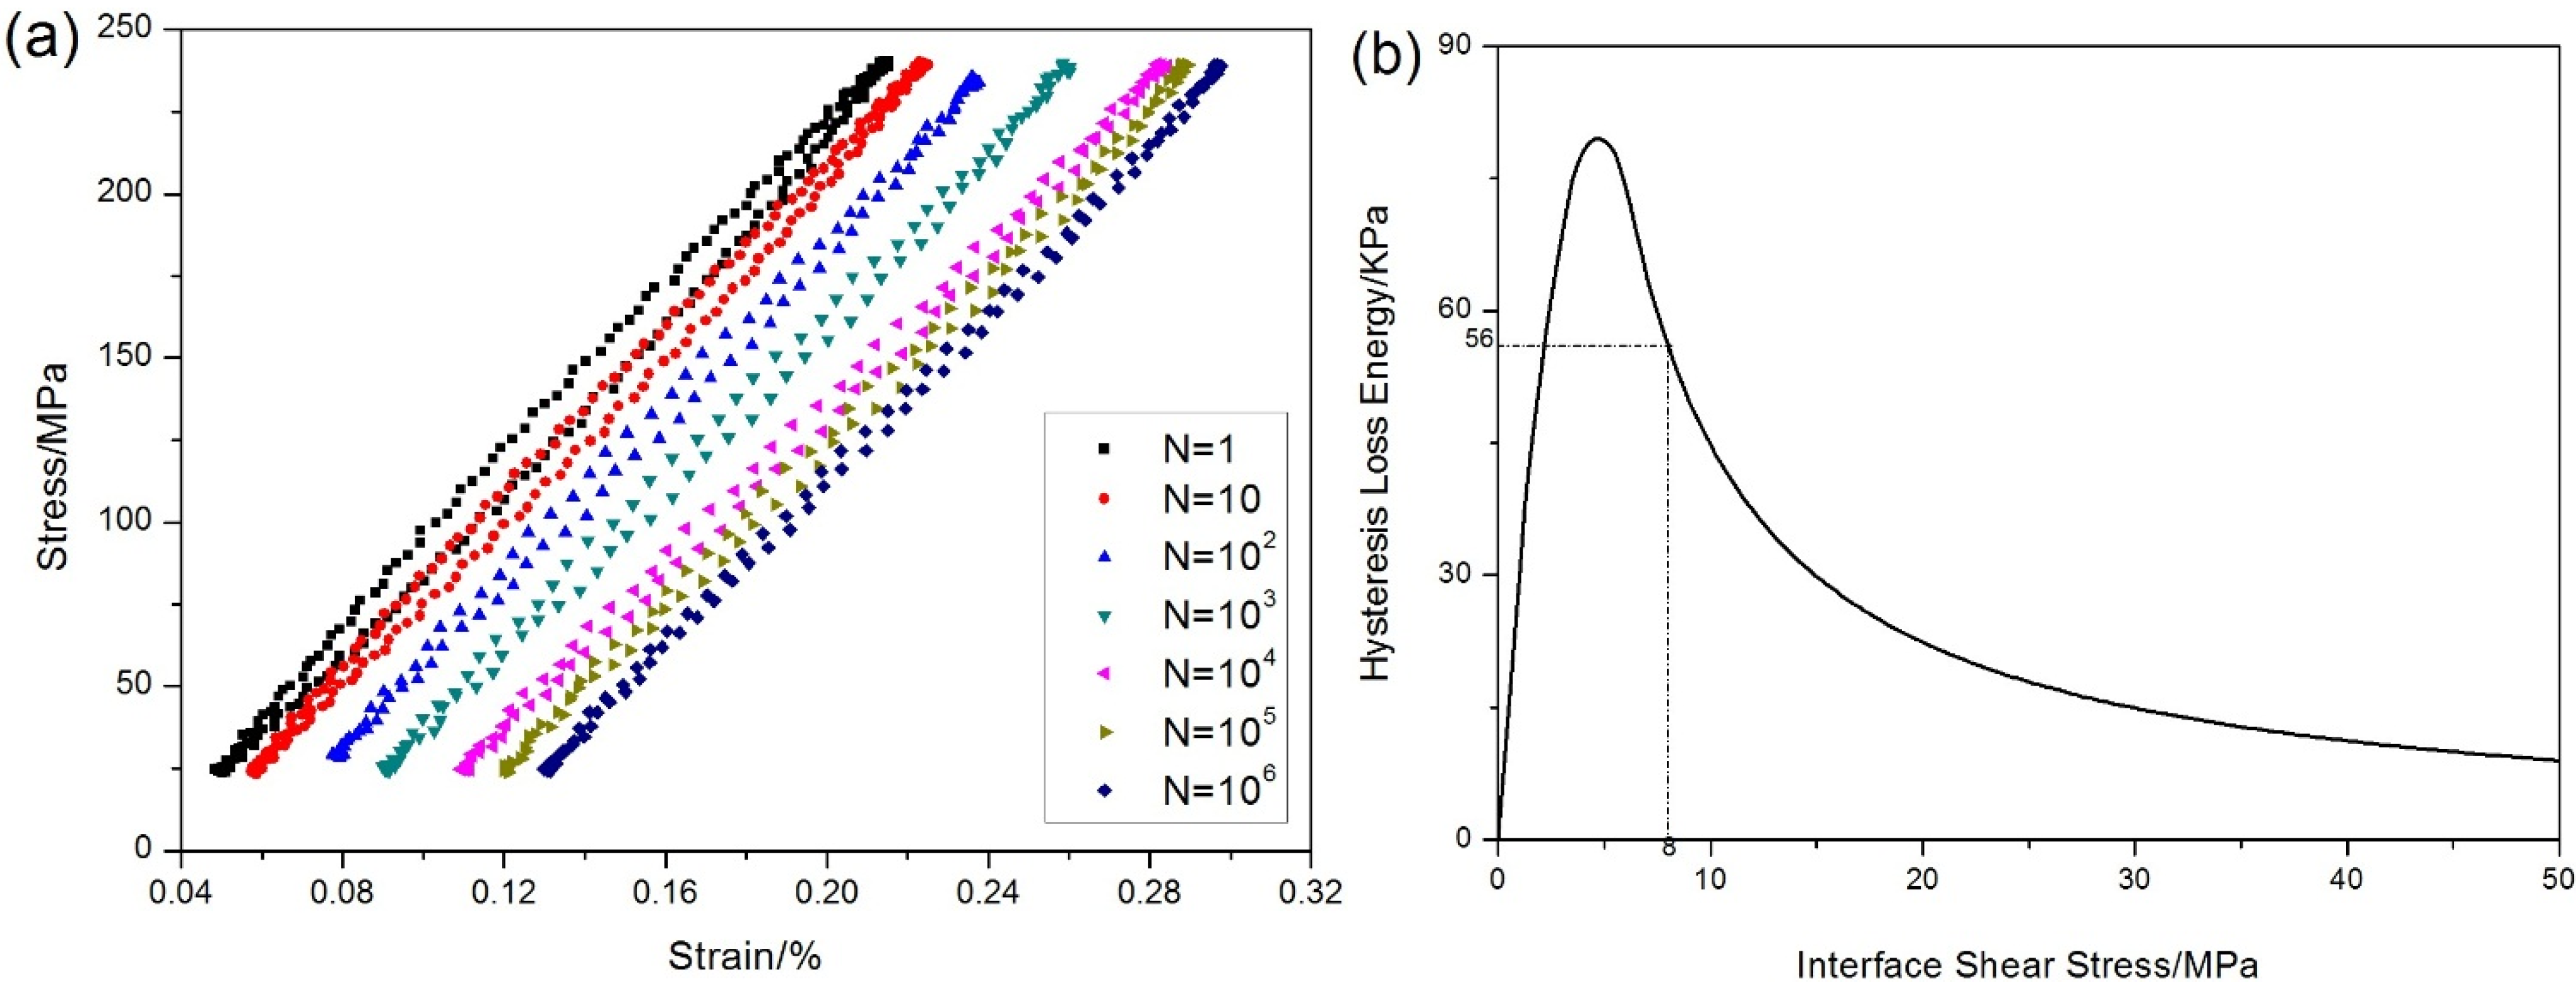
The stress-strain hysteresis loops corresponding to the 1st, 10th, 100th, 1000th, 10,000th, 100,000th and 1,000,000th cycles are illustrated in Figure 5a, and the hysteresis loss energy versus applied cycles curve is given in Figure 5b, in which the hysteresis loss energy degrades from 56 KPa during the 1st cycle to 8 KPa during the 1,000,000th cycle due to interface wear.
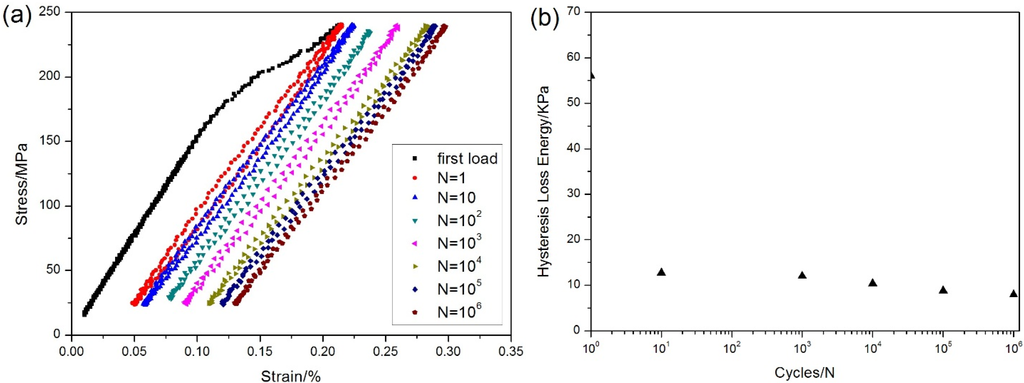
Figure 5.
(a) The stress-strain hysteresis loops corresponding to different number of applied cycles; and (b) the hysteresis loss energy versus applied cycles of unidirectional C/SiC composite under σmax = 240 MPa at room temperature.
Figure 5.
(a) The stress-strain hysteresis loops corresponding to different number of applied cycles; and (b) the hysteresis loss energy versus applied cycles of unidirectional C/SiC composite under σmax = 240 MPa at room temperature.

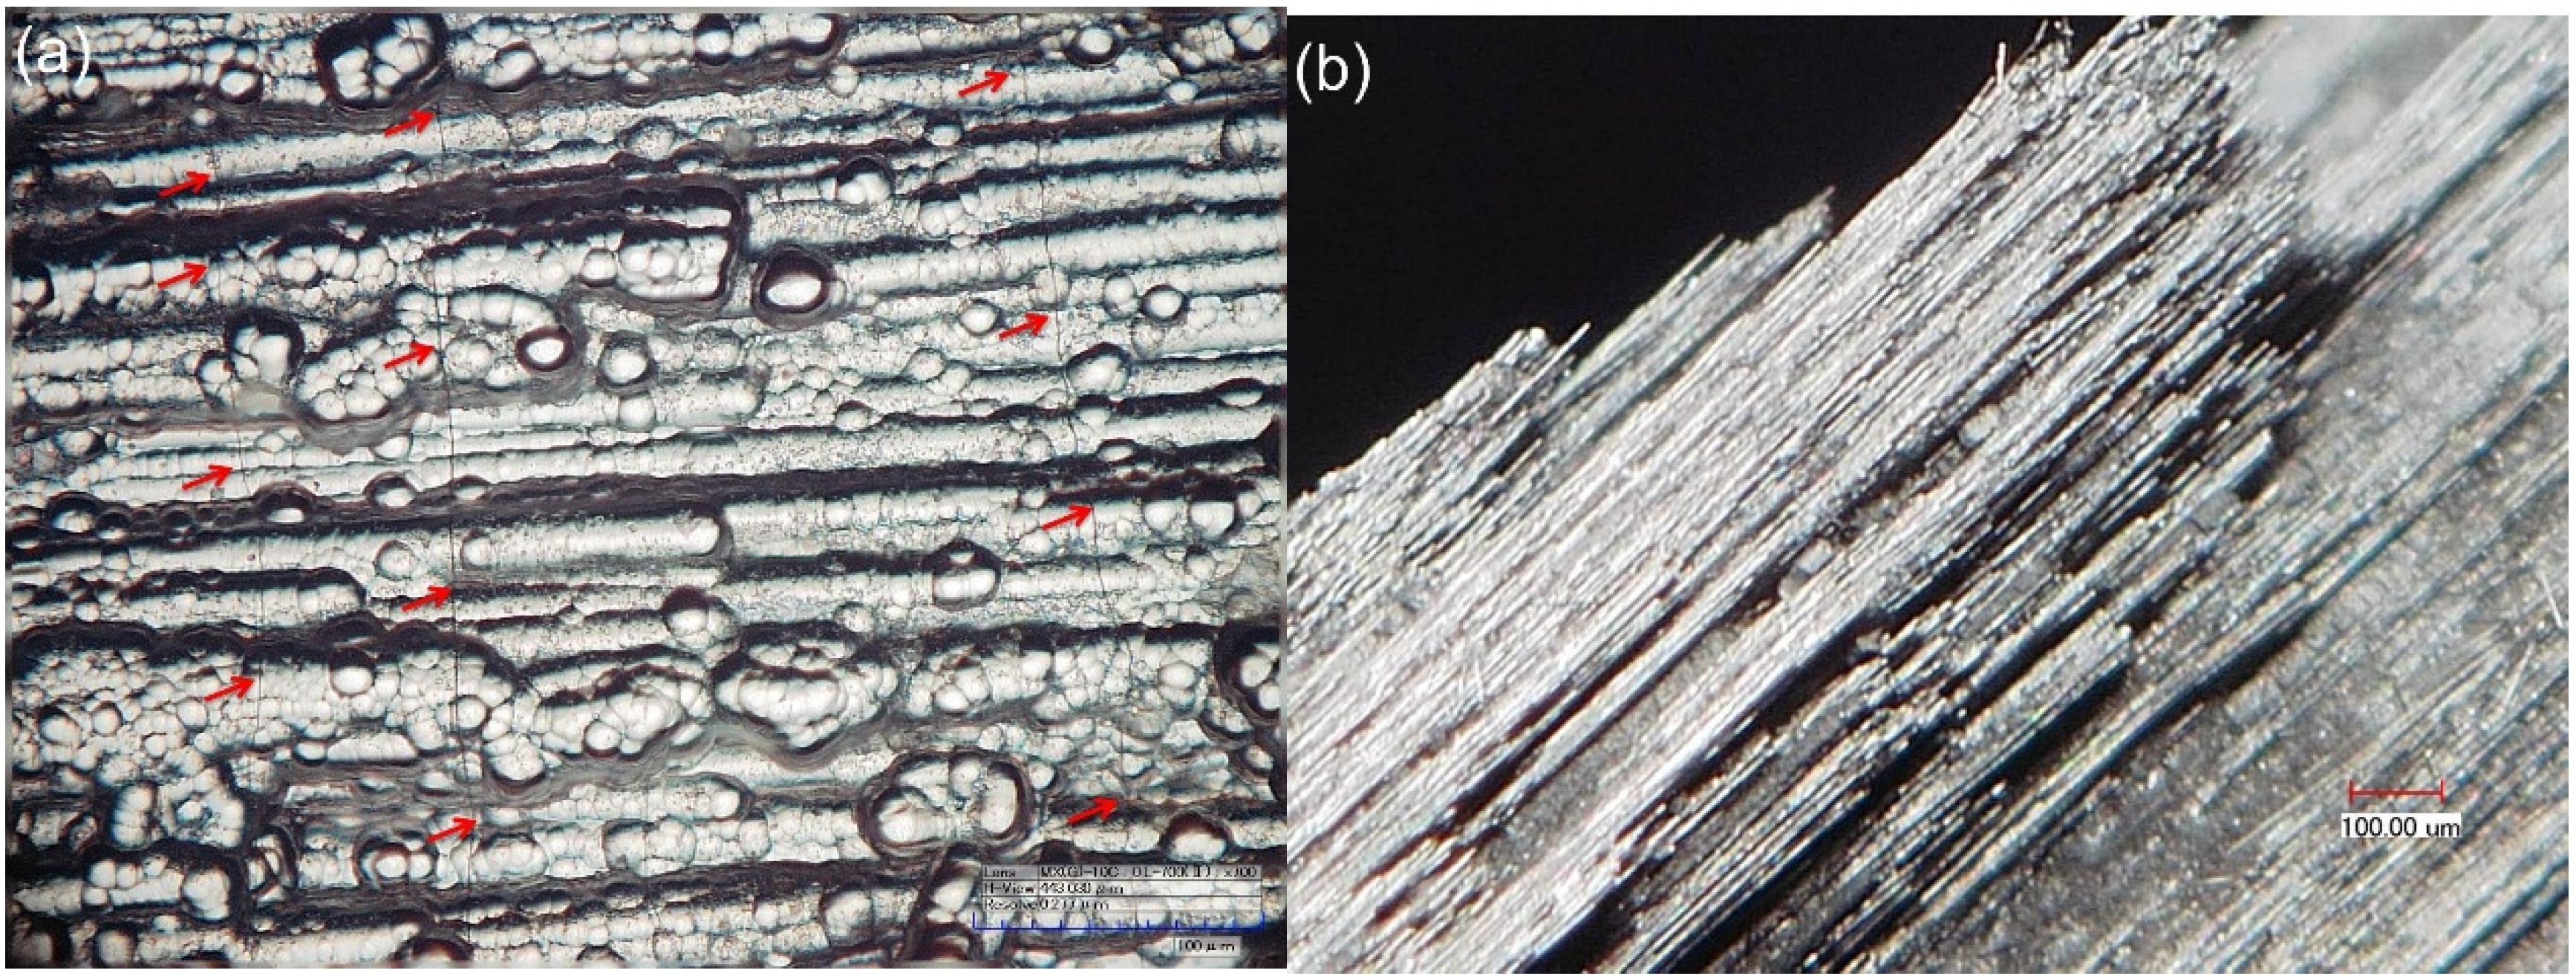
The specimen without fatigue failure was tensiled to failure at a loading speed of 10 MPa/s. After specimen tensile failure, the side and fracture surface of the failure specimen were observed under optical microscope. There exist multiple matrix cracks on the side surfaces, as shown in Figure 6a. The saturation matrix cracking space was about 108 μm. The fracture surface of the failure specimen is shown in Figure 6b. There exist distributed fiber pullouts. The length of the pullout fiber is much longer than that of tensile failure specimen at room temperature, mainly attributed to low interface shear stress after fatigue loading.
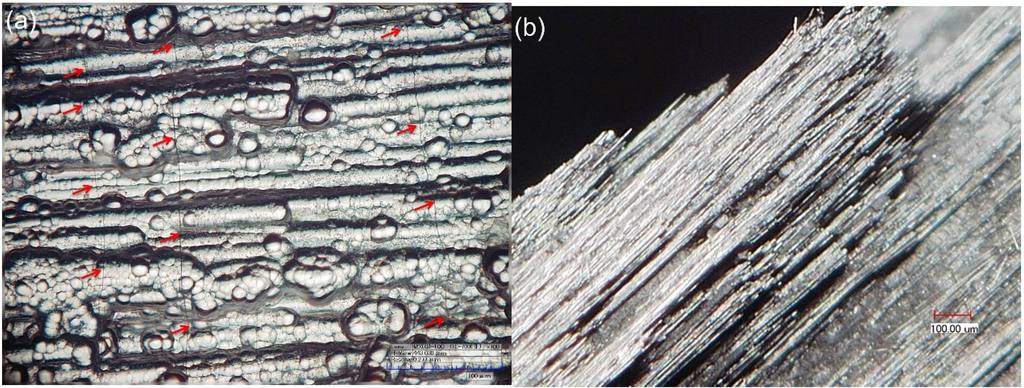
Figure 6.
(a) The multiple matrix crackings on the side surface; and (b) the fiber pullout at the fracture surface of the failure specimen observed under optical microscope.
Figure 6.
(a) The multiple matrix crackings on the side surface; and (b) the fiber pullout at the fracture surface of the failure specimen observed under optical microscope.
3.2. Elevated Temperature
The tensile strength is approximately 320 ± 3 MPa at 800 °C under air. The cyclic tensile stress-strain curves are shown in Figure 7. The specimen was loading/unloading/reloading at the peak stresses of 20, 40, 60, 80, 100, 120, 140, 160, 180, 200, 220, 240, 260, 280 and 300 MPa, and failed at the applied stress of 320 MPa, with the failure strain of 0.49%. The tension-tension fatigue peak stresses were 250 MPa (78% tensile strength), 210 MPa (65.6% tensile strength), 180 MPa (56% tensile strength), 140 MPa (43.7% tensile strength) and 120 MPa (37.5% tensile strength), respectively. The fatigue life S-N curve is illustrated in Figure 8.
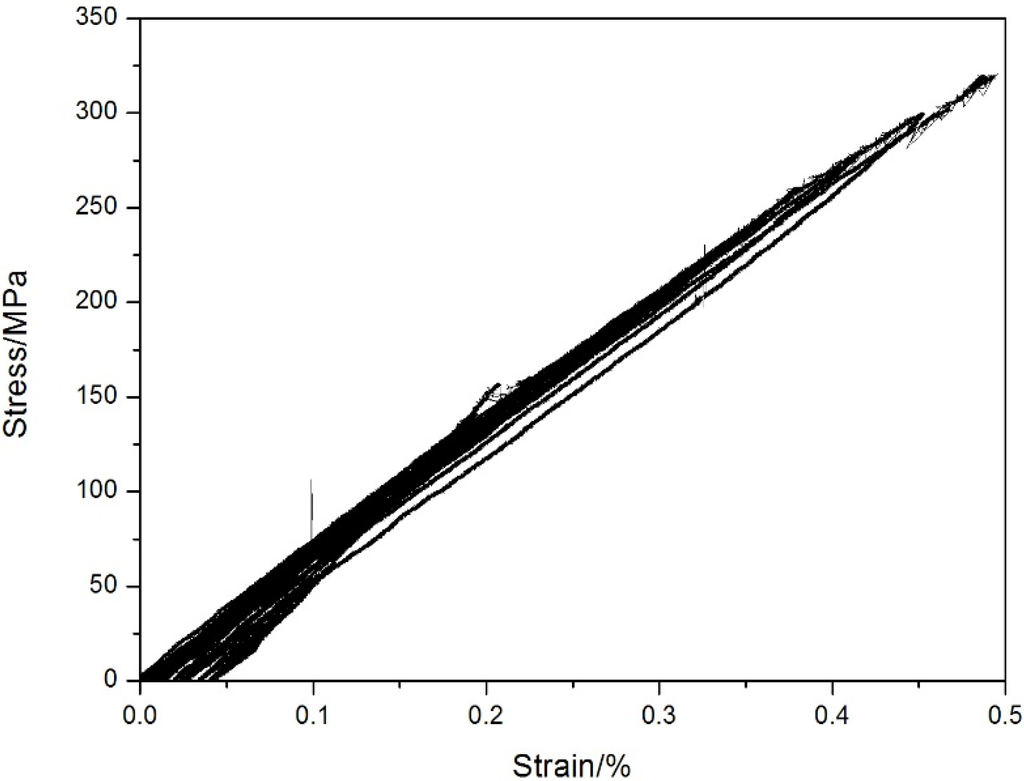
Figure 7.
The loading/unloading tensile stress−strain curves of unidirectional C/SiC composite at 800 °C under air.
Figure 7.
The loading/unloading tensile stress−strain curves of unidirectional C/SiC composite at 800 °C under air.

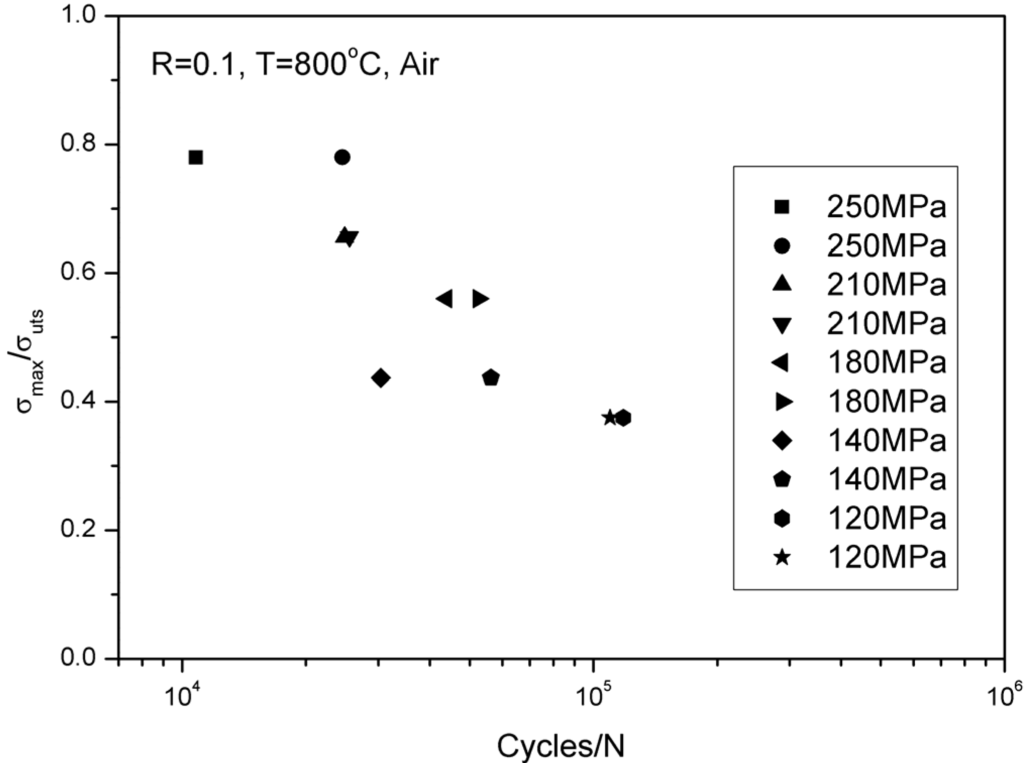
Figure 8.
The fatigue life S-N curve of unidirectional C/SiC composite at 800 °C under air.
Figure 8.
The fatigue life S-N curve of unidirectional C/SiC composite at 800 °C under air.

When σmax = 120 MPa, the specimen experienced 72215 cycles and fatigue failed. The displacement increases rapidly during the first 10 cycles due to matrix multicracking and interface debonding, then increases slowly due to interface shear stress degradation for interface wear or oxidation, before the specimen failure, the displacement increases rapidly again, mainly attributed to fibers failure, as shown in Figure 9a. The hysteresis modulus versus cycle number curve is shown in Figure 9b, in which the curve is divided into three regions, i.e., (1) at the initial stage of fatigue loading, the hysteresis modulus decreases rapidly due to matrix multicracking and interface debonding; (2) when matrix cracks approach saturation, the hysteresis modulus decreases slowly due to interface shear stress degradation; and (3) during the final 2000 cycles, the hysteresis modulus decreases rapidly due to fibers failure.
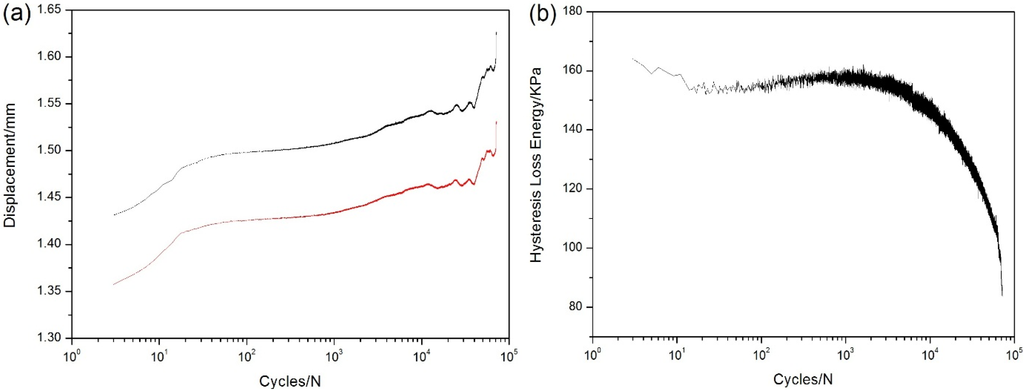
Figure 9.
(a) The peak and valley displacements versus applied cycles; and (b) the hysteresis modulus versus applied cycles of unidirectional C/SiC composite under σmax = 120 MPa at 800 °C in air.
Figure 9.
(a) The peak and valley displacements versus applied cycles; and (b) the hysteresis modulus versus applied cycles of unidirectional C/SiC composite under σmax = 120 MPa at 800 °C in air.
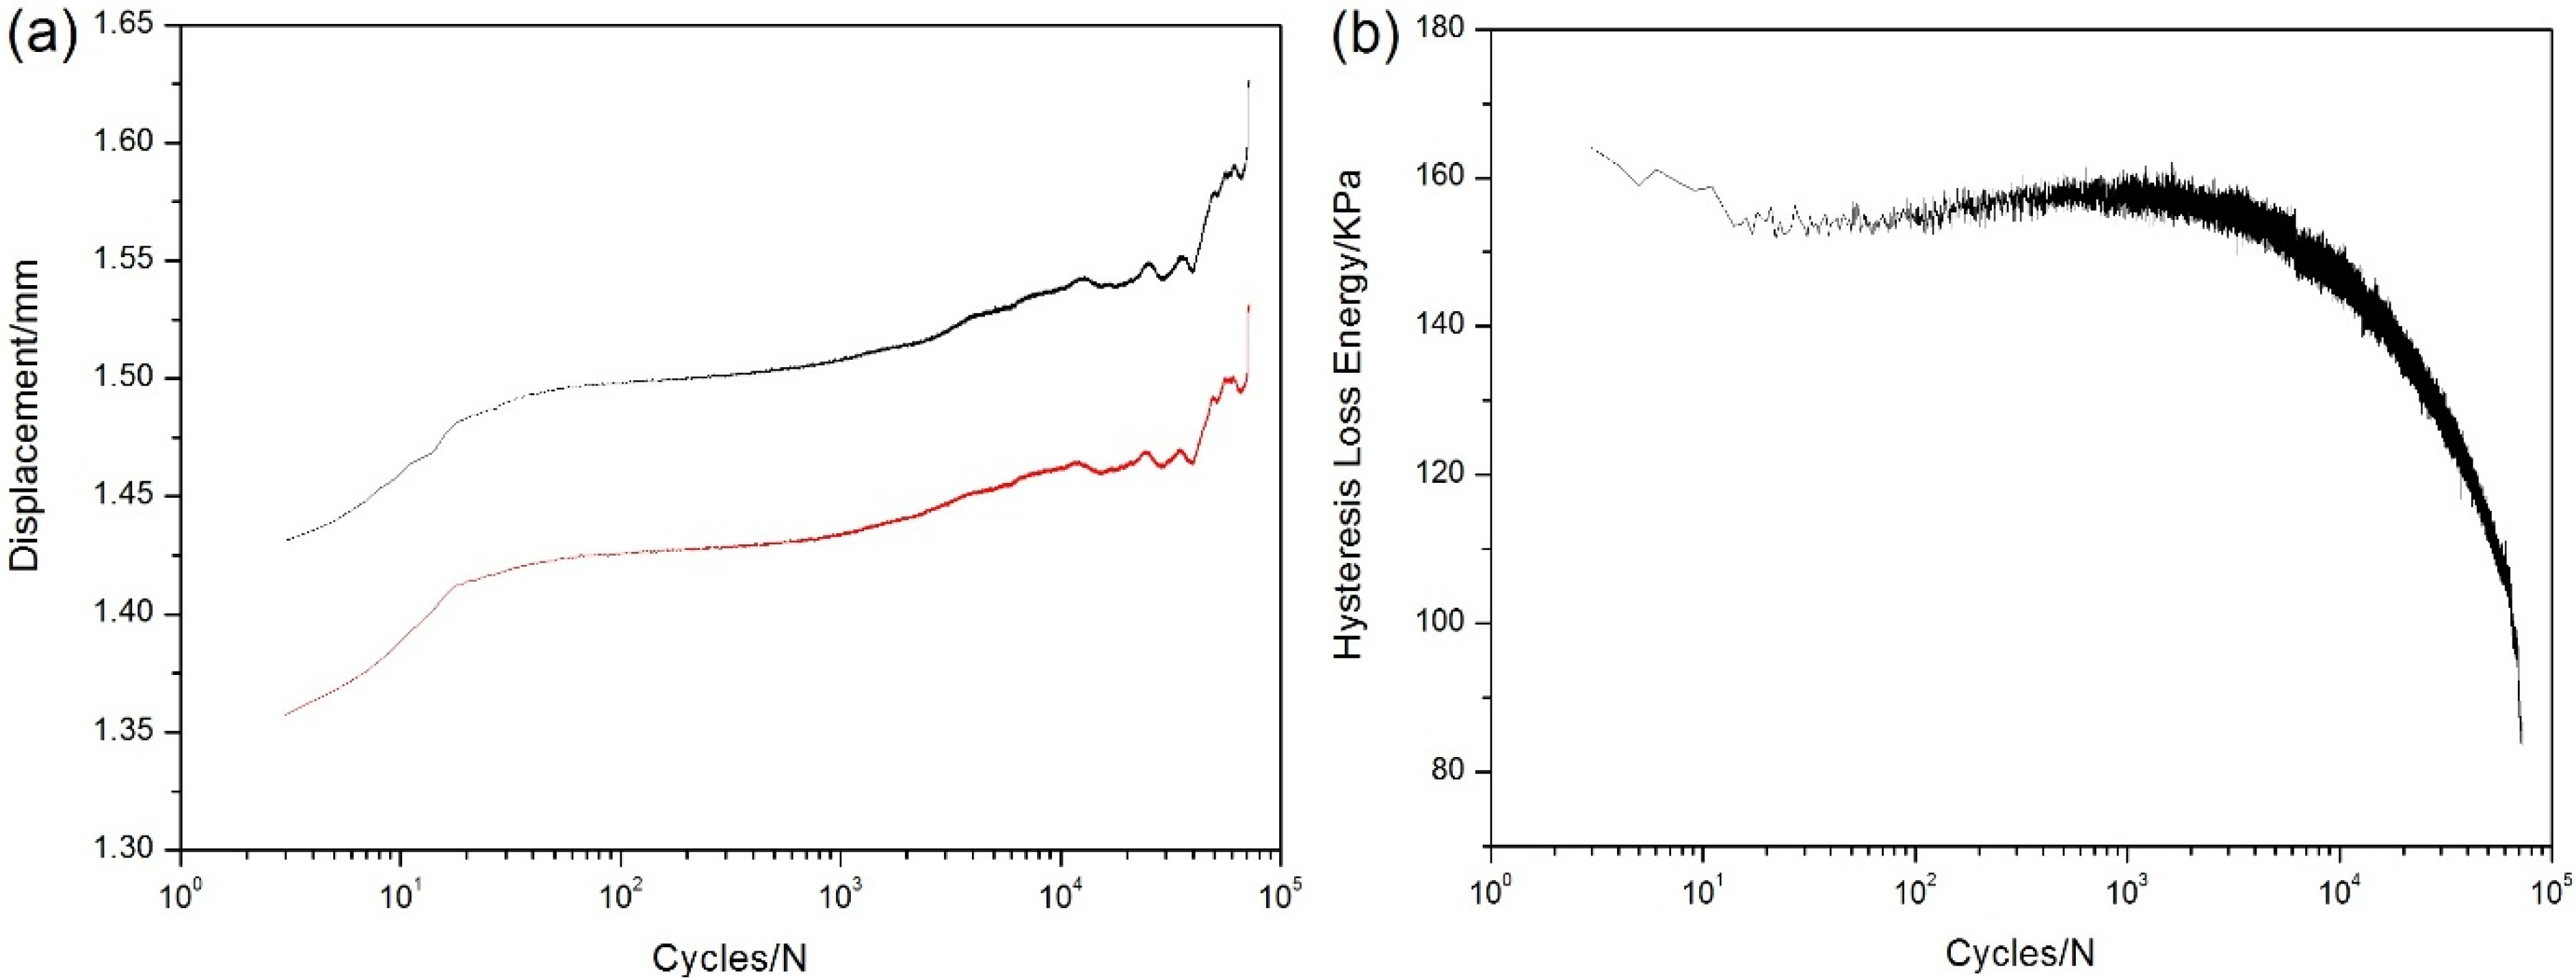
The stress-strain hysteresis loops corresponding to 10th, 100th, 1000th, 10,000th, 50,000th, 70,000th and 72,200th cycles are shown in Figure 10a, and the hysteresis loss energy versus applied cycles curve is shown in Figure 10b, in which the hysteresis loss energy degrades from 28 KPa during the 1st cycle to 1.22 KPa during the 72,200th cycle due to degradation of interface shear stress for oxidation.
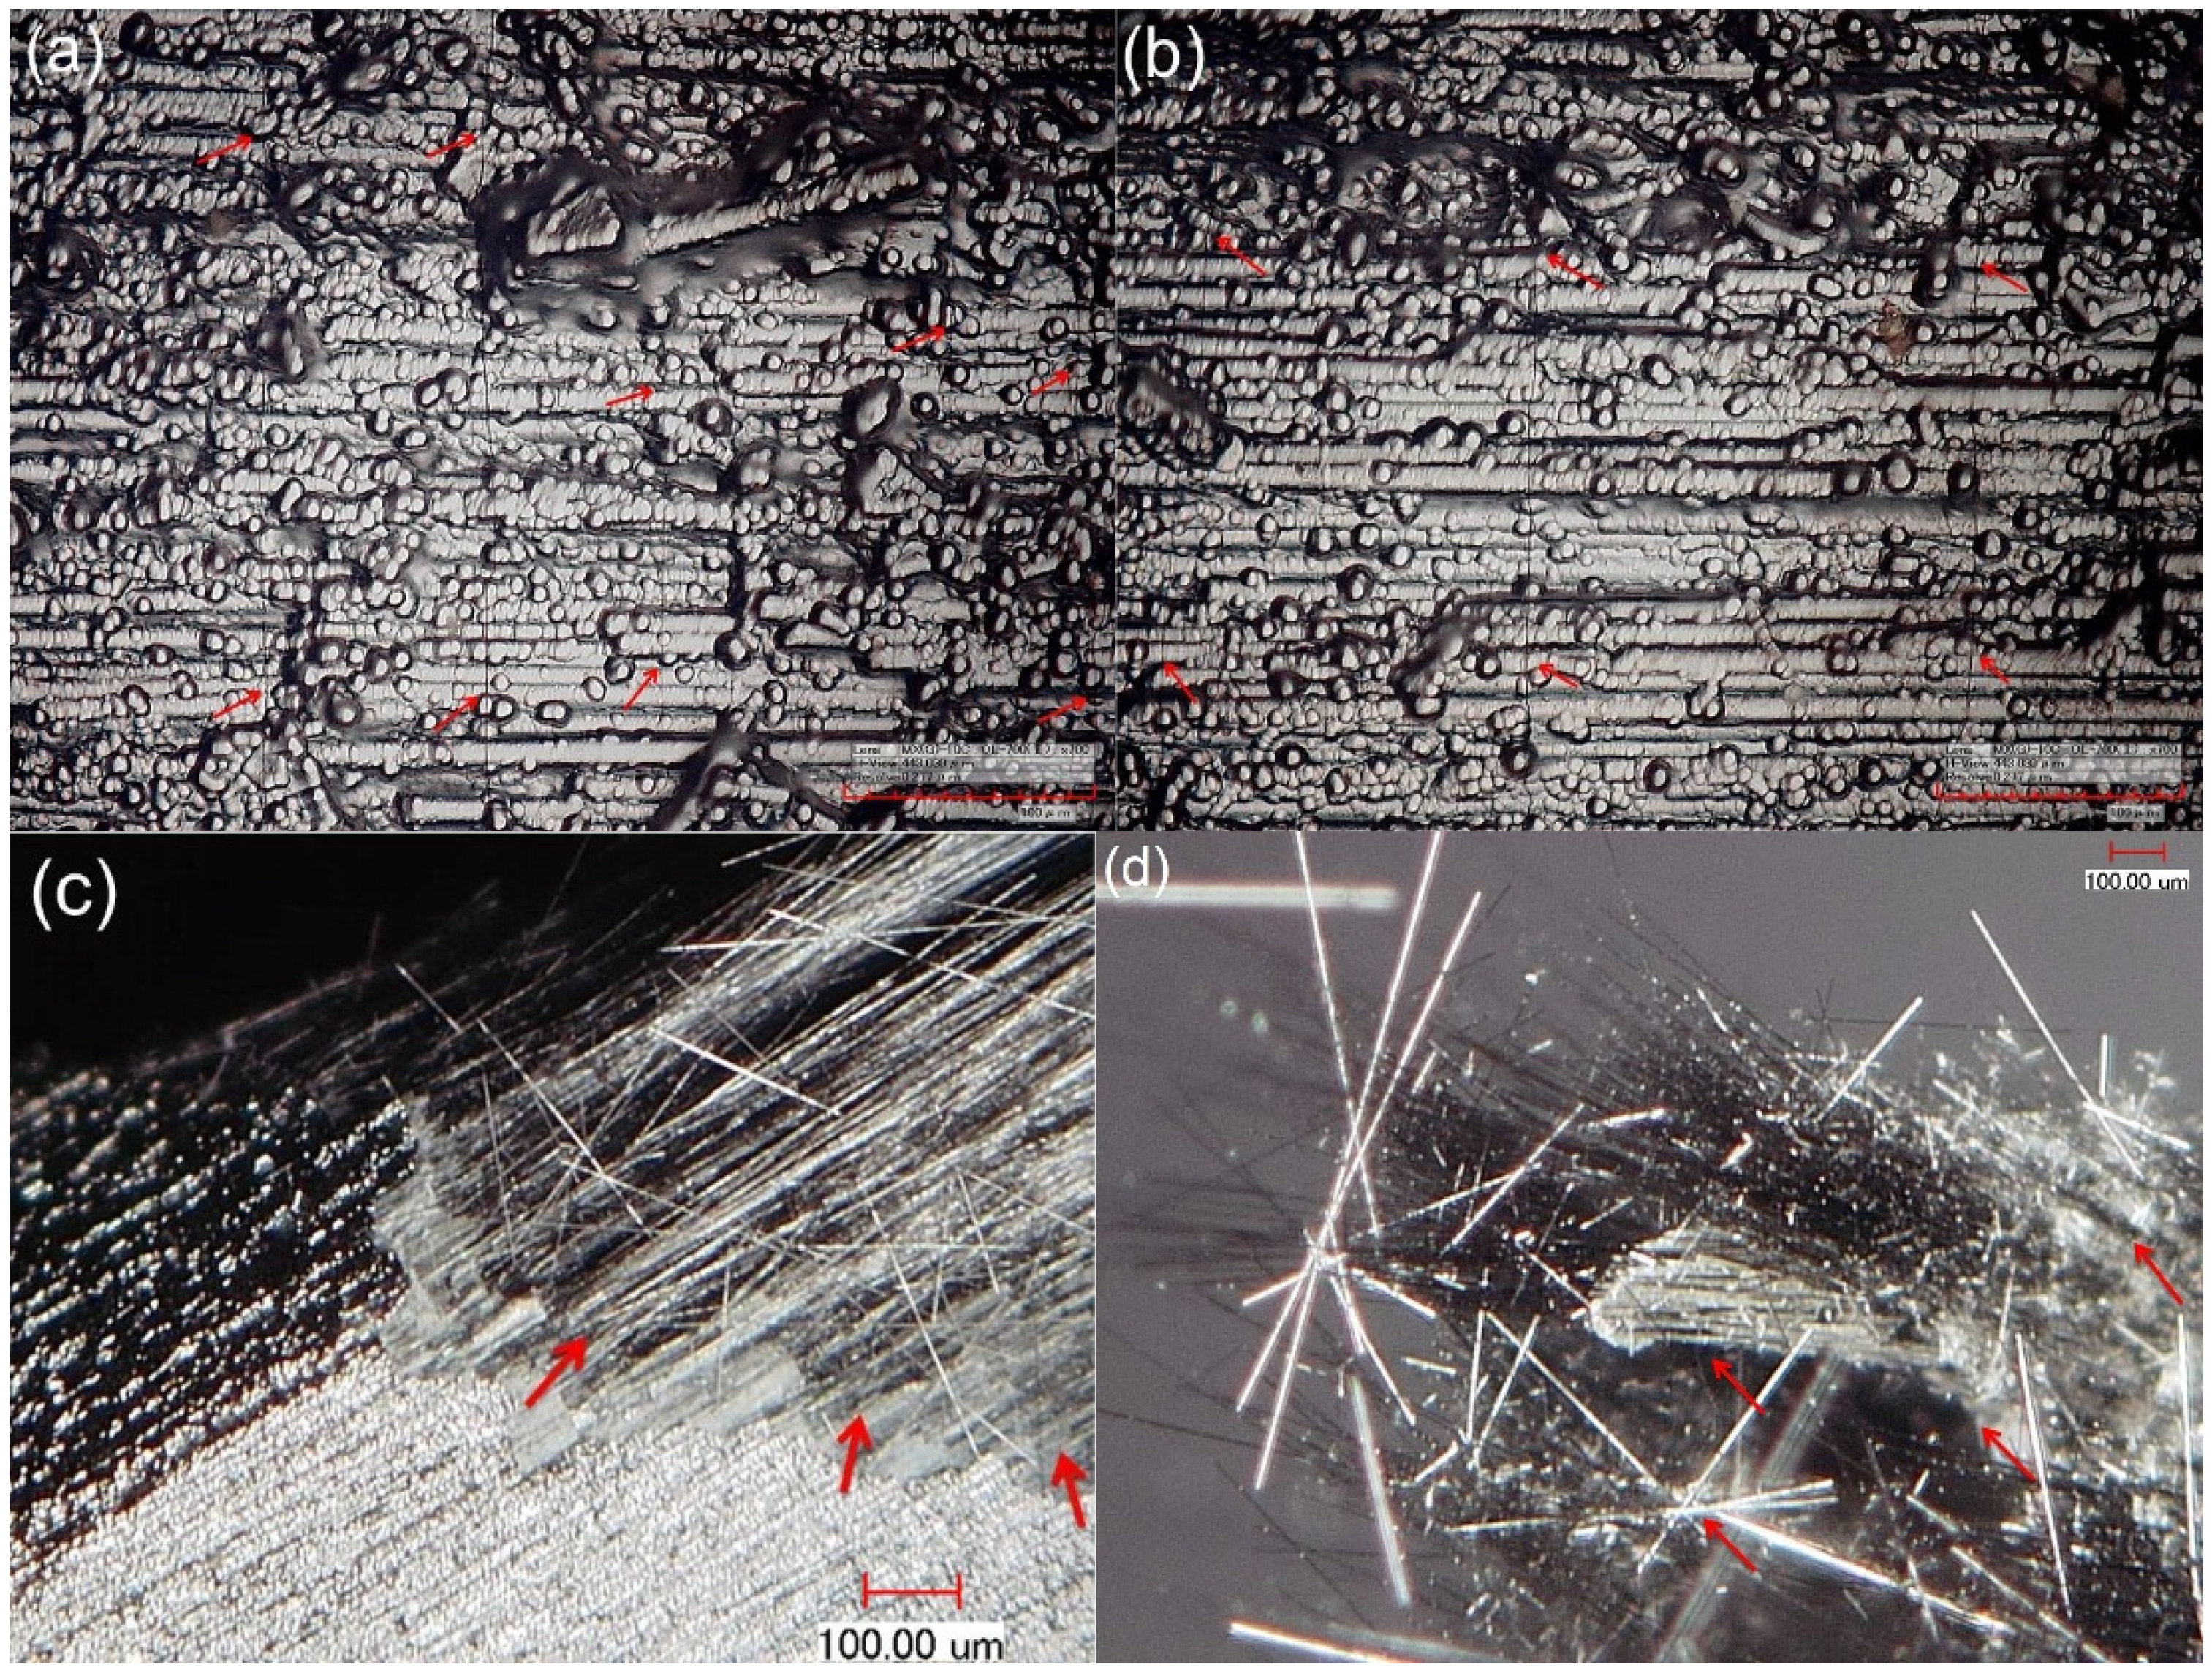
After specimen fatigue failure, the front and side surfaces and fracture surface were observed under optical microscope. There exist multiple matrix crackings in front and side surfaces of failure specimens, as shown in Figure 11a,b. The saturation matrix crack spacing is approximately 80 μm. There exist distributed fiber pullouts, and the fiber pullout length is much longer than that of tensile fatigue failure specimen at room temperature, as shown in Figure 11c,d. The surface of pullout fibers exhibits serious oxidation. The interface shear stress degratation due to oxidation of PyC interphase or carbon fibers is the main reason for longer fiber pullout length under fatigue loading at 800 °C in air.
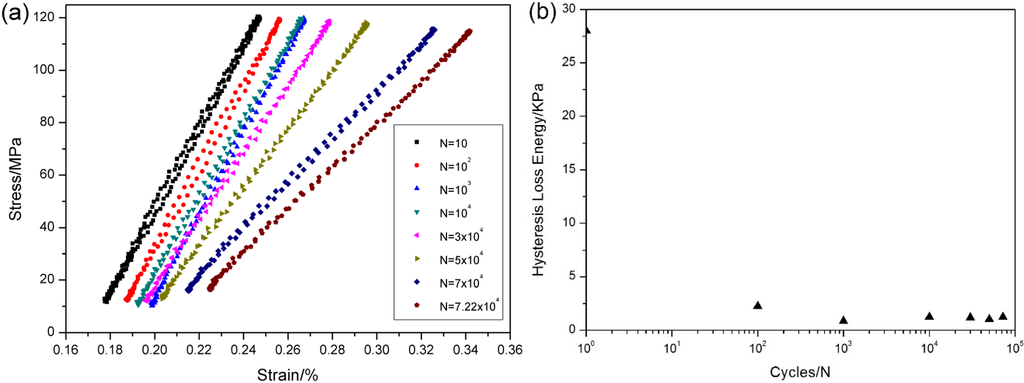
Figure 10.
(a) The stress-strain hysteresis loops corresponding to different applied cycles; and (b) the hysteresis loss energy versus applied cycles of unidirectional C/SiC composite under σmax = 120MPa at 800 °C in air.
Figure 10.
(a) The stress-strain hysteresis loops corresponding to different applied cycles; and (b) the hysteresis loss energy versus applied cycles of unidirectional C/SiC composite under σmax = 120MPa at 800 °C in air.

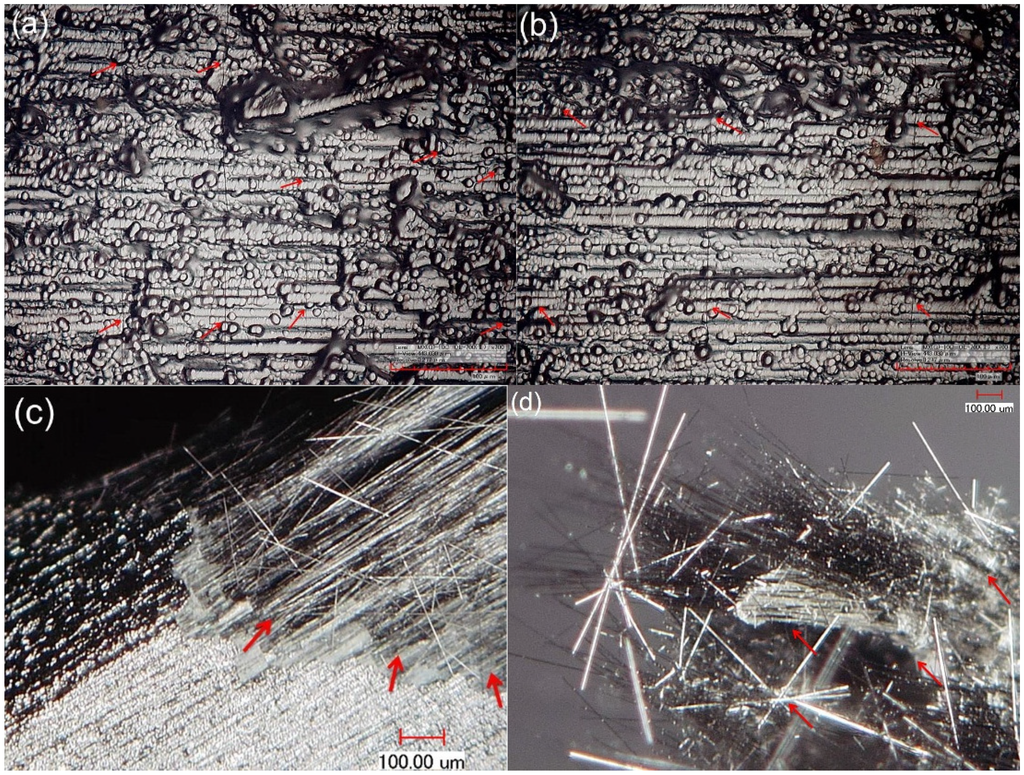
Figure 11.
(a) The multiple matrix crackings on the front surface; (b) the multiple matrix crackings on the side surface; (c) the pullout fibers at the fracture surface; and (d) the pullout fibers appearing serious oxidation for fatigue failure specimen at 800 °C in air.
Figure 11.
(a) The multiple matrix crackings on the front surface; (b) the multiple matrix crackings on the side surface; (c) the pullout fibers at the fracture surface; and (d) the pullout fibers appearing serious oxidation for fatigue failure specimen at 800 °C in air.
4. Fatigue Hysteresis Theories and Life Prediction Model
4.1. Fatigue Hysteresis Theories
Under fatigue loading, the hysteresis loops develop due to frictional sliding occurred along any interface-debonded region. Based on the interface slip mechanism, the hysteresis loops can be classified into four different cases, i.e., (1) the interface partially debonds and fiber completely slides relative to matrix; (2) the interface partially debonds and fiber partially slides relative to matrix; (3) the interface completely debonds and fiber partially slides relative to matrix; and (4) the interface completely debonds and fiber completely slides relative to matrix in the interface debonded region.
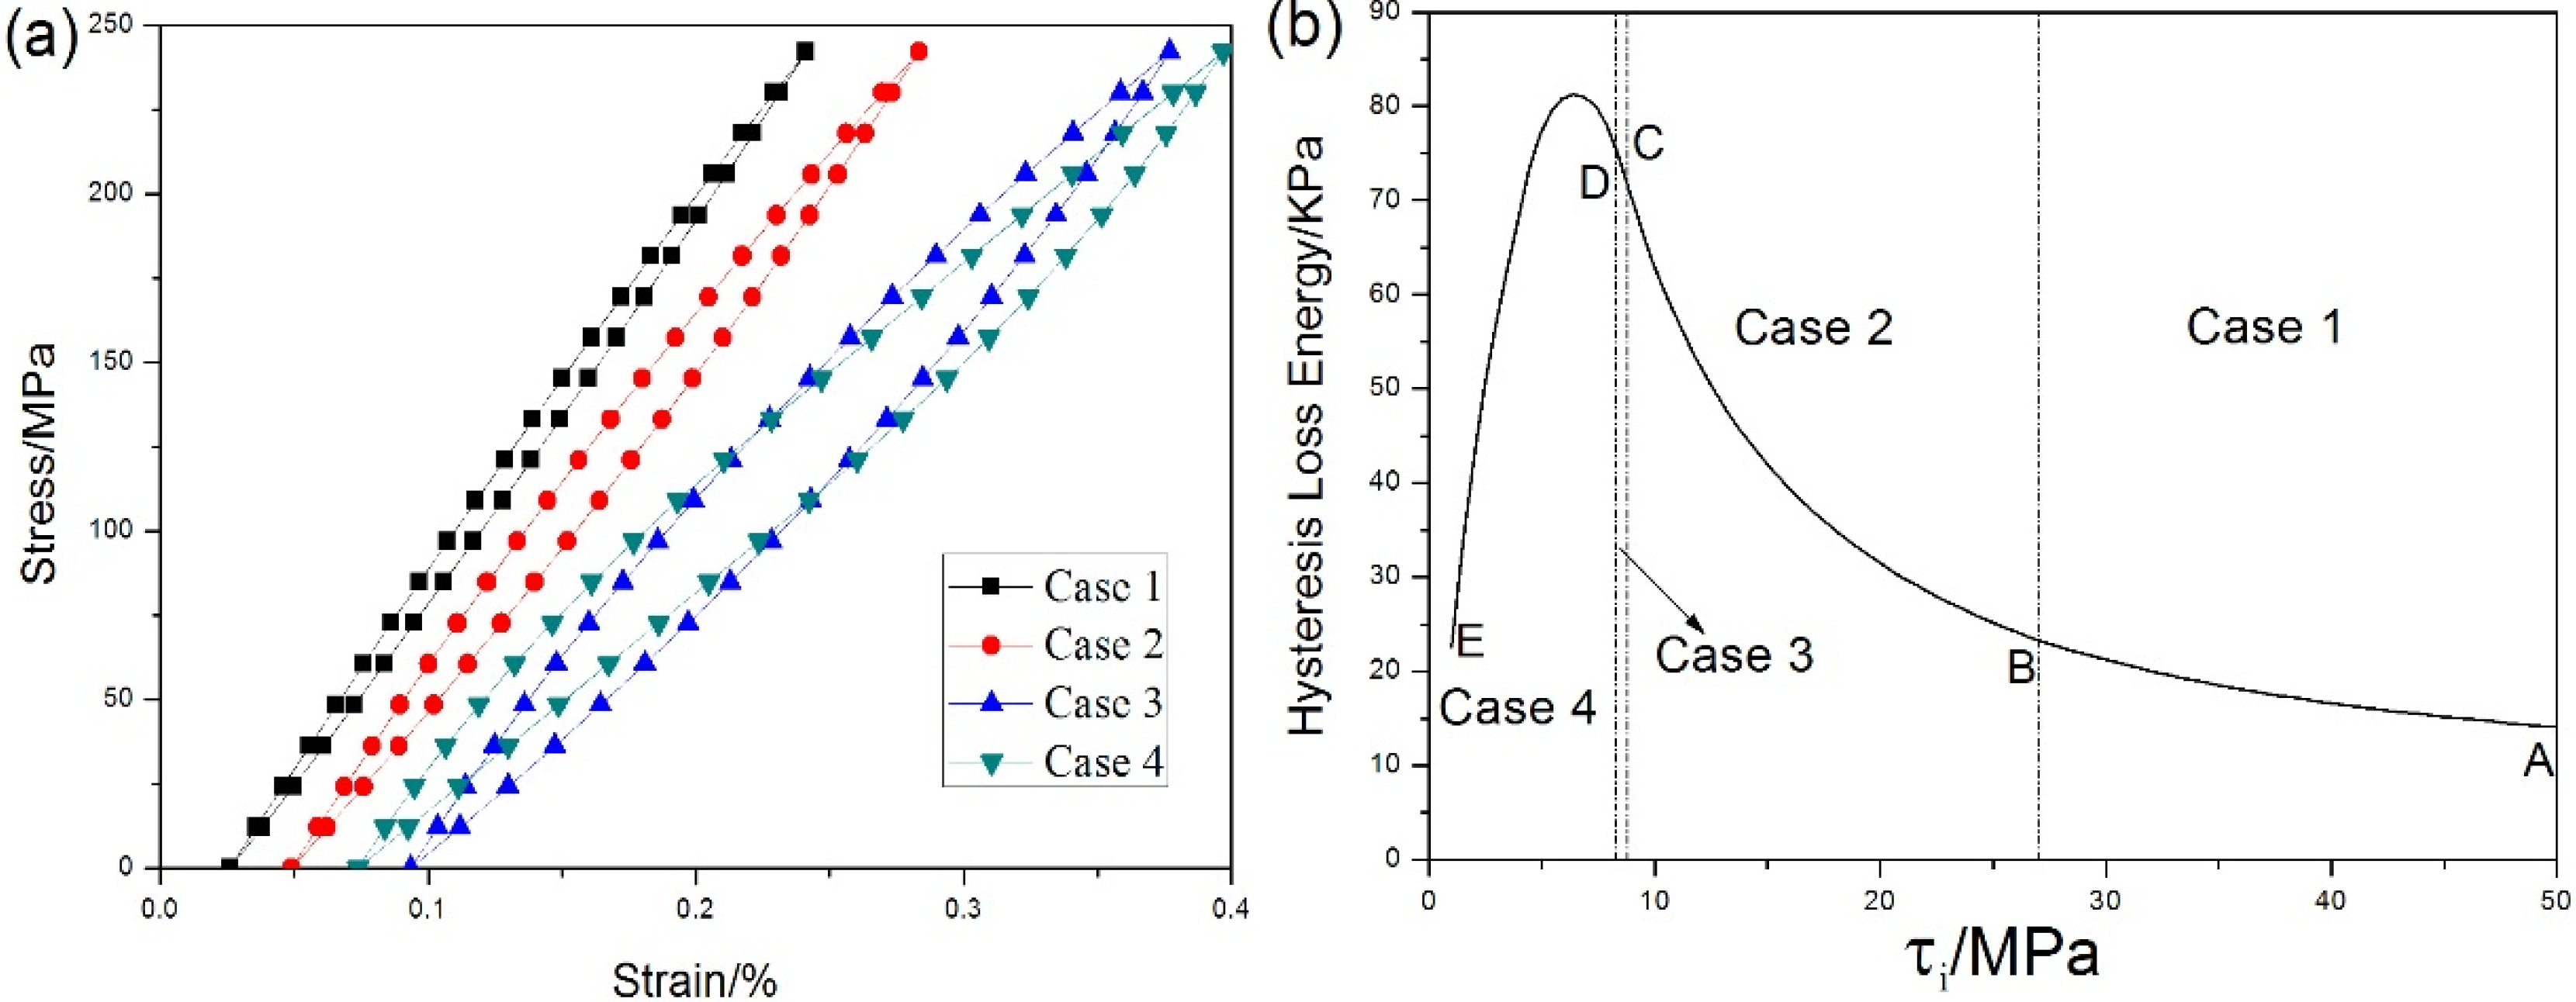
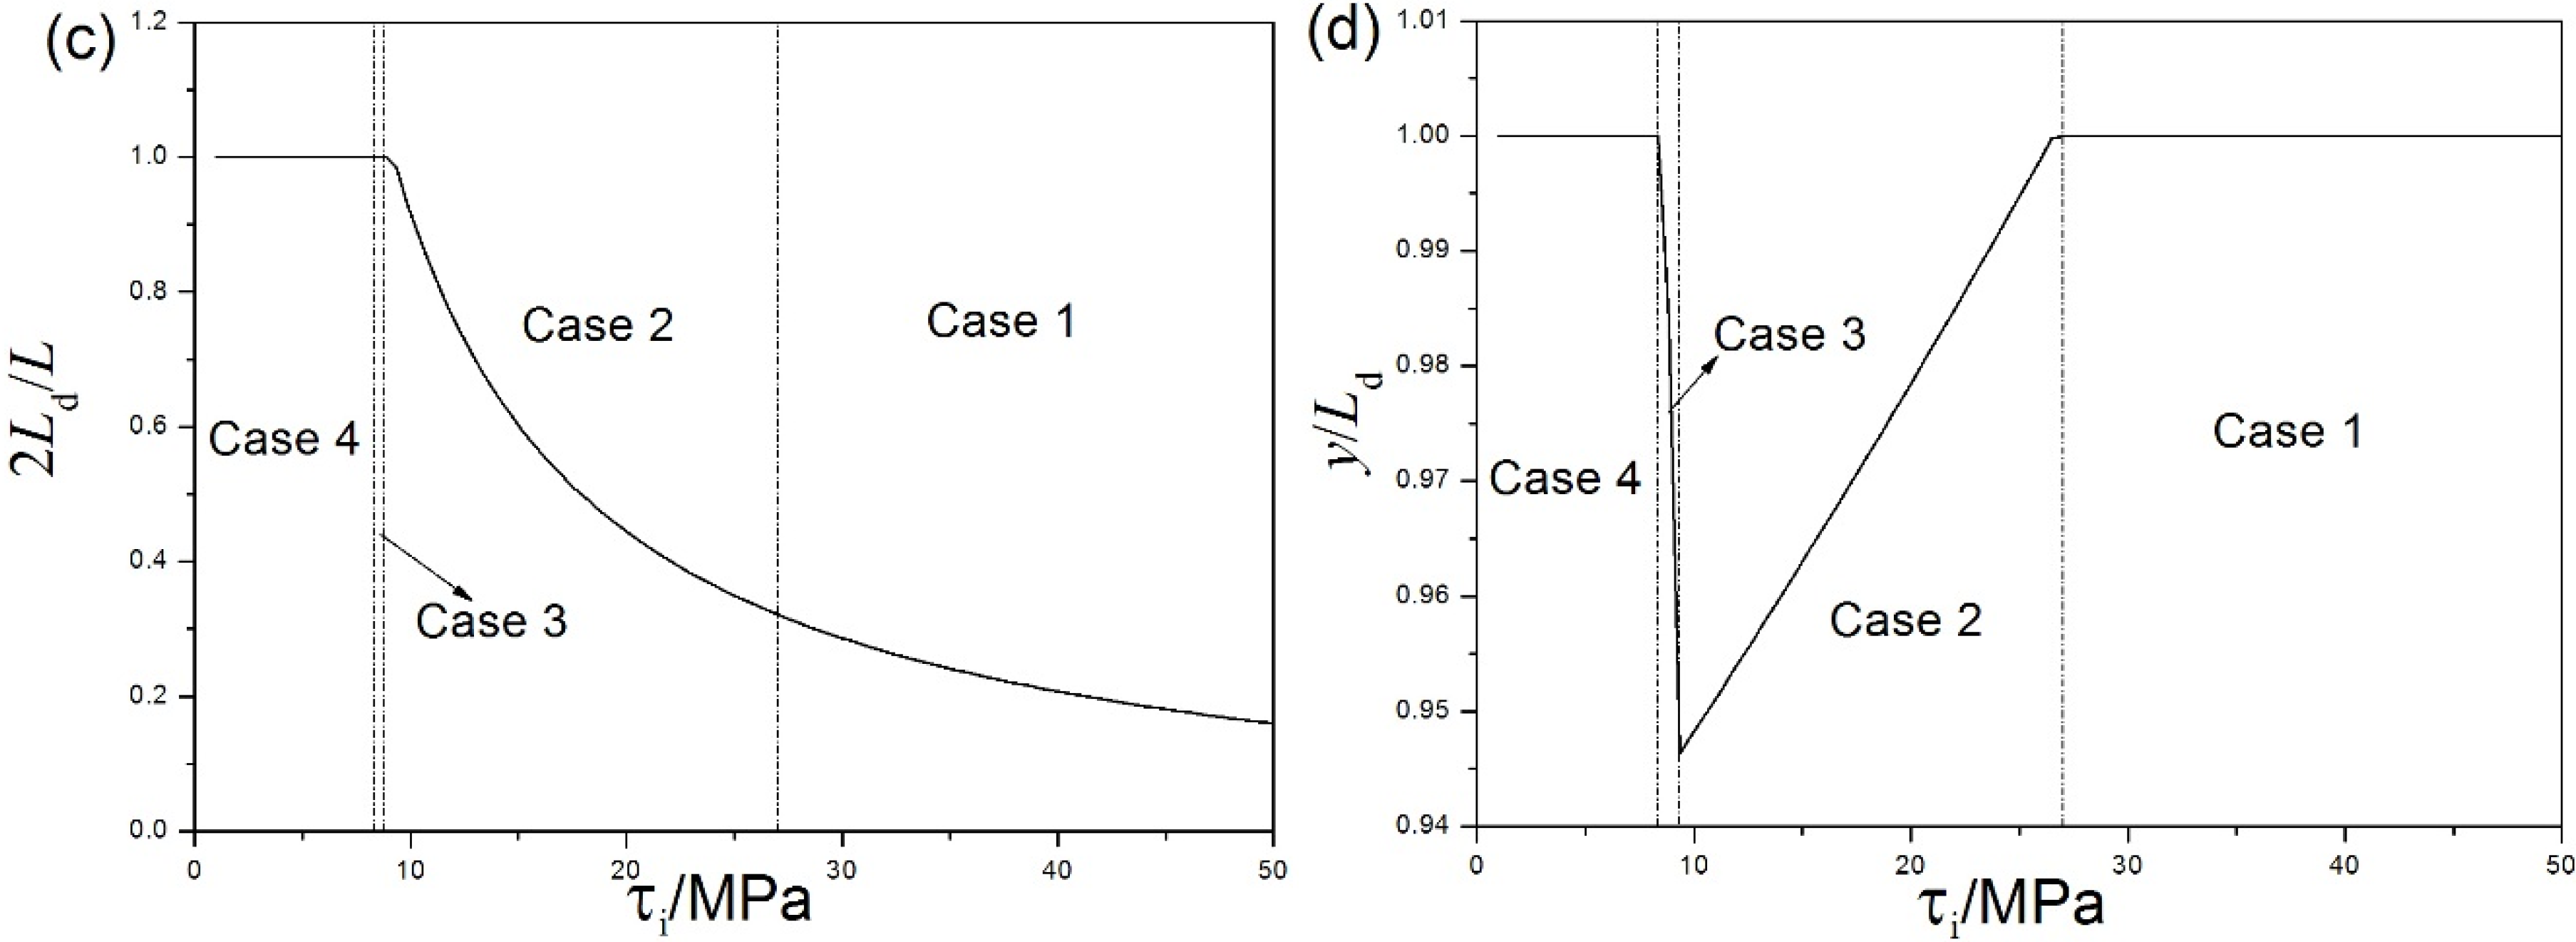
The shape and area of hysteresis loops as a function of interface shear stress are shown in Figure 12. The stress-strain hysteresis loops corresponding to four different interface slip cases as a function of fiber/matrix interface shear stress under σmax = 240MPa are given in Figure 12a, in which the shape and location are different from each other. The hysteresis loss energy as a function of interface shear stress, i.e., τi = 1–50 MPa, is shown in Figure 12b. When τi = 27–50 MPa, i.e., the A–B part in Figure 12b, the hysteresis loss energy increases with the decrease of interface shear stress. The hysteresis loops correspond to interface slip Case 1, i.e., the interface partially debonds, i.e., Ld < L/2 in Figure 12c, and fiber completely slides relative to matrix in the interface debonded region, i.e., y(σmin) = Ld in Figure 12d. When τi = 8.8–27 MPa, i.e., the B‒C part in Figure 12b, the hysteresis loss energy increases with the decrease of interface shear stress. The hysteresis loops correspond to interface slip Case 2, i.e., the interface partially debonds, i.e., Ld < L/2 in Figure 12c, and fiber partially slides relative to matrix in the interface debonded region, i.e., y(σmin) < Ld in Figure 12d. When τi = 8.3–8.8 MPa, i.e., the C‒D part in Figure 12b, the hysteresis loss energy increases with the decrease of interface shear stress. The hysteresis loops correspond to interface slip Case 3, i.e., the interface completely debonds, i.e., Ld = L/2 in Figure 12c, and fiber partially slides relative to matrix in the interface debonded region, i.e., y(σmin) < L/2 in Figure 12d. When τi = 1–8.3 MPa, i.e., the D‒E part in Figure 12b, the hysteresis loss energy increases to the peak value, then decreases with the decrease of interface shear stress. The hysteresis loops correspond to interface slip Case 4, i.e., the interface completely debonds, i.e., Ld = L/2 in Figure 12c, and fiber completely slides relative to matrix in the interface debonded region, i.e., y(σmin) = L/2 in Figure 12d. By comparing experimental hysteresis loss energy with theoretical computational value, the interface shear stress can be estimated for different number of applied cycles.

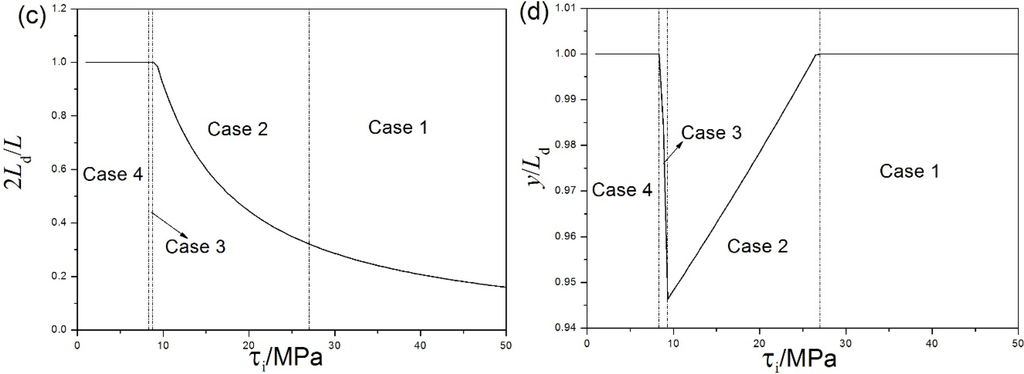
Figure 12.
(a) The stress-strain hysteresis loops of four interface slip cases; (b) the hysteresis loss energy versus interface shear stress; (c) the interface debonded length 2Ld/L versus interface shear stress; and (d) the interface counter slip length y/Ld versus interface shear stress of unidirectional C/SiC composite under σmax = 240 MPa.
4.2. Fatigue Life Prediction Model
Upon first loading to fatigue peak stress, matrix multicracking and interface debonding occur. There exist partial fibers failure in the interface-debonded region and interface-bonded region. Under fatigue loading, fibers fail due to degradation of interface shear stress and fibers strength. When fibers failure probability approaches critical value, the composite would fatigue fail. When fibers begin to break, the loads dropped by broken fibers would be transferred to intact fibers at the cross-section plane. There are two dominant failure criterions presented in the literatures for modeling fibers failure, i.e., the Global Load Sharing criterion (GLS) [15] and Local Load Sharing criterions (LLS) [20]. The two-parameter Weibull model is adopted to describe fibers strength distribution, and the GLS assumption is used to determine the load carried by intact and fracture fibers [15].
where <Tb> denotes the load carried by broken fibers; and P(T) denotes the fibers failure probability.
where mf denotes the fiber Weibull modulus; and σc denotes the fiber characteristic strength of a length δc of fiber [15].
where lo is the reference length; σo is the fiber reference strength of a length of lo of fiber; and σo(N) is the fiber strength during the Nth cycle. Lee and Stinchcomb [21] found that fibers strength degraded with the increase of applied cycles.
where p1 and p2 are empirical parameters.
Evans et al. [13] developed the interface shear stress degradation model.
where τi(N) is the fiber/matrix interface shear stress of Nth cycle; τio is the initial interface shear stress; τimin is the steady-state interface shear stress; N is the cycle number; and ω and λ are empirical parameters.
When fibers fracture, fiber stress drops to zero at the break point, and the stress in the fiber builds up through interface shear stress.
The slip length lf required to build the fiber stress up to its previous intact value is given by Equation (8).
The probability distribution f(x) of the distance x of a fiber break from reference matrix crack plane, provided that a break occurs within a distance ±lf, is [22]
Using Equations (7)–(9), the average stress carried by broken fibers is
Substituting Equation (10) into Equation (2), it leads to the form of
Using Equations (5), (6) and (11), the stress T carried by intact fibers at the matrix crack plane can be determined for different peak stresses. Substituting Equations (5) and (6) and the intact fiber stress T into Equation (3), the fibers failure probability for different number of applied cycles can be determined. When fibers failure probability approaches the critical value q*, the composite would fatigue fail [15].
5. Experimental Comparisons
5.1. Room Temperature
When σmax = 240 MPa, the stress-strain hysteresis loops corresponding to the 1st, 10th, 100th, 1000th, 10,000th, 100,000th, 1,000,000th cycles are given in Figure 13a. The hysteresis loss energy as a function of interface shear stress is shown in Figure 13b, in which the experimental hysteresis loss energy of the 1st cycle lies in the right side of the curve. The hysteresis loop of the 1st cycle corresponds to interface slip Case 2, i.e., the interface partially debonds and fiber partially slides relative to matrix in the interface-debonded region upon unloading/reloading. With the increase of number of applied cycles, the interface shear stress degrades due to interface wear. When interface completely debonds, the interface shear stress decreases rapidly due to thermal residual radial tensile stress at the fiber/matrix interface. By comparing experimental hysteresis loss energy with theoretical computational value, the interface shear stress corresponding to different number of applied cycles can be estimated. The predicted interface shear stress of the 1st, 10th, 1000th, 10,000th, 100,000th and 1,000,000th cycles is shown in Table 1, in which the interface shear stress degrades from 8 MPa during the 1st cycle to 0.4 MPa during the 10th cycle.
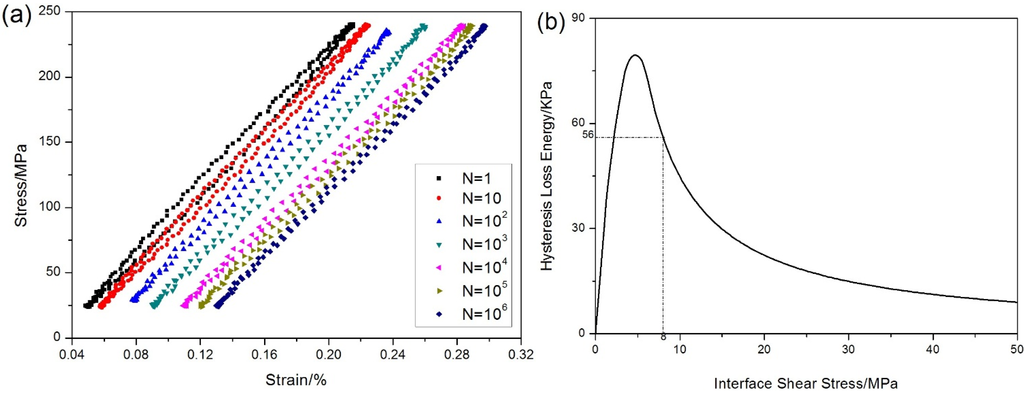
Figure 13.
(a) The hysteresis loops corresponding to different applied cycles; and (b) the hysteresis loss energy as a function of interface shear stress of unidirectional C/SiC composite under fatigue loading at room temperature.
Figure 13.
(a) The hysteresis loops corresponding to different applied cycles; and (b) the hysteresis loss energy as a function of interface shear stress of unidirectional C/SiC composite under fatigue loading at room temperature.
The interface shear stress versus cycle number has been simulated by Evans-Zok-McMeeking model [13], as shown in Figure 14a, in which the model parameters are given by τio = 8MPa, τimin = 0.3MPa, ω = 0.04 and λ = 1.5. The fibers strength degradation curve predicted by Lee-Stinchcomb model [21] is given in Figure 14b, in which the model parameters are given by p1 = 0.01 and p2 = 1.

Table 1.
The fiber/matrix interface shear stress of unidirectional C/SiC composite corresponding to different number of applied cycles under fatigue loading at room temperature.
| Loading cycles | Experimental hysteresis loss energy/KPa | Interface shear stress/MPa |
|---|---|---|
| 1 | 56 ± 3 | 8 ± 0.5 |
| 10 | 12.7 ± 0.5 | 0.40 ± 0.02 |
| 100 | 12.0 ± 0.5 | 0.38 ± 0.02 |
| 10,000 | 10.4 ± 0.5 | 0.35 ± 0.02 |
| 100,000 | 8.8 ± 0.4 | 0.32 ± 0.02 |
| 1,000,000 | 8.0 ± 0.4 | 0.30 ± 0.02 |
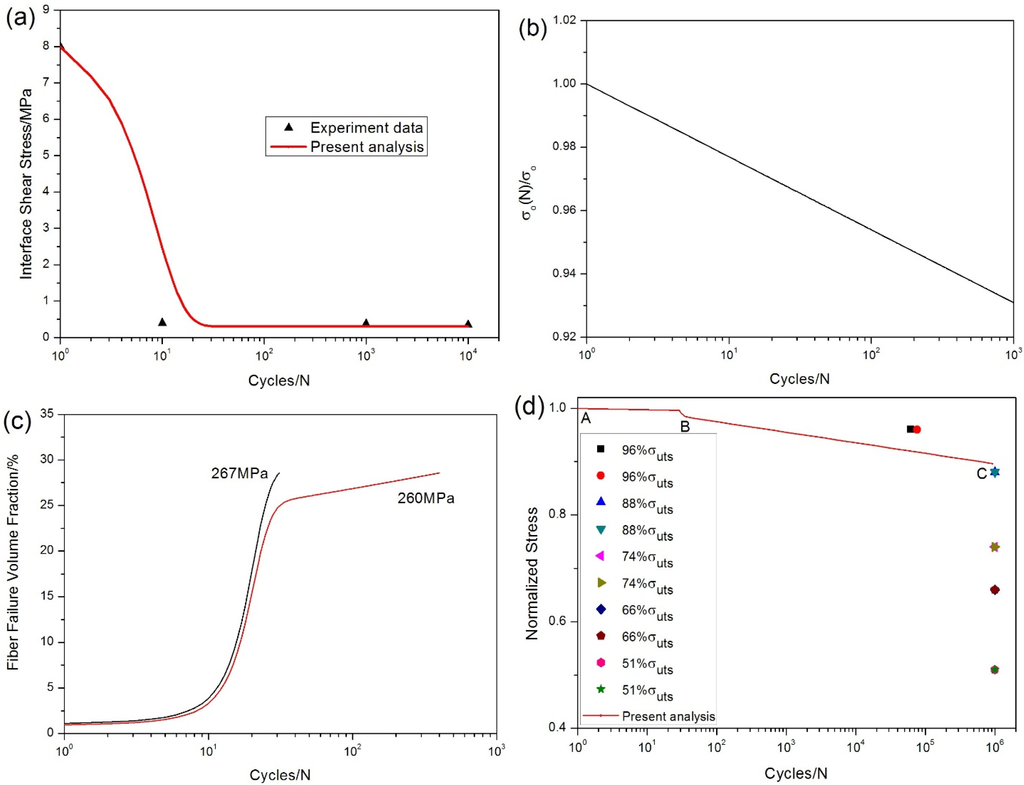
Figure 14.
(a) the interface shear stress versus applied cycles; (b) the fibers strength versus applied cycles; (c) the fibers failure probability versus applied cycles; and (d) the fatigue life S-N curve of experiment data and present analysis for unidirectional C/SiC composite at room temperature.

The fibers failure probability under σmax = 267 and 260 MPa corresponding to different number of applied cycles is illustrated in Figure 14c, in which the fibers failure probability increases with the increase of peak stress, i.e., when σmax = 267 MPa, the specimen fatigue failed after 31 cycles; and when σmax = 260 MPa, the specimen fatigue failed after 400 cycles. The fibers failure probability versus applied cycles curve can be divided into two regions as shown in Figure 14c, i.e., (1) during the first 20 cycles, the fibers failure probability increases rapidly due to degradation of interface shear stress and fibers strength; and (2) when interface shear stress approaches steady-state value, fibers failure is mainly controlled by fibers strength degradation caused by interface wear.
The experimental and predicted fatigue life S-N curves are illustrated in Figure 14d, in which the fatigue limit stress approaches 88% of tensile strength. The predicted fatigue life S-N curve can be divided into two regions as shown in Figure 14d, i.e., (1) the A‒B part is affected by the degradation of interface shear stress and fibers strength; and (2) when interface shear stress approaches steady-state value, the B‒C part is only affected by fibers strength degradation.
5.2. Elevated Temperature
When σmax = 120 MPa, the stress-strain hysteresis loops corresponding to the 1st, 10th, 100th, 1000th, 10,000th, 30,000th, 50,000th, 70,000th and 72,200th cycles are shown in Figure 15a. The theoretical hysteresis loss energy as a function of interface shear stress curve is given in Figure 15b, in which the experimental hysteresis loss energy of the 1st cycle lies in the right side of the curve. The hysteresis loop of the 1st cycle corresponds to interface slip Case 2, i.e., the interface partially debonds and fiber partially slides relative to matrix in the interface-debonded region upon unloading/reloading. With the increase of applied cycles, the interface shear stress degrades due to oxidation of interphase or carbon fibers. When interface completely debonds, the interface shear stress decreases rapidly due to thermal residual radial tensile stress at the fiber/matrix interface. By comparing experimental hysteresis loss energy with theoretical computational value, the interface shear stress can be estimated for different number of applied cycles. The predicted interface shear stress of the 1st, 100th, 10,000th and 72,200th cycles is illustrated in Table 2, in which the interface shear stress degrades from 6.1 MPa during the 1st cycle to 0.3 MPa during the 100th cycle.

Figure 15.
(a) The stress-strain hysteresis loops corresponding to different applied cycles; and (b) the hysteresis loss energy as a function of interface shear stress of unidirectional C/SiC composite when σmax = 120 MPa at 800 °C under air.
Figure 15.
(a) The stress-strain hysteresis loops corresponding to different applied cycles; and (b) the hysteresis loss energy as a function of interface shear stress of unidirectional C/SiC composite when σmax = 120 MPa at 800 °C under air.
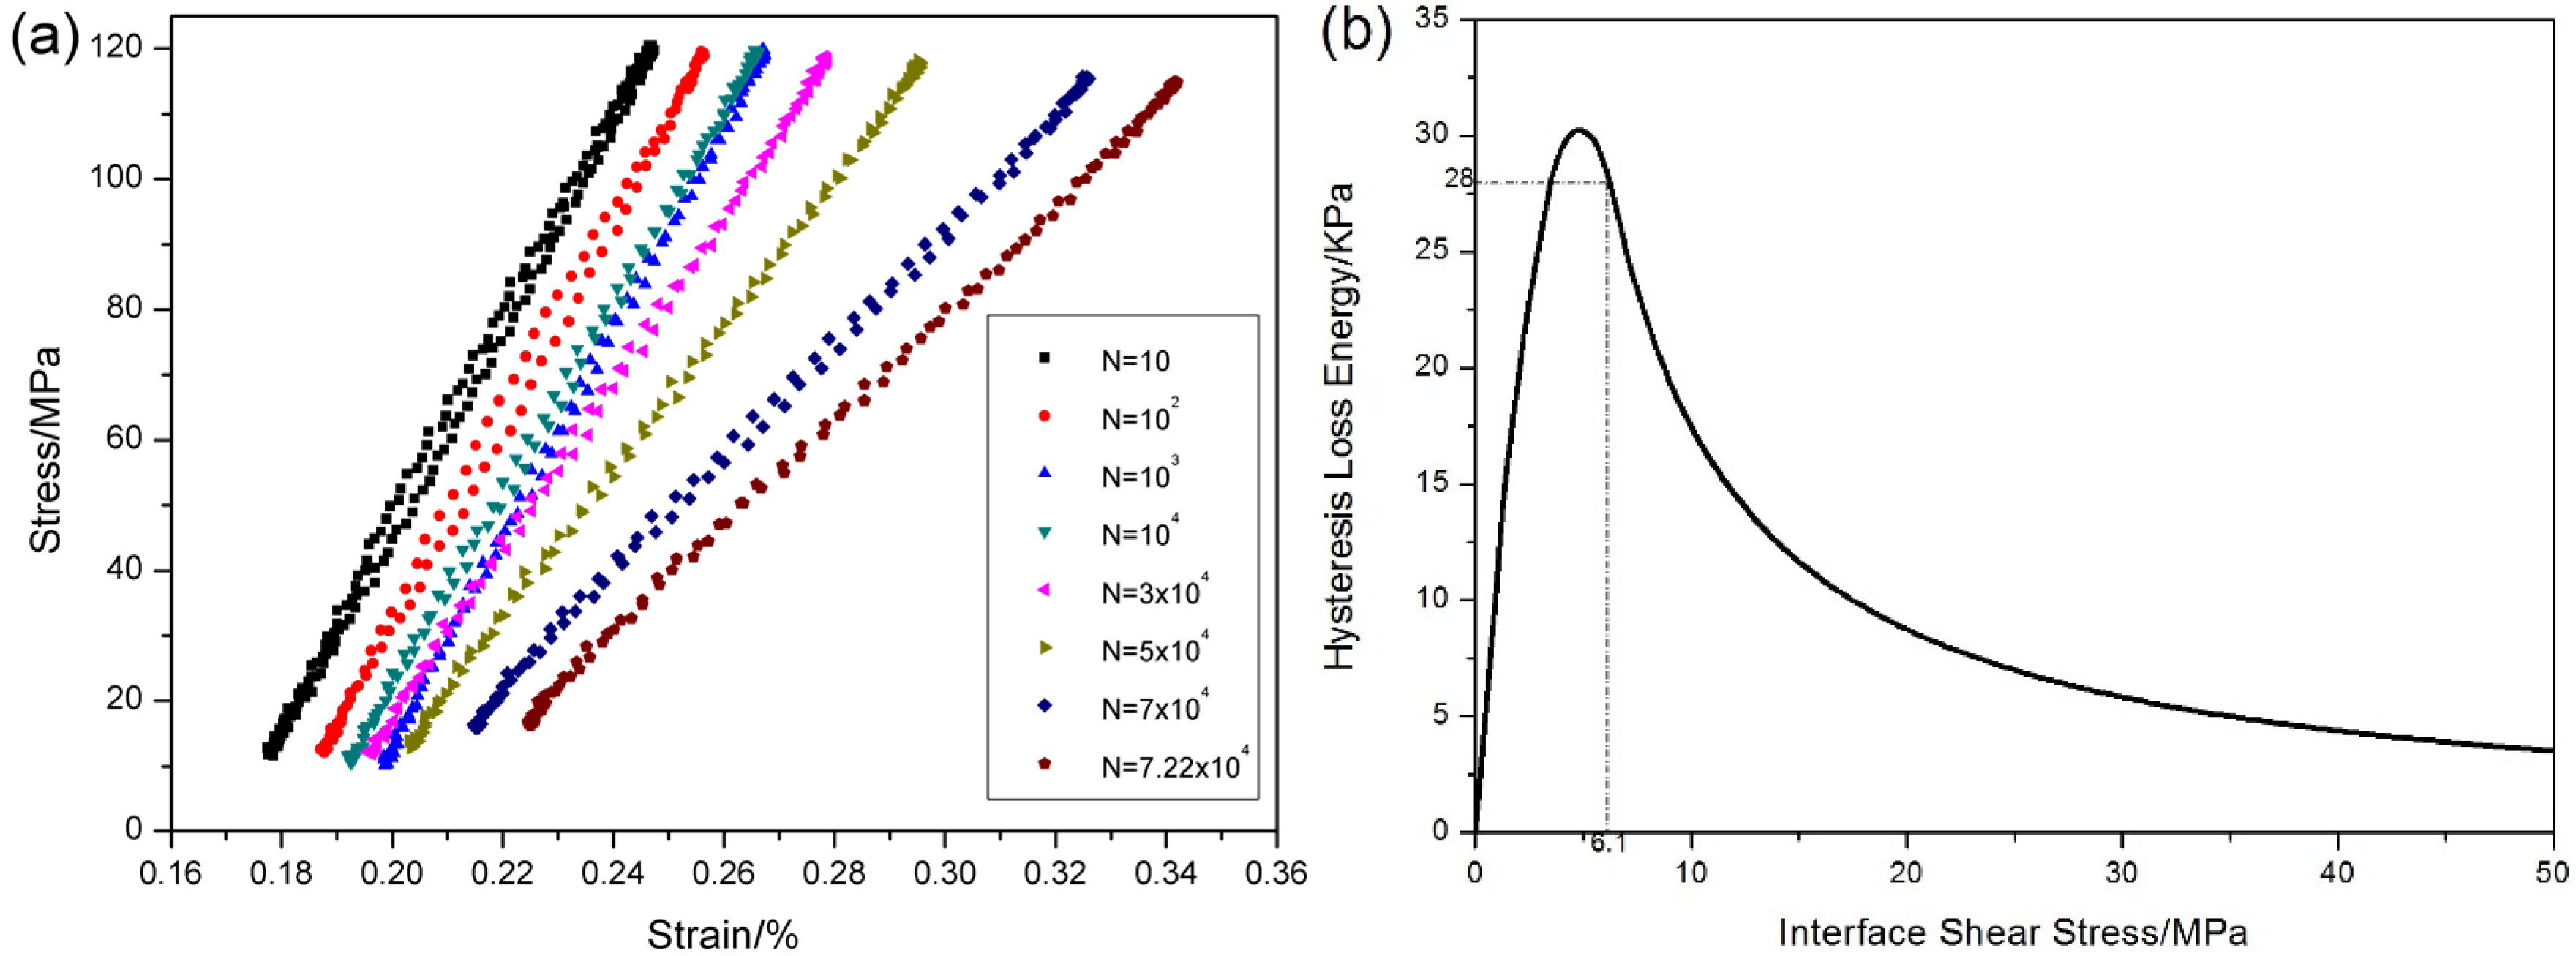
Table 2.
The interface shear stress of unidirectional C/SiC composite corresponding to different applied cycles when σmax = 120 MPa at 800 °C under air.
| Loading cycles | Experimental fatigue hysteresis loss energy/KPa | Interface shear stress/MPa |
|---|---|---|
| 1 | 28 ± 2 | 6.1 ± 0.3 |
| 100 | 2.2 ± 0.5 | 0.30 ± 0.02 |
| 10,000 | 1.4 ± 0.5 | 0.22 ± 0.02 |
| 72,200 | 1.2 ±0.5 | 0.20 ± 0.02 |
The interface shear stress versus applied cycles has been simulated by Evans‒Zok‒McMeeking model [13] as shown in Figure 16a, in which the model parameters are given by τio = 6.1 MPa, τimin = 0.2 MPa, ω = 0.001 and λ = 0.8. The fibers strength degradation curve predicted by Lee-Stinchcomb model [21] is shown in Figure 16b, in which the model parameters are given by p1 = 0.02 and p2 = 1.
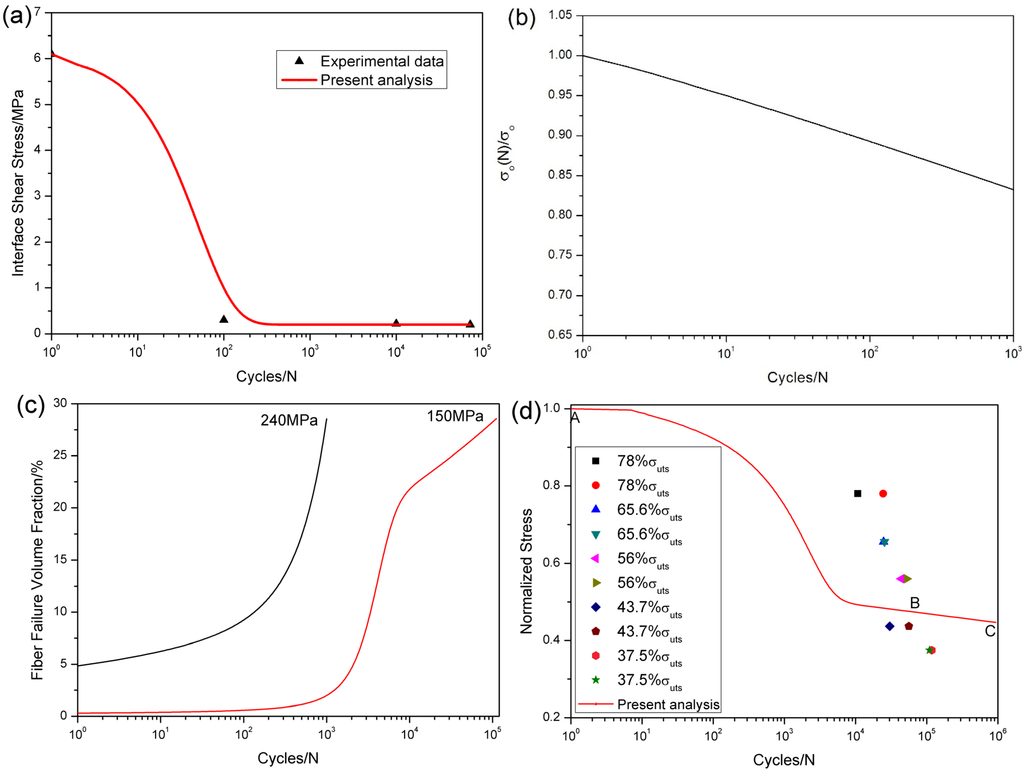
Figure 16.
(a) the interface shear stress versus applied cycles; (b) the fibers strength versus applied cycles; (c) the fibers failure probability versus applied cycles; and (d) the fatigue life S-N curves of experiment data and present analysis for unidirectional C/SiC composite at 800 °C under air.
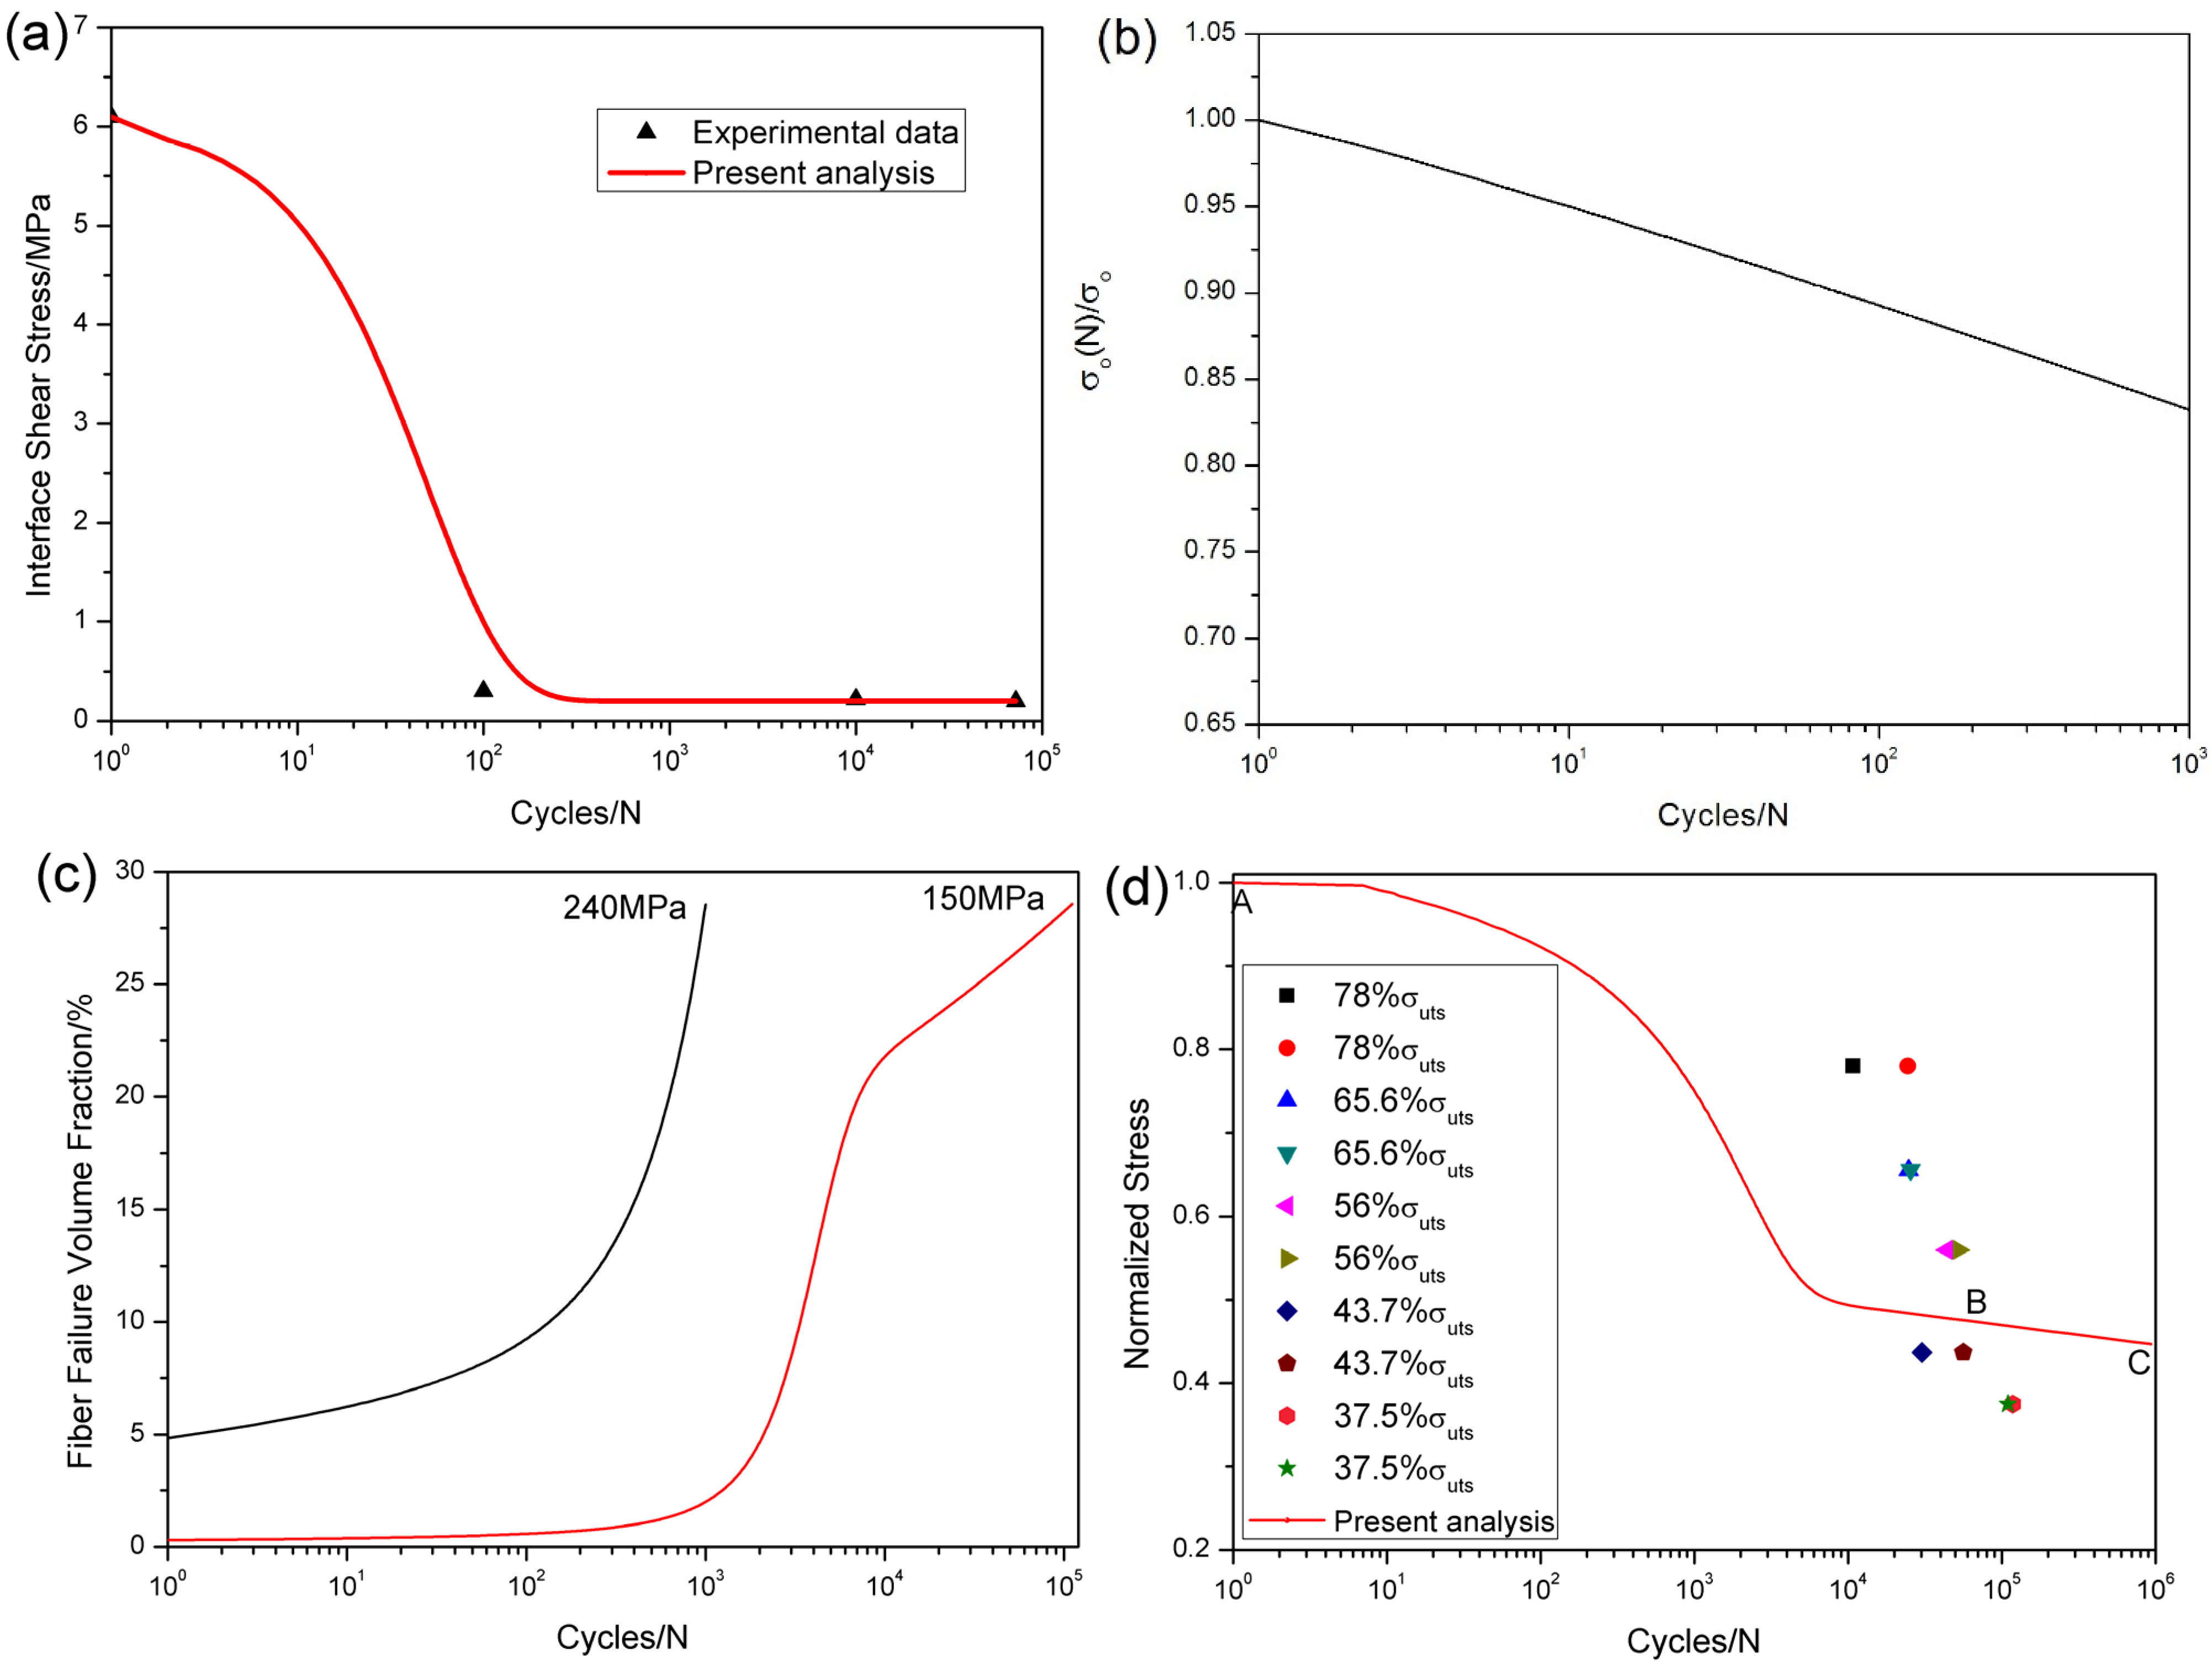
The fibers failure probability corresponding to different number of applied cycles is illustrated in Figure 16c, i.e., when σmax = 240 MPa, the specimen fatigue failed after 999 cycles; and when σmax = 150 MPa, the specimen fatigue failed after 110,962 cycles. The fibers failure probability versus applied cycles curve can be divided into two regions, as shown in Figure 16c, i.e., (1) at the initial stage of fatigue loading, the fibers failure probability increases rapidly due to degradation of interface shear stress and fibers strength; and (2) when interface shear stress approaches steady-state value, fibers failure is mainly controlled by fibers strength degradation by oxidation.
The experimental and predicted fatigue life S-N curves are given in Figure 16d, in which the fatigue life at 800 °C under air is greatly reduced compared with that at room temperature, mainly attributed to oxidation of interphase or carbon fibers. The predicted fatigue life S-N curve can also be divided into two regions, as shown in Figure 16d, i.e., (1) the A‒B part is affected by the degradation of interface shear stress and fibers strength; and (2) the B‒C part is only affected by fibers strength degradation.
6. Conclusions
The tension-tension fatigue behavior of unidirectional C/SiC composite at room temperature and 800 °C under air has been investigated.
- (1)
- The hysteresis modulus decreases rapidly at the initial stage of fatigue loading due to matrix multicracking and interface debonding. When matrix cracks approach saturation, the decrease of hysteresis modulus would be mainly attributed to interface wear. However, at 800 °C in air, the hysteresis modulus decreases rapidly compared with that at room temperature, due to oxidation of interphase and carbon fibers.
- (2)
- At room temperature, the hysteresis loss energy degrades from 56 KPa during the 1st cycle to 8 KPa during the 1,000,000th cycle; and the interface shear stress degrades from 8 MPa to 0.4 MPa during the first 10 cycles under σmax = 240 MPa; at 800 °C in air, the hysteresis loss energy degrades from 28 KPa during the 1st cycle to 1.22 KPa during the 72,200th cycle; and the interface shear stress degrades from 6.1 MPa to 0.3 MPa during the first 100 cycles under σmax = 120 MPa.
- (3)
- The fatigue limit stress at room temperature was approximately 88% of tensile strength. However, there were no apparent fatigue limit stress at 800 °C in air due to oxidation of interphase or carbon fibers. The fatigue failure specimens were observed under optical microscope. The pullout fibers at 800 °C in air exhibit serious oxidation. At elevated temperature, the degradation of fibers strength due to oxidation of carbon fibers leads to the life being greatly reduced compared with that at room temperature.
- (4)
- The tension-tension fatigue life S-N curves at room temperature and 800 °C under air have been predicted. The predicted fatigue life S-N curve can be divided into two regions, i.e., the first part is affected by the degradation of interface shear stress and fibers strength; and the second part is only affected by fibers strength degradation.
Acknowledgments
This work is sponsored by the Natural Science Foundation of Jiangsu Province (Grant No. BK20140813). The author also wishes to thank two anonymous reviewers and editors for their helpful comments on an earlier version of the paper.
Conflicts of Interest
The author declares no conflict of interest.
Nomenclature
| σmax | fatigue peak stress; |
| σmin | fatigue valley stress; |
| L | matrix crack spacing; |
| Ld | fiber/matrix interface debonded length; |
| y | unloading interface counter slip length; |
| z | reloading interface new slip length; |
| τi | fiber/matrix interface shear stress; |
| Vf | fiber volume fraction; |
| T | load carried by intact fibers; |
| <Tb> | load carried by broken fibers; |
| P(T) | fibers failure probability; |
| mf | fiber Weibull modulus; |
| σc | fiber characteristic strength; |
| rf | fiber radius; |
| τio | initial fiber/matrix interface shear stress; |
| τimin | final steady-state fiber/matrix interface shear stress. |
References
- Naslain, R. Design, preparation and properties of non-oxide CMCs for application in engines and nuclear reactors: An overview. Compos. Sci. Technol. 2004, 64, 155–170. [Google Scholar] [CrossRef]
- Santhosh, U.; Ahmad, J.; John, R.; Ojard, G.; Miller, R.; Gowayed, Y. Modeling of stress concentration in ceramic matrix composites. Compos. Part B Eng. 2013, 45, 1156–1163. [Google Scholar] [CrossRef]
- Murthy-Pappu, L.N.; Nemeth, N.N.; Brewer, D.N.; Mital, S. Probabilistic analysis of a SiC/SiC ceramic matrix composite turbine vane. Compos. Part B Eng. 2008, 39, 694–703. [Google Scholar] [CrossRef]
- Aveston, J.; Cooper, G.A.; Kelly, A. Single and multiple fracture properties of fiber composites. In Properties of Fiber Composites; IPC Science and Technology Press: Guildford, UK, 1971; pp. 15–26. [Google Scholar]
- Ahn, B.K.; Curtin, W.A. Strain and hysteresis by stochastic matrix cracking in ceramic matrix composites. J. Mech. Phys. Solids 1997, 45, 177–209. [Google Scholar] [CrossRef]
- Ruggles-Wrenn, M.B.; Jones, T.P. Tension-compression fatigue of a SiC/SiC ceramic matrix composite at 1200 °C. Int. J. Fatigue 2013, 47, 154–160. [Google Scholar] [CrossRef]
- Rouby, D.; Reynaud, P. Fatigue behavior related to interface modification during load cycling in ceramic-matrix fiber composites. Comps. Sci. Technol. 1993, 48, 109–118. [Google Scholar] [CrossRef]
- Reynaud, P. Cyclic fatigue of ceramic-matrix composites at ambient and elevated temperatures. Compos. Sci. Technol. 1996, 56, 809–814. [Google Scholar] [CrossRef]
- Holmes, J.W.; Cho, C.D. Experimental observation of frictional heating in fiber-reinforced ceramics. J. Am. Ceram. Soc. 1992, 75, 929–938. [Google Scholar] [CrossRef]
- Cho, C.D.; Holmes, J.W.; Barber, J.R. Estimate of interfacial shear in ceramic composites from frictional heating measurements. J. Am. Ceram. Soc. 1991, 74, 2802–2808. [Google Scholar] [CrossRef]
- Solti, J.P.; Robertson, D.D.; Mall, S. Estimation of interfacial properties from hysteretic energy loss in unidirectional ceramix matrix composites. Adv. Compos. Mater. 2000, 9, 161–173. [Google Scholar] [CrossRef]
- Curtin, W.A. Stress-strain behavior of brittle matrix composites. Compr. Compos. Mater. 2000, 4, 47–76. [Google Scholar]
- Evans, A.G.; Zok, F.W.; McMeeking, R.M. Fatigue of ceramic matrix composites. Acta Metall. Mater. 1995, 43, 859–875. [Google Scholar] [CrossRef]
- Zhu, S.; Mizuno, M.; Kagawa, Y.; Mutoh, Y. Monotonic tension, fatigue and creep behavior of SiC-fiber-reinforced SiC-matrix composites: A review. Compos. Sci. Technol. 1999, 59, 833–851. [Google Scholar] [CrossRef]
- Curtin, W.A. Theory of mechanical properties of ceramic-matrix composites. J. Am. Ceram. Soc. 1991, 74, 2837–2845. [Google Scholar] [CrossRef]
- Saleem, M.; Toubal, L.; Zitoune, R.; Bougherara, H. Investigating the effect of machining processes on the mechanical behavior of composite plates with circular holes. Compos. Part A 2013, 55, 169–177. [Google Scholar] [CrossRef]
- Haddad, M.; Zitoune, R.; Bougherara, H.; Eyma, F.; Castanie, B. Study of trimming damages of CFRP structures in function of the machining processes and their impact on the mechanical behavior. Compos. Part B Eng. 2014, 57, 136–143. [Google Scholar] [CrossRef]
- Shuler, S.F.; Holmes, J.W.; Wu, X.; Roach, D. Influence of loading frequency on the room-temperature fatigue of a carbon-fiber/SiC matrix composite. J. Am. Ceram. Soc. 1993, 76, 2327–2336. [Google Scholar] [CrossRef]
- Staehler, J.M.; Mall, S.; Zawada, L.P. Frequency dependence of high-cycle fatigue behavior of CVI C/SiC at room temperature. Compos. Sci. Technol. 2003, 63, 2121–2131. [Google Scholar] [CrossRef]
- Xia, Z.; Curtin, W.A. Toughness-to-brittle transitions in ceramic-matrix composites with increasing interfacial shear stress. Acta Mater. 2000, 48, 4879–4892. [Google Scholar] [CrossRef]
- Lee, S.S.; Stinchcomb, W.W. Damage mechanisms of cross-ply Nicalon/CAS-II laminate under cyclic tension. Ceram. Eng. Sci. Proc. 1994, 15, 40–48. [Google Scholar]
- Phoenix, S.L.; Raj, R. Scalings in Fracture Probabilities for a Brittle Matrix Fiber Composite. Acta Metall. Mater. 1992, 40, 2813–2828. [Google Scholar] [CrossRef]
© 2015 by the author; licensee MDPI, Basel, Switzerland. This article is an open access article distributed under the terms and conditions of the Creative Commons Attribution license (http://creativecommons.org/licenses/by/4.0/).