4.1. Stress Process and Mode of Damage
Due to the fact that the experimental process and mode of damage for CEW and CIW specimens were similar, Specimen E-1 was selected as a typical example in the discussion below.
(1) Preloading stage: during the 1st cycle, the specimen was loaded to 30.33 kN and 29.86 kN in the positive and negative direction, respectively. No obvious observation could be made and related instruments worked normally. The smooth process of preloading suggested that the experiment can be formally started [
24,
25].
(2) Initial cracking stage: during the 2nd cycle, the specimen was loaded to 50.11 kN and 50.35 kN in the positive and negative direction, respectively. Six micro-cracks in the direction of about 30° appeared at the bottom part at the front and the longest crack had a length of 370.00 mm. A horizontal micro-crack with a length of 300.00 mm appeared at the bottom part at the back of the specimen. It was suggested that during the initial cracking stage of the specimen, the cracks appeared firstly at the bottom part of the wall where the shear force was the largest.
(3) Cracking stage: during the 3rd cycle, the specimen was loaded to 100.51 kN and 102.96 kN in the positive and negative direction, respectively. Two diagonal 45° cracks appeared at the middle and bottom parts in the front and one bending and shear crack with a length of 180.00 mm appeared at the middle part which penetrated to the side of the specimen. During the 4th cycle, the specimen was loaded to 154.36 kN and 152.26 kN in the positive and negative direction, respectively. Four parallel 45° diagonal cracks with a length of 130.00 mm appeared at the middle part in the front and the cracks at the bottom part at the back widened with the appearance of new cracks. During the 5th cycle, the specimen was loaded to 200.49 kN and 200.79 kN in the positive and negative direction, respectively. Multiple 45° or 135° diagonal cracks which penetrated with each other appeared in the front and the primary diagonal cracks were basically formed. It was suggested that from the 3rd cycle to the 5th cycle, the number of cracks in the front and back increased and the cracks developed and connected with each other. Minor spalling of gypsum boards was witnessed.
(4) Yielding stage: during the 6th cycle, the specimen was loaded to 219.95 kN and 220.12 kN in the positive and negative direction, respectively. The general shape of primary diagonal cracks in the front were formed. At this moment, the specimen entered plastic stage and thus displacement-controlled loading was adapted. During the 7th cycle, the specimen was loaded to 4.11 mm and 4.05 mm in the positive and negative direction, respectively, and the width of cracks in the front and back continued to increase. During the 8th cycle, the specimen was loaded to 8.00 mm and 8.10 mm in the positive and negative direction, respectively. The 45° primary diagonal cracks in the front were widened and extended, and multiple primary diagonal cracks penetrating the entire wall surface were formed. During the 9th cycle, the specimen was loaded to 12.10 mm and 12.00 mm in the positive and negative direction, respectively. A part of the gypsum boards peeled off at the primary diagonal cracks. During the 10th cycle, the specimen was loaded to 16.10 mm and 16.20 mm in the positive and negative direction, respectively. A large part of the gypsum boards in the front were peeled off and thick 45° primary diagonal cracks were witnessed on the exposed concrete surface. It was suggested that from the 6th cycle to the 10th cycle, the specimen entered yielding stage and diagonal cracks in the front connected into honeycomb cracks. The amount of cracks did not increase dramatically but the length and width increased significantly. A large part of gypsum boards spalled at the joint of cracks. Both horizontal and vertical cracks were witnessed at the back.
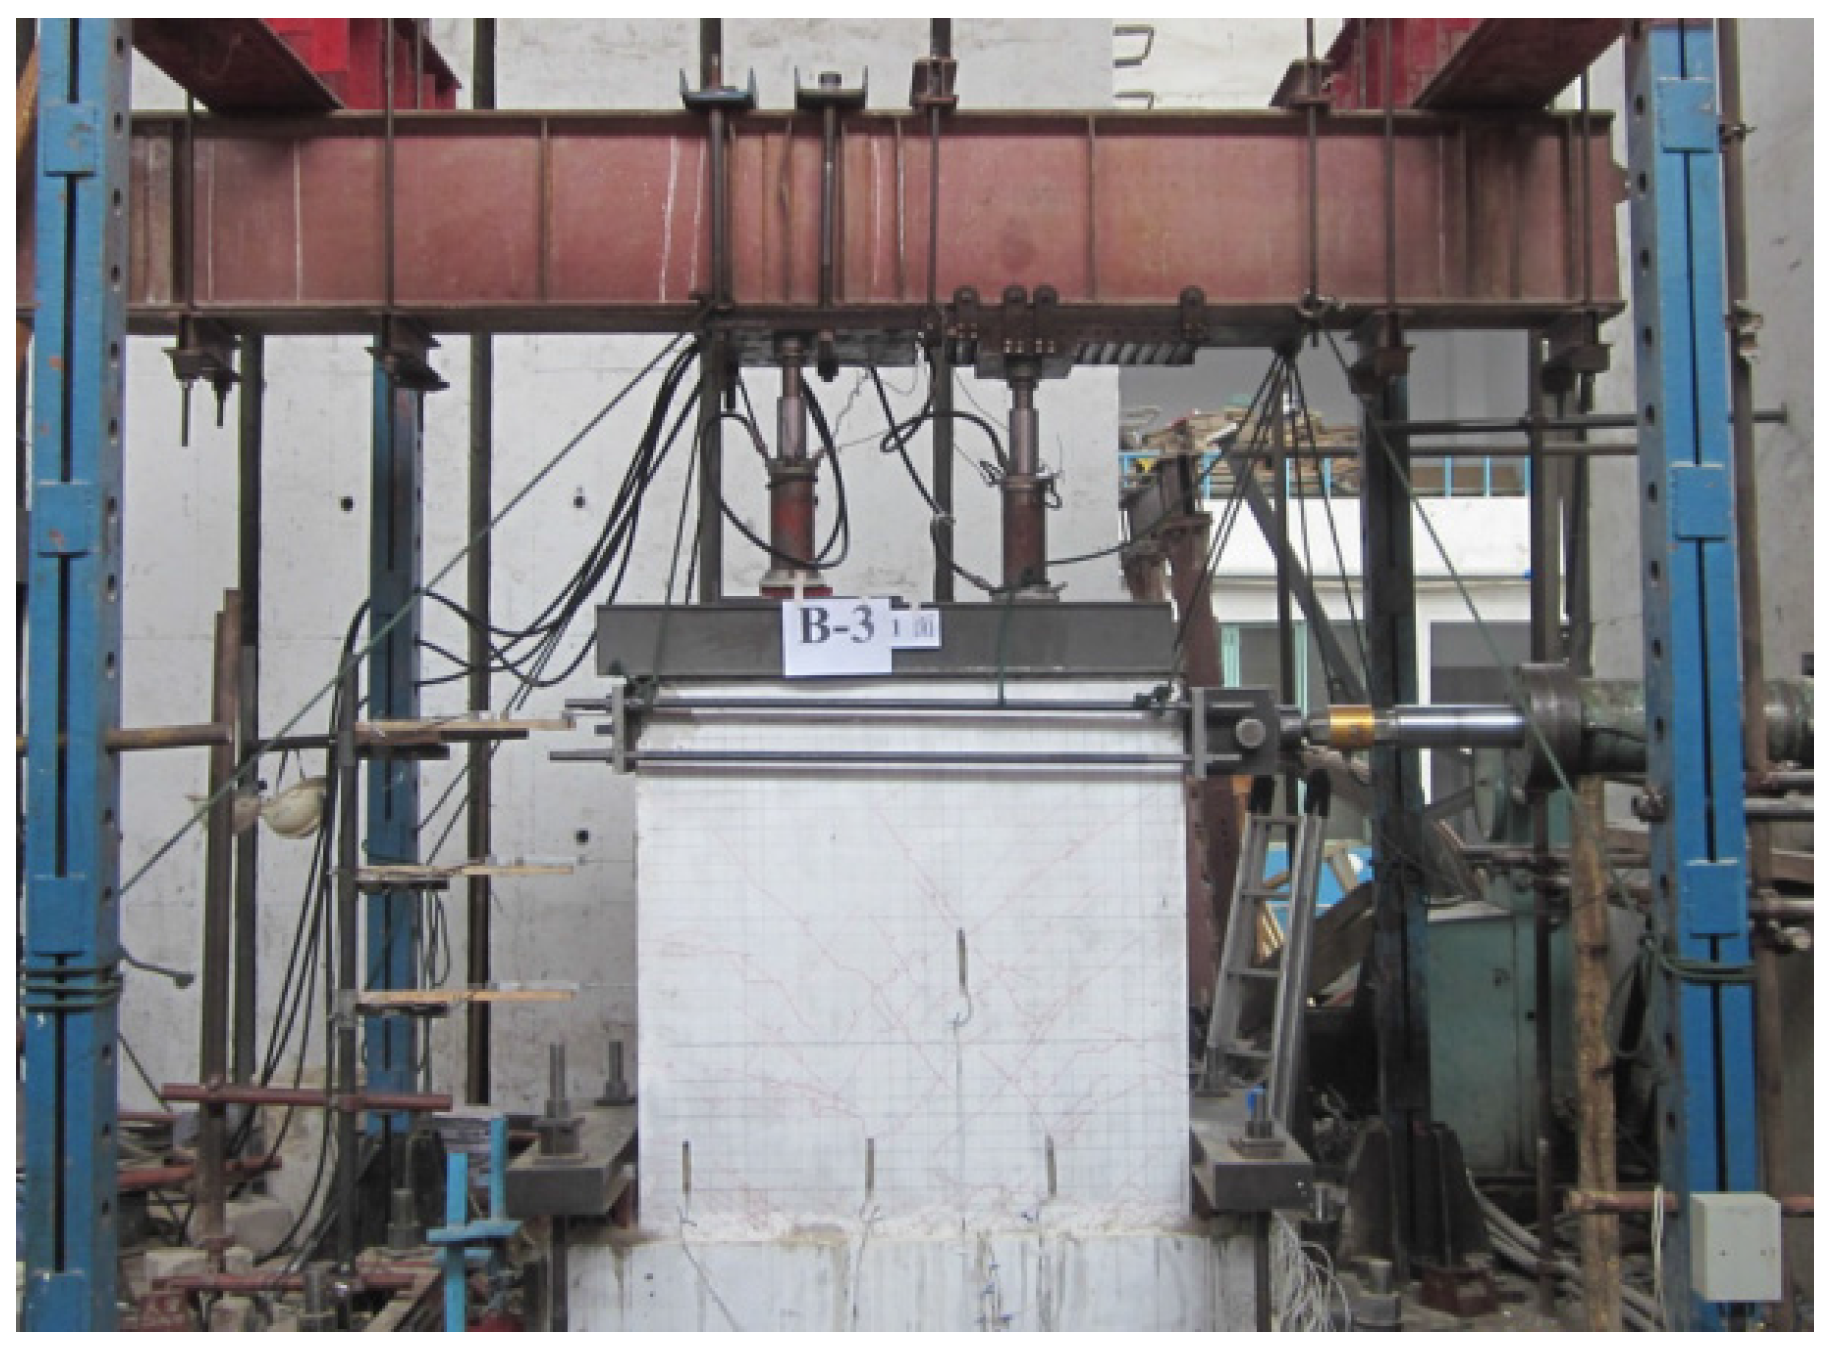
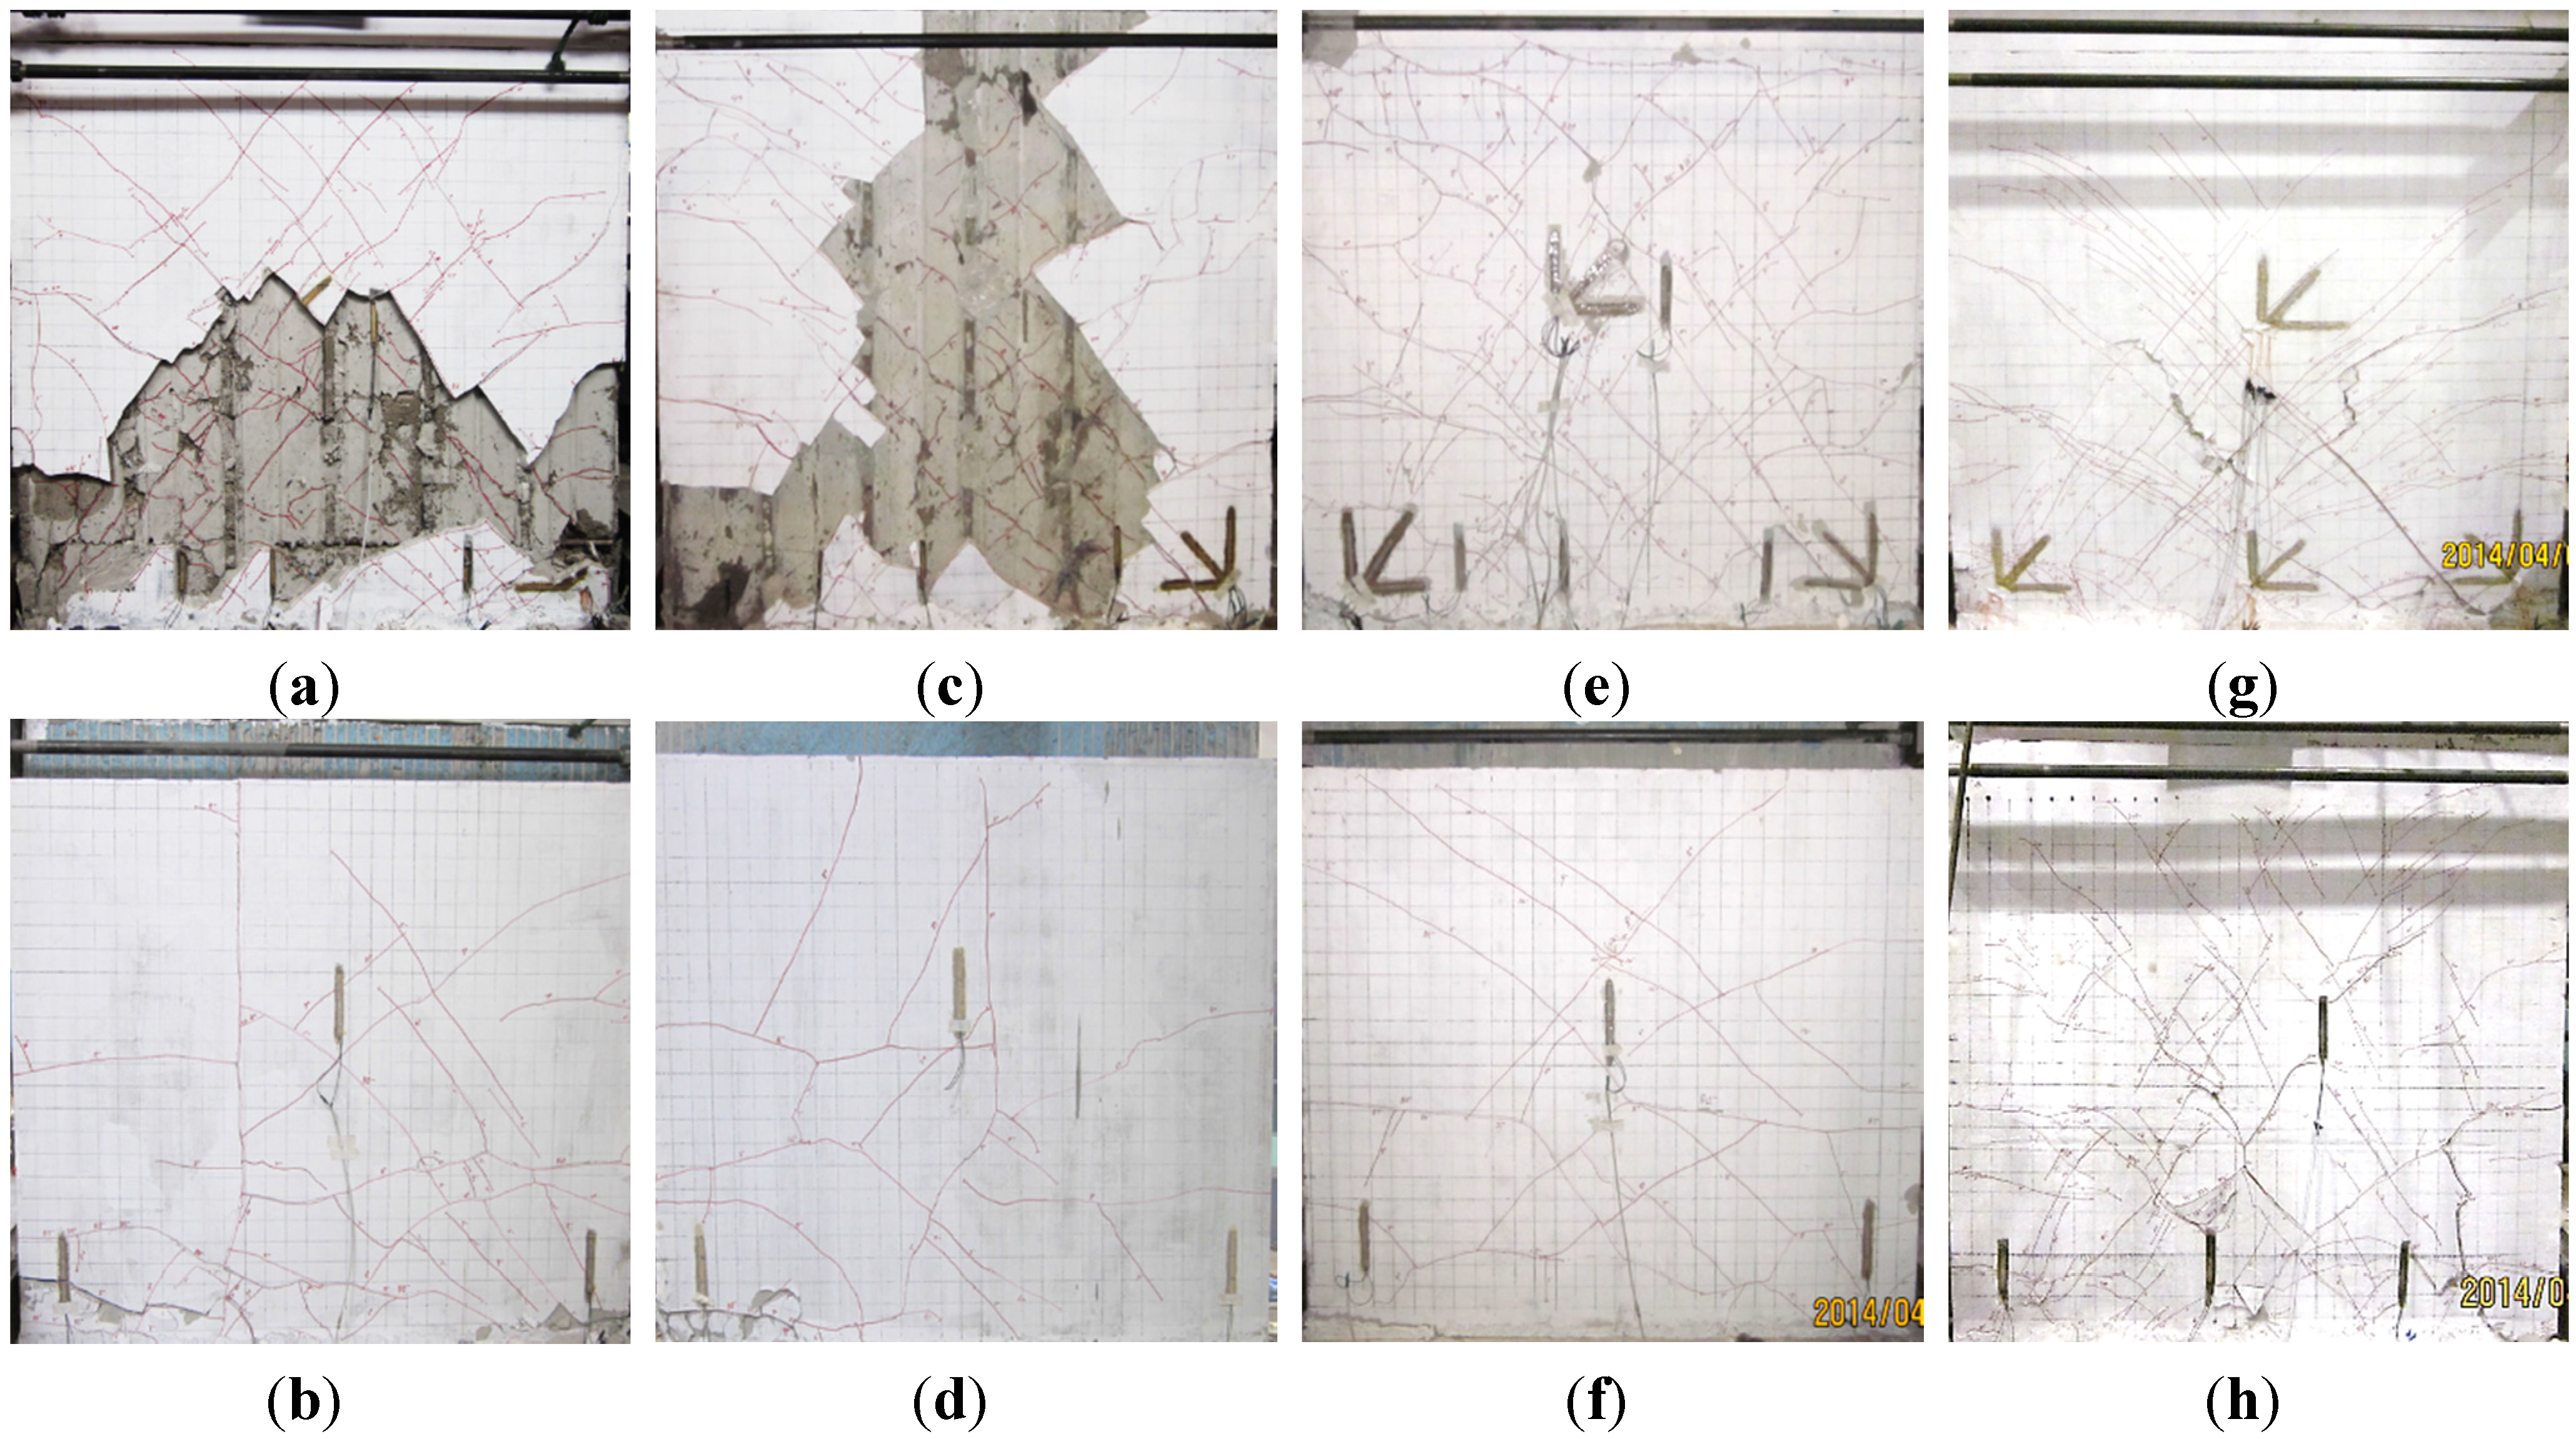
(5) Damage stage: during the 11th cycle, the specimen was loaded to 21.40 mm and 20.10 mm in the positive and negative direction, respectively. The gypsum boards in the front peeled off severely, the concrete at the bottom right part was crushed and the reinforcement was bent. The cracks at the bottom part at the back were widened. During the 12th cycle, the specimen was loaded to 20.00 mm in the positive direction. The displacement increased dramatically then dropped quickly and the specimen failed. It was suggested that shear damage was the dominant damage mode for the specimen and the concrete at both sides was crushed. When the specimen failed, a large part of gypsum board in the front spalled (
Figure 9a,c) or thick honeycomb cracks appeared (
Figure 9e), together with peeling and hollowing. Obvious diagonal, horizontal and vertical cracks were witnessed at the back as shown in
Figure 9b,d and f. The diagonal cracks were caused by shear force carried by the insulation board and externally bonded single gypsum board and the horizontal and vertical cracks were probably due to torsion as a result of eccentric force sustained by non-load-carrying insulation board and externally bonded single gypsum board.
The observation during cracking, yielding and damage stages for CIW specimens were similar with CEW specimens with only difference in values. Take Specimen I-2 as an example. The crack load was 60.11 kN, yield load was 206.40 kN and damage load was 249.43 kN. The failure mode was similar with the front face of CEW specimens. Only the pictures at failure for Specimen I-2 are given in this study, as shown in
Figure 9g,h.
4.2. Hysteresis Loop of Horizontal Force-Top Displacement
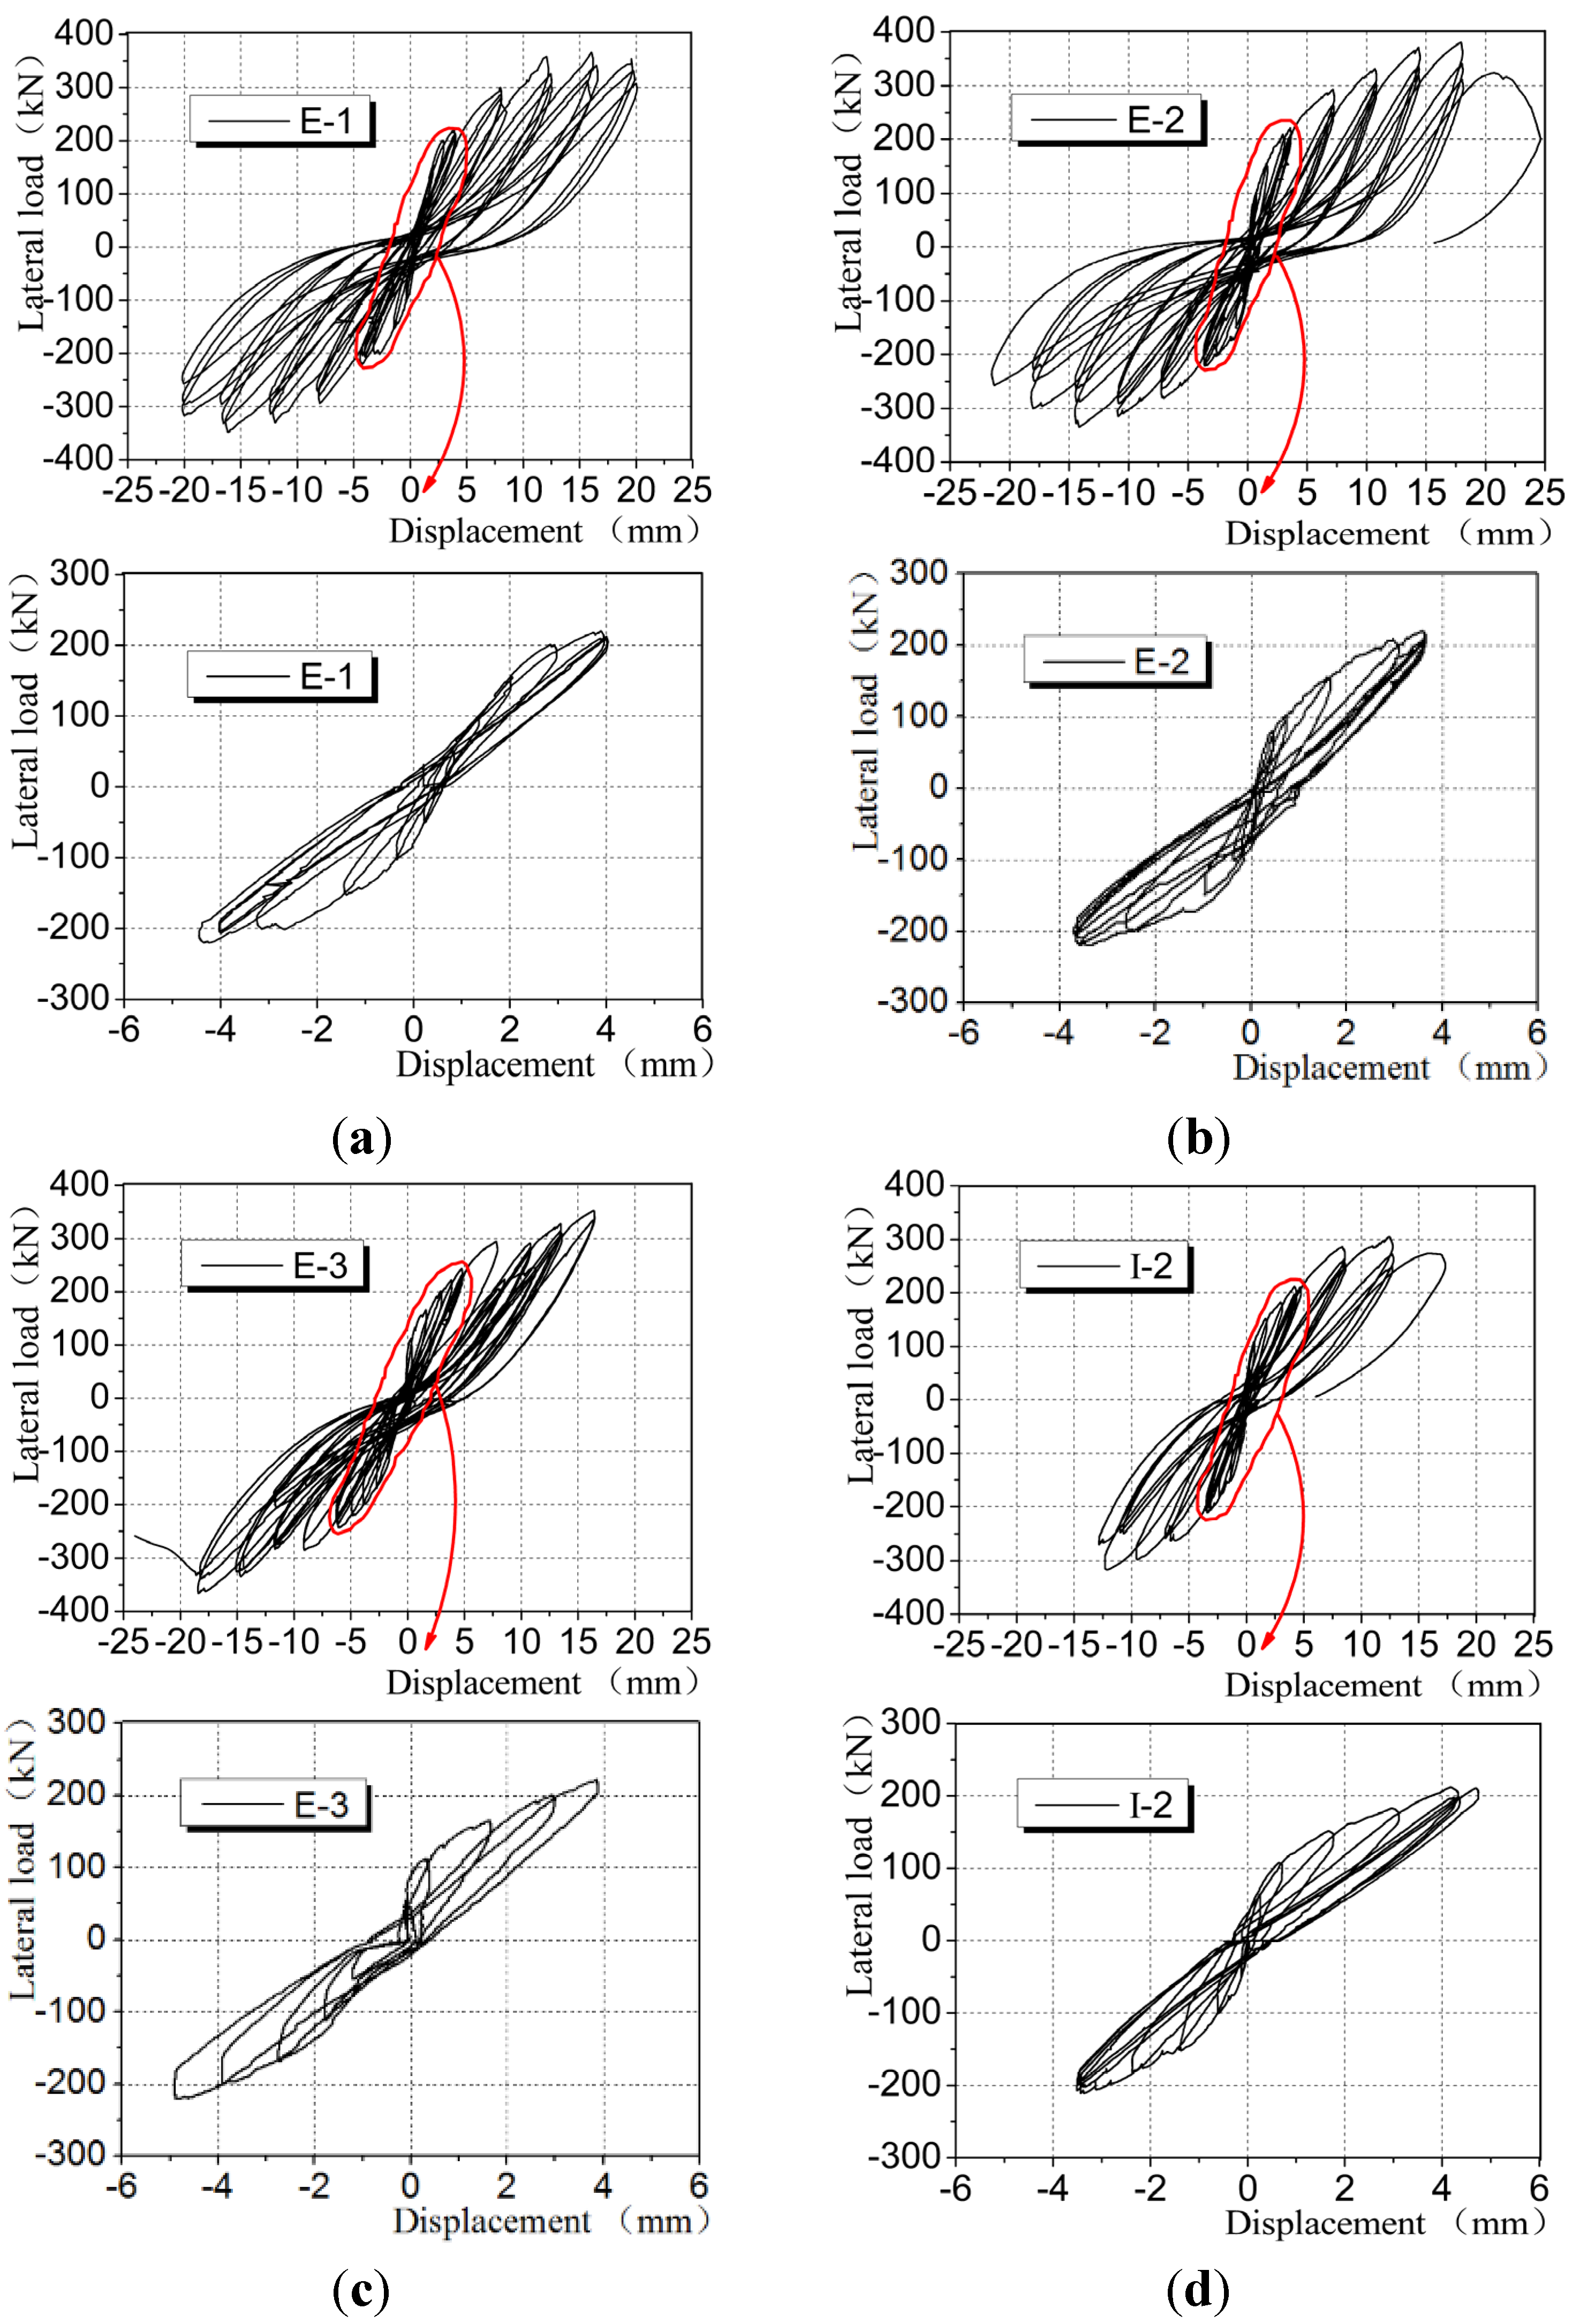
Figure 10 shows the hysteresis loop of horizontal force-top displacement for CEW and CIW specimens, in which typical CIW specimen I-2 was selected as comparative specimen.
It is evident that during the entire process of loading, the shape of hysteresis loops for both types of specimen experienced two stages but stable hysteretic characteristics were witnessed. For the first stage, during the initial loading period, the hysteresis loops for all CEW and CIW specimens were spindle-shaped (as shown in the local magnified diagram in
Figure 10. At this moment, the effective area enclosed by the hysteresis loop was small and the variation of stiffness was small. For the second stage, with the increase of horizontal load, ongoing cumulative damage occurred in the specimen which led to stiffness degradation. The variation of shape of hysteresis loops was evident and they shifted to “S” shape. At this moment, the effective area enclosed by the hysteresis loop increased obviously. Residual deformation of specimens was witnessed and stiffness degradation was evident.
Figure 9.
Failure of specimen. (a) E-1 (Front); (b) E-1(Back); (c) E-2 (Front); (d) E-2 (Back); (e) E-3(Front); (f) E-3 (Back); (g) I-2 (Front); (h) I-2 (Back).
Figure 9.
Failure of specimen. (a) E-1 (Front); (b) E-1(Back); (c) E-2 (Front); (d) E-2 (Back); (e) E-3(Front); (f) E-3 (Back); (g) I-2 (Front); (h) I-2 (Back).
Figure 10.
Hysteretic curves for CEW/CIW. (a) E-1; (b) E-2; (c) E-3; (d) I-2.
Figure 10.
Hysteretic curves for CEW/CIW. (a) E-1; (b) E-2; (c) E-3; (d) I-2.
Comparative analysis of the hysteresis loops for CEW and CIW specimens showed that: for both types of wallboard, when unloaded to 0 during each load step, the hysteresis loops did not pass through the origin, which suggests that residual deformation occurred. Judging from the effective area surrounded by the hysteresis loops, those of CEW were larger than CIW specimens which indicates that the capacity of energy dissipation for CEW outperformed CIW. During the three cycles of the last few load steps, the reduction of maximum load corresponding to the hysteresis loops of CEW specimens was more significant than CIW, which suggests that the ductility of CEW was better than CIW.
4.3. Skeleton Curves
The load-displacement skeleton curve was developed by connecting the peak values at each load step on the hysteresis loops [
26]. It is evident from the comparison of skeleton curves in
Figure 11 that during the initial loading stage, the skeleton curves for CEW and CIW increased straightly with a large slope but small displacement. The above findings show that CEW and CIW remained in an elastic stage. The wallboard entered an elastoplastic stage when the gypsum and concrete cracked. The skeleton curve bent to a certain degree, the displacement increased but the variation of stiffness was less significant. When the vertical reinforcement at both sides of the wallboard yielded, the degree of stiffness degradation for CEW and CIW specimens reduced with the increase of top load and displacement. Judging from the overall trend of skeleton curves, the increase of skeleton curves for CEW specimens was smoother and more even compared with CIW specimens, which suggests that the stress distribution of CEW was more even than CIW and the deformation was more stable. Judging from the ultimate load and displacement, CEW was much larger than CIW. From the perspective of absolute height or length of the skeleton curves,
i.e., the effective distance between the horizontal or vertical straight lines in
Figure 11a,b, CEW outperformed CIW specimens. The above finding shows that the load-carrying and deformation capacity of CEW were better than CIW. The angle of ultimate displacement for CEW specimens, which is the angle of displacement corresponding to points A
1 and B
1, or A
2 and B
2 in
Figure 11, was larger than CIW. In general, when insulation board is added and externally bonded with single gypsum board, the capacity of elastoplastic deformation for CEW can be significantly improved.
Figure 11.
Skeleton curves of CEW/CIW. (a) CEW; (b) CIW.
Figure 11.
Skeleton curves of CEW/CIW. (a) CEW; (b) CIW.
4.4. Load-Carrying Capacity and Ductility Coefficient
It is evident from the load-carrying capacity shown in
Table 1 that the crack load, yield load and ultimate load for CEW and CIW specimens increased nonlinearly. The values for CEW increased by 1.19 times, 1.02 times and 1.17 times, respectively, compared with CIW specimens. The corresponding displacement and angle of displacement increased nonlinearly as well and the values for CEW increased by 1.14 times, 1.20 times and 1.29 times, respectively, compared with CIW specimens. It is evident from comparison that the load-carrying capacity, displacement and corresponding angle of displacement at key points for CEW specimens outperformed CIW specimens. The above finding suggests that the coordination of insulation board, gypsum boards as well as concrete dense beam and column wall significantly improved the capacity of elastoplastic deformation for CEW specimens. The capacity of deformation for CEW was better than CIW.
Table 1.
Load-carrying capacity and ductility coefficient.
Table 1.
Load-carrying capacity and ductility coefficient.
| Parameters | E-1 | E-2 | E-3 | I-1 | I-2 | I-3 |
|---|
| Crack load | pcr (kN) | 78.70 | 69.43 | 71.57 | 60.46 | 60.11 | 64.74 |
| Avg. | 73.23 | 61.77 |
| Crack displacement | Δcr (mm) | 0.85 | 0.75 | 0.83 | 0.84 | 0.69 | 0.61 |
| Avg. | 0.81 | 0.71 |
| Crack displacement angle | θcr | 1/1741 | 1/1986 |
| Yielding force_1 | py (kN) | 209.07 | 220.25 | 215.76 | 212.60 | 206.40 | 211.50 |
| Avg. | 215.03 | 210.17 |
| Yielding displacement_1 | Δy (mm) | 4.02 | 4.11 | 4.16 | 3.68 | 3.50 | 3.07 |
| Avg. | 4.10 | 3.42 |
| Yield displacement angle | θy | 1/344 | 1/412 |
| Ultimate load | pu (kN) | 369.63 | 377.71 | 366.45 | 318.42 | 305.02 | 327.07 |
| Avg. | 371.26 | 316.84 |
| Ultimate displacement | Δu (mm) | 16.08 | 17.72 | 18.13 | 14.61 | 13.80 | 11.85 |
| Avg. | 17.31 | 13.42 |
| Ultimate displacement angle | θu | 1/82 | 1/105 |
| Ductility ratio_1 | μ =Δu/Δy | 4.00 | 4.31 | 4.36 | 3.97 | 3.94 | 3.86 |
| Avg. | 4.22 | 3.92 |
| Elastic stiffness | α (kN/mm) | 14.03 | 15.32 | 19.92 | 21.81 | 21.84 | 22.66 |
| Hardening stiffness | β (kN/mm) | 2.34 | 2.55 | 3.32 | 3.63 | 3.64 | 3.78 |
| Yielding displacement_2 | Δy′ (mm) | 3.99 | 4.53 | 4.45 | 4.09 | 4.02 | 3.51 |
| Avg. | 4.32 | 3.87 |
| Yielding force_2 | py′ (kN) | 216.00 | 210.00 | 228.00 | 204.00 | 209.60 | 202.80 |
| Avg. | 218.00 | 205.27 |
| Ductility ratio_2_Δu | μ′ =Δu/Δy | 4.03 | 3.91 | 4.07 | 3.57 | 3.43 | 3.38 |
| Avg. | 4.00 | 3.46 |
Ductility coefficient is an important indicator for the seismic performance of composite wallboard [
27]. In this study, displacement ductility coefficient (
i.e.,
μ = Δu/Δy) described in Specification of Testing Methods for Earthquake Resistant Building (JGJ101-96) was used to analyze the ductility of composite wallboard [
18]. It is clear from
Table 1 that the average values of ductility coefficients of CEW and CIW were 4.22 and 3.92, respectively. The ductility coefficient of CEW was increased by 7.65% compared with CIW, suggesting that the ductility of CEW was better than CIW and that the capacity of elastoplastic deformation, energy dissipation and seismic performance of CEW was better than CIW.
EN 12512(CEN 2006a) provides another method to compute the yielding point. The elastic branch is drawn through the points on the curve corresponding to 0.1 F
max and 0.4 F
max, whereas the post-elastic branch has a slope equal to 1/6 of that of the first line and is tangent to the curve [
19]. The yielding point is obtained by intersection. This method of calculation result is less than the first method, as shown in
Table 1. It has a great relationship with the definition of the method. The main advantages of the second method consist of the respecting of the equivalence of strain energy, it is clear that the yielding condition is strongly influenced by the failure condition [
19]. 1.14%—the ultimate displacement of new-type of gypsum-concrete composite exterior wallboard; 0.88%—the ultimate displacement of new-type of gypsum-concrete composite interior wallboard. Not only can it provide parameters for an analog overall structure, but it can also facilitate the European specification q-factor calculations.
4.5. Damping and Energy Dissipation
Under horizontal cycle load, the seismic performance of CEW and CIW is mainly dependent on the capacity of energy dissipation. The specimens absorb energy when loading and release energy when unloading. The energy dissipation in one cycle is calculated by the difference between the absorption and release of energy. The area of hysteresis loop is therefore used to evaluate the capacity of seismic energy dissipation [
28]. If the hysteresis loop is full, the capacity of energy dissipation is high [
29].
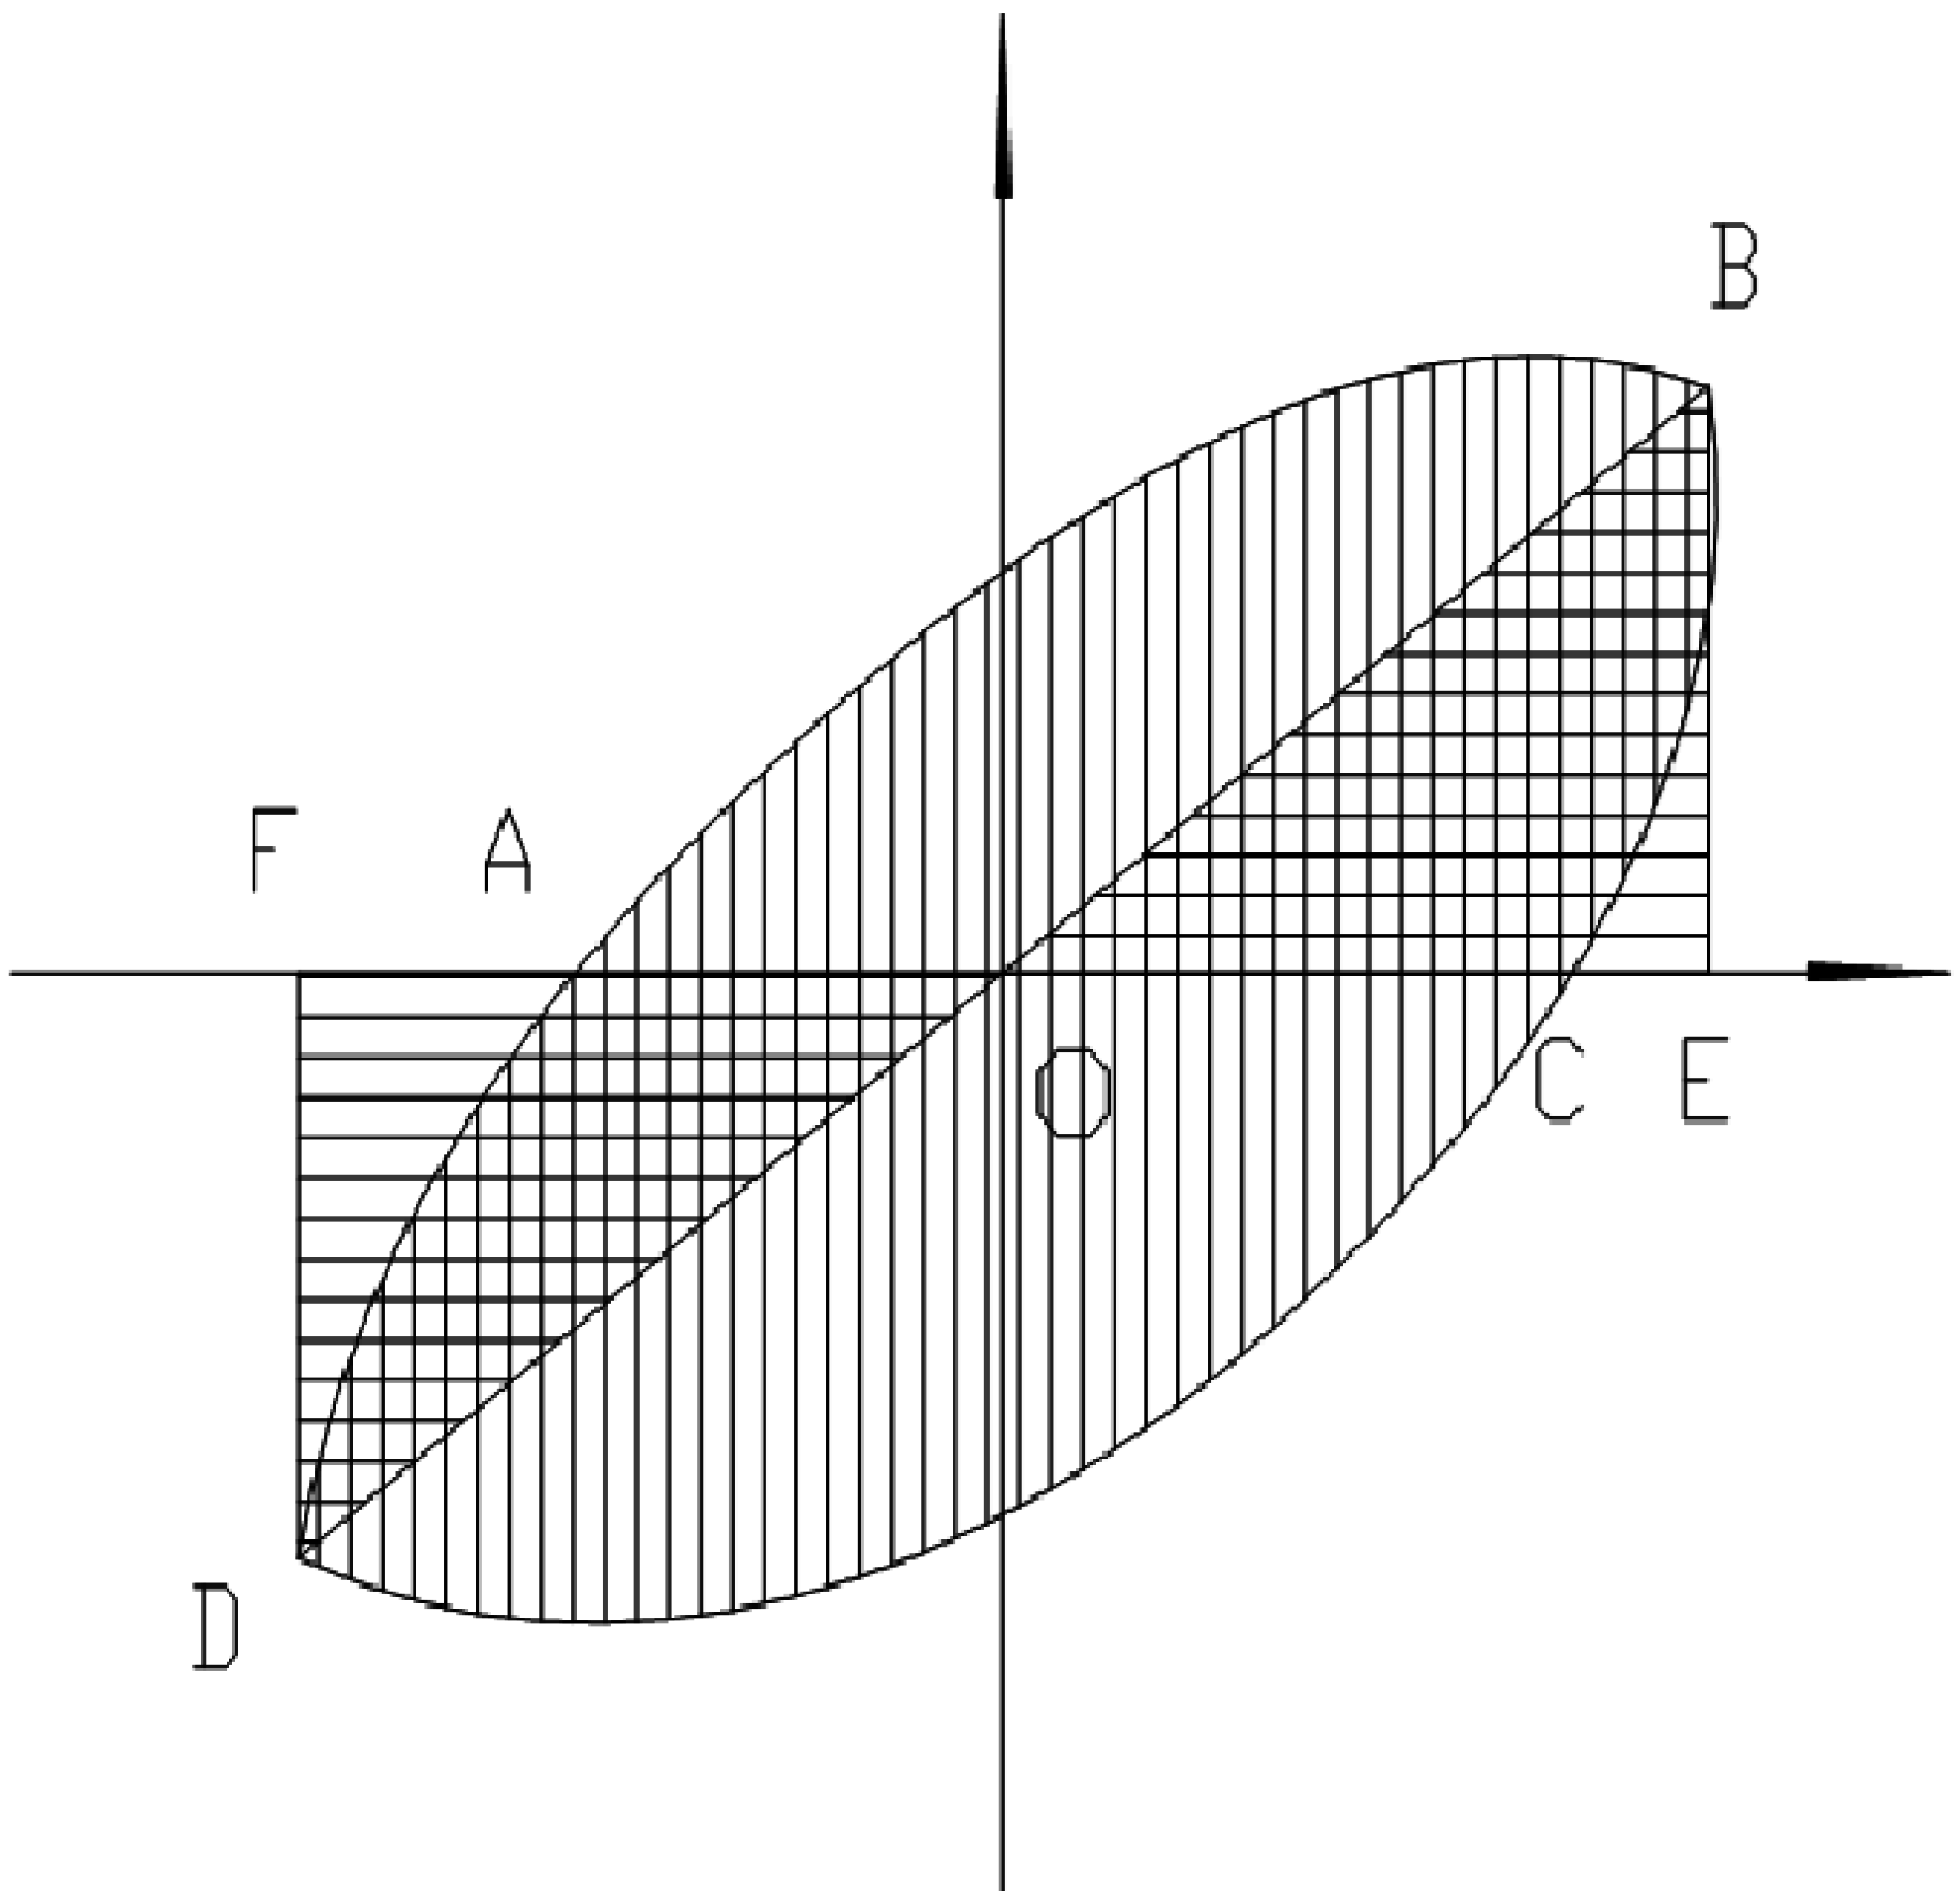
(1) Representative value of effective energy dissipation E is the total energy enclosed by all surrounded hysteresis loop (
i.e., the sum of the energy of all loops :
) in which
n,
i are the number and ordinal of the cycle, respectively;
SABCD is the dissipated energy in one cycle on the hysteresis curve, as shown in
Figure 12. CIW was used as the base of comparison and the relative value of energy dissipation for CIW was defined as 1. According to the representative value of effective energy dissipation shown in
Table 2, it was calculated that the relative value of energy dissipation for CEW was 2.68, which was 1.86 times larger than CIW. The above finding suggests that the coordination of insulation board, gypsum boards as well as concrete dense beam and column wall significantly improved the seismic energy dissipation for CEW.
Figure 12.
Calculation chart for effective energy and damping ratio.
Figure 12.
Calculation chart for effective energy and damping ratio.
Table 2.
Viscous damping coefficient and work ratio coefficient.
Table 2.
Viscous damping coefficient and work ratio coefficient.
| Specimen | E | he | |
|---|
| 1Δy | Avg. | 2Δy | Avg. | 3Δy | Avg. | 1Δy | Avg. | 2Δy | Avg. | 3Δy | Avg. |
|---|
| E-1 | 27,591.11 | 25,929.34 | 0.09 | 0.08 | 0.08 | 0.09 | 0.09 | 0.09 | 1.00 | 1.00 | 3.65 | 3.62 | 8.00 | 8.32 |
| E-2 | 25,338.06 | 0.09 | 0.09 | 0.09 | 1.00 | 3.63 | 8.59 |
| E-3 | 24,858.84 | 0.08 | 0.09 | 0.09 | 1.00 | 3.57 | 9.63 |
| I-1 | 10,318.99 | 9670.21 | 0.09 | 0.07 | 0.09 | 0.08 | 0.10 | 0.09 | 1.00 | 1.00 | 3.32 | 3.88 | 8.37 | 8.14 |
| I-2 | 9706.51 | 0.07 | 0.08 | 0.09 | 1.00 | 3.68 | 7.85 |
| I-3 | 8985.12 | 0.06 | 0.07 | 0.07 | 1.00 | 4.65 | 9.63 |
(2) Equivalent viscous damping coefficient (
he): equivalent viscous damping coefficient is often used to evaluate the capacity of energy dissipation for wallboard [
30]. If
he is large, the capacity of energy dissipation of the wallboard is high. The calculating equation is
he= (
SABC + SCDA)/[(2π
(SOBE + SODF)], as shown in
Figure 12. In which
SABCD is the dissipated energy in one cycle on the hysteresis curve;
SOBE + SODF is the area surrounded by hypothetical elastic straight line OB when the same displacement of OD is reached,
i.e., the absorbed energy. It is clear from
Table 2 that the average values of damping coefficient of CEW and CIW specimens increased steadily from 1Δ to 3Δ
y, which suggests that the increase of capacity of energy dissipation for both types of wallboard was stable, the coordination between each material was outstanding and the overall load-bearing of the wallboard was reasonable. The increase of
he indicates the increase of the capacity of elastoplastic deformation. The average value of
he for CEW was larger than CIW for the first two steps and thus the energy dissipation of CEW outperformed CIW.
(3) Work ratio coefficient
: Work ratio coefficient is often used to represent the amount of energy absorption and is another indicator of seismic energy dissipation [
31]. The equation is:
, in which
n, i are the number and ordinal of the cycle, respectively;
pi,
δi are the load and displacement of the
ith cycle;
py,
δy are the yield load and yield displacement. As shown in
Table 2, with the increase of displacement cycle, the average value of
increased gradually. For each increment of the displacement cycle, the energy absorbed by the specimens exceeded the energy absorbed during the last cycle. In other words, the capacity of energy absorbance of the wallboard increased and so was the seismic capacity. The value of
was increased by 130% and 110% for CEW and CIW, respectively, at 3Δy and 2Δy, suggesting that when entering the elastoplastic stage, the capacity of energy dissipation for CEW in the latter stage outperformed CIW.
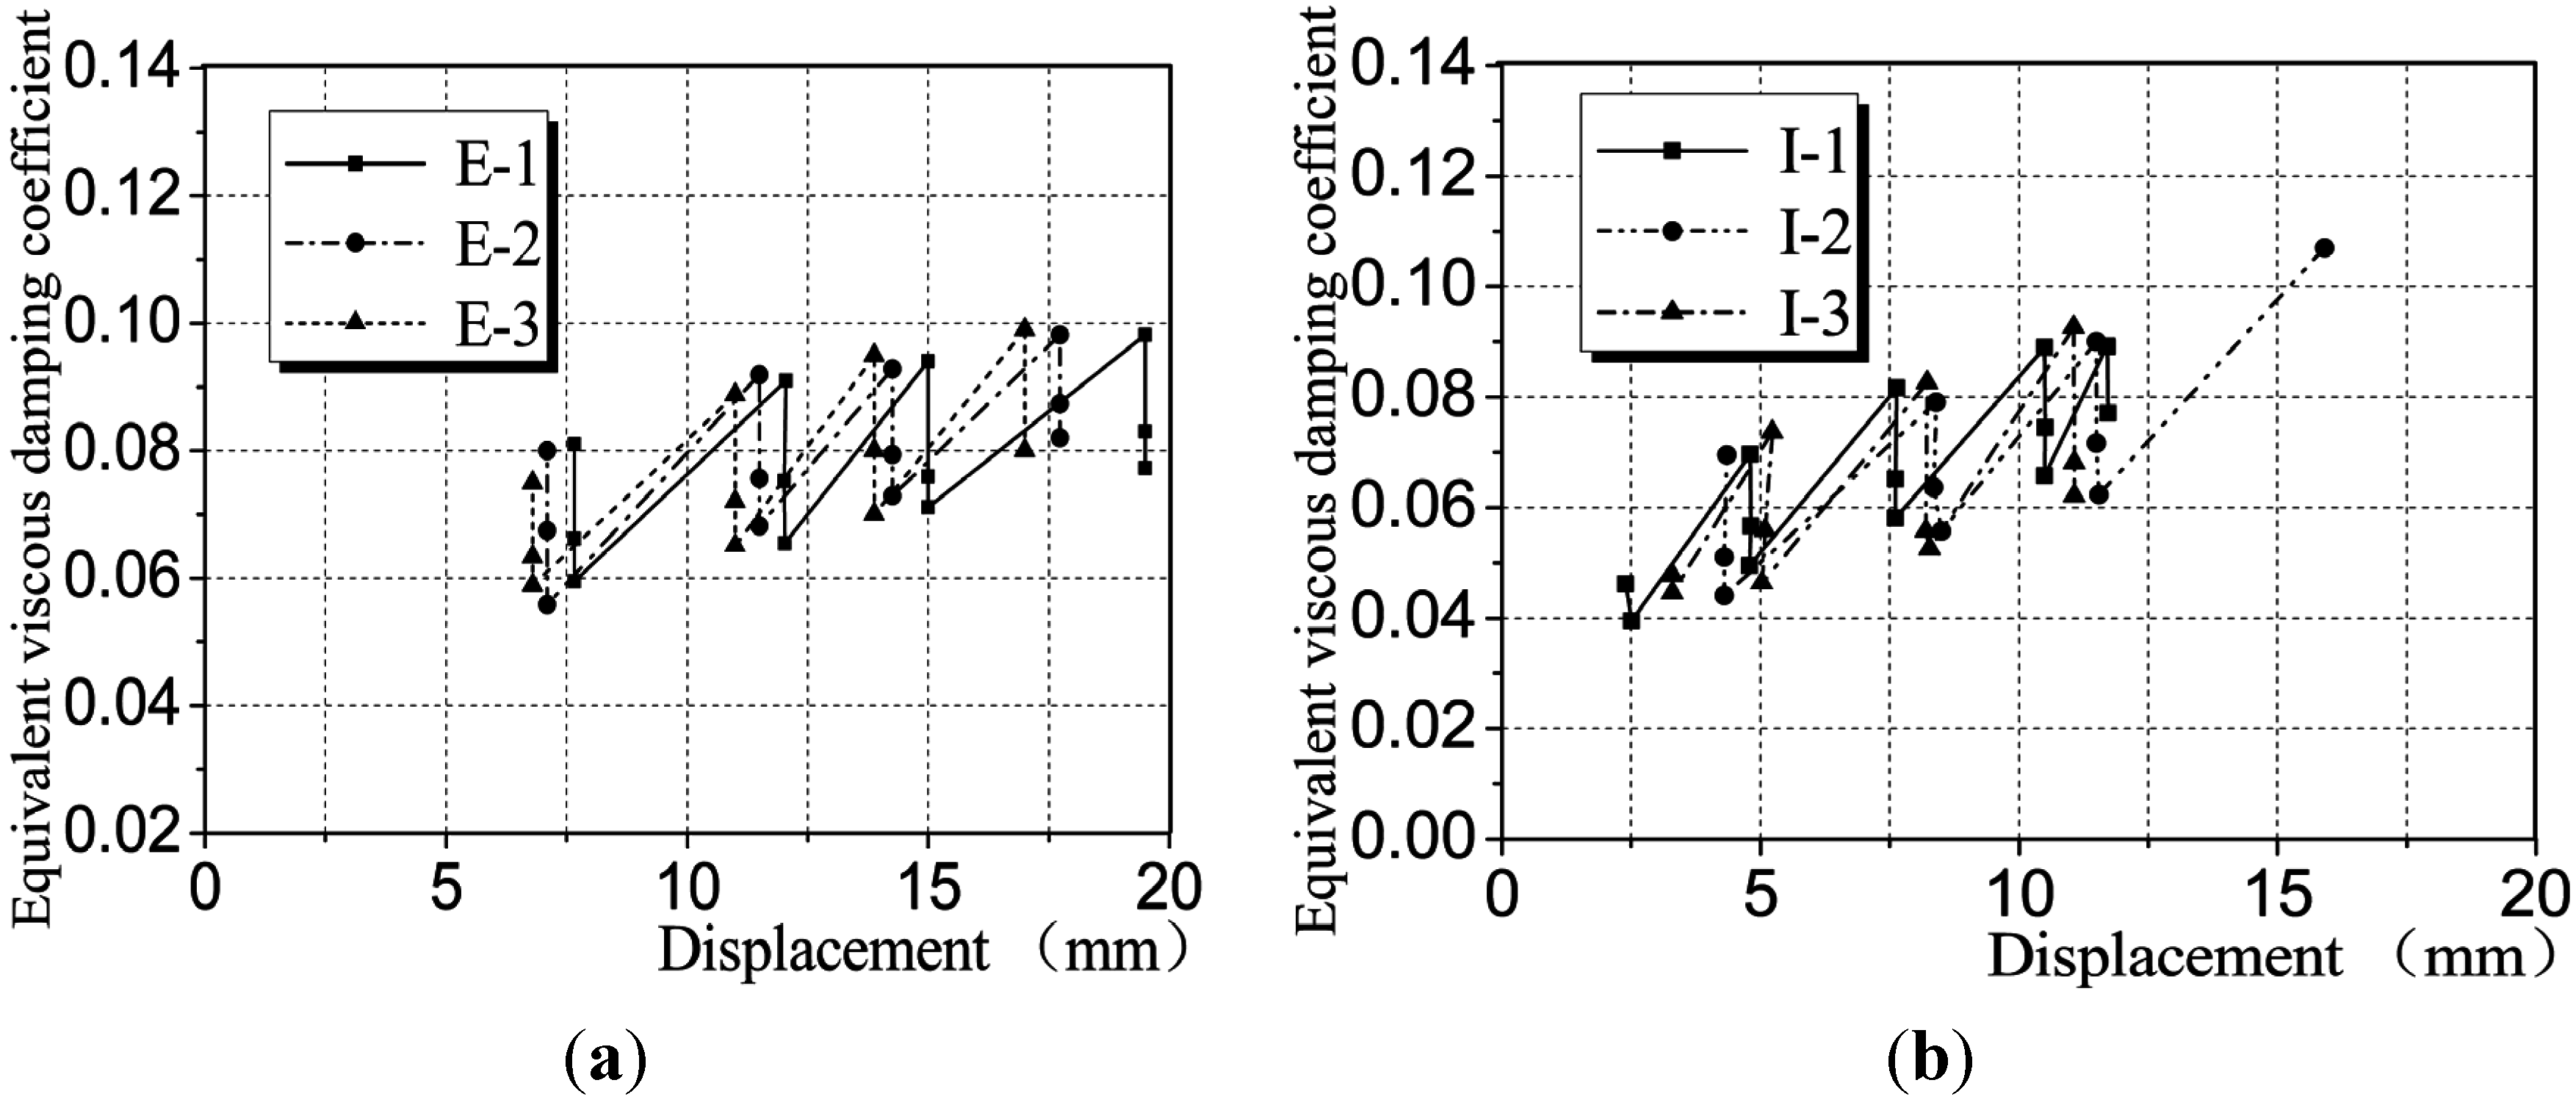
(4) Displacement-equivalent viscous damping coefficient diagram: as shown in
Figure 13, with the increase of displacement, the equivalent viscous damping coefficients of CEW and CIW were generally stable with a small increase, which suggests that the energy dissipated by the wallboards increased. During the three cycles controlled by displacement, the equivalent viscous damping coefficient reduced, suggesting that the wallboard specimens were damaged during the cyclic loading process and the damage was accumulated. Judging from the overall trends in
Figure 13, the curve of CEW was more stable than CIW, suggesting that when CEW was yielded, the stability of load-bearing and deformation was better than CIW.
Figure 13.
Displacement-equivalent viscous damping coefficient diagram. (a) CEW; (b) CIW.
Figure 13.
Displacement-equivalent viscous damping coefficient diagram. (a) CEW; (b) CIW.
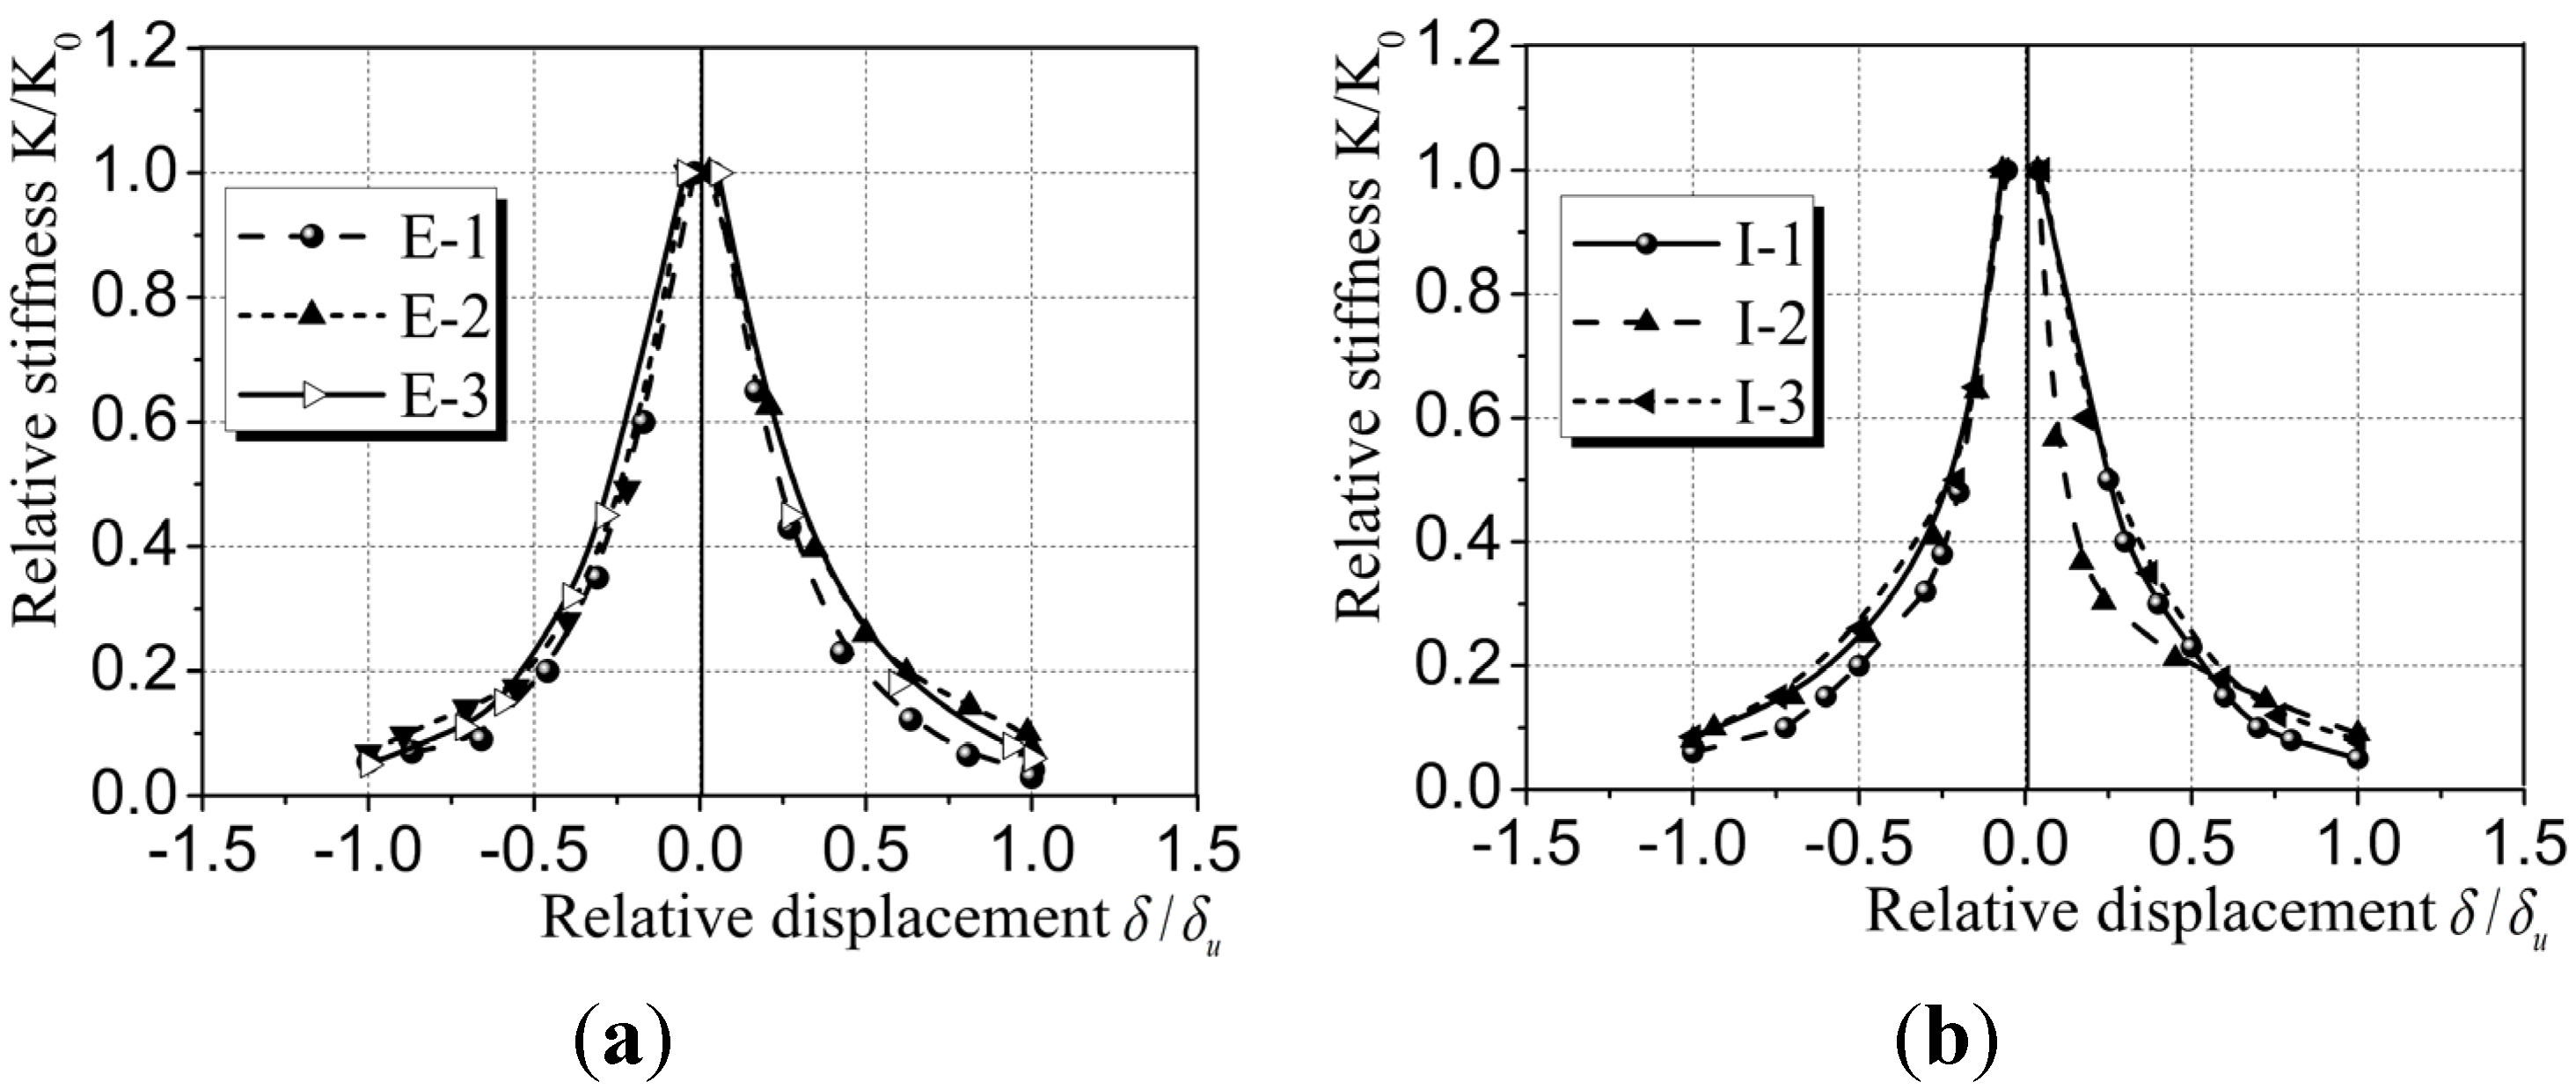
(5) Stiffness degradation: Stiffness degradation is another indicator of seismic performance for composite wallboard member [
32]. It can be used to evaluate the rate of degradation of lateral stiffness of the wallboards, as shown in
Figure 14. The slope of line connecting the loading point on the skeleton curve and the origin is defined as the equivalent stiffness
K of the wallboard. The relative stiffness,
K/K0, is defined as the ratio of equivalent stiffness
K and initial stiffness
K0. The ratio of displacement
δ corresponds with the loading point on the skeleton curve to the ultimate displacement is defined as relative displacement,
δ/δu. It is clear from
Figure 14 that during the initial loading stage, due to the fact that new micro-cracks were produced in the wallboard, the stiffness was reduced dramatically. When the angle of top displacement reached 0.27% for CEW and 0.23% for CIW, the wallboards entered a yielding stage. With the increase of load, the amount of newly generated cracks reduced. Existing cracks further extended and widened and the accumulative damage increased. It was suggested that the elastoplasticity of the wallboards was further developed and the lateral stiffness was further degraded. The lateral stiffness at ultimate displacement was reduced to 9% of the initial value. The overall trends of reduction of relative stiffness for CEW was less significant than CIW, suggesting that the capacity of elastoplastic deformation of CEW was better and, thus, the seismic performance of CEW was better than CIW. The initial stiffness of CEW was larger than CIW, indicating that the addition of insulation board and externally bonded single gypsum board contributed to the increase of overall stiffness.
Figure 14.
Comparison of stiffness degradation for CEW/CIW. (a) CEW; (b) CIW.
Figure 14.
Comparison of stiffness degradation for CEW/CIW. (a) CEW; (b) CIW.
4.6. Material Strain
The analysis of material strain helps evaluate the conditions of coordination of each material as well as the contribution of insulation board and externally bonded single gypsum board towards the concrete dense beam-column wall.
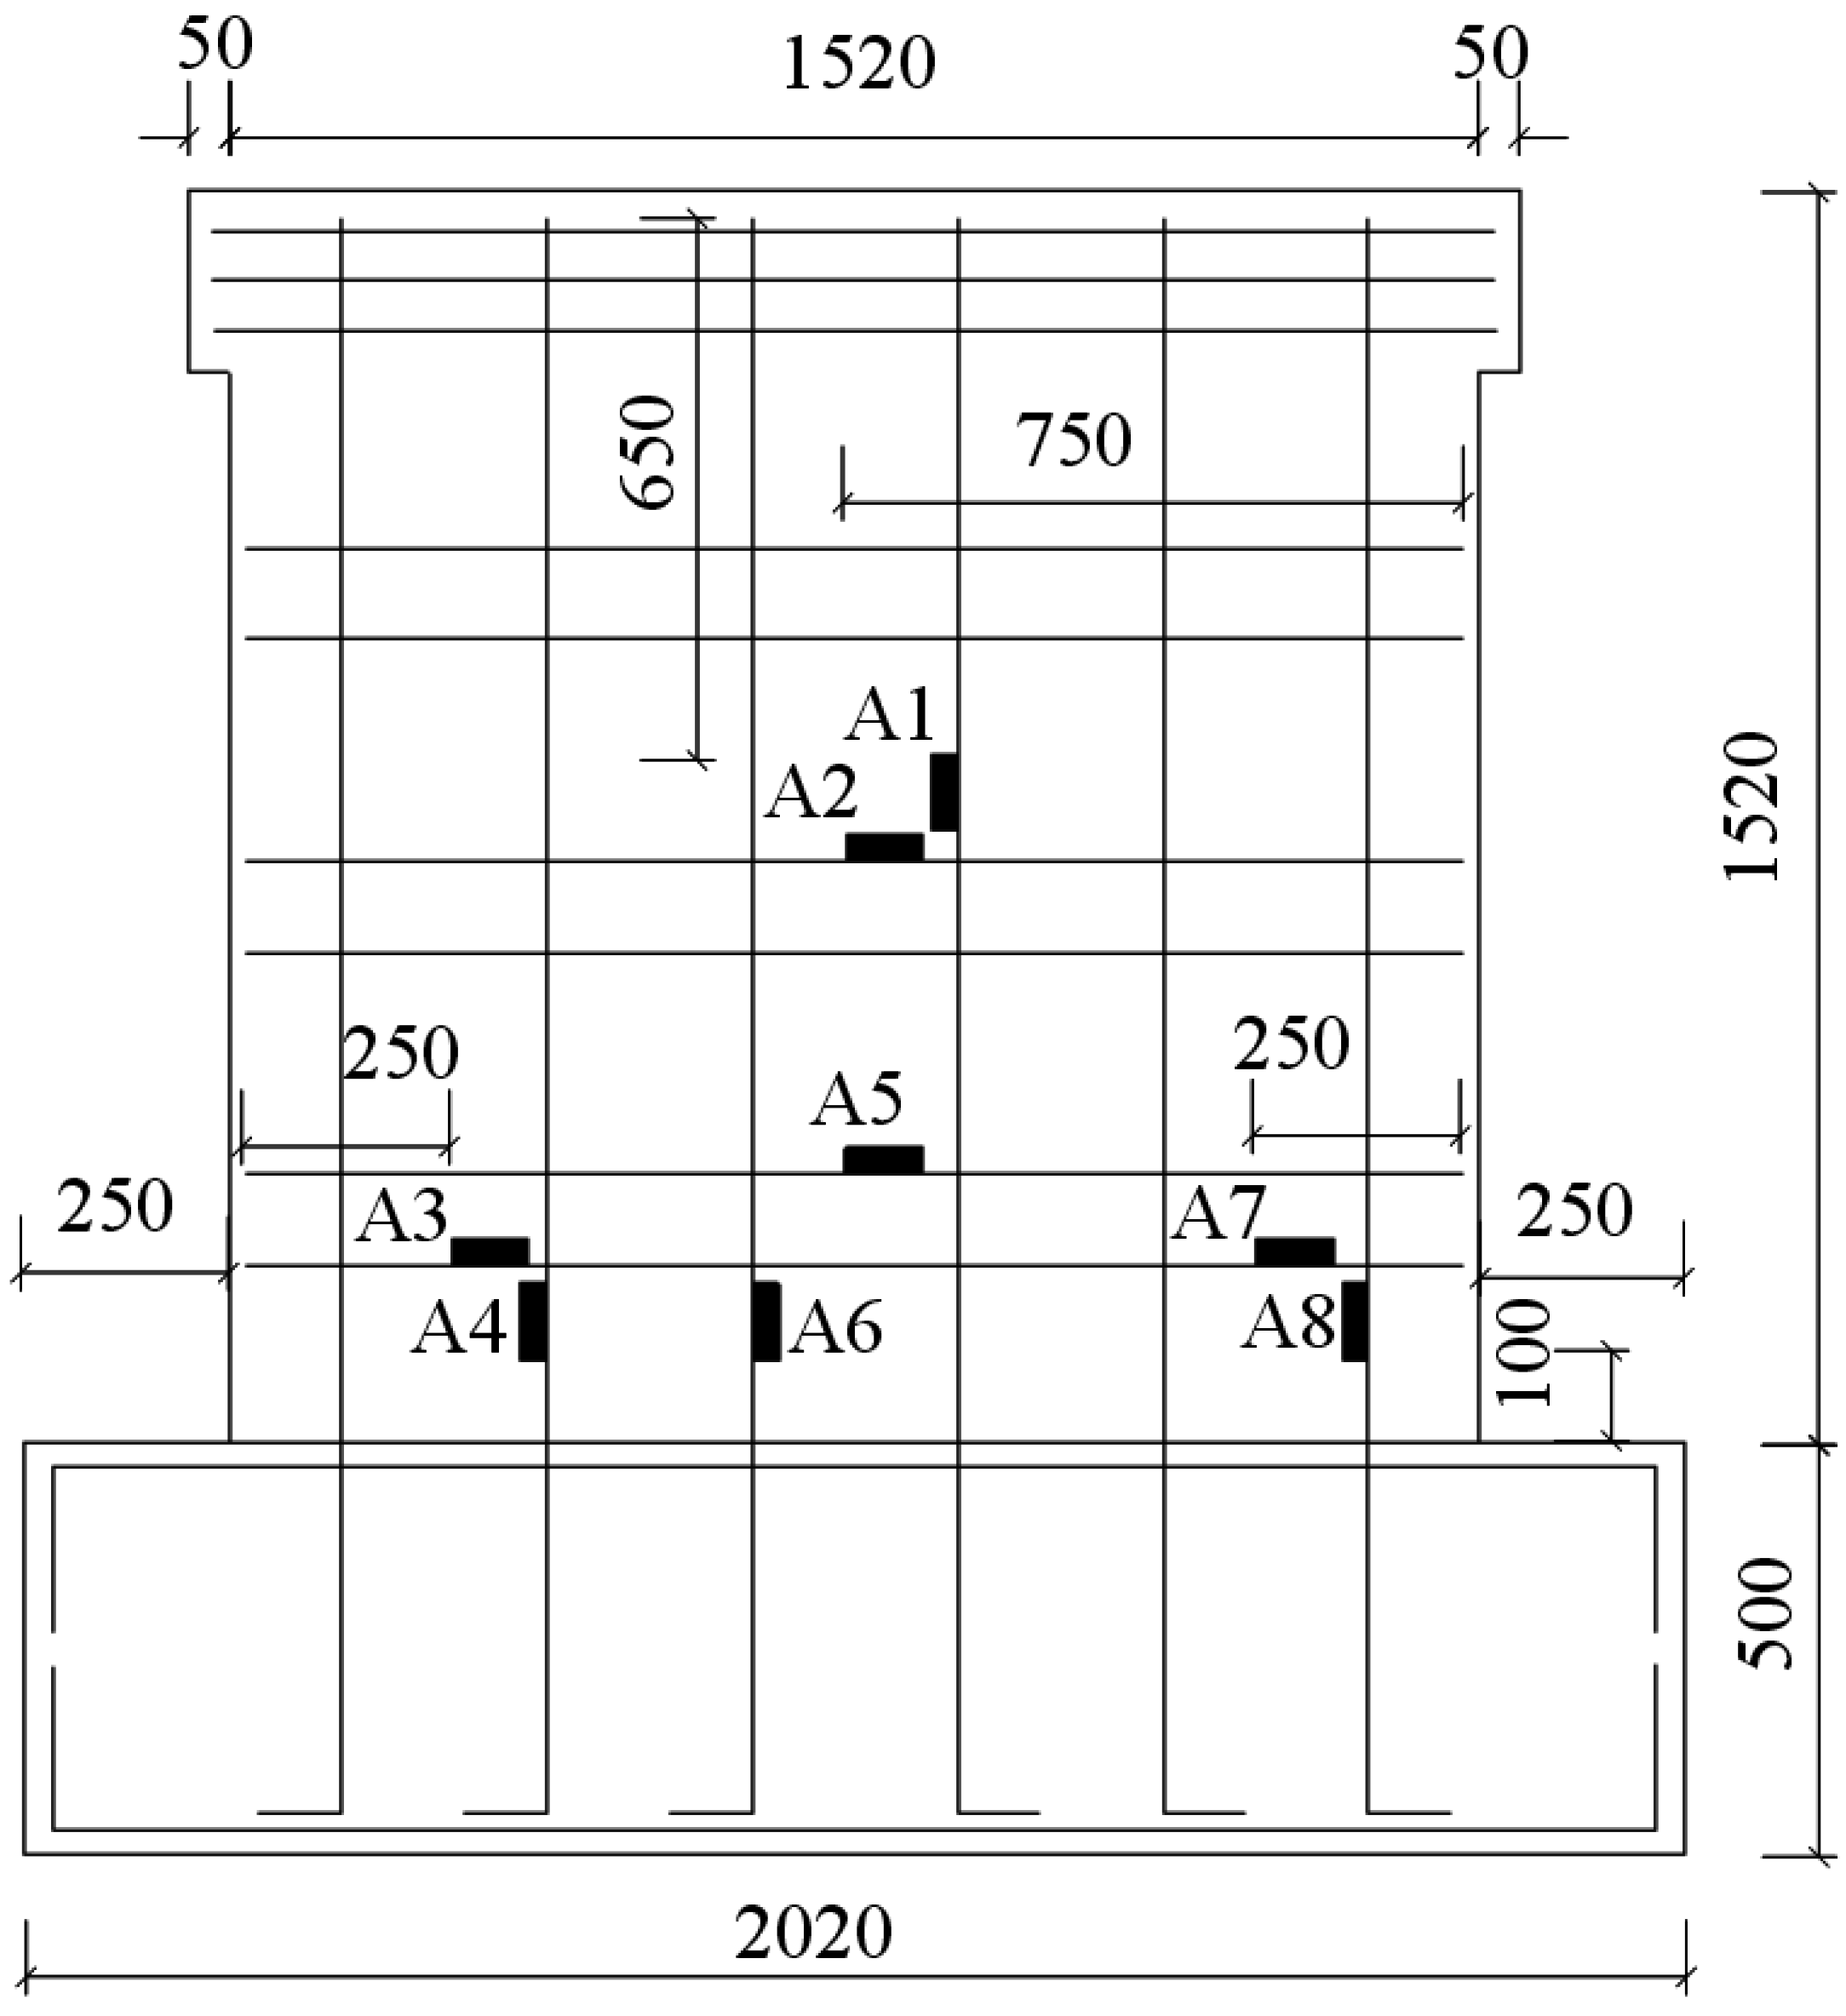
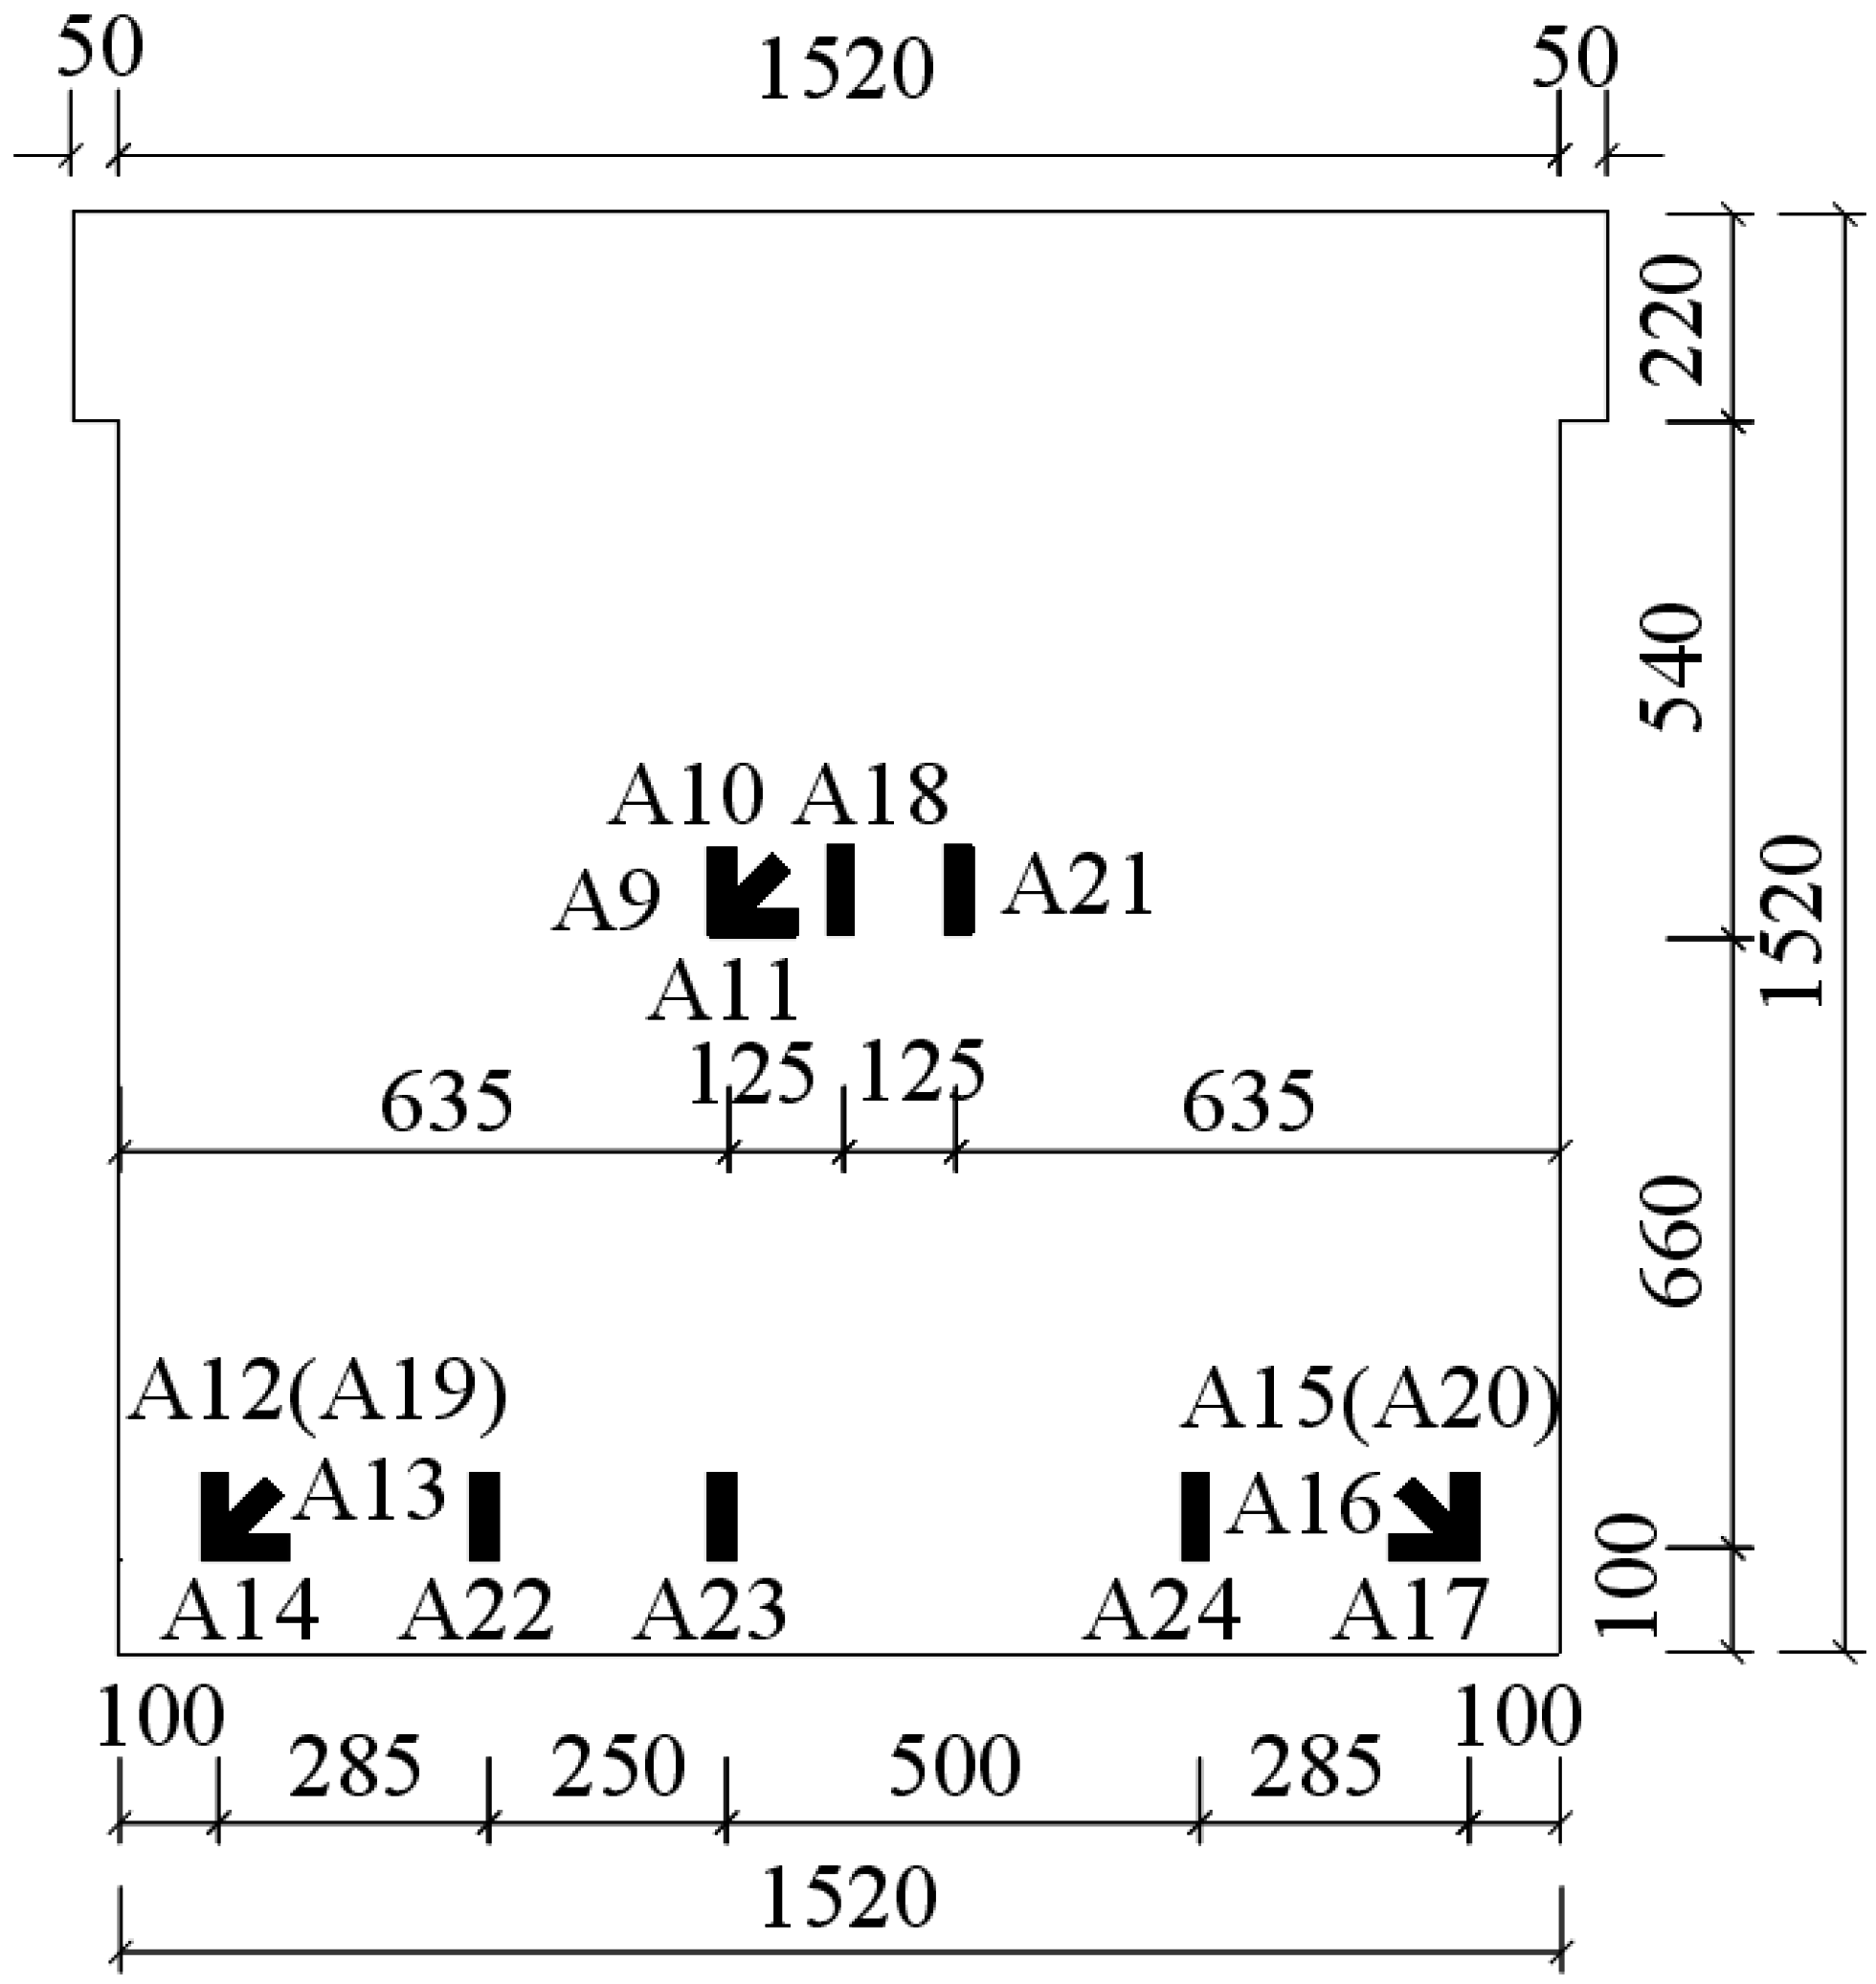
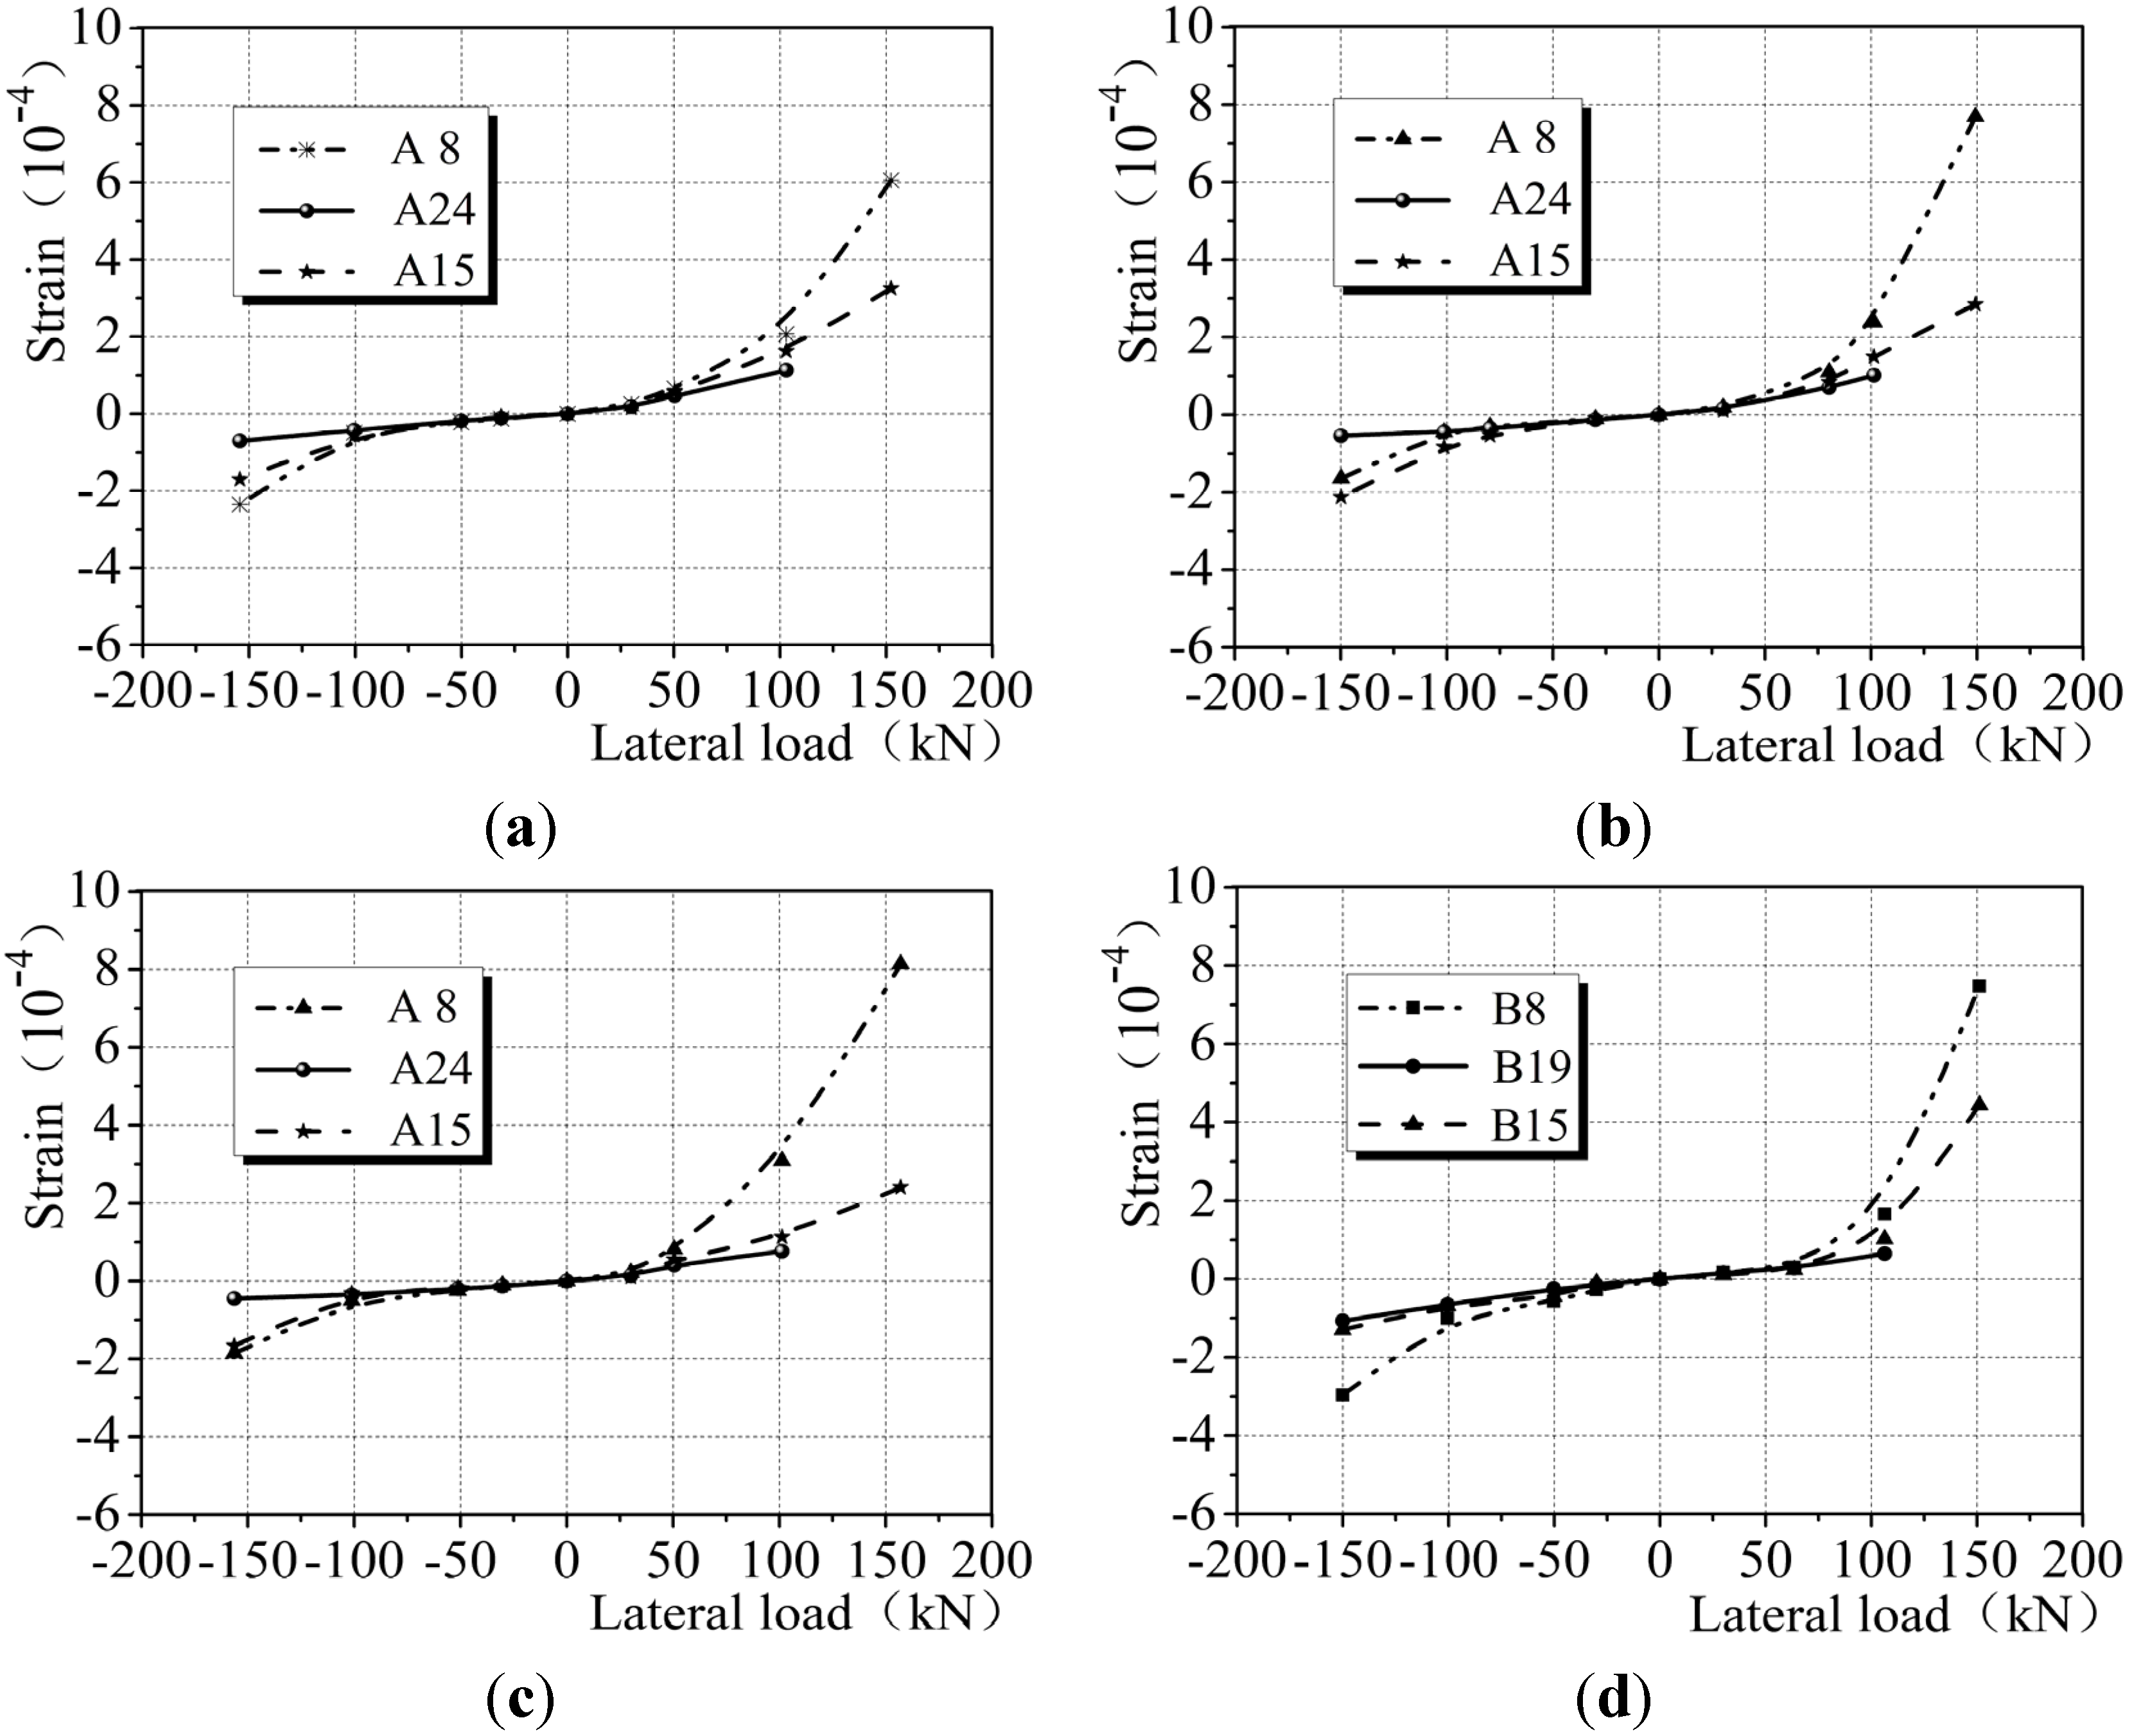
Figure 15 shows the lateral force-strain diagram of reinforcement (A8/B8), concrete (A24/B24) and gypsum board (A15/B15) at typical locations for CEW and CIW. A8/B8, A24/B24and A15/B15 located at the same height of the specimens and closed to each other. Stress-strain analysis on the same location can therefore be carried out. It is clear from the experimental results that the concrete of CEW and CIW was cracked under the 4th load step and 1 cycle was conducted for the first 4 load steps. The cracking of concrete led to the failure of strain gauges at the corresponding locations. Therefore, the strain data of key points in
Figure 15 sourced from the collected data for CEW and CIW under the first 4 load steps. The load values were sourced from the load on the skeleton curves for the first 4 load steps.
Figure 15.
Lateral force-material strain diagram for CEW/CIW. (a) E-1; (b) E-2; (c) E-3; (d) I-2.
Figure 15.
Lateral force-material strain diagram for CEW/CIW. (a) E-1; (b) E-2; (c) E-3; (d) I-2.
(1) Before the concrete cracked: the strain variation of each material in CEW and CIW was small and can be considered synchronous. At this stage, the reinforcement, concrete, gypsum and insulation of the wallboard were able to work coordinately.
(2) After the concrete cracked: on one hand, on the tension side of the typical location of the wallboard, for CEW and CIW specimens, the strain of the reinforcement increased from 2.52 × 10⁻⁴ to 7.03 × 10⁻⁴, and from 2.61 × 10⁻⁴ to 7.48 × 10⁻⁴; the strain of gypsum board increased from 1.42 × 10⁻⁴ to 2.84 × 10⁻⁴, and from 1.10 × 10⁻⁴ to 4.97 × 10⁻⁴. It was suggested that concrete did not carry any load after cracking, which led to the sudden increase of strain in reinforcement and gypsum board. In other words, concrete cracking was the key factor of stiffness and performance degradation of CEW and CIW. The gypsum board and insulation board failed after concrete cracking which suggests that during the initial cracking period, the fiberglass in the gypsum boards effectively resisted tension. The strain of reinforcement for CIW increased by 6.40% compared with CEW and the strain of gypsum increased by 75.00%. It is demonstrated that the insulation board and externally bonded single gypsum board participated in load-carrying which delayed the cracking of concrete dense beam-column wall and prolonged the effective timeframe of CEW. Based on above analysis, the seismic performance of CEW is better than CIW. On the other hand, on the compression side, the variation of strain of each material for CEW and CIW was smaller compared with that of the tension side, which is beneficial for the seismic performance of the wallboard.
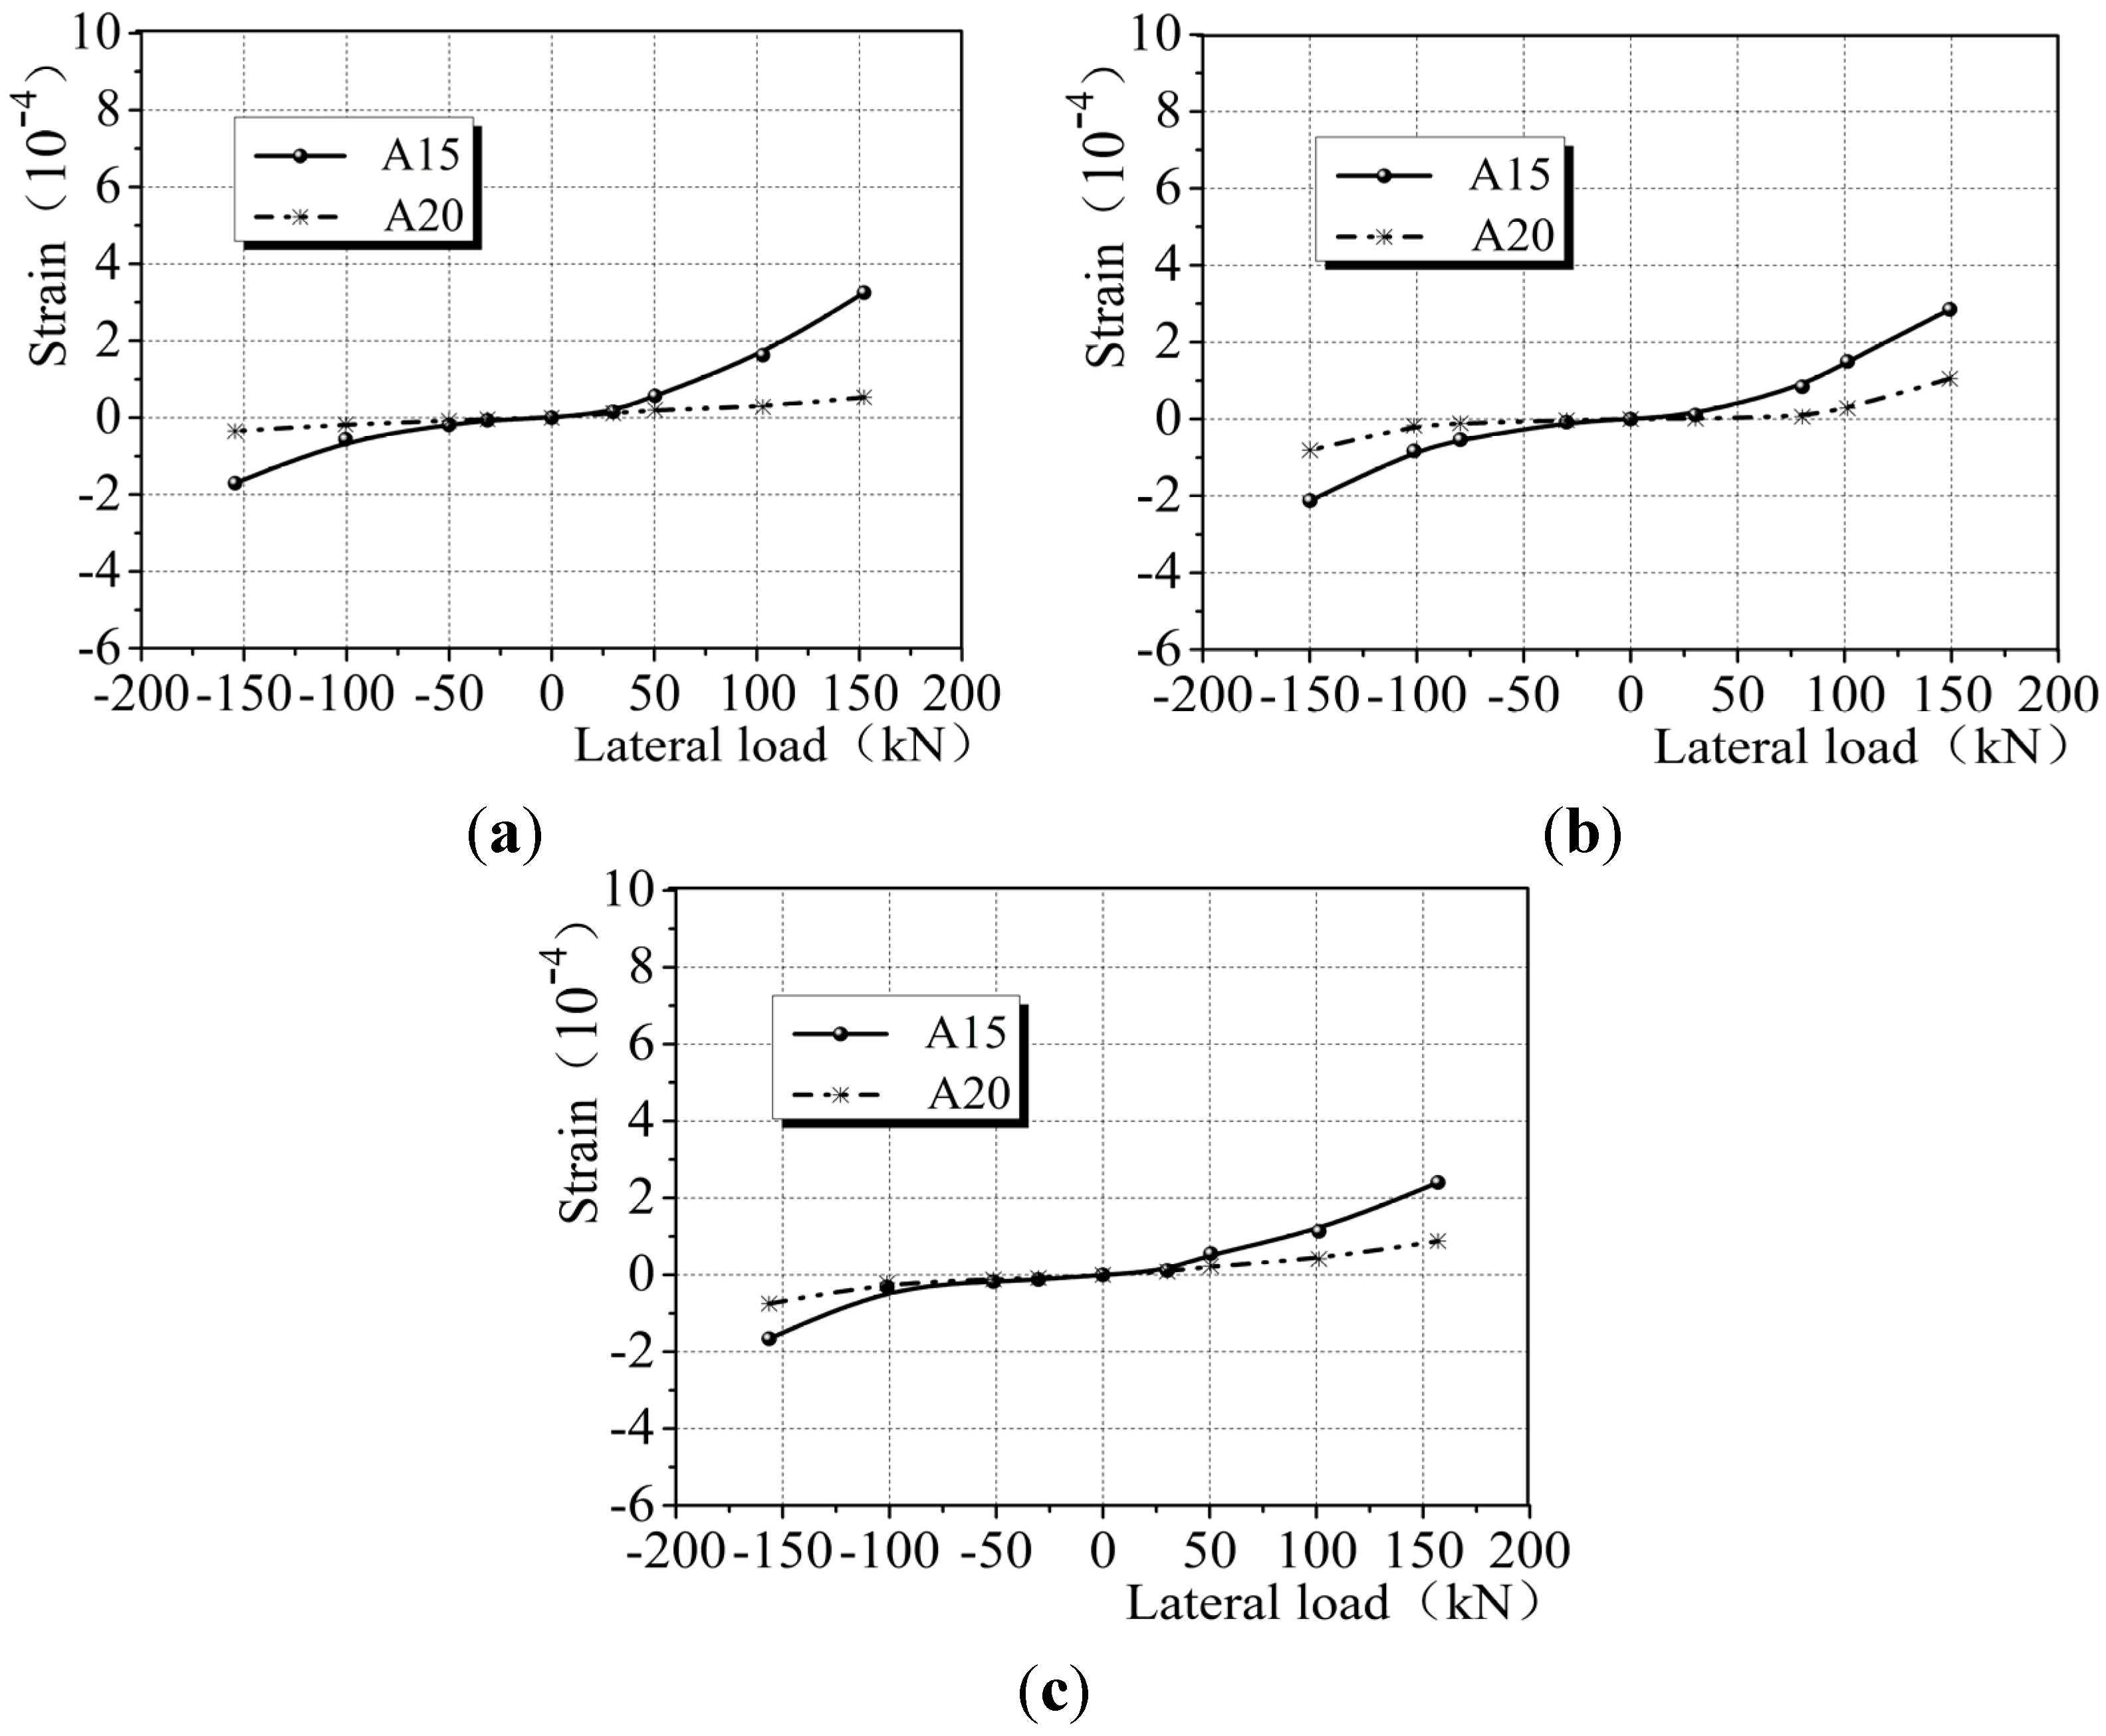
In order to evaluate the load-bearing condition and contribution of CEW gypsum board (front) and externally bonded single board (back),
Figure 16 shows the lateral force – strain diagram at A15 and A20 which were located on the typical locations of gypsum boards in the front and back. The range of strain variation at A15 of gypsum board was −1.87 × 10
−4 to 2.84 × 10
−4 and at A20 of single gypsum board, −0.64 × 10
−4 to 0.82 × 10
−4. It is clear that the load sustained by the gypsum board in the front was 3 to 3.5 times than that at the back. The force sustained by externally bonded gypsum single board was transferred by the insulation board, which suggests that the insulation board sustained a part of force to an extent, and the force sustained exceeded the force carried by externally bonded gypsum board. In general, during the loading process, CEW is able to distribute stress to the insulation board and externally bonded gypsum single board in order to achieve coordination among all materials.
Figure 16.
Lateral force-strain diagram in the front and at the back of CEW. (a) E-1; (b) E-2; (c) E-3.
Figure 16.
Lateral force-strain diagram in the front and at the back of CEW. (a) E-1; (b) E-2; (c) E-3.


