Article

On Fast Converging Data-Selective Adaptive Filtering

by
Marcele O. K. Mendonça
1,
Jonathas O. Ferreira
1,
Christos G. Tsinos
2,
Paulo S R Diniz
1,* and
Tadeu N. Ferreira
3
1
Signals, Multimedia, and Telecommunications Lab., Universidade Federal do Rio de Janeiro DEL/Poli &PEE/COPPE/UFRJ, P.O. Box 68504, Rio de Janeiro RJ 21941-972, Brazil
2
SnT-Interdisciplinary Centre for Security, Reliability and Trust, University of Luxembourg,4365 Luxembourg City, Luxembourg
3
Tadeu N. Ferreira, Fluminense Federal University, Engineering School, R. Passo da Patria, 156, Room E-406, Niteroi RJ 24210-240, Brazi
*
Author to whom correspondence should be addressed.
Algorithms 2019, 12(1), 4; https://doi.org/10.3390/a12010004
Submission received: 30 November 2018 / Revised: 17 December 2018 / Accepted: 18 December 2018 / Published: 21 December 2018
(This article belongs to the Special Issue Adaptive Filtering Algorithms)

Abstract

:
The amount of information currently generated in the world has been increasing exponentially, raising the question of whether all acquired data is relevant for the learning algorithm process. If a subset of the data does not bring enough innovation, data-selection strategies can be employed to reduce the computational complexity cost and, in many cases, improve the estimation accuracy. In this paper, we explore some adaptive filtering algorithms whose characteristic features are their fast convergence and data selection. These algorithms incorporate a prescribed data-selection strategy and are compared in distinct applications environments. The simulation results include both synthetic and real data.

1. Introduction

In many practical applications, the number of data-acquisition devices is growing at an exponential rate, such as in distributed networks, massive multiple-input multiple-output (MIMO) antennas, and for social networks. This trend calls for the parsimonious use of the acquired data when considering the overwhelming resources required such as storage capacity, device-to-device communications, power consumption, among others. In the era of Big Data, we face the challenge of efficiently utilizing a large amount of data to extract the critical information. In the context of adaptive filtering, the recently proposed strategy to perform data-selection approximating a prescribed update rate appears to be promising [1].
This new data-selection method prescribes a probability of updating utilizing a threshold based on the mean squared error (MSE) which determines if the acquired data sample contains enough information to justify a change in the parameter estimate. Utilizing a statistical model for the MSE, it is possible to prescribe the probability of updating inherent to the learning algorithm. Also, an additional threshold value can be utilized to verify if the data represents an outlier, i.e., abnormal data.
Previous work [1] addressed the classical Least Mean Square (LMS), the Affine Projection (AP), and the Recursive Least Squares (RLS) algorithms. Among these algorithms, the RLS has the fastest convergence in stationary environments, and the highest computational complexity, while facing numerical stability issues. In this work, we consider fast converging adaptive filtering algorithms with data selection and apply them to process real data in order to verify their effectiveness in addressing practical problems. The proposed algorithms are the LMS Newton (LMSN) [2], the LMS Quasi-Newton (LMSQN) [3] and the online conjugate gradient (CG) [4,5,6,7,8,9]. Like the RLS algorithm, the LMSN has fast convergence even when the input signal is highly correlated. By employing an estimate of the Hessian matrix, the LMSQN methods [10,11,12,13] have a similar computational complexity to the RLS and LMSN algorithms without sacrificing the performance. In fact, one version of the LMSQN algorithm exhibits improved robustness to quantization errors [3]. A low complexity algorithm originates from the Conjugate Gradient (CG) method [4] which does not require the computation of the Hessian matrix inverse as the LMSN, LMSQN, and RLS algorithms. The CG algorithm is attractive since it updates the adaptive filter coefficients based on conjugate directions leading to faster convergence than the gradient-based algorithms such as the LMS.
We explore the data-selective version of the LMSN, LMSQN and CG algorithms, showing their cost function in different applications, such as equalization and signal enhancement, which were not previously considered in [1,14,15]. For each configuration, we describe how to estimate the MSE to allow the prescription of the update rate.
The performance of the data selective algorithms is evaluated via simulations utilizing synthetic and real data in different adaptive filtering applications. The results indicate that the data selection strategy can indeed be applied to any type of applications of adaptive filters.
This paper is organized as follows. In Section 2, the data-selection strategy is discussed along with the calculation of the threshold parameter required to achieve a target probability of update. Section 3 describes the data-selective LMSN (DS-LMSN), LMSQN (DS-LMQSN), and the CG (DS-CG) algorithms. Section 4 compares the proposed algorithms. Some concluding remarks are provided in Section 5.

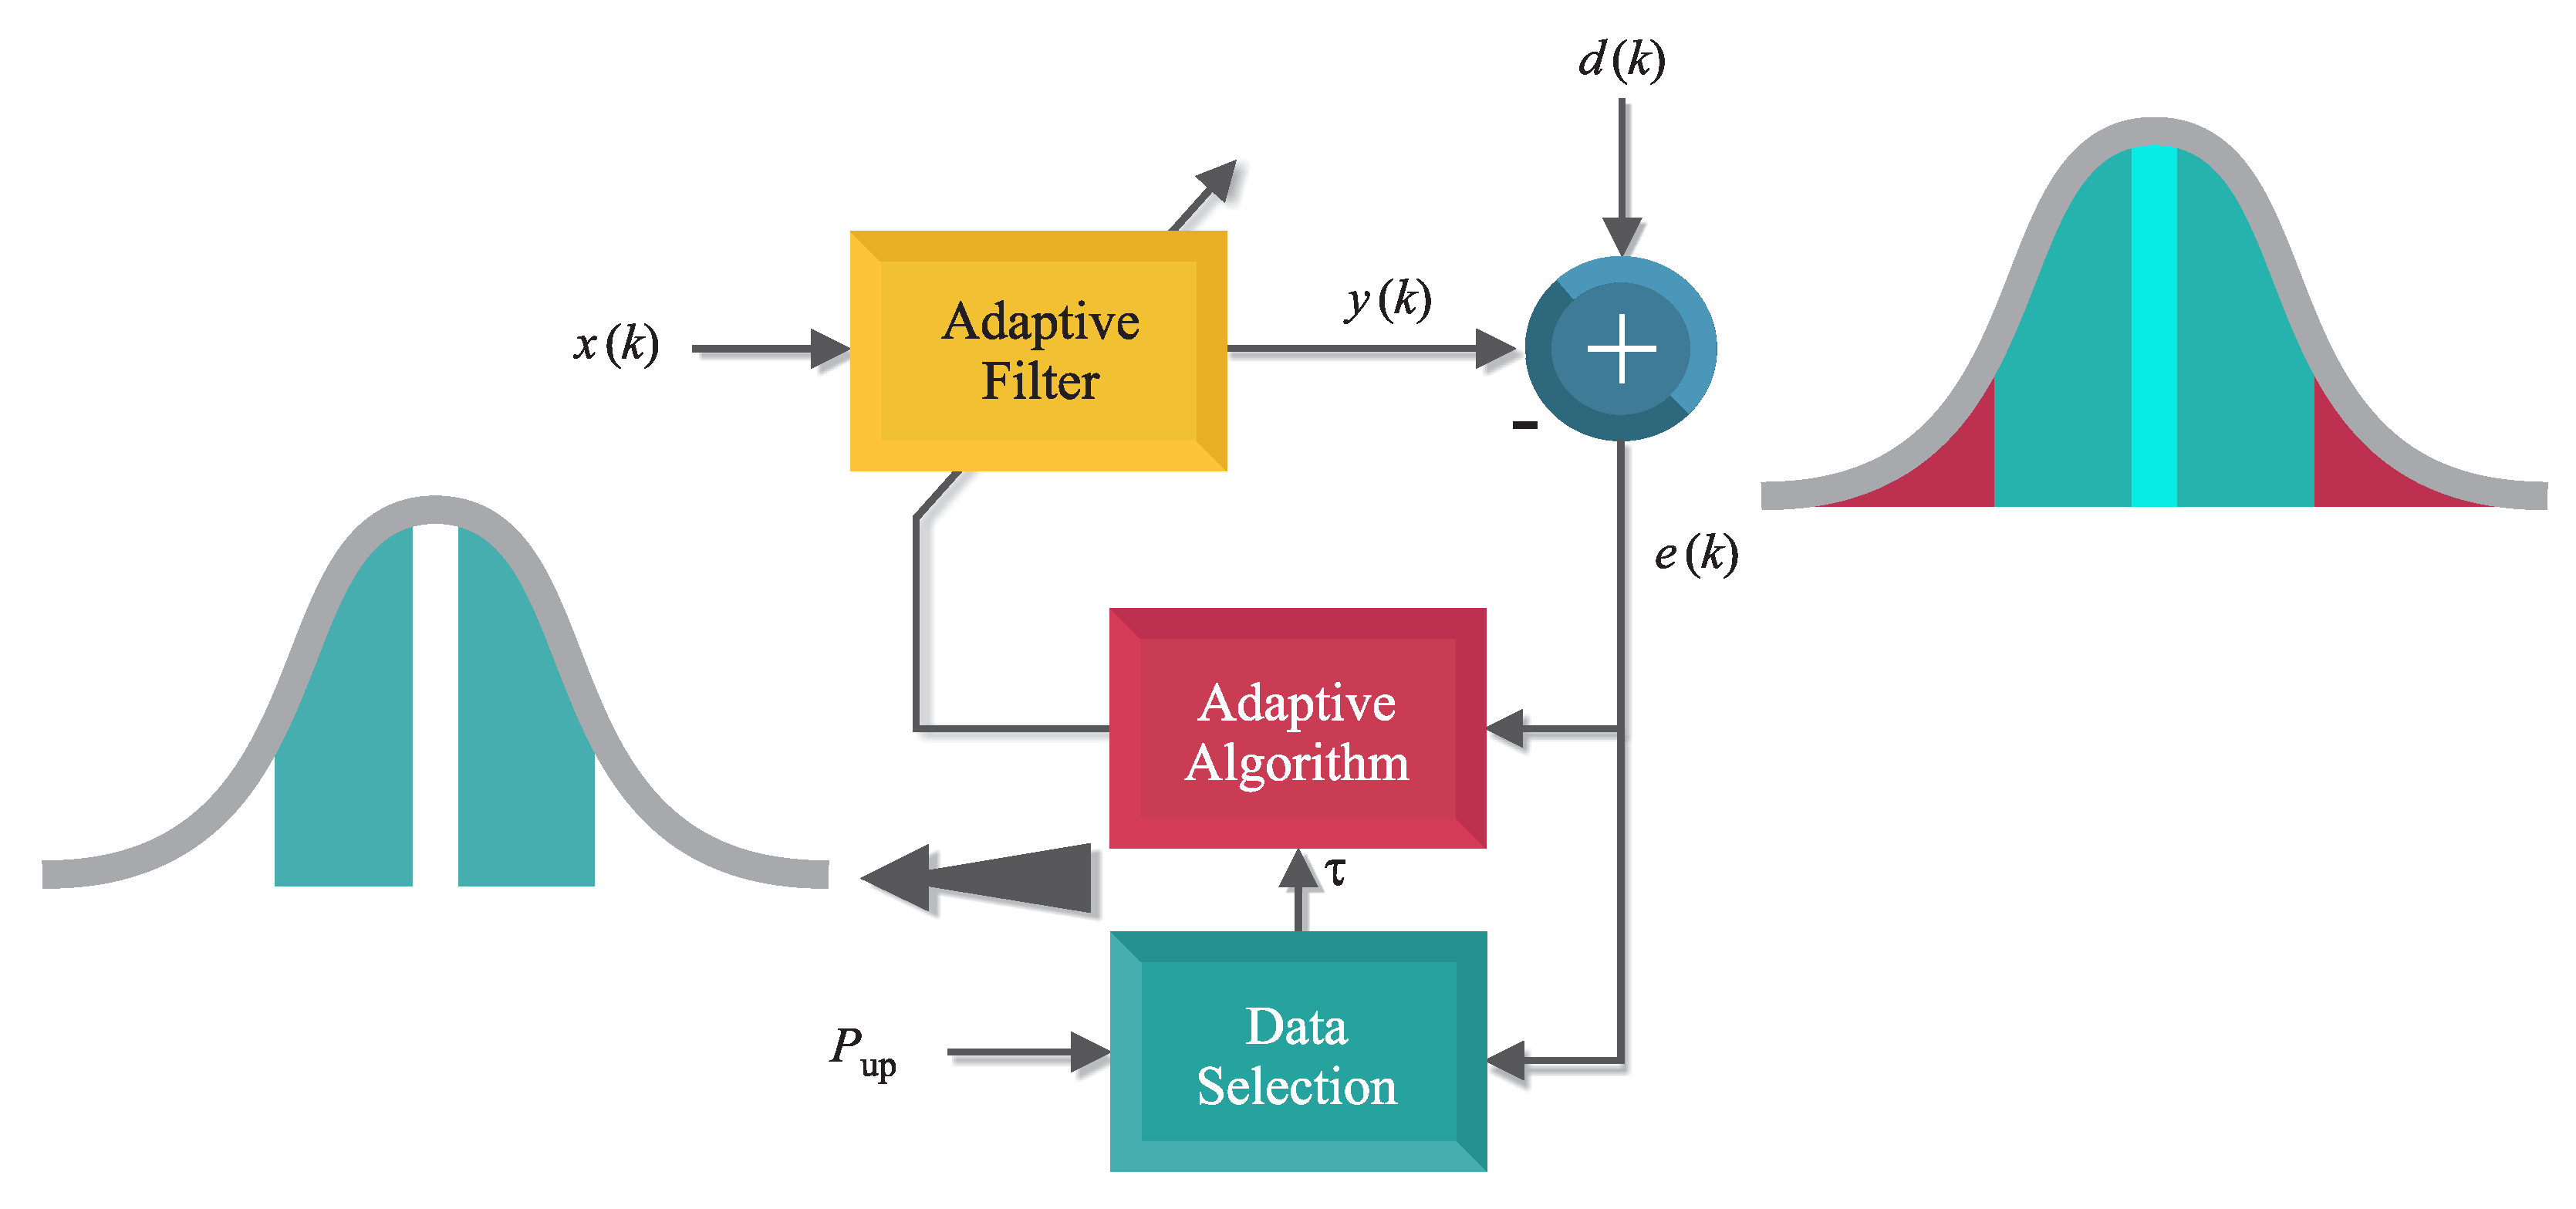
2. Problem Description

This section describes how to apply the data selection approach for distinct application set-ups. Regardless of the application, the filter output can be formulated as
y ( k ) = w T ( k ) x ( k )
where x ( k ) = [ x 0 ( k ) x 1 ( k ) x N 1 ( k ) ] T is the input applied to the adaptive filter and w ( k ) = [ w 0 ( k ) w 1 ( k ) w N 1 ( k ) ] T represents the adaptive filter coefficients. We can compute the a priori error signal e ( k ) as
e ( k ) = d ( k ) w T ( k ) x ( k )
where d ( k ) is the desired signal.
Basically the error signal e ( k ) is used by the adaptive algorithm to determine the updating of the filter coefficients. Given the error distribution, it is possible to infer the degree of innovation the current data carries; an illustration is provided in Figure 1. Observe that the central interval (in light blue) is equivalent to lower error values, whereas the edge intervals in red correspond to higher error values, indicating the presence of possible outliers that damage the estimation. The data-selection strategy relies on updating the filter coefficients only when the current data are informative, i.e., generate an error that does not belong to any of those intervals. Hence, the overall computational cost is reduced, since the coefficients are no longer updated 100 % of the time.
The adaptive algorithms require an objective function of the error in order to perform the coefficient updating. A common objective function considered in the adaptive filtering theory is the instantaneous squared error,
J ( w ( k ) ) = 1 2 | e ( k ) | 2
where | · | denotes the absolute value.
If the error distribution is assumed to be Gaussian, then
e N ( 0 , σ e 2 )
where σ e 2 is the error variance. By normalizing the error distribution, we obtain
e σ e N ( 0 , 1 ) .
The updating of the adaptive filter coefficients occurs if the normalized error | e ( k ) | σ e is greater than a given threshold τ ( k ) . However, if | e ( k ) | σ e is greater than another threshold τ max , an outlier is identified and thus, no update should be performed. These conditions can be incorporated to the minimization of the function
J ( w ( k ) ) = 1 2 | e ( k ) | 2 , if τ ( k ) | e ( k ) | σ e < τ max 0 , otherwise .
Hence, the coefficient updating follows the rule,
w ( k + 1 ) = w ( k ) + u ( k ) , τ ( k ) | e ( k ) | σ e < τ max w ( k ) , otherwise .
where the term u ( k ) depends on the adaptive algorithm employed. The desired probability of coefficient update P up ( k ) represents how often the first statement in Equation (7) is performed and is modeled as
P up ( k ) = P | e ( k ) | σ e > τ ( k ) P | e ( k ) | σ e > τ max .
By considering the distribution in (5), Equation (8) in steady-state becomes,
P up = 2 Q e τ 2 Q e τ max ,
where Q e ( · ) is the complementary Gaussian cumulative distribution function, given by Q e ( x ) = 1 / ( 2 π ) x e x p ( t 2 / 2 ) d t [16]. Even when outliers are present in the dataset, the probability P | e ( k ) | σ e > τ max tends to be very small. Therefore, the parameter τ can be obtained from Equation (9) as
τ = Q e 1 P up 2 ,
where Q e 1 ( · ) is the inverse of the Q e ( · ) function. Basically, to apply the threshold τ in the coefficient updating (7), we need to calculate σ e 2 . At this point, it should be mentioned that in the system identification application with sufficient order, the minimum MSE in steady-state is σ n 2 , the variance of the measurement noise n ( k ) . Hence, it is convenient to express σ e 2 as a function of the noise variance
σ e 2 = ( 1 + ρ ) σ n 2
in which the excess MSE is rewritten as ρ σ n 2 . The expression of ρ depends on the adaptive algorithm and is key to establish the prescribed probability of update P up .
As a result, the coefficient updating is performed based on a scaled power noise, τ ( k ) σ n 2 [1,14,15] so that an equivalent expression to Equation (8) can be rewritten as
P up ( k ) = P | e ( k ) | σ n > τ ( k ) P | e ( k ) | σ n > τ max
resulting in the following modifications in Equations (9) and (10)
P up = 2 Q e σ n τ σ e 2 Q e σ n τ max σ e and τ = ( 1 + ρ ) Q e 1 P up 2 for τ max .
If the presence of outliers is known, a possible strategy to eliminate them consists of employing the first 20% of the data without taking into consideration the threshold τ max , hence obtaining an estimate of the error behavior. For the remaining iterations, it is calculated by
τ max = E [ e ( k ) / σ e ] + 3 Var [ e ( k ) / σ e ] .
Since the expression (5) represents a Gaussian distribution, we can use the empirical rule given by Equation (14) to identify the values that exceed the threshold as outliers.
Under the considered assumptions regarding the error distribution, E { e ( k ) } = 0 and thus,
σ e 2 = E [ e 2 ( k ) ] = ξ ( k )
where ξ ( k ) for, k is the steady-state MSE obtained by employed algorithm. The expression of ξ ( k ) depends on the filter application and the algorithm employed. In the following subsections, we compute the steady-state MSE for some adaptive filter applications.
Alternatively, the error variance can be estimated by
σ e 2 = ( 1 b ) e 2 ( k ) + ( b ) e 2 ( k 1 ) ,
where b is a forgetting factor.
Although not discussed here, for the cases the error distribution is not Gaussian we can determine the threshold based on measured data through the evaluation of tail probabilities, see [17]. It is also worth mentioning that in particular applications, such as in medical data like ECG, the outlier threshold might affect the main feature to be observed since it resembles an outlier behavior.

2.1. Equalization

In the equalization application, the desired signal is a delayed version of the input
d ( k ) = s ( k l )
where l represents the delay. The adaptive filter output is written as
y ( k ) = w T ( k ) x ( k ) = w T ( k ) ( H s ( k ) + n ( k ) )
where H R N × L is the finite impulse response (FIR) channel convolution matrix, s ( k ) = [ s 0 ( k ) s 1 ( k ) s L 1 ( k ) ] R L is the received signal and the channel noise, n ( k ) = [ n 0 ( k ) n 1 ( k ) n N 1 ( k ) ] R N , is drawn from an independent Gaussian distribution with zero mean and variance σ n 2 . Therefore we can express the MSE as
ξ ( k ) = E [ e 2 ( k ) ] = E [ ( s ( k l ) y ( k ) ) 2 ] = σ s 2 2 E [ s ( k l ) ( w T ( k ) ( H s ( k ) + n ( k ) ) ) ] + E [ ( w T ( k ) ( H s ( k ) + n ( k ) ) ) 2 ] = σ s 2 2 w T ( k ) H E [ s ( k l ) s ( k ) ] + w T ( k ) H E [ s ( k ) s T ( k ) ] H T w ( k ) + w T ( k ) E [ n ( k ) n T ( k ) ] w ( k ) = σ s 2 2 w T ( k ) H r l + w T ( k ) ( H R H T + I N σ n 2 ) w ( k ) σ s 2 ( 1 2 w T ( k ) h l + w T ( k ) H H T w ( k ) ) + σ n 2 w T ( k ) w ( k )
where R is the autocorrelation matrix of the input signal, r l is the l-th column of the autocorrelation matrix, and h l = H r l . We are assuming that the inputs and the additional noise are uncorrelated.
Assuming the channel model is unknown, the practical way to compute the data-selection threshold is to estimate the output error variance through (16).

2.2. Signal Enhancement

In the signal enhancement case, the desired signal is a signal of interest corrupted by noise,
d ( k ) = s ( k ) + n 1 ( k ) .
By using another noise correlated with the noise that impairs s ( k ) as the adaptive filter input,
x ( k ) = n 2 ( k ) ,
the conventional error signal e ( k ) will be an enhancement version of d ( k ) and the adaptive filter output y ( k ) will be the actual error. For this reason, in this signal enhancement case, the MSE is calculated based on the variance of y ( k ) instead of e ( k ) . Hence, the MSE expression for signal enhancement is obtained as
ξ ( k ) = σ y 2 = E [ y 2 ( k ) ] = E [ ( w T ( k ) n 2 ( k ) ) 2 ] = σ n 2 2 ( k ) | | w ( k ) | | 2 2 .

2.3. Signal Prediction

In the signal prediction case, the desired signal is a delayed version x ( k + L ) of the input signal x ( k ) . Therefore, the error signal is
e ( k ) = x ( k + L ) w T ( k ) x ( k ) ,
and the MSE expression
ξ ( k ) = E [ e 2 ( k ) ] = E [ ( x ( k + L ) w T ( k ) x ( k ) ) 2 ]
give rise to a expression for the minimum MSE:
ξ min ( k ) = r ( 0 ) w o T r ( L ) r ( L + 1 ) r ( L + N )
where w o is the optimal coefficients of the predictor and r ( l ) = E [ x ( k ) x ( k l ) ] . Since in the prediction case ξ ( k ) = σ e 2 ξ min , Equation (25) can be used to obtain an estimate of σ e 2 at iteration k by replacing w o T by w ( k ) which are the coefficients of the adaptive filter at iteration k. We can estimate r ( l ) through r ( l ) = ζ r ( l 1 ) + ( 1 ζ ) x ( k ) x ( k l ) in which ζ is a forgetting factor.

2.4. System Identification

In the system identification, the desired signal can be formulated as
d ( k ) = w o T x ( k ) + n ( k )
where w o is the optimal coefficient, x ( k ) is the input vector and n ( k ) is the noise drawn from AWGN with zero mean and variance σ n 2 . Therefore, the MSE can be expressed as:
ξ ( k ) = E [ e 2 ( k ) ] = E [ n 2 ( k ) ] 2 E [ n ( k ) Δ w T ( k ) x ( k ) ] + E [ Δ w T ( k ) x ( k ) x T ( k ) Δ w ( k ) ]
where we define Δ w ( k ) = w ( k ) w o . Assuming that the noise and coefficients are uncorrelated, the second term in (27) is zero and we get the following expression
ξ ( k ) = σ n 2 + ξ exc ( k )
where ξ exc ( k ) is the excess MSE and E [ n 2 ( k ) ] = σ n 2 . As excess MSE tends to zero, the MSE expression for system identification, previously mentioned in (11), is rewritten as
ξ ( k ) = σ e 2 = ( 1 + ρ ) σ n 2 .

3. Data-Selective Adaptive Filtering Algorithms

We consider the Newton-based methods LMSN and LMSQN as well as the online CG algorithm to solve the objective function
ξ = 1 2 E [ e 2 ( k ) ] .
The Newton-based methods follow a second-order approximation of the objective function and hence perform the coefficient updating as
w ( k + 1 ) = w ( k ) μ ( k ) R ^ 1 g ^ w ( k ) ,
where R ^ and g ^ w ( k ) are estimates of the Hessian and gradient of the objective function, respectively. In fact, the LMSN and LMSQN minimize the objective function in (3).
The CG method, on the other hand, falls in between steepest descent and Newton methods. In the CG algorithm, the search is performed along conjugate directions which produces generally faster convergence than steepest descent methods. The coefficient updating is performed as
w ( k + 1 ) = w ( k ) α ( k ) c ( k ) ,
where the conjugate directions c ( k ) will be explained in more details in Section 3.2.

3.1. LMSN and LMSQN

Considering the same estimate of the gradient, g ^ w ( k ) = e ( k ) x ( k ) , used in the LMS algorithm and also a variable step-size, we end-up with the following recursive coefficient updating formula [2]
w ( k + 1 ) = w ( k ) + ν x T ( k ) R ^ 1 ( k ) x ( k ) R ^ 1 ( k ) x ( k ) e ( k ) ,
where μ ( k ) = ν / ( x T ( k ) R ^ 1 ( k ) x ( k ) ) is a step-size parameter in which ν is a positive constant and e ( k ) = d ( k ) w T ( k ) x ( k ) is the a priori error.
The only difference between LMSN and the LMSQN algorithms is the way of matrix R ^ 1 ( k ) is estimated. In the LMSN method, matrix R ^ ( k ) is estimated via a Robbins-Monro procedure resulting in the following update of its inverse, given by [2]
R ^ 1 ( k ) = 1 1 θ R ^ 1 ( k 1 ) R ^ 1 ( k 1 ) x ( k ) x T ( k ) R ^ 1 ( k 1 ) 1 θ θ + x T ( k ) R ^ 1 ( k ) x ( k ) ,
where θ is a weight factor. The LMSQN algorithm updates matrix R ^ 1 ( k ) by using the approach in [3] which ensures that R ^ 1 ( k ) remains positive definite and bounded for a bounded input signal. As a result, the estimate R ^ 1 ( k ) is obtained as
R ^ 1 ( k ) = R ^ 1 ( k 1 ) + ν 2 x T ( k ) R ^ 1 ( k 1 ) x ( k ) 1 ν R ^ 1 ( k 1 ) x ( k ) x T ( k ) R ^ 1 ( k 1 ) x T ( k ) R ^ 1 ( k 1 ) x ( k ) .
These algorithms have been analyzed more deeply through the use of theory and simulations in [2,3]. Although the estimate obtained by LMSN is accurate enough, it is not free of possible instability behavior. On the other hand, the LMSQN guarantees stability but can lead to poor estimations of R 1 .
Since the LMSN and LMSQN algorithms update the filter coefficients in the same manner, both utilizing estimates of R 1 , the excess MSE is also the same [3]. Hence, as proposed in [14], the expression of the excess MSE at steady-state for both DS-LMSN and DS-LMSQN algorithms can be written as the following approximation
ξ e x c ( k ) ν P up 2 ν P up σ n 2 , k .
As a result, we use a similar procedure to the one described in [18], in which the coefficient update of the DS-LMSN and DS-LMSQN algorithms are equivalent concerning their expected values. Hence, using this new update and by following the theoretical analysis demonstrated in [2], we obtain an approximation of the excess MSE at the steady-state in both algorithms. Thus, the value ρ can be obtained from the expression (36).
The steps of both DS-LMSN and DS-LMSQN algorithms are summarized in Algorithm 1, where the quantities t ( k ) and ψ ( k ) are included to simplify some steps in the computations.
Algorithm 1 Data-Selective LMSN and LMSQN algorithms
DS-LMSN and DS-LMSQN algorithms
 Initialize
0 < ν 1 , 0 < θ 1 (for LMSN), γ small positive constant,
w ( 0 ) = random vectors or zero vectors and R ^ 1 ( 0 ) = γ I L + 1
 Prescribe P up and choose τ max
τ = ( 1 + ρ ) Q 1 ( P up 2 )
 For prediction and equalizer use ρ = 0
 For system identification use ρ = ν P up 2 ν P up .
 Do for k > 0
  acquire x ( k ) and d ( k )
   e ( k ) = d ( k ) w T ( k ) x ( k )
   δ ( k ) = 0 , if τ e ( k ) σ e τ 0 , if | e ( k ) | σ e τ max 1 , otherwise
  if δ ( k ) = 0
    w ( k + 1 ) = w ( k )
   if | e ( k ) | σ e τ max
     e ( k ) = 0
     d ( k ) = 0
    end if
  else
    t ( k ) = R ^ 1 ( k 1 ) x ( k )
    ψ ( k ) = x T ( k ) t ( k )
    w ( k + 1 ) = w ( k ) + ν t ( k ) e ( k ) ψ ( k )
    R ^ 1 ( k ) = 1 1 θ R ^ 1 ( k 1 ) t ( k ) t T ( k ) 1 θ θ + ψ ( k ) , for LMSN
    R ^ 1 ( k ) = R ^ 1 ( k 1 ) + ν ν 2 ψ ( k ) 1 ψ ( k ) t ( k ) t T ( k ) , for LMSQN
  end if

3.2. Online Conjugate Gradient

Minimizing the objective function in (30) is equivalent to
min w 1 2 w T ( k + 1 ) R w ( k + 1 ) p T w ( k + 1 )
in which R = E [ x ( k ) x T ( k ) ] is the N × N autocorrelation matrix of the input signal and p = E [ d ( k ) x ( k ) ] is the cross-correlation vector between the input and reference signals. Similarly, our goal is to solve the linear equation
R w ( k + 1 ) = p .
The CG method can solve this problem by expressing the solution
w o = i = 0 N 1 α ( i ) c ( i )
in a basis formed by a set of vectors c i , i { 0 , N 1 } that present R -conjugacy, that is, c T ( i ) R c ( j ) = 0 for all i j . By premultiplying Equation (39) by c T ( k ) R and using conjugate definition:
c T ( k ) R w o = c T ( k ) R i = 0 N 1 α ( i ) c ( i ) = i = 0 N 1 α ( i ) c T ( k ) R c ( i ) = α ( k ) c T ( k ) R c ( k ) .
By replacing R w o = p in (40), we obtain an expression for the constant α at the kth iteration:
α ( k ) = c T ( k ) p c T ( k ) R c ( k ) .
Equation (39) can be evaluated as an iterative process in which a portion α ( k ) c ( k ) is added at the kth step:
w ( k + 1 ) = w ( k ) + α ( k ) c ( k ) .
As observed in [19], the estimation of the matrix R and vector p can be both computed using the exponentially decaying window, giving rise to Equations (43) and (44), respectively.
R ( k ) = λ R ( k 1 ) + x ( k ) x T ( k )
p ( k ) = λ p ( k 1 ) + d ( k ) x ( k )
Both estimations are also employed in RLS algorithm where λ represents a forgetting factor.
By applying the line search method as done in [19], another expression for α ( k ) can be achieved:
α ( k ) = η c T ( k ) g ( k 1 ) c T ( k ) R c ( k )
with ( λ 0.5 ) η λ to assure convergence. From Equations (42)–(44), we can obtain another expression for the negative gradient g ( k ) :
g ( k ) = p ( k ) R ( k ) w ( k + 1 ) = λ p ( k 1 ) + d ( k ) x ( k ) [ λ R ( k 1 ) + x ( k ) x T ( k ) ] [ w ( k ) + α ( k ) c ( k ) ] = λ g ( k 1 ) α ( k ) R ( k ) c ( k ) + x ( k ) e ( k )
where e ( k ) = d ( k ) x T ( k ) w ( k ) .
The next conjugate direction c ( k + 1 ) can be obtained as the current negative gradient g ( k ) corrected by a term comprising a linear combination of the previous direction vectors:
c ( k + 1 ) = g ( k ) + β ( k ) c ( k )
in which
β ( k ) = ( g ( k ) g ( k 1 ) ) T g ( k ) g T ( k 1 ) g ( k 1 )
is a constant calculated to guarantee R -conjugacy and improve performance as well.
As analyzed in [15], the CG and RLS algorithms are equivalent in steady-state and hence the excess MSE is also equivalent,
ξ e x c ( k ) ( N + 1 ) P up ( 1 λ ) 2 P up ( 1 λ ) σ n 2 , k .
in which the derivation is detailed in [1]. Thus, we can obtain ρ from Equation (36). As a result, we obtain the DS-CG summarized in Algorithm 2.
Algorithm 2 Data-Selective Conjugate Gradient algorithm
DS-CG algorithm
 Initialize
λ , η with ( λ 0 . 5 ) η λ , w ( 0 ) = random vectors or zero vectors
R 0 = I , g ( 0 ) = c ( 1 ) = z e r o s ( N + 1 , 1 ) , γ = small constant for regularization
 Prescribe P up , and choose τ max
τ = ( 1 + ρ ) Q 1 ( P up 2 )
 For prediction and equalizer use ρ = 0
 For system identification use ρ = ( N + 1 ) P up ( 1 λ ) 2 P up ( 1 λ ) .
 Do for k > 0
  acquire x ( k ) and d ( k )
   e ( k ) = d ( k ) w T ( k ) x ( k )
   δ ( k ) = 0 , if τ e ( k ) σ e τ 0 , if | e ( k ) | σ e τ max 1 , otherwise
  if δ ( k ) = 0
    w ( k + 1 ) = w ( k )
   if | e ( k ) | σ e τ max
     e ( k ) = 0
     d ( k ) = 0
   end if
  else
    R ( k ) = λ R ( k 1 ) + x ( k ) x T ( k )
    α ( k ) = η c T ( k ) g ( k 1 ) [ c T ( k ) R ( k ) c ( k ) + γ ]
    w ( k + 1 ) = w ( k ) + α ( k ) c ( k )
    g ( k ) = λ g ( k 1 ) α ( k ) R ( k ) c ( k ) + x ( k ) e ( k )
    β ( k ) = [ g ( k ) g ( k 1 ) ] T g ( k ) [ g T ( k 1 ) g ( k 1 ) + γ ]
    c ( k + 1 ) = g ( k ) + β ( k ) c ( k )
  end if

4. Simulation Results

In this section, we present simulations utilizing both synthetic and real-world data for the algorithms explained in the previous section in order to verify the impact on the performance when the data selection method is applied. Moreover, the desired probability of updating P up is varied between 0% and 100%, and it is compared to the measured probability of update P ^ up .

4.1. Simulation 1: Equalizer

In this subsection, the channel we want to equalize is one of the FIR channel impulse responses provided by The Signal Processing Information Base repository [20]. The complex channel taps were obtained from digital microwave radio systems measurements, and the FIR model frequency response is illustrated in black in Figure 2a. The transmitted signal s ( k ) , modeled as realizations of a Gaussian random variable with σ s 2 = 1 , transverses through the channel and it is corrupted by additive Gaussian noise with σ n 2 = 10 3 . The adaptive filter performs the equalization and its output is an equalized version of s ( k ) . Each complex version of the data-selective algorithm is applied and their frequency responses try to invert the channel behavior as illustrated in Figure 2a, for P up = 1 and P up = 0.45 . We used θ = 9 × 10 4 , γ = 1 and ν = 0.05 for both LMSN and LMSQN. For CG, we used λ = 0.9995 and η = 0.48 . The filter order is N = 100 . The error variance was estimated as in Equation (16) for b = 0.9999 . Since the channel coefficients are complex values, the threshold is computed as
τ = 2 ( 1 + ρ ) ln 1 P up
where ρ = 0 [1]. The estimated probability of updating obtained by each algorithm is quite close the prescribed P up , as depicted in Figure 2b. As can be seen in Figure 3, it is possible to obtain the transmitted signal with only 45 % of the input data with almost the same accuracy obtained when 100 % of the input data are used.

4.2. Simulation 2: Prediction

The dataset used in this subsection is taken from anemometer readings provided by GoogleâAZs RE < C Initiative [21]. The data consists of the wind’s speed recorded by five sensors on 25 May 2011. The dataset is split into 40 sets of size 8192 in order to use the Monte Carlo method.
The performance of the MSE is verified in Figure 4a using P up = 0.4 . The parameters for the DS-CG algorithm is λ = 0.98 and η = 0.48 . Both the DS-LMSN and DS-LMSQN algorithms employed ν = 0.1 and LMSN utilized θ = 0.1 . All algorithms obtain a similar convergence with 40 independent runs, but the DS-LMSQN algorithm achieves better performance due to its faster convergence to the steady state. The employed adaptive filter order is N = 7 .
In Figure 4b, the prescribed and observed probabilities of update are compared. We can observe that all DS algorithms obtained an observed probability of update close to the prescribed one.
The output of the prediction is illustrated in Figure 5a for P up = 0.4 and Figure 5b for P up = 0.7 between iterations 8000 and 8150. In both the cases, it was observed an acceptable performance in the prediction, leading us to conclude that even if we perform a reduced number of updates, data selection algorithms achieve an accurate prediction.

4.3. Simulation 3: System Identification

In this simulation, our problem is to identify an unknown channel impulse response, described as:
h = 0.1010 0.3030 0 0.2020 0.4040 0.7071 0.4040 0.2020 T .
The unknown system output is written as d ( k ) = H T x ( k ) + n ( k ) , where n ( k ) is a Gaussian noise with zero mean and variance σ n 2 = 10 3 . We consider two cases of input signals: a first-order and a fourth-order AR process, given by
x ( k ) = 0.88 x ( k 1 ) + n 1 ( k ) , x ( k ) = 0.55 x ( k 1 ) 1.221 x ( k 2 ) 0.49955 x ( k 3 ) 0.4536 x ( k 1 ) + n 2 ( k ) ,
where n 1 ( k ) and n 2 ( k ) are samples from a Gaussian noise uncorrelated with the additional noise n ( k ) . The variances σ n 1 2 and σ n 2 2 are set such as the input signal is of unit variance. The parameters employed in the system identification problem for conjugate gradient are λ = 0.98 and η = 0.48 , for both DS-LMSN and DS-LMSQN we set ν = 0.1 and for DS-LMSN θ = 0.1 . The filter order is N = 7 with the purpose of ensuring the convergence of the filter coefficients to the optimal coefficients due to channel size.
The learning curves of the algorithms are compared in Figure 6a for a prescribed probability of update P up = 0.4 and first-order AR input signal. It can be noted that all algorithms achieve good performance even with a smaller amount of update. The DS-CG algorithm attains better performance than the DS-LMSN and DS-LMSQN since it converges faster to the steady-state. The observed P ^ up and the prescribed P up probabilities of update are depicted in Figure 6b. In all cases, these values are close, except at low values of P up where we obtained a bit more updates than the ones prescribed. By using a fourth-order AR process as input signal in Figure 7, the results are similar to the first-order AR, confirming the expected robustness with respect to the statistical properties of the input signal, as long as the rank of its autocorrelation matrix does not become too small.
In another example utilizing a fourth-order AR input signal, we included an outlier signal affecting the reference signal 1% of the time with an amplitude equal to five. The desired P up = 0.3 was set, and we measured the misalignment in the adaptive filter coefficients, defined as w ( k ) w o w o where w o represents the optimal vector of coefficients, for the algorithms discussed in the paper. As observed in Table 1, the misalignment is higher when ignoring the outliers and that the level of misalignment achieved by considering outliers for P up = 0.1 matches the one for P up = 0.3 addressing the outliers. It is also possible to verify that the proposed solutions approach the solution when the algorithms are updated all the time.

5. Conclusions

In this work, the data-selective versions of the LMSN, LMSQN and CG algorithms were explored in different applications. The key idea is providing a systematic form to prescribe the probability of update through a simple statistical model, where the environment data is classified as innovative, non-innovative, and outlier. The data-selection can not only reduce the computational complexity but also enhance the estimation accuracy when outliers are present. Simulation results on both real and synthetic data show that the data selection strategy works for all types of applications of adaptive filtering. Future work will address the extension of the data-selection approach to a broader class of learning algorithms as well as its effectiveness in distributed adaptive networks.

Author Contributions

The authors worked jointly on the concepts, validation, writing, and simulations.

Funding

This study was financed in part by the Coordenação de Aperfeiçoamento de Pessoal de Nível Superior—Brasil (CAPES)—Finance Code 001 and CNPq Universal 431381/2016-0. This work was also supported by the research council FAPERJ (Fundação de Amparo à Pesquisa do Estado do Rio de Janeiro). This work was supported in part by FNR, Luxembourg under the project CORE ECLECTIC.

Conflicts of Interest

The authors declare no conflict of interest.

References

  1. Diniz, P.S.R. On Data-Selective Adaptive Filtering. IEEE Trans. Signal Process. 2018, 66, 4239–4252. [Google Scholar] [CrossRef]
  2. Diniz, P.S.R.; de Campos, M.L.R.; Antoniou, A. Analysis of LMS-Newton adaptive filtering algorithms with variable convergence factor. IEEE Trans. Signal Process. 1995, 43, 617–627. [Google Scholar] [CrossRef]
  3. De Campos, M.L.R.; Antoniou, A. A new quasi-Newton adaptive filtering algorithm. IEEE Trans. Circuits Syst. II Analog. Digit. Signal Process. 1997, 44, 924–934. [Google Scholar] [CrossRef]
  4. Antoniou, A.; Lu, W.S. Practical Optimization—Algorithms and Engineering Applications; Springer: New York, NY, USA, 2007. [Google Scholar]
  5. Fletcher, R. Practical Methods of Optimization, 2nd ed.; John Wiley & Sons: Cornwall, UK, 2013. [Google Scholar]
  6. Apolinário, J.A.; de Campos, M.L.R.; Bernal O, C.P. The constrained conjugate gradient algorithm. IEEE Signal Process. Lett. 2000, 7, 351–354. [Google Scholar] [CrossRef]
  7. Hull, A.W.; Jenkins, W.K. Preconditioned conjugate gradient methods for adaptive filtering. In Proceedings of the IEEE International Sympoisum on Circuits and Systems, Singapore, 11–14 June 1991; pp. 540–543. [Google Scholar]
  8. Chen, Z.; Li, H.; Rangaswamy, M. Conjugate gradient adaptive matched filter. IEEE Trans. Aerosp. Electron. Syst. 2015, 51, 178–191. [Google Scholar] [CrossRef]
  9. Zhang, M.; Zhang, A.; Yang, Q. Robust Adaptive Beamforming Based on Conjugate Gradient Algorithms. IEEE Trans. Signal Process. 2016, 4, 6046–6057. [Google Scholar] [CrossRef]
  10. Marshall, D.F.; Jenkins, W.K. A fast quasi-Newton adaptive filtering algorithm. IEEE Trans. Signal Process. 1992, 40, 1652–1662. [Google Scholar] [CrossRef]
  11. Glentis, G.; Berberidis, K.; Theodoridis, S. Efficient least squares adaptive algorithms for FIR transversal filtering. IEEE Signal Process. Mag. 1999, 16, 13–41. [Google Scholar] [CrossRef]
  12. Farhang-Boroujeny, B. Fast LMS/Newton algorithms based on autoregressive modeling and their application to acoustic echo cancellation. IEEE Trans. Signal Process. 1997, 45, 1987–2000. [Google Scholar] [CrossRef]
  13. Albu, F.; Paleologu, C. The Variable Step-Size Gauss-Seidel Pseudo Affine Projection Algorithm. Int. J. Math. Comput. Phys. Electr. Comput. Eng. 2009, 3, 27–30. [Google Scholar]
  14. Tsinos, C.G.; Diniz, P.S.R. Data-Selective Lms-Newton And Lms-Quasi-Newton Algorithms. Unpublished work. 2019; under review. [Google Scholar]
  15. Diniz, P.S.R.; Mendonça, M.O.K.; Ferreira, J.O.; Ferreira, T.N. Data-Selective Conjugate Gradient Algorithm. In Proceedings of the Eusipco: European Signal Processing Conference, Rome, Italy, 3–7 September 2018. [Google Scholar]
  16. Papoulis, A.; Pillai, S.U. Probability, Random Variables, and Stochastic Processes; McGraw-Hill Education: New York, NY, USA, 2002. [Google Scholar]
  17. Miller, S.; Childers, D. Probability, and Random Processes, 2nd ed.; Academic Press: Oxford, UK, 2012. [Google Scholar]
  18. Lima, M.; Diniz, P. Steady-state MSE performance of the set-membership affine projection algorithm. Circuits Syst. Signal Process. 2013, 32, 1811–1837. [Google Scholar] [CrossRef]
  19. Chang, P.S.; Willson, A.N., Jr. Analysis of conjugate gradient algorithms for adaptive filtering. IEEE Trans. Signal Process. 2000, 48, 409–418. [Google Scholar] [CrossRef]
  20. SPIB. Signal Processing Information Base. Available online: http://spib.linse.ufsc.br/microwave.html (accessed on 29 November 2018).
  21. Google. RE < C: Surface Level Wind Data Collection, Google Code. Available online: http://code.google.com/p/google-rec-csp/ (accessed on 29 November 2018).
Figure 1. Data selection strategy.
Algorithms 12 00004 g001
Figure 2. Simulation 1: (a) Frequency response of the channel and the data-selective filters (b) Comparison between the desired P up and achieved P ^ up L M S N , P ^ up L M S Q N and P ^ up C G by the data-selection algorithms.
Algorithms 12 00004 g002
Figure 3. Simulation 1: Comparison between the transmitted and the recovered signal by the DS-CG, DS-LMSQN and DS-LMSN algorithms for (a) P up = 0.45 and (b) P up = 1 .
Algorithms 12 00004 g003
Figure 4. Simulation 2: (a) Learning curves for the data selection and (b) Comparison between the desired P up and achieved P ^ up L M S N , P ^ up L M S Q N and P ^ up C G by the data-selection algorithms.
Algorithms 12 00004 g004
Figure 5. Simulation 2: Comparison between the desired signal and the predicted by the DS-CG, DS-LMSQN and DS-LMSN algorithms for (a) P up = 0.4 and (b) P up = 0.7 .
Algorithms 12 00004 g005
Figure 6. Simulation 3 for first-order AR input signal: (a) Learning curves for the data selection and (b) Comparison between the desired P up and achieved P ^ up L M S N , P ^ up L M S Q N and P ^ up C G by the data-selection algorithms.
Algorithms 12 00004 g006
Figure 7. Simulation 3 for fourth-order AR input signal: (a) Learning curves for the data selection and (b) Comparison between the desired P up and achieved P ^ up L M S N , P ^ up L M S Q N and P ^ up C G by the data-selection algorithms.
Algorithms 12 00004 g007
Table 1. Misalignment with outliers, in dBs.
OutlierYesYesYesNo
τ max onyesnoyesno
P up 0.30.30.11
DS-CG−33.29−15.25−30.47−33.37
AverageDS-LMSQN−32.75−15.42−32.45−32.80
Misalignment (dB)DS-LMSN−31.17−13.81−30.39−31.91

