
An Improved Artificial Bee Colony for Feature Selection in QSAR


Abstract
:1. Introduction
- (1)
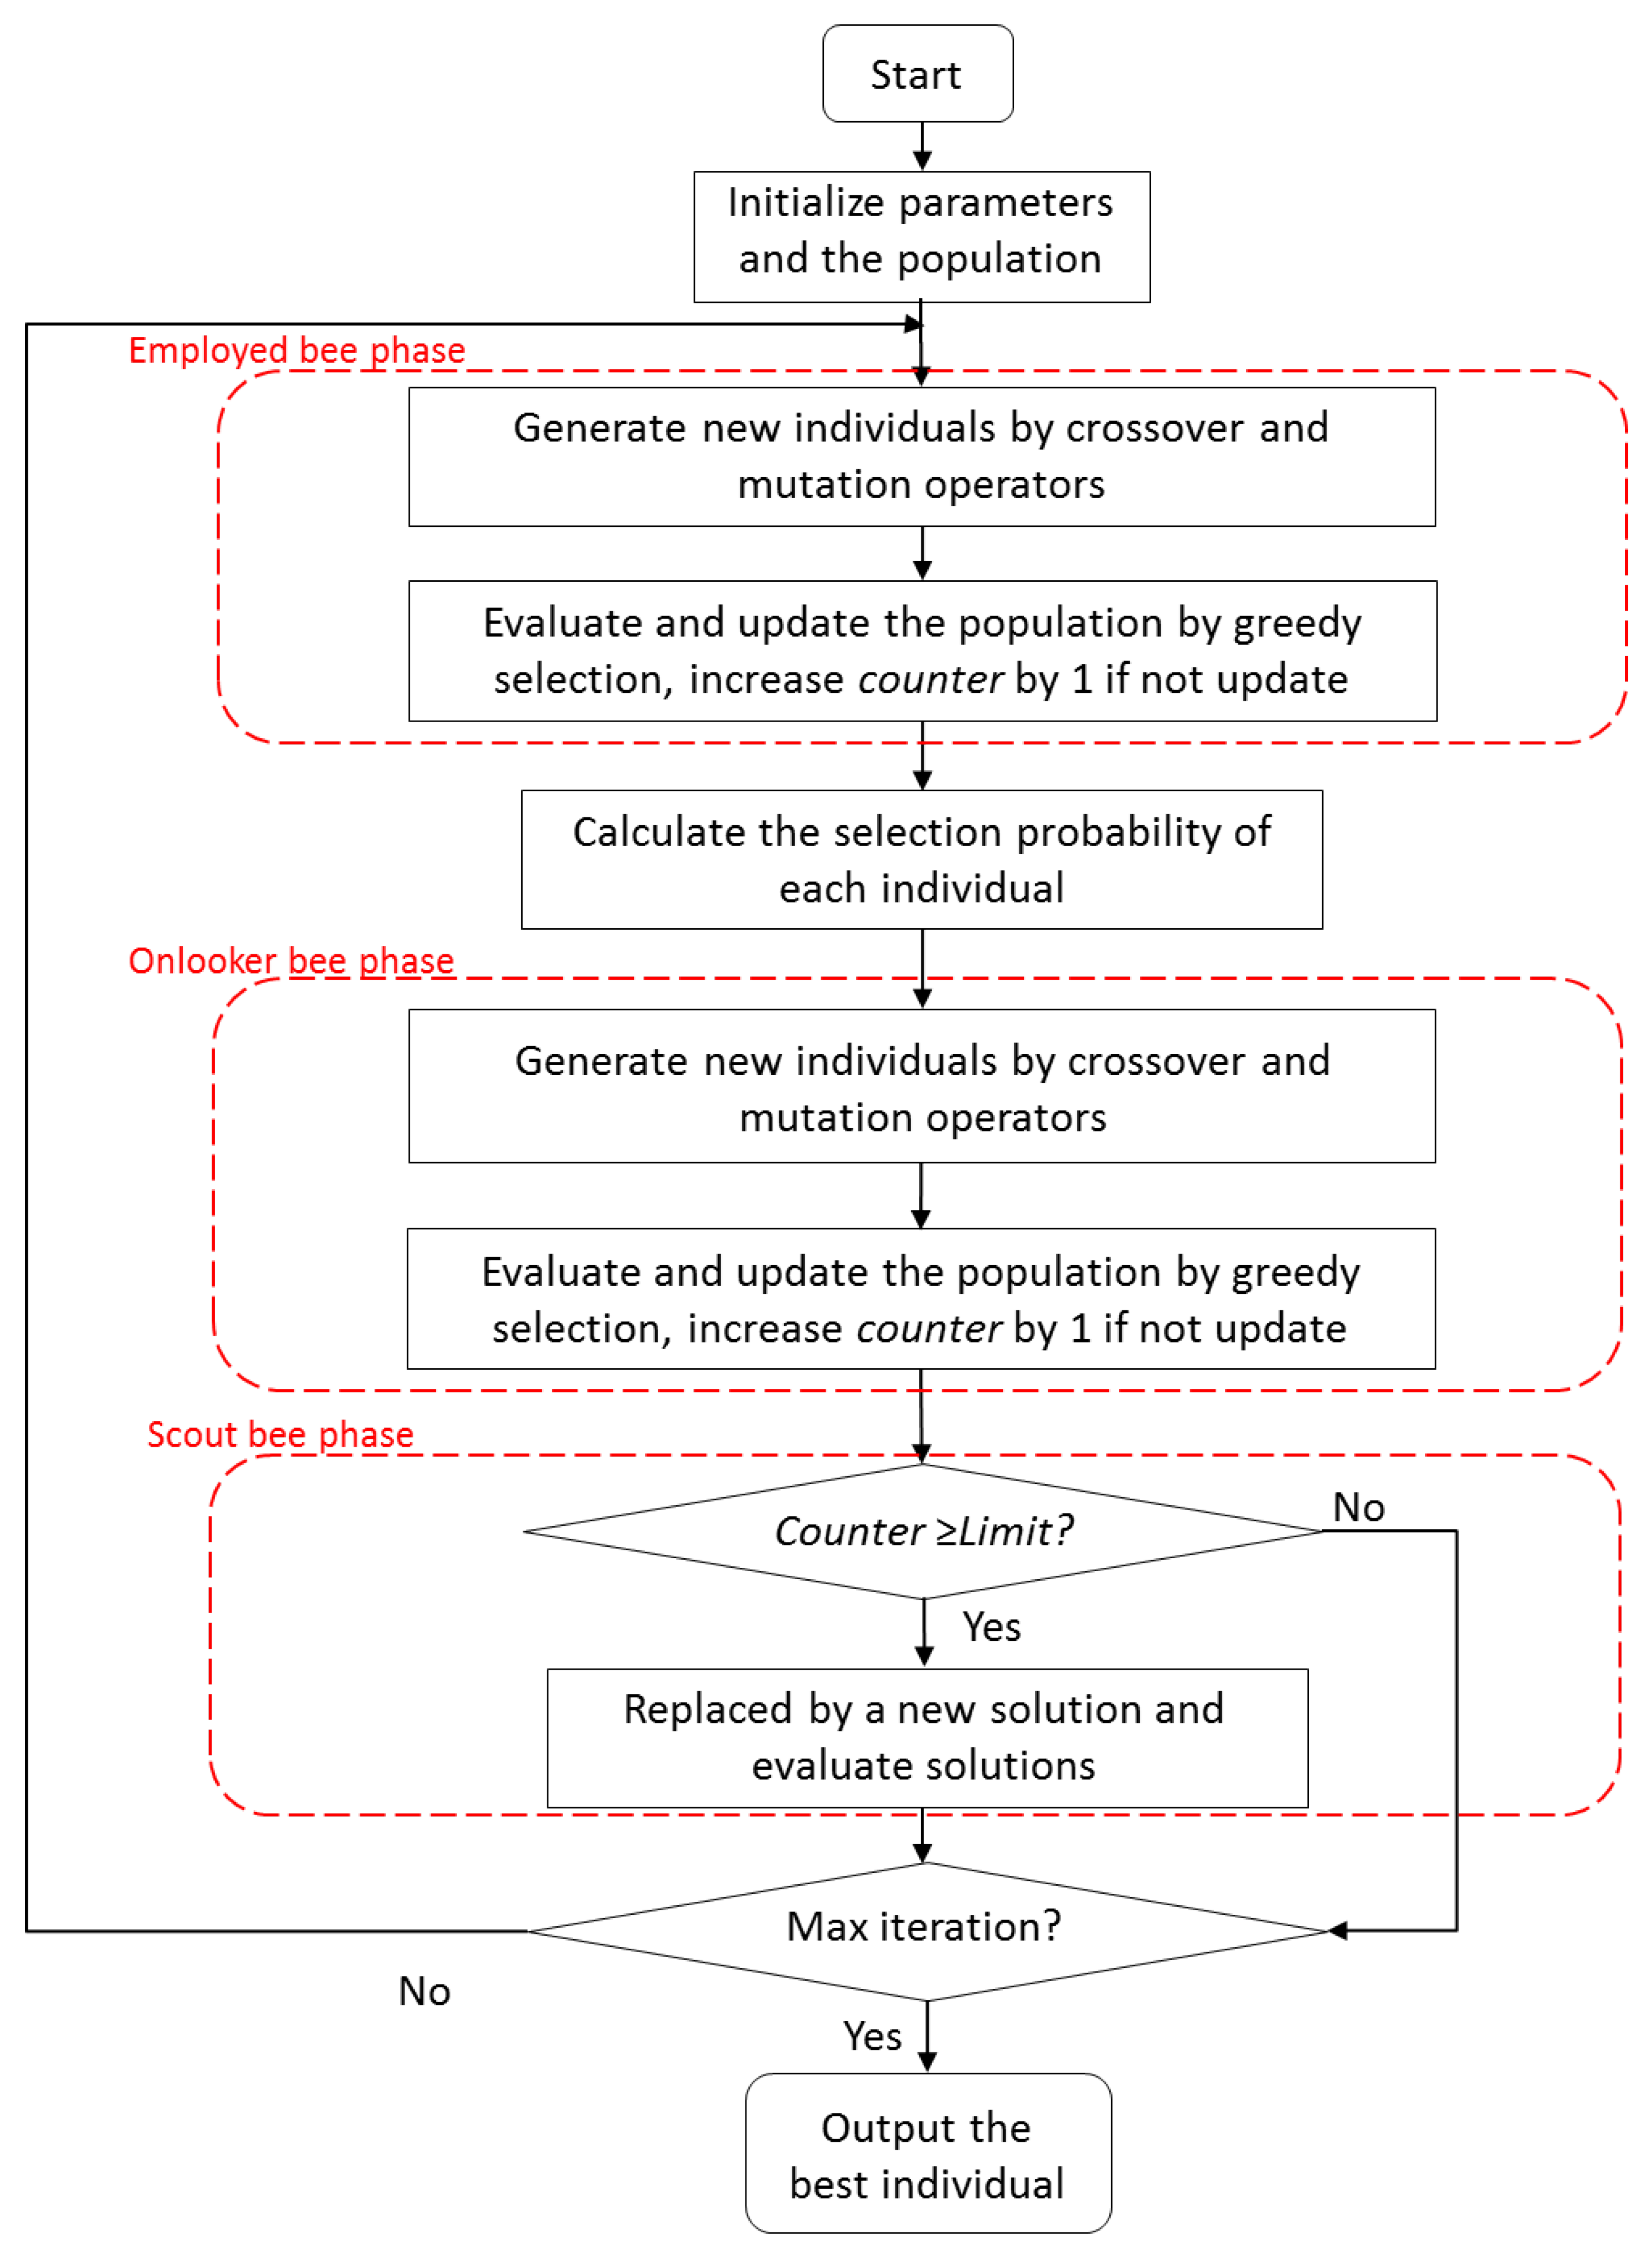
- To save the process of converting continuous space into discrete space and reduce the consumption of computing resources, a two-point crossover operator and a two-way mutation operator are employed to generate food sources in employed bee phase and onlooker bee phase.
- (2)
- To achieve fast convergence, a novel greedy selection strategy is employed to greatly reduce the possibility of food sources being abandoned.
- (3)
- Furthermore, we investigate the influence of different threshold values that determine whether to implement the scout bee phase on the performance of QSAR and draw an interesting conclusion that the scout bee phase is redundant when dealing with the feature selection in low-dimensional and medium-dimensional regression problem.
2. Related Work
3. Preliminaries
3.1. QSAR Modeling
3.2. Feature Selection
4. The Proposed Method
4.1. The Basic Artificial Bee Colony Algorithm
4.2. ABC Algorithm for FS in QSAR
| Algorithm 1 Pseudo code of the ABC-PLS algorithm |
| Input: Population size , Maximum number of iterations , Abandonment limit L, , . Output: The optimal food source , the best fitness value .
|
4.3. An Improved ABC Algorithm for FS in QSAR
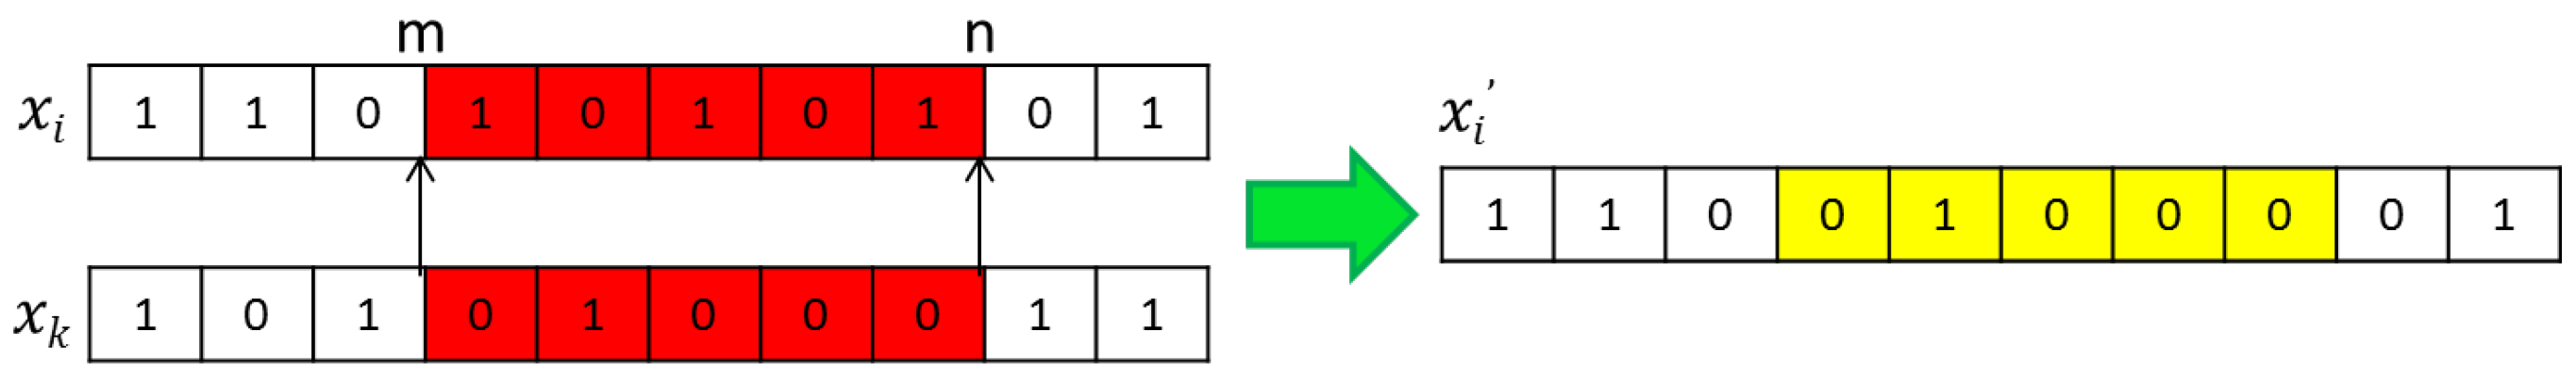
4.3.1. Two-Point Crossover
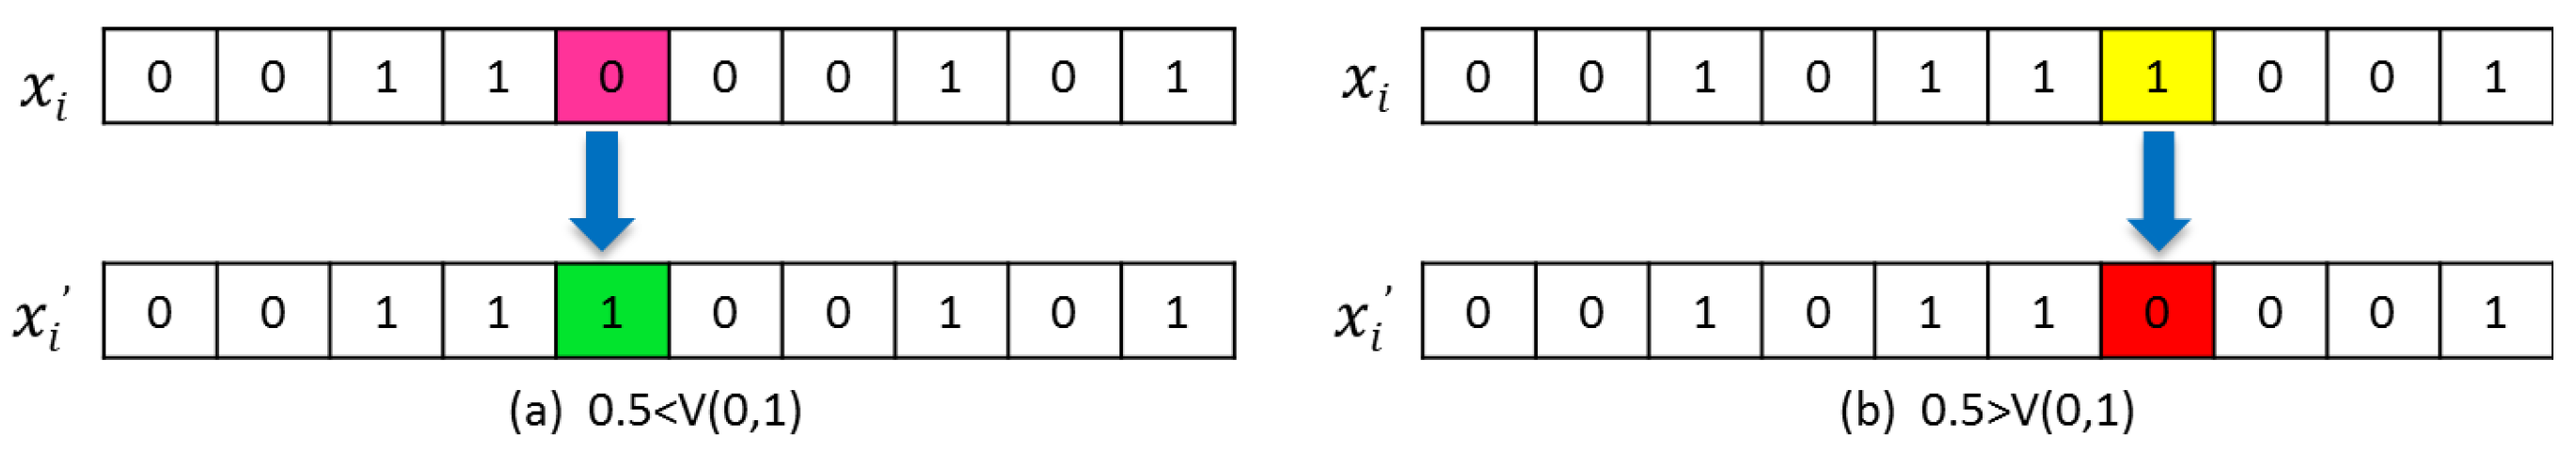
4.3.2. Two-Way Mutation Operator
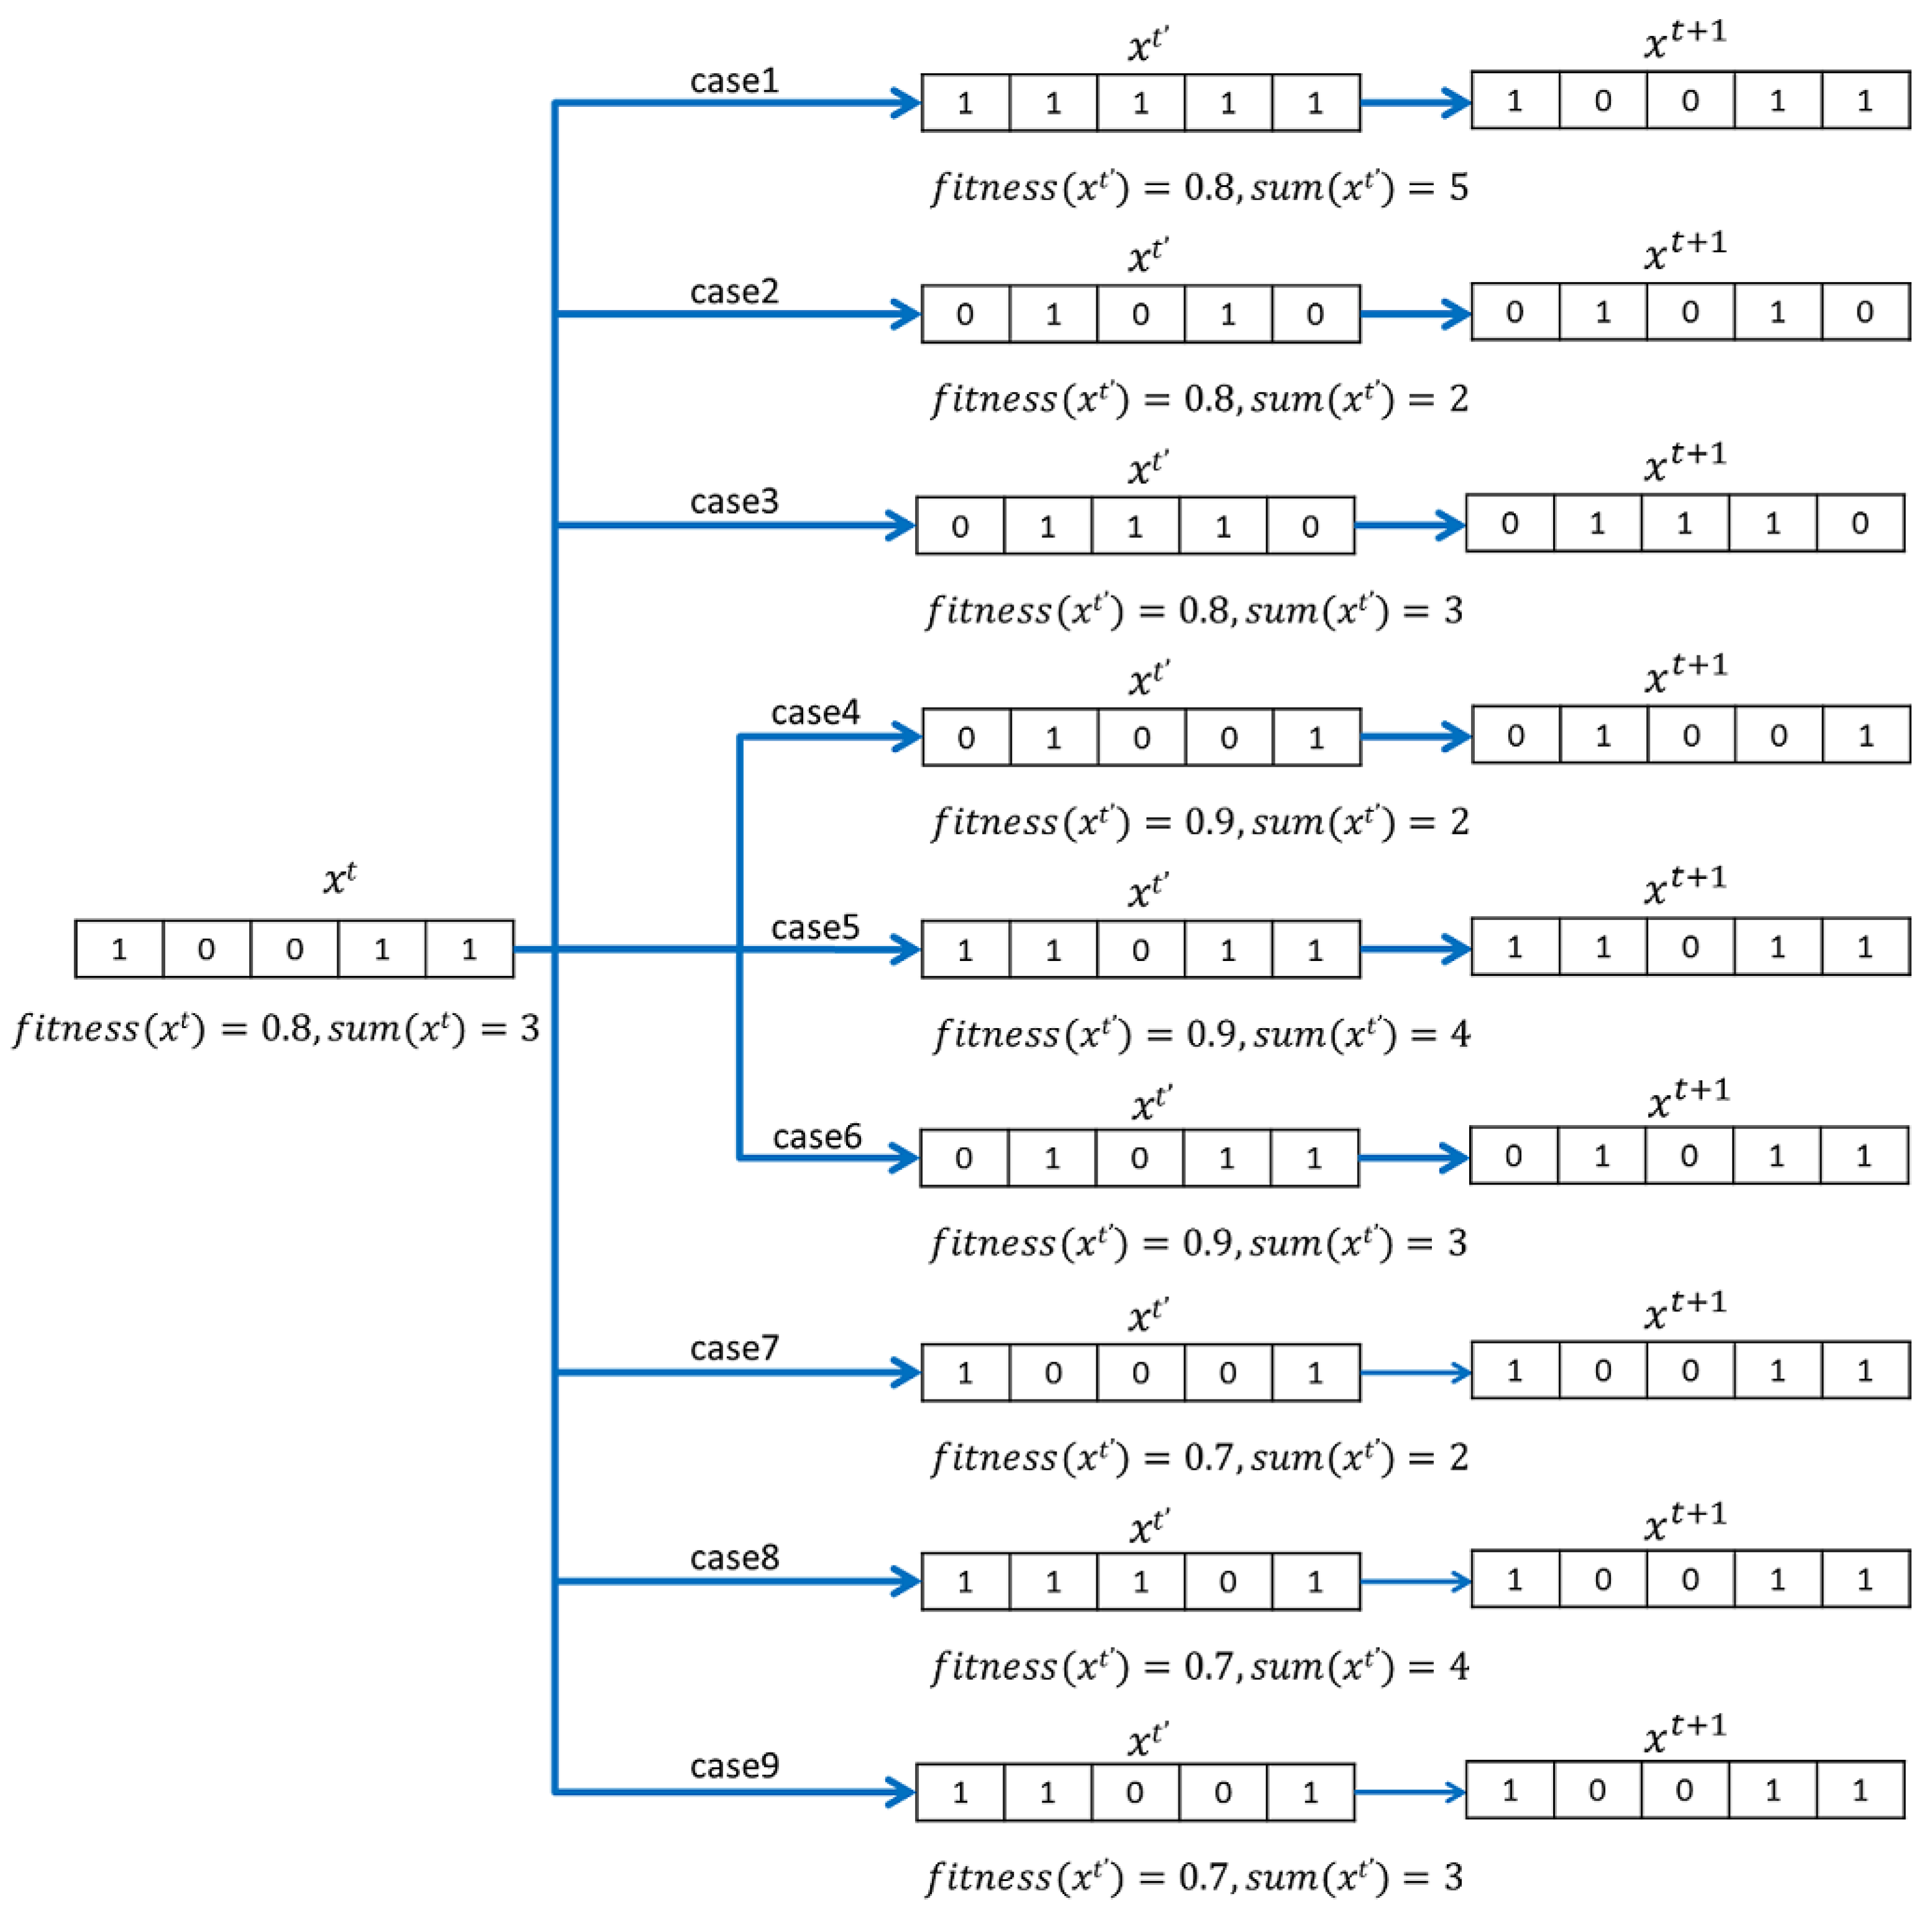
4.3.3. Novel Greedy Selection Strategy
| Algorithm 2 Pseudo code of the ABC-PLS-1 algorithm |
| Input: Population size , Maximum number of iterations , Abandonment limit L, , . Output: The optimal food source , the best fitness value .
|
5. Experimental Design
5.1. Datasets and Parameters
5.2. Performance Metric
6. Experimental Results and Analysis
7. Conclusions
Author Contributions
Funding
Institutional Review Board Statement
Informed Consent Statement
Data Availability Statement
Conflicts of Interest
References
- Toropov, A.A.; Toropova, A.P. QSPR/QSAR: State-of-Art, Weirdness, the Future. Molecules 2020, 25, 1292. [Google Scholar] [CrossRef] [Green Version]
- Shahlaei, M. Descriptor Selection Methods in Quantitative Structure—Activity Relationship Studies: A Review Study. Chem. Rev. 2013, 113, 8093–8103. [Google Scholar] [CrossRef]
- Ponzoni, I.; Sebastián-Pérez, V.; Diaz, M. Hybridizing Feature Selection and Feature Learning Approaches in QSAR Modeling for Drug Discovery. Sci. Rep. 2017, 7, 2403. [Google Scholar] [CrossRef] [PubMed] [Green Version]
- Qin, Z.; Wang, M.; Yan, A. QSAR studies of the bioactivity of hepatitis C virus (HCV) NS3/4A protease inhibitors by multiple linear regression (MLR) and support vector machine (SVM). Bioorg. Med. Chem. Lett. 2017, 27, 2931–2938. [Google Scholar] [CrossRef]
- Smola, A.J.; Schölkopf, B. A tutorial on support vector regression. Stat. Comput. 2004, 14, 199–222. [Google Scholar] [CrossRef] [Green Version]
- Hayashi, Y.; Oishi, T.; Shirotori, K.; Marumo, Y.; Kosugi, A.; Kumada, S.; Hirai, D.; Takayama, K.; Onuki, Y. Modeling of quantitative relationships between physicochemical properties of active pharmaceutical ingredients and tensile strength of tablets using a boosted tree. Drug Dev. Ind. Pharm. 2018, 44, 1090–1098. [Google Scholar] [CrossRef] [PubMed]
- Li, Y.; Peng, J.; Li, P.; Du, H.; Li, Y.; Liu, X.; Zhang, L.; Wang, L.L.; Zuo, Z. Identification of potential AMPK activator by pharmacophore modeling, molecular docking and QSAR study. Comput. Biol. Chem. 2019, 79, 165–176. [Google Scholar] [CrossRef] [PubMed]
- Hasanloei, M.A.V.; Sheikhpour, R.; Sarram, M.A.; Sheikhpour, E.; Sharifi, H. A combined Fisher and Laplacian score for feature selection in QSAR based drug design using compounds with known and unknown activities. J. Comput. Aided Mol. Des. 2018, 32, 375–384. [Google Scholar] [CrossRef]
- Martínez, M.J.; Dussaut, J.S.; Ponzoni, I. Biclustering as Strategy for Improving Feature Selection in Consensus QSAR Modeling. Electron. Notes Discret. Math. 2018, 69, 117–124. [Google Scholar] [CrossRef]
- Yang, X.; Wang, Y.; Byrne, R.; Schneider, G.; Yang, S. Concepts of artificial intelligence for computer-assisted drug discovery. Chem. Rev. 2019, 119, 10520–10594. [Google Scholar] [CrossRef] [Green Version]
- Kwon, S.; Bae, H.; Jo, J.; Yoon, S. Comprehensive ensemble in QSAR prediction for drug discovery. BMC Bioinform. 2019, 20, 1–12. [Google Scholar] [CrossRef]
- Ezzat, A.; Wu, M.; Li, X.; Kwoh, C.K. Computational prediction of drug-target interactions via ensemble learning. In Computational Methods for Drug Repurposing; Humana Press: New York, NY, USA, 2019; pp. 239–254. [Google Scholar] [CrossRef]
- Cao, D.S.; Deng, Z.K.; Zhu, M.F.; Yao, Z.J.; Dong, J.; Zhao, R.G. Ensemble partial least squares regression for descriptor selection, outlier detection, applicability domain assessment, and ensemble modeling in QSAR/QSPR modeling. J. Chemom. 2017, 31, e2922. [Google Scholar] [CrossRef]
- Liu, Y.; Guo, Y.; Wu, W.; Xiong, Y.; Sun, C.; Yuan, L.; Li, M. A machine learning-based QSAR model for benzimidazole derivatives as corrosion inhibitors by incorporating comprehensive feature selection. Interdiscip. Sci. Comput. Life Sci. 2019, 11, 738–747. [Google Scholar] [CrossRef]
- Fu, L.; Liu, L.; Yang, Z.J.; Li, P.; Ding, J.J.; Yun, Y.H.; Lu, A.P.; Hou, T.J.; Cao, D.S. Systematic Modeling of log D 7.4 Based on Ensemble Machine Learning, Group Contribution, and Matched Molecular Pair Analysis. J. Chem. Inf. Model. 2020, 60, 63–76. [Google Scholar] [CrossRef] [PubMed]
- Lin, W.Q.; Jiang, J.H.; Shen, Q.; Shen, G.L.; Yu, R.Q. Optimized Block-wise Variable Combination by Particle Swarm Optimization for Partial Least Squares Modeling in Quantitative Structure- Activity Relationship Studies. J. Chem. Inf. Model. 2005, 45, 486–493. [Google Scholar] [CrossRef] [PubMed]
- Danishuddin; Khan, A.U. Descriptors and their selection methods in QSAR analysis: paradigm for drug design. Drug Discov. Today 2016, 21, 1291–1302. [Google Scholar] [CrossRef] [PubMed]
- Avalos, O.; Cuevas, E.; Gálvez, J.; Houssein, E.H.; Hussain, K. Comparison of Circular Symmetric Low-Pass Digital IIR Filter Design Using Evolutionary Computation Techniques. Mathematics 2020, 8, 1226. [Google Scholar] [CrossRef]
- Xue, B.; Zhang, M.; Browne, W.N.; Yao, X. A survey on evolutionary computation approaches to feature selection. IEEE Trans. Evol. Comput. 2016, 20, 606–626. [Google Scholar] [CrossRef] [Green Version]
- Kramer, O. Genetic algorithms. In Genetic Algorithm Essentials; Springer: Cham, Switzerland, 2017; pp. 11–19. [Google Scholar] [CrossRef]
- Das, S.; Mullick, S.S.; Suganthan, P. Recent advances in differential evolution—An updated survey. Swarm Evol. Comput. 2016, 27, 1–30. [Google Scholar] [CrossRef]
- Ma, H.; Simon, D.; Siarry, P.; Yang, Z.; Fei, M. Biogeography-Based Optimization: A 10-Year Review. IEEE Trans. Emerg. Top. Comput. 2017, 1, 391–407. [Google Scholar] [CrossRef]
- Yao, X.; Liu, Y.; Lin, G. Evolutionary programming made faster. IEEE Trans. Evol. Comput. 1999, 3, 82–102. [Google Scholar] [CrossRef] [Green Version]
- Dorigo, M.; Gambardella, L.M. Ant colony system: A cooperative learning approach to the traveling salesman problem. IEEE Trans. Evol. Comput. 1997, 1, 53–66. [Google Scholar] [CrossRef] [Green Version]
- Yang, X.S. A new metaheuristic bat-inspired algorithm. In Nature Inspired Cooperative Strategies for Optimization (NICSO 2010); Springer: Berlin/Heidelberg, Germany, 2010; pp. 65–74. [Google Scholar] [CrossRef] [Green Version]
- Tilahun, S.L.; Ngnotchouye, J.M.T.; Hamadneh, N.N. Continuous versions of firefly algorithm: A review. Artif. Intell. Rev. 2019, 51, 445–492. [Google Scholar] [CrossRef]
- Bulatović, R.R.; Đorđević, S.R.; Đorđević, V.S. Cuckoo Search algorithm: A metaheuristic approach to solving the problem of optimum synthesis of a six-bar double dwell linkage. Mech. Mach. Theory 2013, 61, 1–13. [Google Scholar] [CrossRef]
- Pierezan, J.; Coelho, L.D.S. Coyote optimization algorithm: A new metaheuristic for global optimization problems. In Proceedings of the 2018 IEEE Congress on Evolutionary Computation (CEC), Rio de Janeiro, Brazil, 8–13 July 2018; pp. 1–8. [Google Scholar] [CrossRef]
- Niccolai, A.; Grimaccia, F.; Mussetta, M.; Zich, R. Optimal task allocation in wireless sensor networks by means of social network optimization. Mathematics 2019, 7, 315. [Google Scholar] [CrossRef] [Green Version]
- Rostami, M.; Berahmand, K.; Nasiri, E.; Forouzande, S. Review of swarm intelligence-based feature selection methods. Eng. Appl. Artif. Intell. 2021, 100, 104210. [Google Scholar] [CrossRef]
- Nguyen, B.H.; Xue, B.; Zhang, M. A survey on swarm intelligence approaches to feature selection in data mining. Swarm Evol. Comput. 2020, 54, 100663. [Google Scholar] [CrossRef]
- Karaboga, D. An Idea Based on Honey Bee Swarm for Numerical Optimization, Technical Report—TR06; Technical Report; Erciyes University: Kayseri, Turkey, 2005. [Google Scholar]
- Karaboga, D.; Akay, B. A comparative study of Artificial Bee Colony algorithm. Appl. Math. Comput. 2009, 214, 108–132. [Google Scholar] [CrossRef]
- Özger, Z.B.; Bolat, B.; Dırı, B. A comparative study on binary Artificial Bee Colony optimization methods for feature selection. In Proceedings of the 2016 International Symposium on INnovations in Intelligent SysTems and Applications (INISTA), Sinaia, Romania, 2–5 August 2016; pp. 1–4. [Google Scholar] [CrossRef]
- Jia, D.; Duan, X.; Khan, M.K. Binary Artificial Bee Colony optimization using bitwise operation. Comput. Ind. Eng. 2014, 76, 360–365. [Google Scholar] [CrossRef]
- Liu, W.; Chen, H. BABC: A Binary Version of Artificial Bee Colony Algorithm for Discrete Optimization. Int. J. Adv. Comput. Technol. 2012, 4, 307–314. [Google Scholar] [CrossRef]
- He, Y.; Xie, H.; Wong, T.L.; Wang, X. A novel binary artificial bee colony algorithm for the set-union knapsack problem. Future Gener. Comput. Syst. 2018, 78, 77–86. [Google Scholar] [CrossRef]
- Mandala, M.; Gupta, C.P. Binary Artificial Bee Colony Optimization for GENCOs’ Profit Maximization under Pool Electricity Market. Int. J. Comput. Appl. 2014, 90, 34–42. [Google Scholar] [CrossRef]
- Zorarpacı, E.; Özel, S.A. A hybrid approach of differential evolution and artificial bee colony for feature selection. Expert Syst. Appl. 2016, 62, 91–103. [Google Scholar] [CrossRef]
- Shunmugapriya, P.; Kanmani, S. A hybrid algorithm using ant and bee colony optimization for feature selection and classification (AC-ABC Hybrid). Swarm Evol. Comput. 2017, 36, 27–36. [Google Scholar] [CrossRef]
- Ghanem, W.; Jantan, A. Novel multi-objective artificial bee colony optimization for wrapper based feature selection in intruction detectoin. Int. J. Adv. Soft Comput. Appl. 2016, 8, 70–81. [Google Scholar]
- Wolpert, D.H.; Macready, W.G. No free lunch theorems for optimization. IEEE Trans. Evol. Comput. 1997, 1, 67–82. [Google Scholar] [CrossRef] [Green Version]
- Rostami, M.; Forouzandeh, S.; Berahmand, K.; Soltani, M. Integration of multi-objective PSO based feature selection and node centrality for medical datasets. Genomics 2020, 112, 4370–4384. [Google Scholar] [CrossRef] [PubMed]
- Neggaz, N.; Ewees, A.A.; Elaziz, M.A.; Mafarja, M. Boosting salp swarm algorithm by sine cosine algorithm and disrupt operator for feature selection. Expert Syst. Appl. 2020, 145, 113103. [Google Scholar] [CrossRef]
- Mafarja, M.; Mirjalili, S. Whale optimization approaches for wrapper feature selection. Appl. Soft Comput. 2018, 62, 441–453. [Google Scholar] [CrossRef]
- Rao, H.; Shi, X.; Rodrigue, A.K.; Feng, J.; Xia, Y.; Elhoseny, M.; Yuan, X.; Gu, L. Feature selection based on artificial bee colony and gradient boosting decision tree. Appl. Soft Comput. 2019, 74, 634–642. [Google Scholar] [CrossRef]
- Jain, I.; Jain, V.K.; Jain, R. Correlation feature selection based improved-Binary Particle Swarm Optimization for gene selection and cancer classification. Appl. Soft Comput. 2018, 62, 203–215. [Google Scholar] [CrossRef]
- Prasad, Y.; Biswas, K.; Hanmandlu, M. A recursive PSO scheme for gene selection in microarray data. Appl. Soft Comput. 2018, 71, 213–225. [Google Scholar] [CrossRef]
- Li, Y.; Wang, G.; Chen, H.; Shi, L.; Qin, L. An ant colony optimization based dimension reduction method for high-dimensional datasets. J. Bionic Eng. 2013, 10, 231–241. [Google Scholar] [CrossRef]
- Yan, C.; Liang, J.; Zhao, M.; Zhang, X.; Zhang, T.; Li, H. A novel hybrid feature selection strategy in quantitative analysis of laser-induced breakdown spectroscopy. Anal. Chim. Acta 2019, 1080, 35–42. [Google Scholar] [CrossRef] [PubMed]
- Ballabio, D.; Consonni, V.; Mauri, A.; Claeys-Bruno, M.; Sergent, M.; Todeschini, R. A novel variable reduction method adapted from space-filling designs. Chemom. Intell. Lab. Syst. 2014, 136, 147–154. [Google Scholar] [CrossRef]
- Zhang, T.; Ding, B.; Zhao, X.; Yue, Q. A Fast Feature Selection Algorithm Based on Swarm Intelligence in Acoustic Defect Detection. IEEE Access 2018, 6, 28848–28858. [Google Scholar] [CrossRef]
- Selvakumar, B.; Muneeswaran, K. Firefly algorithm based feature selection for network intrusion detection. Comput. Secur. 2019, 81, 148–155. [Google Scholar] [CrossRef]
- Larabi Marie-Sainte, S.; Alalyani, N. Firefly Algorithm based Feature Selection for Arabic Text Classification. J. King Saud Univ. Comput. Inf. Sci. 2020, 32, 320–328. [Google Scholar] [CrossRef]
- Zhang, L.; Mistry, K.; Lim, C.P.; Neoh, S.C. Feature selection using firefly optimization for classification and regression models. Decis. Support Syst. 2018, 106, 64–85. [Google Scholar] [CrossRef] [Green Version]
- Kumar, V.; De, P.; Ojha, P.K.; Saha, A.; Roy, K. A Multi-layered Variable Selection Strategy for QSAR Modeling of Butyrylcholinesterase Inhibitors. Curr. Top. Med. Chem. 2020, 20, 1601–1627. [Google Scholar] [CrossRef]
- Shen, Q.; Jiang, J.H.; Jiao, C.X.; li Shen, G.; Yu, R.Q. Modified particle swarm optimization algorithm for variable selection in MLR and PLS modeling: QSAR studies of antagonism of angiotensin II antagonists. Eur. J. Pharm. Sci. 2004, 22, 145–152. [Google Scholar] [CrossRef]
- Goodarzi, M.; Saeys, W.; Deeb, O.; Pieters, S.; Vander Heyden, Y. Particle swarm optimization and genetic algorithm as feature selection techniques for the QSAR modeling of imidazo [1, 5-a] pyrido [3, 2-e] pyrazines, inhibitors of phosphodiesterase 10 A. Chem. Biol. Drug Des. 2013, 82, 685–696. [Google Scholar] [CrossRef]
- Wang, Y.; Huang, J.J.; Zhou, N.; Cao, D.S.; Dong, J.; Li, H.X. Incorporating PLS model information into particle swarm optimization for descriptor selection in QSAR/QSPR. J. Chemom. 2015, 29, 627–636. [Google Scholar] [CrossRef]
- Algamal, Z.Y.; Qasim, M.K.; Lee, M.H.; Mohammad Ali, H.T. High-dimensional QSAR/QSPR classification modeling based on improving pigeon optimization algorithm. Chemom. Intell. Lab. Syst. 2020, 206, 104170. [Google Scholar] [CrossRef]
- Wold, S.; Martens, H.; Wold, H. The multivariate calibration problem in chemistry solved by the PLS method. Lect. Notes Math. 1983, 973, 286–293. [Google Scholar] [CrossRef]
- Karaboga, D.; Gorkemli, B.; Ozturk, C.; Karaboga, N. A comprehensive survey: Artificial bee colony (ABC) algorithm and applications. Artif. Intell. Rev. 2014, 42, 21–57. [Google Scholar] [CrossRef]
- Hancer, E.; Xue, B.; Zhang, M.; Karaboga, D.; Akay, B. Pareto front feature selection based on artificial bee colony optimization. Inf. Sci. 2018, 422, 462–479. [Google Scholar] [CrossRef]
- Liu, Z.Z.; Huang, J.W.; Wang, Y.; Cao, D.S. ECoFFeS: A software using evolutionary computation for feature selection in drug discovery. IEEE Access 2018, 6, 20950–20963. [Google Scholar] [CrossRef]


| Datasets | #Compounds | #Descriptors |
|---|---|---|
| Artemisinin | 178 | 89 |
| BZR | 163 | 75 |
| Selwood | 29 | 53 |
| Method | Learning Rate | Limit | learning Rate | Weight Coefficient |
|---|---|---|---|---|
| PSO-PLS | 0.5 | / | / | / |
| WS-PSO-PLS | 0.5 | / | 0.8 | 0.5 |
| BFDE-PLS | / | / | / | / |
| ABC-PLS | / | 100 | / | / |
| ABC-PLS-1 | / | 100 | / | / |
| Dataset | Method | Mean ± Std | Mean ± Std | Mean ± Std |
|---|---|---|---|---|
| Artemisinin | PLS | 0.6 | 0.99 | 89 |
| PSO-PLS | 0.7352 ± 0.012 | 0.8066 ± 0.0182 | 39.18 ± 4.6436 | |
| WS-PSO-PLS | 0.7568 ± 0.0072 | 0.7732 ± 0.0115 | 32.19 ± 4.41 | |
| BFDE-PLS | 0.7299 ± 0.0109 | 0.8147 ± 0.0164 | 22.48 ± 4.2557 | |
| ABC-PLS | 0.7697 ± 0.0016 | 0.7524 ± 0.0026 | 30.77 ± 3.5358 | |
| ABC-PLS-1 | 0.7716 ± 0.002 | 0.7493 ± 0.0032 | 33.29 ± 5.3073 | |
| BZR | PLS | 0.4 | 0.85 | 75 |
| PSO-PLS | 0.5544 ± 0.012 | 0.733 ± 0.0099 | 29.14 ± 3.6764 | |
| WS-PSO-PLS | 0.5595 ± 0.008 | 0.7288 ± 0.0066 | 27.4 ± 2.8955 | |
| BFDE-PLS | 0.5490 ± 0.0103 | 0.7374 ± 0.0084 | 18.9 ± 2.0865 | |
| ABC-PLS | 0.4523 ± 0.0129 | 0.8126 ± 0.0096 | 38.04 ± 4.4311 | |
| ABC-PLS-1 | 0.5724 ± 0.0053 | 0.7181 ± 0.0044 | 23.26 ± 2.1112 | |
| Selwood | PLS | 0.24 | 0.65 | 53 |
| PSO-PLS | 0.8653 ± 0.0428 | 0.2692 ± 0.0401 | 19.66 ± 3.1662 | |
| WS-PSO-PLS | 0.9152 ± 0.0128 | 0.2153 ± 0.0163 | 17.02 ± 3.0977 | |
| BFDE-PLS | 0.9112 ± 0.0359 | 0.2170 ± 0.0409 | 14.72 ± 2.4457 | |
| ABC-PLS | 0.8187 ± 0.0887 | 0.3078 ± 0.0704 | 20.3 ± 3.9093 | |
| ABC-PLS-1 | 0.9326 ± 0.0023 | 0.1925 ± 0.0033 | 13.86 ± 0.9849 |
| Method | Artemisinin | BZR | Selwood |
|---|---|---|---|
| PSO-PLS | |||
| WS-PSO-PLS | |||
| BFDE-PLS | |||
| ABC-PLS |
| Method | Artemisinin | BZR | Selwood |
|---|---|---|---|
| PSO-PLS | 86.15 ± 7.6716 | 44.99 ± 8.4498 | 32.25 ± 6.5508 |
| WS-PSO-PLS | 92.84 ± 6.6510 | 66.89 ± 5.0317 | 46.83 ± 4.3476 |
| BFDE-PLS | 273.09 ± 11.0566 | 224.29 ± 15.8253 | 158.28 ± 6.6698 |
| ABC-PLS | 103.68 ± 4.2085 | 99.50 ± 2.2932 | 80.68 ± 4.5513 |
| ABC-PLS-1 | 224.20 ± 36.1620 | 185.83 ± 5.3332 | 113.30 ± 2.9640 |
| Dataset | Mean ± Std | Mean ± Std | Mean ± Std | |
|---|---|---|---|---|
| Artemisinin | 10 | 0.7164 ± 0.0057 | 0.835 ± 0.0083 | 43.25 ± 4.2221 |
| 50 | 0.7678 ± 0.0018 | 0.7555 ± 0.0029 | 32.56 ± 4.6042 | |
| 100 | 0.7716 ± 0.002 | 0.7493 ± 0.0032 | 33.29 ± 5.3073 | |
| 150 | 0.7721 ± 0.0016 | 0.7485 ± 0.0026 | 32.5 ± 4.489 | |
| 200 | 0.7726 ± 0.002 | 0.7477 ± 0.0032 | 32.74 ± 5.3459 | |
| ∞ | 0.7731 ± 0.0019 | 0.7468 ± 0.0031 | 32.99 ± 5.5204 | |
| BZR | 10 | 0.5283 ± 0.0051 | 0.7542 ± 0.0041 | 30.82 ± 3.6828 |
| 50 | 0.5714 ± 0.0051 | 0.7189 ± 0.0043 | 23.09 ± 2.0797 | |
| 100 | 0.5724 ± 0.0053 | 0.7181 ± 0.0044 | 23.26 ± 2.1112 | |
| 150 | 0.5733 ± 0.0052 | 0.7173 ± 0.0044 | 23.91 ± 2.1182 | |
| 200 | 0.5758 ± 0.0049 | 0.7152 ± 0.0041 | 23.99 ± 1.8395 | |
| ∞ | 0.5759 ± 0.005 | 0.7150 ± 0.0042 | 24.22 ± 1.7557 | |
| Selwood | 10 | 0.8626 ± 0.0177 | 0.2743 ± 0.0178 | 17.83 ± 2.8035 |
| 50 | 0.9321 ± 0.0009 | 0.1913 ± 0.0014 | 14.07 ± 0.5366 | |
| 100 | 0.9326 ± 0.0023 | 0.1925 ± 0.0033 | 13.86 ± 0.9849 | |
| 150 | 0.9337 ± 0.0035 | 0.1908 ± 0.0053 | 14.2 ± 0.8646 | |
| 200 | 0.9337 ± 0.0043 | 0.1908 ± 0.0066 | 14.28 ± 0.9543 | |
| ∞ | 0.9338 ± 0.0045 | 0.1906 ± 0.0068 | 14.33 ± 1.3185 |
Publisher’s Note: MDPI stays neutral with regard to jurisdictional claims in published maps and institutional affiliations. |
© 2021 by the authors. Licensee MDPI, Basel, Switzerland. This article is an open access article distributed under the terms and conditions of the Creative Commons Attribution (CC BY) license (https://creativecommons.org/licenses/by/4.0/).
Share and Cite
Lin, Y.; Wang, J.; Li, X.; Zhang, Y.; Huang, S. An Improved Artificial Bee Colony for Feature Selection in QSAR. Algorithms 2021, 14, 120. https://doi.org/10.3390/a14040120
Lin Y, Wang J, Li X, Zhang Y, Huang S. An Improved Artificial Bee Colony for Feature Selection in QSAR. Algorithms. 2021; 14(4):120. https://doi.org/10.3390/a14040120
Chicago/Turabian StyleLin, Yanhong, Jing Wang, Xiaolin Li, Yuanzi Zhang, and Shiguo Huang. 2021. "An Improved Artificial Bee Colony for Feature Selection in QSAR" Algorithms 14, no. 4: 120. https://doi.org/10.3390/a14040120
APA StyleLin, Y., Wang, J., Li, X., Zhang, Y., & Huang, S. (2021). An Improved Artificial Bee Colony for Feature Selection in QSAR. Algorithms, 14(4), 120. https://doi.org/10.3390/a14040120