Abstract
Applications of deep-learning models in machine visions for crop/weed identification have remarkably upgraded the authenticity of precise weed management. However, compelling data are required to obtain the desired result from this highly data-driven operation. This study aims to curtail the effort needed to prepare very large image datasets by creating artificial images of maize (Zea mays) and four common weeds (i.e., Charlock, Fat Hen, Shepherd’s Purse, and small-flowered Cranesbill) through conditional Generative Adversarial Networks (cGANs). The fidelity of these synthetic images was tested through t-distributed stochastic neighbor embedding (t-SNE) visualization plots of real and artificial images of each class. The reliability of this method as a data augmentation technique was validated through classification results based on the transfer learning of a pre-defined convolutional neural network (CNN) architecture—the AlexNet; the feature extraction method came from the deepest pooling layer of the same network. Machine learning models based on a support vector machine (SVM) and linear discriminant analysis (LDA) were trained using these feature vectors. The F1 scores of the transfer learning model increased from 0.97 to 0.99, when additionally supported by an artificial dataset. Similarly, in the case of the feature extraction technique, the classification F1-scores increased from 0.93 to 0.96 for SVM and from 0.94 to 0.96 for the LDA model. The results show that image augmentation using generative adversarial networks (GANs) can improve the performance of crop/weed classification models with the added advantage of reduced time and manpower. Furthermore, it has demonstrated that generative networks could be a great tool for deep-learning applications in agriculture.
1. Introduction
The potential of deep-learning algorithms has been demonstrated in almost all stages of agricultural activities, paving the way for efficient handling and non-destructive evaluation [1,2,3,4,5,6,7]. One of the agricultural domains that could benefit from these algorithms is weed management. It is well-known that efficient weed control is one of the inevitable contributing factors towards sustainable agriculture as it can positively contribute to plant growth, yield, and quality while minimizing the need for weedicides. However, manual and traditional weed removal methods have been labor-intensive and inefficient. In this regard, scholars have developed numerous deep-learning models based on convolutional neural networks (CNNs) to classify various crops and weed species [8,9,10,11]. Moreover, machinery based on machine vision has been developed to provide profound solutions for weed management [12,13,14,15].
Although deep-learning networks have enhanced the authenticity of automated crop/weed classification algorithms, the technique suffers from mining large amounts of data that are collected from various geographic conditions. Furthermore, a majority of in-field weed identification tasks require pixel-level annotations [16,17,18]. Overall, acquiring huge amounts of data and the preparation of ground truth is a tedious task, especially for precision agriculture applications [19].
Though many open-source agriculture datasets have been available in recent years, the quality and amount of data do not meet the requirements of researchers [19,20]. In addition, models trained with such data fail to generalize and are not robust enough to be used in diverse practical environments [21]. One way to overcome these difficulties is by adopting image geometric- and intensity-based data augmentation [22]. In addition, when CNNs are employed for machine vision tasks, transfer learning is preferred [23,24], where a pre-trained deep-learning model is fine-tuned with an available dataset for a particular task [25]. This approach has seen a lot of utilization for in-field weed identification [26,27,28]. For instance, Espejo-Garcia et al. developed a solution based on feature extraction from deep layers of various transfer-learned CNN models for automated crop and weed identification [26]. Chen et al. performed a similar study based on transfer learning for identifying weeds in cotton production systems [27]. Both of the above studies recorded classification accuracies greater than 95%. However, such traditional image augmentation techniques and transfer learning provide highly correlated images and only little additional information to the deep-learning model. This not only reduces the ability of the model to generalize but leads to over-fitting problems.
In recent years, another advancement in deep learning, in the form of generative adversarial networks (GANs), has proven to be very efficient for data augmentation and image enhancement [29]. GANs can generate artificial-realistic images using existing image data. The combination of these artificial and original images could enhance the development of subsequent models. GANs have been effectively applied to various tasks, such as human identification [30], organ segmentation [31], and emotion classification [32]. These models have also been used for machine-vision applications in agriculture, such as generating images of specific plants [33,34], plant disease recognition [35], grain quality analysis [4], and for synthesizing images of plant seedlings [36]. A few studies have also utilized GANs to assist in deep-learning-based operations in precision weed management (Table 1). With numerous architectures of GANs available, a performance comparison study was performed on the different combinations of a GAN model and a CNN-based classification model for designing a crop/weed classification pipeline tested on images of tomato crops and black nightshade [37]. The authors obtained the highest accuracy of 99.07% and firmly concluded that GANs improve the classification performance of CNN networks. A few other studies used GANs to generate multi-spectral images of crops and weeds [38]. In all the discussed works, GANs were used to synthesize the entire crop/weed/agricultural field image without any attention to the location and shape of the desired object in the image. It was observed that the generalizability of such networks over the texture and morphology-based features of the target classes was sub-optimal.

Table 1.
Summary of previous studies on the application of GANs for crop/weeds identification tasks.
Henceforth as an improvement, in this study, we performed image generation using a conditional GAN (cGAN) based on the image-to-image translation concept [40]. The primary objective here was to synthesize the images by preserving (conditioning) the original footprint of the objects in the real image, such as the shape of the plants. The real images of a particular class, along with their pixel-wise labels, were combinedly and fed into the GAN model to train it and, eventually, to obtain the artificial images of the respective classes. The image synthesis network exploited here is similar to the pix2pix conditional adversarial network, a very commonly used model for image translation tasks [40]. Secondly, the validity of a classification task using the newly derived dataset was assessed for the two commonly adopted techniques, i.e., transfer learning [26,28] and the feature extraction method [41,42,43,44]. For the above tasks, a pre-defined, state-of-the-art CNN architecture, the AlexNet [45], was employed. In the feature extraction technique, features from deep layers of the AlexNet were extracted to develop machine learning models using the support vector machines (SVM) and linear discriminant analysis (LDA) classifiers. Hence, the major objectives of this work are (i) the implementation of cGAN as a data augmentation approach to synthesize realistic plant images and analyze cGAN performance and (ii) to study the combination of cGANs and the classification algorithms for improving crop/weed species identification.
2. Materials and Methods
2.1. Dataset and Pre-Processing
The dataset consisted of five classes, including maize (Zea mays) and four weed species commonly identified in maize production systems, namely, Charlock (Sinapis arvensis), Fat Hen (Chenopodium album), Shepherd’s purse (Capsella bursa-pastoris), and Small-flowered Cranesbill (Geranium pusillum). The dataset was derived from Kaggle’s image data of the crop and weed seedlings at different growth stages, a public image dataset offered by Giselsson et al. [46]. Each class contained 200 RGB images at various growth stages (5–8 weeks) and illumination effects. These images were manually and binary segmented at pixel level using the Image Segmenter app of MATLAB R2020a and the Image Processing toolbox to distinguish the vegetation from the background. These semantic-segmented images were arranged in class-wise folders, as such so that the sequence of images matched the corresponding real image folder. This allowed for the easier pairing of real and segmented images, which was necessary during the cGAN training process. Figure 1 shows some sample images from the dataset along with their binary-segmented counterparts. The images were resized to a size of 256 × 256 pixels.
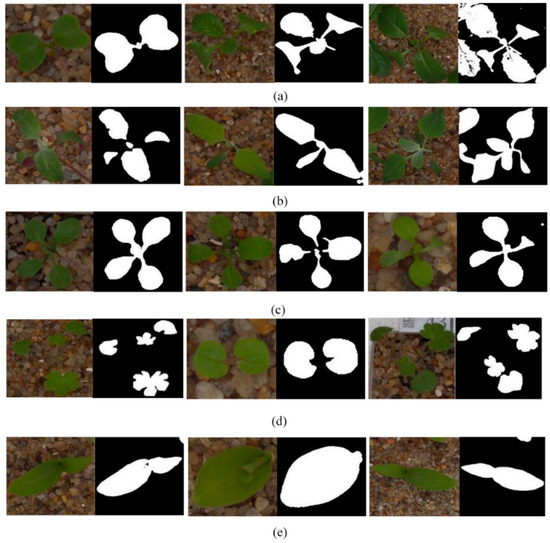
Figure 1.
Sample images of (a) Charlock, (b) Fat Hen, (c) Shepherd’s purse, (d) Small-flowered Cranesbill, and (e) Maize.
2.2. Image Synthesis through GAN
The size of the dataset used here is small when compared to the ones generally employed in learning-based machine-vision tasks. Hence, augmentation through the adversarial networks was performed to increase the size of the dataset. Typically, a GAN architecture comprises a generator network that generates artificial images and a discriminator that aims to differentiate these artificial images from the real images [29]. Both components are simultaneously trained in an adversarial manner, in which the generator aims to entrap the discriminator using its artificial images. The first proposed GAN models did not have control over any auxiliary information on the data that were being synthesized. Later, researchers introduced a conditional variable into the network’s objective functions that contained the network over a particular attribute to synthesize images with the desired features [47]. For instance, GANs were conditioned on text descriptions for text-to-image synthesis and on class labels to generate MNIST dataset digits [48]. Image conditional GAN was first studied by Isola et al. [40] for image-to-image translations.
In cGANs, the generator and discriminator networks are conditioned on the class label , i.e., mapping to is learned from the input image (or source image) and the random vector . The objective function can be given as:
The cGAN architecture employed here is very similar to the model proposed in its original work for image-to-image translation, called the pix2pix GAN [40]. The model is trained with paired images, i.e., the real and binary analog, in order to learn to map the features of these images. The attributes of the output image are conditioned by the source images (here, the binary images act as the source images). Suppose is the binary mask of an image with width and height pixels, the network’s goal is to make the model learn a mapping function that converts into a photo-realistic image. Figure 2 shows the image generation workflow. The generator follows the U-Net framework [49], and the discriminator classifier is based on the PatchGAN [50]. The U-Net is an encoder-decoder network where the input is first down-sampled to a bottleneck layer and then up-sampled from this point. Moreover, skip connections (which concatenate the channels for the two layers) are added between the -th and -th layers ( is the total number of layers). The PatchGAN discriminator classifies every in the image as real or artificial and the final output is determined by the average response. Overall, the generator model used here is a set of convolutional down-sampling layers and transpose convolutional up-sampling layers that are blended through a bottle-neck layer. The discriminator consists of six convolutional layers, such as an 8 × 8 pixel patch, which is obtained at the end. From this patch, the binary classification result (real image or generated image) is acquired.
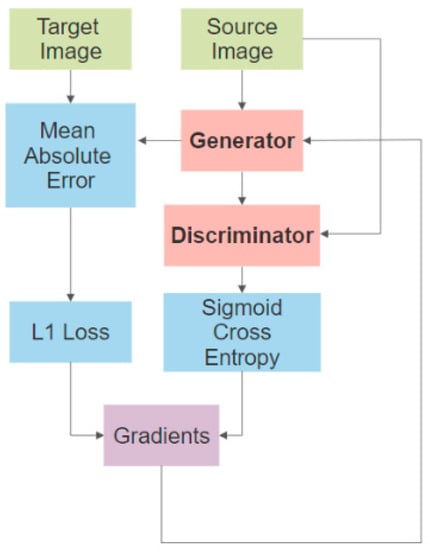
Figure 2.
Training procedure for image generator through L1 and GAN loss functions.
To monitor the fidelity of the generated images after each iteration, the t-distributed stochastic neighbor embedding (t-SNE) visualization is used. The t-SNE algorithm presents the similarities between the samples by iteratively comparing the probability distribution of the different data points in high- and low-dimensional spaces [51]. By applying t-SNE to the real and generated images, the similarities and variances of the images can be further analyzed. Once the training is complete, new images are generated and amassed to analyze through the classifiers (see Section 2.3 and Section 2.4). An Acer Nitro 5 Intel Core i5 9th Generation Laptop (32GB/1 TB HDD/Windows 10 Home/GTX 1650 Graphics) was used to run the MATLAB application.
2.3. Classification through Transfer Learning
In this study, we focus on a popular CNN architecture—AlexNet [45], which was designed in the context of the “Large Scale Visual Recognition Challenge” (ILSVRC) [52] for the ImageNet dataset [53]. AlexNet effectively comprises five convolution layers, three fully connected (FC) layers, and a Softmax layer. The first, second, and fifth convolution layers are followed by a max-pooling layer with a pool size of 3 × 3 and strides of 2 × 2. The convolution layers were furnished with half-padding and ReLU activation function layers. The details on the number of filters and the layer-wise operations are presented in Figure 3. To implement transfer learning, the last three layers of the network—an FC layer configured for 1000 classes; a Softmax layer; and the final classification layer were all replaced with an FC layer for 5 classes, followed by a Softmax layer and a classification layer, with their weights initialized through the Glorot normal method.
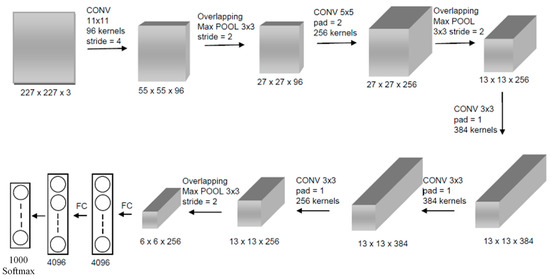
Figure 3.
Illustration of the original AlexNet [45] architecture.
In order to fit AlexNet’s input size, the images were resized to a dimension of 227 × 227 pixels. The evaluation was performed in two steps: firstly, the model was trained only with the real images, and then the real and artificial images were simultaneously used for training. Additional augmentations, such as image rotations, translations, and reflections along the x- and y- axes were specified for both cases. Regarding the training options, the gradient descent with momentum (sgdm) was chosen as the optimizer with an initial learning rate set to 0.001, a momentum of 0.9, and a weight decay factor of 0.0001. The training was limited to a maximum of 1000 epochs, with a mini-batch size of 32. The results of this transfer-learning model on the training and test sets are presented in Section 3.2.
2.4. Classification through Feature Extraction Technique
The convolutional layers in CNN summarize the features associated with each class through a set of filters, carrying the aspects of the input image to the subsequent layers [54]. In the feature extraction method, the features were derived from the deep layers of a CNN, and a machine learning-based model was developed based on these features [55]. An activation map was derived from the first convolution layer of the CNN and is represented in Figure 4. In this study, the features from the global pooling layer of AlexNet (pool5 layer) were extracted, which provided a vector of 9216 features. Due to a very high-dimensional feature map, the principal component analysis was applied to select only the components that explained 97% of the total variance.
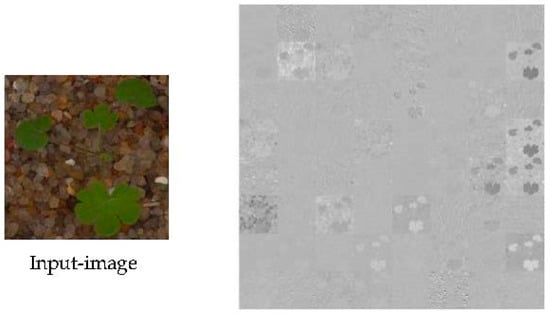
Figure 4.
Visualization of activations of the first Conv-layer of Alexnet.
The entire workflow is depicted in Figure 5. After deriving these features, two classifiers, namely, SVM and LDA, were adopted for classification purposes. These classifiers were chosen due to their exceptional performances in many agricultural datasets over other machine learning algorithms [42,56]. The performance of the developed models was analyzed using precision, recall, and F1-score metrics, given by:
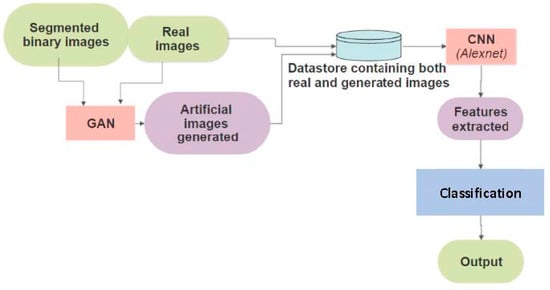
Figure 5.
Workflow for the artificial image synthesis through adversarial network and crop/weeds classification.
2.4.1. Support Vector Classification
Support vector machines (SVMs) have been widely used as a classifier for weed identification. Wu and Wen [57] performed crop/weed classification on a dataset of maize crops and four weed species images using SVM on image color and texture features. Later, they also included shape features in the SVM model and tested their performance using three different kernel functions (polynomial, sigmoid, and RBF) [58]. According to Wong et al. [59], multi-class classification using SVMs generates the best probabilistic output. They trained an SVM model to differentiate the monocotyledon weeds, Ageratum conyzoides, and Amaranthus palmeri weeds from other weeds for selective spraying. Many other studies have also utilized the different versions of SVMs and discussed their advantages [60,61].
In SVM, the classification is performed by identifying a hyper-plane that differentiates the classes very well. The algorithm aims to maximize the minimum distance between a point and the discriminating hyper-plane [57]. In this study, the radial basis function (RBF) was used to transform the feature space. This function computes the element of the Gram matrix as:
where, and are the -th and -th observations of the training set.
2.4.2. Linear Discriminant Analysis
Discriminant analysis is based on the principle that different classes generate data based on various Gaussian distributions (multi-dimensional and normal distributions). Being a supervised technique, it collects information from all the variables and plots a new margin so that the classification outcome is at its best. In LDA, the attributes are assumed to be a Gaussian mixture distribution with different means but with a common covariance matrix. To recall, this matrix contains the variance of the data along the diagonal and covariance along with the corresponding off-diagonal elements. The center of the distribution is determined by the mean, and the shape is determined by the covariance matrix. Once the distributions are fitted, the boundaries are estimated by determining the points around them where the probabilities are similar.
Assuming there are classes (all having a multivariate normal distribution), let and be the covariance matrix and the mean vector of the distribution of the samples in the classes. Say, is the i-th sample in class , the objective of LDA is to assign this observation to class minimizing the function given by
The mathematics and computations behind the discriminant analysis and its regularized version can be further explored in [62] and [63]. These classifiers have also been extensively used for classification tasks in precision agriculture applications [56,64,65].
3. Results and Discussions
3.1. Evaluation of Generated Images
Before evaluating the results of the classification task, we assessed the fidelity of the generated images. The real and generated images for each class are shown in Figure 6. One can see that after around 60 iterations, the model started producing plausible artificial images. To give a fair insight into the image impression, a t-SNE method of visualization was adopted for 100 real and generated images for each class (see Figure 7). The dimension-reduction technique was used to plot the data points in a two-dimensional plot. Some outliers were identified in the t-SNE plot for Charlock. However, the synthetic Charlock images closely exhibit the shape and color features of the original images. For other classes, a similar distribution of the points corresponding to the actual and artificial images denoted that pertinent features are adequately learned and produced through the GAN. The artificial images preserved the key features of the real images and widened the coverage of the training dataset.
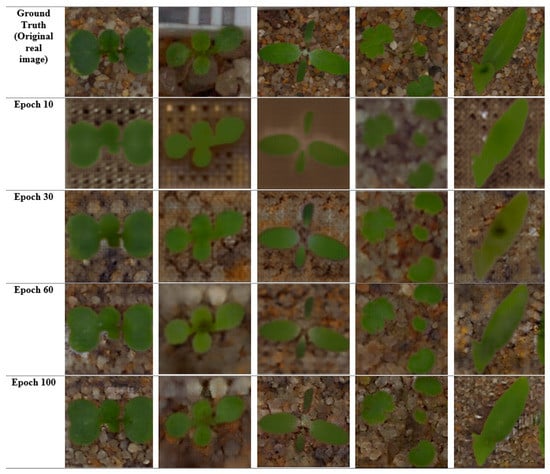
Figure 6.
Sample ground truth images and generated images at different epochs during GAN training. Column-wise from left to right: Charlock, Fat Hen, Shepherd’s purse, Small-flowered Cranesbill, Maize.
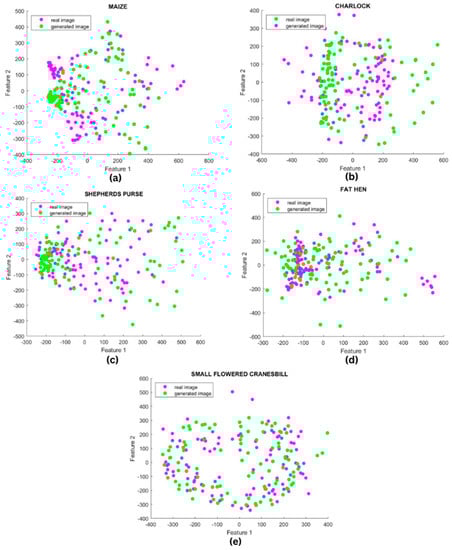
Figure 7.
t-SNE visualization plots for real (green points) and synthetic (red) images for all five classes—(a) Maize, (b) Charlock, (c) Shepherd’s purse, (d) Fat Hen, and (e) Small-flowered Cranesbill.
Hence, realistic images were generated with the help of GAN, which could augment the existing crop/weed dataset. The advantage of GAN-based augmentation includes a reduced annotation workload since the generated images can be associated with the same segmentation mask created earlier. Moreover, the classification model can generalize better when trained with a dataset comprising GAN-generated images, especially on shape-based features. Apart from this, GANs can also be used to enhance image clarity, which was observed in the case of some real images, especially of the maize crop. The GAN-synthesized images have the potential to replace erroneous and ill-advised real data. In addition, some real images contained irrelevant objects (such as the labels, referring to the image of Fat Hen in Figure 6) in the background, and the model was successful in replacing them with the ground appearance, thus exhibiting its potential to create a variety of environmental and background conditions.
One drawback to this GAN model is its inability to learn and reproduce textural features, though it performs exceptionally well in acquiring the shape and color attributes. Notably, in the images of Shepherd’s purse, where the textural appearance of the weed was quite imperative, the model could not fabricate them into artificial images. This might pose a problem for classification when the crops and weeds have a similar physical appearance. For further operations, 200 images were generated for each class through the developed GAN to boost the training dataset.
3.2. Classification Results and Evaluation
3.2.1. Performance Analysis of Transfer Learning Method
As a means of performance comparison to the transfer learning approach with and without GAN-based data augmentation, the results of the AlexNet model that was trained using the real images were initially compiled. The dataset was geometrically augmented by random rotations, translations, and reflections. Later, the model was trained again from the initial condition with both the real and generated images to analyze the potency of image data augmentation through GAN. Henceforth, 200 new images were generated for each class to support the training set. Briefly, the combined dataset utilized for the final model had 2000 images in total (400 images per class), out of which 75 real images from each class were reserved for testing purposes. Table 2 clearly summarizes the image distribution for the training and testing.
Table 2.
Summary of data distribution for each class.
After training with the original (real) dataset, the CNN model produced a classification F1-score of 0.970. After adding artificial images, the F1-score of the CNN (denoted as GAN-TL) improved remarkably and reached a value of 0.986. The statistical classification results on the test set have been recorded in Table 3. In addition, the accuracy improved to 98.40% from the previously attained 97.07% (without GAN augmentation) in the test data. A remarkable increment in the performance metrics was observed for Shepherd’s Purse and Fat Hen, while the results remained unchanged for the maize and Cranesbill classes (Table 3). Overall, image augmentation with the help of a conditional GAN resulted in an improved classification result through the transfer learning method.
Table 3.
Analysis of the classification results based on the transfer learning method. TL and GAN-TL refer to the models trained with the real image data, and combined real and artificial datasets, respectively.
3.2.2. Performance Analysis of Feature Extraction Technique
The feature extraction-based classification models were developed using the activations derived from the global pooling layer of the CNN. Again, the models were developed in two stages, first on the dataset of real images and then on the combined dataset. Since the feature vector obtained from AlexNet had 9216 activations, it offered a wide range of features for classification. The important reason behind choosing AlexNet over other state-of-the-art models was its small convolution kernel sizes and network architecture, which supported the extraction of fine-grain details in the images. The performance of the models trained through SVM and LDA classifiers were compared.
The classification results on the test data have been recorded in Table 4 and Table 5, containing the mean precision, recall, and F1 scores for the five independent runs. The overall accuracy registered by LDA (GAN-LDA) and SVM classifiers (GAN-SVM) was 96.0%. In the training data, LDA performed slightly better than SVM (94.3% and 92.4%). As anticipated, the synthetic images enhanced the performance of both classifiers. The F1-score of the SVM model increased from 0.935 to 0.960, and that of the LDA model increased from 0.943 to 0.959.
Table 4.
Analysis of classification results of SVM on deep features of AlexNet. The SVM and GAN-SVM refer to the SVM models trained with the real image data, and combined real and artificial datasets, respectively.
Table 5.
Analysis of classification results of LDA on deep features of AlexNet. The LDA and GAN-LDA refer to the LDA models trained with the real image data, and combined real and artificial datasets, respectively.
Table 4 and Table 5 demonstrate that the GAN-based augmentation method can provide an excellent performance boost to different classifiers, especially when developed using a limited dataset. Furthermore, Figure 8 presents the best testing confusion matrices upon using the original and GAN-augmented images. In the case of LDA, the performance of certain classes, such as maize and Charlock did not change much on applying GAN-based augmentation. However, the results of classes, such as Cranesbill and Fat Hen, improved significantly. This is because Cranesbill and Fat Hen are relatively more complicated in shape, requiring more data by the network to learn the features. In contrast, the features of maize and charlock are simple and distinct; hence, they are easier for the classifiers to perform the classification task. From the F1 scores of all the classes, it can be observed that the GAN-based image augmentation provided more information and enhanced the performance of transfer learning, as well as the feature extraction techniques for the crop/weed classifications.
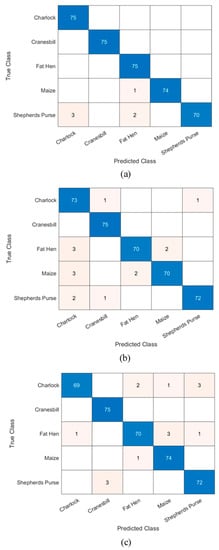
Figure 8.
Best testing confusion matrices based on—(a) Transfer learning (GAN-TL), (b) Feature extraction—SVM (GAN-SVM), and (c) Feature extraction—LDA (GAN-LDA), using both real and GAN-synthesized datasets.
In previous works, classification accuracies greater than 90% have been achieved using SVM and LDA classifiers, especially for crop/weed classifications. Accuracies between 92 and95% were achieved using SVM on the color and texture features for identifying four common weed seedlings in the maize production systems [57]. When morphological features were added to the feature space, an improved accuracy of 96.5% was obtained using RBF-SVM [58]. In another study, local binary pattern-based texture features yielded a 98.5% accuracy with RBF as the kernel function [66]. Siddiqi et al. used the stepwise LDA to classify weeds into three classes: broad weed, narrow weed, and other weed species [67]. Their method accorded 98.1% overall accuracy on a database of 1200 images. In the case of deep-learning-based classifications, most studies used a transfer learning approach rather than training the CNN from scratch. For identifying weeds in cotton and tomato fields, the performances of seven state-of-the-art CNNs were evaluated [26]. All the models registered classification F1-scores greater than 88%.
Moreover, the fine-tuning method was compared with a feature-extraction approach for all the adopted CNNs [26]. They observed that most of the networks gave better results through the feature-extraction approach—a similar inference from this study as well. Similarly, the Alexnet CNN architecture was transfer-learned with potato and sugar beet plant image datasets for binary classification [68]. The model’s accuracy was 98.0%, with an average prediction time of fewer than 0.1 s, supporting real-time applications. As an improvement, Chen et al. evaluated 35 CNN architectures for classifying 15 weed species in cotton production systems, for which ten of them achieved an F1 score greater than 95% [27]. These results show that the classification models in this study have provided performances comparable to those previously developed.
Overall, the results indicate that data augmentation through GANs can increase the training resources needed for classifiers, enabling researchers to develop better imaging-based predictors. The authors believe that the proposed methodology can revolutionize intelligent crop/weed classifiers. An interesting topic for future work could be to examine the capability of the proposed approach on other machine vision-based applications, such as fruit maturity detection [69,70], fruit grading [71], agri-food product microstructural evaluation [65,72,73], crop disease identification [74], and crop growth and yield monitoring [75,76,77].
4. Conclusions
This study explored the potential of cGAN-based data augmentation techniques for improving imaging-based crop/weed classification. Using cGAN, artificial images were generated to double the training data of the available classes. The t-SNE method was used for the fidelity inspection of the new images, and the t-SNE plots showed high similarities between the feature distributions of real and artificial images. The performance of crop/weed classification with and without the artificial images was examined via two approaches viz. transfer learning and feature extraction. The obtained results confirmed the capability of the cGAN-based technique to improve the performance of crop/weed classifiers. Overall, this study opens a new pathway for implementing GANs, not only for crop/weed classification but also for the development of other machine vision-based precision agriculture systems.
Author Contributions
Conceptualization, L.G.D., D.S.G., R.M. and P.S.; methodology, L.G.D.; validation, L.G.D.; formal analysis, L.G.D.; investigation, L.G.D., D.S.G. and P.S.; resources, L.G.D., P.S., M.N. and J.P.; writing—original draft preparation, L.G.D.; writing—review and editing, D.S.G., R.M., P.S., M.N. and J.P.; supervision, P.S. and J.P.; project administration, P.S. All authors have read and agreed to the published version of the manuscript.
Funding
This research was funded by the Canada Foundation for Innovation (CFI) grant number 33090 and the Natural Sciences and Engineering Council of Canada (NSERC) grant number RGPIN2021-03350. The authors would also like to thank the financial support provided by Mitacs.
Institutional Review Board Statement
Not applicable.
Informed Consent Statement
Not applicable.
Data Availability Statement
The data that support the findings of this study are available from the corresponding authors, upon reasonable request.
Conflicts of Interest
The authors declare no conflict of interest.
References
- Zhang, Q.; Liu, Y.; Gong, C.; Chen, Y.; Yu, H. Applications of Deep Learning for Dense Scenes Analysis in Agriculture: A Review. Sensors 2020, 20, 1520. [Google Scholar] [CrossRef] [PubMed]
- Divyanth, L.G.; Ahmad, A.; Saraswat, D. A Two-Stage Deep-Learning Based Segmentation Model for Crop Disease Quantification Based on Corn Field Imagery. Smart Agric. Technol. 2022, 3, 100108. [Google Scholar] [CrossRef]
- Liakos, K.G.; Busato, P.; Moshou, D.; Pearson, S.; Bochtis, D. Machine Learning in Agriculture: A Review. Sensors 2018, 18, 2674. [Google Scholar] [CrossRef] [PubMed]
- Divyanth, L.G.; Chelladurai, V.; Loganathan, M.; Jayas, D.S.; Soni, P. Identification of Green Gram (Vigna Radiata) Grains Infested by Callosobruchus Maculatus Through X-Ray Imaging and GAN-Based Image Augmentation. J. Biosyst. Eng. 2022, 47, 302–317. [Google Scholar] [CrossRef]
- Wani, J.A.; Sharma, S.; Muzamil, M.; Ahmed, S.; Sharma, S.; Singh, S. Machine Learning and Deep Learning Based Computational Techniques in Automatic Agricultural Diseases Detection: Methodologies, Applications, and Challenges. Arch. Comput. Methods Eng. 2021, 29, 641–677. [Google Scholar] [CrossRef]
- Sivakumar, C.; Chaudhry, M.M.A.; Nadimi, M.; Paliwal, J.; Courcelles, J. Characterization of Roller and Ferkar-Milled Pulse Flours Using Laser Diffraction and Scanning Electron Microscopy. Powder Technol. 2022, 409, 117803. [Google Scholar] [CrossRef]
- Erkinbaev, C.; Nadimi, M.; Paliwal, J. A Unified Heuristic Approach to Simultaneously Detect Fusarium and Ergot Damage in Wheat. Meas. Food 2022, 7, 100043. [Google Scholar] [CrossRef]
- Pantazi, X.E.; Moshou, D.; Bravo, C. Active Learning System for Weed Species Recognition Based on Hyperspectral Sensing. Biosyst. Eng. 2016, 146, 193–202. [Google Scholar] [CrossRef]
- Tang, J.L.; Chen, X.Q.; Miao, R.H.; Wang, D. Weed Detection Using Image Processing under Different Illumination for Site-Specific Areas Spraying. Comput. Electron. Agric. 2016, 122, 103–111. [Google Scholar] [CrossRef]
- Raja, R.; Nguyen, T.T.; Slaughter, D.C.; Fennimore, S.A. Real-Time Weed-Crop Classification and Localisation Technique for Robotic Weed Control in Lettuce. Biosyst. Eng. 2020, 192, 257–274. [Google Scholar] [CrossRef]
- Sabzi, S.; Abbaspour-Gilandeh, Y.; Arribas, J.I. An Automatic Visible-Range Video Weed Detection, Segmentation and Classification Prototype in Potato Field. Heliyon 2020, 6, e03685. [Google Scholar] [CrossRef] [PubMed]
- Lee, W.S.; Slaughter, D.C.; Giles, D.K. Robotic Weed Control System for Tomatoes. Precis. Agric. 1999, 1, 95–113. [Google Scholar] [CrossRef]
- Utstumo, T.; Urdal, F.; Brevik, A.; Dørum, J.; Netland, J.; Overskeid, Ø.; Berge, T.W.; Gravdahl, J.T. Robotic In-Row Weed Control in Vegetables. Comput. Electron. Agric. 2018, 154, 36–45. [Google Scholar] [CrossRef]
- Chang, C.L.; Lin, K.M. Smart Agricultural Machine with a Computer Vision-Based Weeding and Variable-Rate Irrigation Scheme. Robotics 2018, 7, 38. [Google Scholar] [CrossRef]
- Grimstad, L.; From, P.J. The Thorvald II Agricultural Robotic System. Robotics 2017, 6, 24. [Google Scholar] [CrossRef]
- Yu, H.; Men, Z.; Bi, C.; Liu, H. Research on Field Soybean Weed Identification Based on an Improved UNet Model Combined With a Channel Attention Mechanism. Front. Plant Sci. 2022, 13, 1881. [Google Scholar] [CrossRef]
- Kamath, R.; Balachandra, M.; Vardhan, A.; Maheshwari, U. Classification of Paddy Crop and Weeds Using Semantic Segmentation. Cogent Eng. 2022, 9, 2018791. [Google Scholar] [CrossRef]
- Sodjinou, S.G.; Mohammadi, V.; Sanda Mahama, A.T.; Gouton, P. A Deep Semantic Segmentation-Based Algorithm to Segment Crops and Weeds in Agronomic Color Images. Inf. Process. Agric. 2022, 9, 355–364. [Google Scholar] [CrossRef]
- Lu, Y.; Young, S. A Survey of Public Datasets for Computer Vision Tasks in Precision Agriculture. Comput. Electron. Agric. 2020, 178, 105760. [Google Scholar] [CrossRef]
- Zheng, Y.Y.; Kong, J.L.; Jin, X.B.; Wang, X.Y.; Su, T.L.; Zuo, M. CropDeep: The Crop Vision Dataset for Deep-Learning-Based Classification and Detection in Precision Agriculture. Sensors 2019, 19, 1058. [Google Scholar] [CrossRef]
- Espejo-Garcia, B.; Mylonas, N.; Athanasakos, L.; Fountas, S. Improving Weeds Identification with a Repository of Agricultural Pre-Trained Deep Neural Networks. Comput. Electron. Agric. 2020, 175, 105593. [Google Scholar] [CrossRef]
- Moazzam, S.I.; Khan, U.S.; Tiwana, M.I.; Iqbal, J.; Qureshi, W.S.; Shah, S.I. A Review of Application of Deep Learning for Weeds and Crops Classification in Agriculture. In Proceedings of the 2019 International Conference on Robotics and Automation in Industry (ICRAI), Rawalpindi, Pakistan, 21–22 October 2019. [Google Scholar] [CrossRef]
- Chen, J.; Chen, J.; Zhang, D.; Sun, Y.; Nanehkaran, Y.A. Using Deep Transfer Learning for Image-Based Plant Disease Identification. Comput. Electron. Agric. 2020, 173, 105393. [Google Scholar] [CrossRef]
- Too, E.C.; Yujian, L.; Njuki, S.; Yingchun, L. A Comparative Study of Fine-Tuning Deep Learning Models for Plant Disease Identification. Comput. Electron. Agric. 2019, 161, 272–279. [Google Scholar] [CrossRef]
- Pan, S.J.; Yang, Q. A Survey on Transfer Learning. IEEE Trans. Knowl. Data Eng. 2010, 22, 1345–1359. [Google Scholar] [CrossRef]
- Espejo-Garcia, B.; Mylonas, N.; Athanasakos, L.; Fountas, S.; Vasilakoglou, I. Towards Weeds Identification Assistance through Transfer Learning. Comput. Electron. Agric. 2020, 171, 105306. [Google Scholar] [CrossRef]
- Chen, D.; Lu, Y.; Li, Z.; Young, S. Performance Evaluation of Deep Transfer Learning on Multi-Class Identification of Common Weed Species in Cotton Production Systems. Comput. Electron. Agric. 2022, 198, 107091. [Google Scholar] [CrossRef]
- Xu, Y.; Zhai, Y.; Zhao, B.; Jiao, Y.; Kong, S.; Zhou, Y.; Gao, Z. Weed Recognition for Depthwise Separable Network Based on Transfer Learning. Intell. Autom. Soft Comput. 2021, 27, 669–682. [Google Scholar] [CrossRef]
- Goodfellow, I.J.; Pouget-Abadie, J.; Mirza, M.; Xu, B.; Warde-Farley, D.; Ozair, S.; Courville, A.; Bengio, Y. Generative Adversarial Nets. Adv. Neural Inf. Process. Syst. 2014, 27, 139–144. [Google Scholar]
- Zheng, Z.; Zheng, L.; Yang, Y. Unlabeled Samples Generated by GAN Improve the Person Re-Identification Baseline in vitro. In Proceedings of the 2017 International Conference on Computer Vision, Venice, Italy, 22–29 October 2017; pp. 3774–3782. [Google Scholar] [CrossRef]
- Frid-Adar, M.; Klang, E.; Amitai, M.; Goldberger, J.; Greenspan, H. Synthetic Data Augmentation Using GAN for Improved Liver Lesion Classification. In Proceedings of the 2018 IEEE 15th International Symposium on Biomedical Imaging (ISBI 2018), Washington, DC, USA, 4–7 April 2018; pp. 289–293. [Google Scholar] [CrossRef]
- Zhu, X.; Liu, Y.; Li, J.; Wan, T.; Qin, Z. Emotion Classification with Data Augmentation Using Generative Adversarial Networks. In Advances in Knowledge Discovery and Data Mining; Lecture Notes in Computer Science; Springer: Cham, Switzerland, 2018; Volume 10939 LNAI, pp. 349–360. [Google Scholar] [CrossRef]
- Giuffrida, M.V.; Scharr, H.; Tsaftaris, S.A. ARIGAN: Synthetic Arabidopsis Plants Using Generative Adversarial Network. In Proceedings of the 2017 International Conference on Computer Vision, Venice, Italy, 22–29 October 2017; pp. 2064–2071. [Google Scholar] [CrossRef]
- Divyanth, L.G.; Marzougui, A.; González-Bernal, M.J.; McGee, R.J.; Rubiales, D.; Sankaran, S. Evaluation of Effective Class-Balancing Techniques for CNN-Based Assessment of Aphanomyces Root Rot Resistance in Pea (Pisum sativum L.). Sensors 2022, 22, 7237. [Google Scholar] [CrossRef]
- Arsenovic, M.; Karanovic, M.; Sladojevic, S.; Anderla, A.; Stefanovic, D. Solving Current Limitations of Deep Learning Based Approaches for Plant Disease Detection. Symmetry 2019, 11, 939. [Google Scholar] [CrossRef]
- Madsen, S.L.; Dyrmann, M.; Jørgensen, R.N.; Karstoft, H. Generating Artificial Images of Plant Seedlings Using Generative Adversarial Networks. Biosyst. Eng. 2019, 187, 147–159. [Google Scholar] [CrossRef]
- Espejo-Garcia, B.; Mylonas, N.; Athanasakos, L.; Vali, E.; Fountas, S. Combining Generative Adversarial Networks and Agricultural Transfer Learning for Weeds Identification. Biosyst. Eng. 2021, 204, 79–89. [Google Scholar] [CrossRef]
- Fawakherji, M.; Potena, C.; Pretto, A.; Bloisi, D.D.; Nardi, D. Multi-Spectral Image Synthesis for Crop/Weed Segmentation in Precision Farming. Rob. Auton. Syst. 2021, 146, 103861. [Google Scholar] [CrossRef]
- Khan, S.; Tufail, M.; Khan, M.T.; Khan, Z.A.; Iqbal, J.; Alam, M. A Novel Semi-Supervised Framework for UAV Based Crop/Weed Classification. PLoS ONE 2021, 16, e0251008. [Google Scholar] [CrossRef] [PubMed]
- Isola, P.; Zhu, J.Y.; Zhou, T.; Efros, A.A. Image-to-Image Translation with Conditional Adversarial Networks. In Proceedings of the IEEE Conference on Computer Vision and Pattern Recognition, Honolulu, HI, USA, 21–26 July 2017; pp. 5967–5976. [Google Scholar] [CrossRef]
- Khurana, G.; Bawa, N.K. Weed Detection Approach Using Feature Extraction and KNN Classification. In Advances in Electromechanical Technologies; Lecture Notes in Mechanical Engineering; Springer: Singapore, 2021; pp. 671–679. [Google Scholar] [CrossRef]
- Jin, X.; Che, J.; Chen, Y. Weed Identification Using Deep Learning and Image Processing in Vegetable Plantation. IEEE Access 2021, 9, 10940–10950. [Google Scholar] [CrossRef]
- Wang, A.; Zhang, W.; Wei, X. A Review on Weed Detection Using Ground-Based Machine Vision and Image Processing Techniques. Comput. Electron. Agric. 2019, 158, 226–240. [Google Scholar] [CrossRef]
- Sunil, G.C.; Zhang, Y.; Koparan, C.; Ahmed, M.R.; Howatt, K.; Sun, X. Weed and Crop Species Classification Using Computer Vision and Deep Learning Technologies in Greenhouse Conditions. J. Agric. Food Res. 2022, 9, 100325. [Google Scholar] [CrossRef]
- Krizhevsky, A.; Sutskever, I.; Hinton, G.E. ImageNet Classification with Deep Convolutional Neural Networks. Adv. Neural Inf. Process. Syst. 2012, 60, 84–90. [Google Scholar] [CrossRef]
- Giselsson, T.M.; Jørgensen, R.N.; Jensen, P.K.; Dyrmann, M.; Midtiby, H.S. A Public Image Database for Benchmark of Plant Seedling Classification Algorithms. arXiv 2017, arXiv:1711.05458. [Google Scholar] [CrossRef]
- Mirza, M.; Osindero, S. Conditional Generative Adversarial Nets. arXiv 2014, arXiv:1411.1784. [Google Scholar] [CrossRef]
- Reed, S.; Akata, Z.; Yan, X.; Logeswaran Reedscot, L.; Schiele, B.; Lee Schiele, H. Generative Adversarial Text to Image Synthesis. In Proceedings of the International Conference on Machine Learning (ICML 2016), New York, NY, USA, 19–24 June 2016; pp. 1060–1069. [Google Scholar]
- Ronneberger, O.; Fischer, P.; Brox, T. U-Net: Convolutional Networks for Biomedical Image Segmentation. In Proceedings of the International Conference on Medical Image Computing and Computer-Assisted Intervention 2015, Munich, Germany, 5–9 October 2015; Volume 9351, pp. 234–241. [Google Scholar] [CrossRef]
- Li, C.; Wand, M. Precomputed Real-Time Texture Synthesis with Markovian Generative Adversarial Networks. In Proceedings of the European Conference on Computer Vision 2016, Amsterdam, The Netherlands, 11–14 October 2016; Volume 9907 LNCS, pp. 702–716. [Google Scholar] [CrossRef]
- van der Maaten, L.; Hinton, G. Visualizing Data Using T-SNE. J. Mach. Learn. Res. 2008, 9, 2579–2605. [Google Scholar]
- Russakovsky, O.; Deng, J.; Su, H.; Krause, J.; Satheesh, S.; Ma, S.; Huang, Z.; Karpathy, A.; Khosla, A.; Bernstein, M.; et al. ImageNet Large Scale Visual Recognition Challenge. Int. J. Comput. Vis. 2015, 115, 211–252. [Google Scholar] [CrossRef]
- Deng, J.; Dong, W.; Socher, R.; Li, L.J.; Li, K.; Fei-Fei, L. ImageNet: A Large-Scale Hierarchical Image Database. In Proceedings of the 2009 IEEE Conference on Computer Vision and Pattern Recognition, Miami, FL, USA, 20–25 June 2010; pp. 248–255. [Google Scholar] [CrossRef]
- Szegedy, C.; Liu, W.; Jia, Y.; Sermanet, P.; Reed, S.; Anguelov, D.; Erhan, D.; Vanhoucke, V.; Rabinovich, A. Going Deeper with Convolutions. In Proceedings of the IEEE Conference on Computer Vision and Pattern Recognition 2015, Boston, MA, USA, 7–12 June 2015; pp. 1–9. [Google Scholar] [CrossRef]
- Wiatowski, T.; Bolcskei, H. A Mathematical Theory of Deep Convolutional Neural Networks for Feature Extraction. IEEE Trans. Inf. Theory 2018, 64, 1845–1866. [Google Scholar] [CrossRef]
- Nanehkaran, Y.A.; Zhang, D.; Chen, J.; Tian, Y.; Al-Nabhan, N. Recognition of Plant Leaf Diseases Based on Computer Vision. J. Ambient Intell. Humaniz. Comput. 2020, 1, 1–18. [Google Scholar] [CrossRef]
- Wu, L.; Wen, Y. Weed/Corn Seedling Recognition by Support Vector Machine Using Texture Features. African J. Agric. Res. 2009, 4, 840–846. [Google Scholar]
- Wu, L.; Wen, Y. Application of Support Vector Machine for Identifying Single Corn/Weed Seedling in Fields Using Shape Parameters. In Proceedings of the 2nd International Conference on Information Science and Engineering, Hangzhou, China, 4–6 December 2010. [Google Scholar] [CrossRef]
- Wong, W.K.; Chekima, A.; Mariappan, M.; Khoo, B.; Nadarajan, M. Probabilistic Multi SVM Weed Species Classification for Weed Scouting and Selective Spot Weeding. In Proceedings of the 2014 IEEE International Symposium on Robotics and Manufacturing Automation (ROMA), Kuala Lumpur, Malaysia, 15–16 December 2014; pp. 63–68. [Google Scholar] [CrossRef]
- Karimi, Y.; Prasher, S.O.; Patel, R.M.; Kim, S.H. Application of Support Vector Machine Technology for Weed and Nitrogen Stress Detection in Corn. Comput. Electron. Agric. 2006, 51, 99–109. [Google Scholar] [CrossRef]
- Venkataraju, A.; Arumugam, D.; Stepan, C.; Kiran, R.; Peters, T. A Review of Machine Learning Techniques for Identifying Weeds in Corn. Smart Agric. Technol. 2022, 3, 100102. [Google Scholar] [CrossRef]
- Friedman, J.H. Regularized Discriminant Analysis. J. Am. Stat. Assoc. 1989, 84, 165–175. [Google Scholar] [CrossRef]
- Guo, Y.; Hastie, T.; Tibshirani, R. Regularized Linear Discriminant Analysis and Its Application in Microarrays. Biostatistics 2007, 8, 86–100. [Google Scholar] [CrossRef]
- Qadri, S.; Khan, D.M.; Ahmad, F.; Qadri, S.F.; Babar, M.E.; Shahid, M.; Ul-Rehman, M.; Razzaq, A.; Shah Muhammad, S.; Fahad, M.; et al. A Comparative Study of Land Cover Classification by Using Multispectral and Texture Data. Biomed Res. Int. 2016, 2016, 8797438. [Google Scholar] [CrossRef]
- Nadimi, M.; Loewen, G.; Paliwal, J. Assessment of Mechanical Damage to Flaxseeds Using Radiographic Imaging and Tomography. Smart Agric. Technol. 2022, 2, 100057. [Google Scholar] [CrossRef]
- Ahmed, F.; Bari, A.S.M.H.; Shihavuddin, A.S.M.; Al-Mamun, H.A.; Kwan, P. A Study on Local Binary Pattern for Automated Weed Classification Using Template Matching and Support Vector Machine. In Proceedings of the 2011 IEEE 12th International Symposium on Computational Intelligence and Informatics (CINTI), Budapest, Hungary, 21–22 November 2011; pp. 329–334. [Google Scholar] [CrossRef]
- Siddiqi, M.H.; Lee, S.-W.; Khan, A.M. Weed Image Classification Using Wavelet Transform, Stepwise Linear Discriminant Analysis, and Support Vector Machines for an Automatic Spray Control System. J. Inf. Sci. Eng. 2014, 30, 1227–1244. [Google Scholar] [CrossRef]
- Suh, H.K.; IJsselmuiden, J.; Hofstee, J.W.; van Henten, E.J. Transfer Learning for the Classification of Sugar Beet and Volunteer Potato under Field Conditions. Biosyst. Eng. 2018, 174, 50–65. [Google Scholar] [CrossRef]
- Sabzi, S.; Abbaspour, Y.; Nadimi, M.; Paliwal, J. Non-destructive estimation of physicochemical properties and detection of ripeness level of apples using machine vision. Int. J. Fruit Sci. 2022, 22, 628–645. [Google Scholar] [CrossRef]
- Kheiralipour, K.; Nadimi, M.; Paliwal, J. Development of an Intelligent Imaging System for Ripeness Determination of Wild Pistachios. Sensors 2022, 22, 7134. [Google Scholar] [CrossRef] [PubMed]
- Hosainpour, A.; Kheiralipour, K.; Nadimi, M.; Paliwal, J. Quality assessment of dried white mulberry (Morus alba L.) using machine vision. Horticulturae, 2022; In press. [Google Scholar]
- Li, X.; Guillermic, R.M.; Nadimi, M.; Paliwal, J.; Koksel, F. Physical and microstructural quality of extruded snacks made from blends of barley and green lentil flours. Cereal Chem. 2022, 99, 1112–1123. [Google Scholar] [CrossRef]
- Nadimi, M.; Divyanth, L.G.; Paliwal, J. Automated detection of mechanical damage in flaxseeds using radiographic imaging and machine learning. Foods Bioprocess Technol. 2022. In press. [Google Scholar]
- Nadimi, M.; Brown, J.M.; Morrison, J.; Paliwal, J. Examination of wheat kernels for the presence of Fusarium damage and mycotoxins using near-infrared hyperspectral imaging. Meas. Food 2021, 4, 100011. [Google Scholar] [CrossRef]
- Nadimi, M.; Loewen, G.; Bhowmik, P.; Paliwal, J. Effect of laser biostimulation on germination of sub-optimally stored flaxseeds (Linum usitatissimum). Sustainability 2022, 14, 12183. [Google Scholar] [CrossRef]
- Nadimi, M.; Sun, D.W.; Paliwal, J. Effect of laser biostimulation on germination of wheat. ASABE Appl. Eng. Agric. 2022, 38, 77–84. [Google Scholar] [CrossRef]
- Nadimi, M.; Sun, D.W.; Paliwal, J. Recent applications of novel laser techniques for enhancing agricultural production. Laser Phys. 2021, 31, 053001. [Google Scholar] [CrossRef]


Publisher’s Note: MDPI stays neutral with regard to jurisdictional claims in published maps and institutional affiliations. |
© 2022 by the authors. Licensee MDPI, Basel, Switzerland. This article is an open access article distributed under the terms and conditions of the Creative Commons Attribution (CC BY) license (https://creativecommons.org/licenses/by/4.0/).