Review

Automatic Atrial Fibrillation Arrhythmia Detection Using Univariate and Multivariate Data

1
NVISION Systems and Technologies SL, 08028 Barcelona, Spain
2
LIS, CNRS, Aix Marseille University, University of Toulon, 13007 Marseille, France
3
Assistance Publique—Hôpitaux de Marseille, Centre Hospitalier Universitaire La Timone, Service de Cardiologie, 13005 Marseille, France
4
Centre for Nutrition and Cardiovascular Disease (C2VN), INSERM, INRAE, Aix Marseille Université, 13005 Marseille, France
5
Faculty of Medicine, Aix Marseille University, APHM, INSERM, INRAE, C2VN, Hôpital Nord, Explorations Fonctionnelles Respiratoires et à l’Exercice, 13007 Marseille, France
*
Author to whom correspondence should be addressed.
Algorithms 2022, 15(7), 231; https://doi.org/10.3390/a15070231
Submission received: 6 June 2022 / Revised: 17 June 2022 / Accepted: 24 June 2022 / Published: 1 July 2022

Abstract

:
Atrial fibrillation (AF) is still a major cause of disease morbidity and mortality, making its early diagnosis desirable and urging researchers to develop efficient methods devoted to automatic AF detection. Till now, the analysis of Holter-ECG recordings remains the gold-standard technique to screen AF. This is usually achieved by studying either RR interval time series analysis, P-wave detection or combinations of both morphological characteristics. After extraction and selection of meaningful features, each of the AF detection methods might be conducted through univariate and multivariate data analysis. Many of these automatic techniques have been proposed over the last years. This work presents an overview of research studies of AF detection based on RR interval time series. The aim of this paper is to provide the scientific community and newcomers to the field of AF screening with a resource that presents introductory concepts, clinical features, and a literature review that describes the techniques that are mostly followed when RR interval time series are used for accurate detection of AF.

1. Introduction

Decision making in healthcare domains is among the most critical tasks that a physician has to formulate. To check the health status of patients and/or health subjects, several qualitative and quantitative indicators are thoroughly analyzed, and a decision is then rendered. Medical decision-making could be seen as a classification problem. For instance, a specific disease can be recognized based on the combination of blood analysis, vitals characterization, and symptoms. In addition, one may wish to stratify patients based on medical imaging techniques (e.g., radiology, histopathology, etc.). Even if these tasks are common in healthcare practice, it is well-admitted that they are time-consuming and entail tedious and repetitive aspects mainly if the clinical data being measured are voluminous. Not to mention, the limited available places (as shown in COVID-19 pandemic) and number of healthcare professionals are other stressors complicating the hospital services. Therefore, it is thought that the automation of the medical decision-making process is important, as far as possible, especially for diseases with a major concern in public health, namely, cardiovascular diseases.
Cardiovascular diseases are the first cause of death and they are projected to remain so [1,2]. They represent a large share in which healthcare professionals are called upon to make decisions. Atrial fibrillation (AF), considered as the most common cardiac arrhythmia, and a major public health burden associated with significant morbidity and mortality, is spurring increased attention. More than 6 million people in Europe and 3 million people in the US are affected by AF [3,4,5]. The correct prevalence of AF is still unknown because AF is asymptomatic in many patients and thus remains undiagnosed [6]. In China, for instance, around 10 million people have AF [7], but the approximate prevalence of AF is 1% in the general population, which increases with age, more so in women than in men [8,9,10,11]. Since the current population ageing trends and the improvement of survival rates from conditions predisposing to AF, the prevalence of AF is notably increasing [12,13].
Automatic AF detection is strongly advisable, mainly due to the lack of symptoms raising the attention of either people undergoing AF or healthcare professionals. This makes AF a silent killer. However, AF events may unfold quickly, in short time periods, intrinsically hard to predict. This makes electrocardiography (Holter-ECG) recordings a strong requirement for a successful detection. The analysis of ECG and Holter-ECG recordings currently remains the gold-standard technique to diagnose AF. In fact, the two signature features of AF are typically RR interval irregularities and missing P-waves (replaced by rapid oscillations or fibrillatory waves), or combinations of both properties.
In this sense, the development of automated classification systems has been, and continues to be, a dynamic research field, especially with the vast increase in processing speed and the evolution of data analysis science. Two approaches are emerging as promising means in the attempt to efficiently address automatic AF detection: univariate analysis in which data are analyzed according to a single variable, and in contrast, multivariate analysis where relationships between several variables are investigated. Comparative studies of classifiers dealing with AF detection have been already published in the literature. For instance, in 2003, Poli et al. [14] reviewed methods and algorithms for the prediction of AF by studying the surface of electrocardiographic records in post-cardiosurgery or paroxysmal patients. Larburu et al. [15] compared nine AF detection algorithms under several criteria such as algorithm time resolution test, initial signal length, noise test, and computation time.
This paper will focus on the employment of automated classification systems in AF detection. After briefly introducing aspects of the workflow that clinical AF detection follows (how cardiologists detect AF), relevant contributions in automatic AF detection over the last years will be addressed. With the emergence of remote health and heart monitoring paradigms, simple univariate algorithms for AF arrhythmia detection continue capturing both the interest of research and commercial actors in the study of the heart condition. However, as robust and powerful cloud infrastructures make their way into real products and use case scenarios for remote health monitoring while device computational capabilities increase, multivariate analysis methods that can be pretrained and hosted in the cloud may be experiencing a wave of renewed interest. In the following sections of this work, significant contributions of univariate and multivariate data analysis applied to automatic AF monitoring are reviewed.

2. Clinical Experience

Before we review the use of several data analysis methods in automatic AF detection, a short introduction to AF is given in this section. AF is medically defined as a supraventricular tachyarrhythmia, i.e., an irregular heart rhythm which is driven by non-organized atrial activity. Diagnosis criteria are then absence of the P-wave, the presence of an anarchic auriculogram (F wave), and an irregular heart rhythm, usually rapid with thin QRS complexes [16,17]. Great progresses have been made in the AF management, but AF remains a major cause of cardiovascular mortality and morbidity, with examples such as heart failure, stroke, and sudden death. AF is independently associated with a 2-fold increased risk of all-cause mortality in women and a 1.5-fold increase in men. Up to 20–30% of patients that experienced an ischemic stroke were diagnosed with an AF before, during, or after the initial event. Moreover, AF is currently the most frequent arrhythmia (1–3% of population) and its occurrence is predicted to increase gradually in the coming years according to population ageing trends. It is evaluated that 1% of total healthcare spending is directly generated by AF. Only early and effective prevention and treatment will be able to prevent its rising cost. For these reasons, AF has to be diagnosed as soon as possible and the largest population should be screened [16,17].
Electrocardiogram (ECG) records of the heart rhythm are necessary for AF diagnosis, exhibiting the typical AF characteristics: irregular RR intervals that are often said to be anarchical and absence of P-waves. It is conventionally accepted that a 30 s lasting episode is necessary and sufficient to diagnose a clinically relevant AF. AF can be seen in symptomatic or asymptomatic (‘silent AF’) subjects and, in fact, AF patients often experience both symptomatic and asymptomatic episodes. As silent undiagnosed AF is common and associated with severe consequences such as stroke and death, quick ECG recording is an efficient and cost-effective way to screen people and diagnose chronic AF. The longer the duration of the ECG recording, the higher detection rate of paroxysmal AF. However, chronic AF detection rate is also increased by daily short-term ECG recordings, especially in elderly population.
To succeed in this challenge, new technologies are developed to increase AF detection, such as patient-operated devices, skin patches, or even smartphones, smart watches, and blood pressure monitoring devices. However, massive data generated need to be automatically analyzed since a 24 h length recording is expected to show approximately 100,000 heartbeats that need to be read, making it especially time-consuming. Physician time-consumption and costs can be reduced by automatic analysis of heart rhythm, leading to concomitant developments of automatic AF arrhythmia detection algorithms.

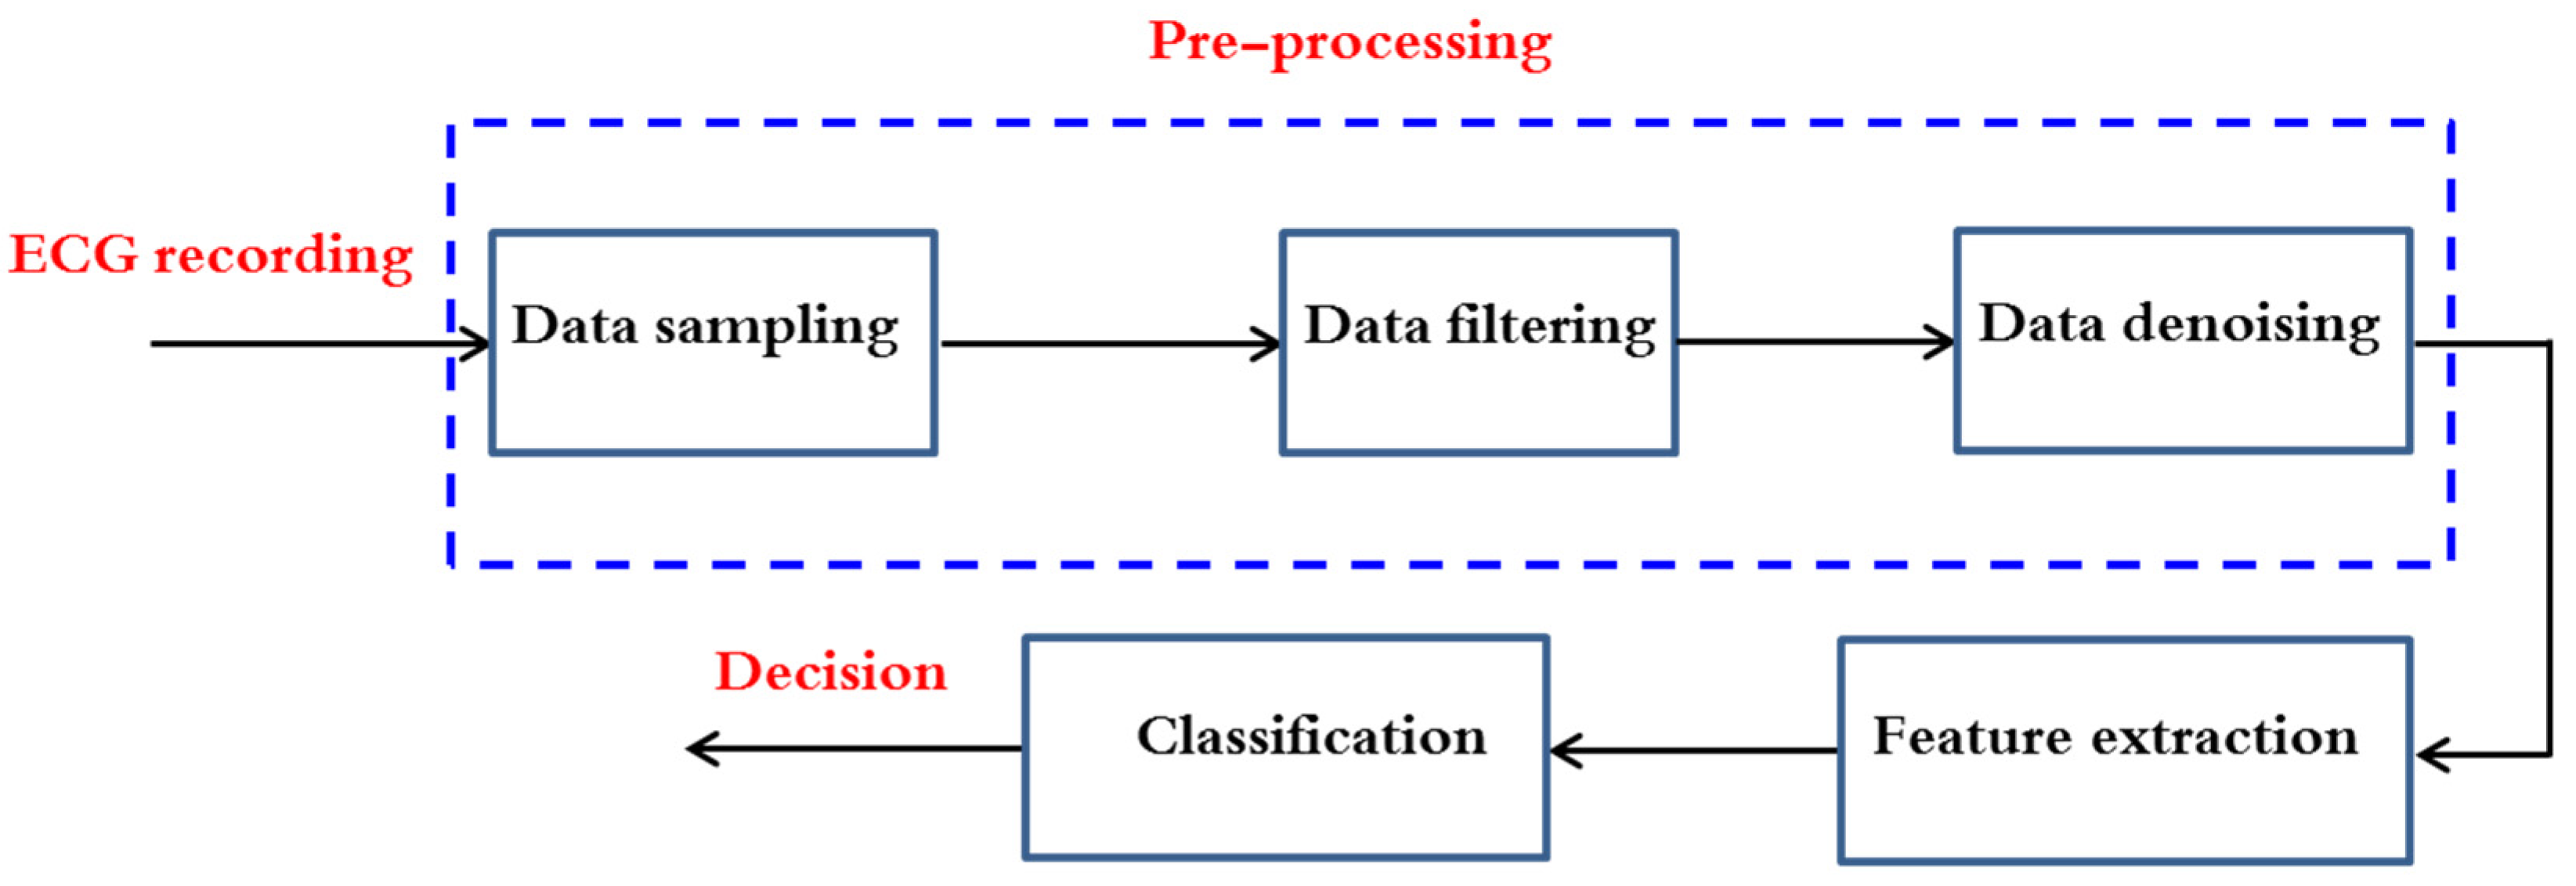
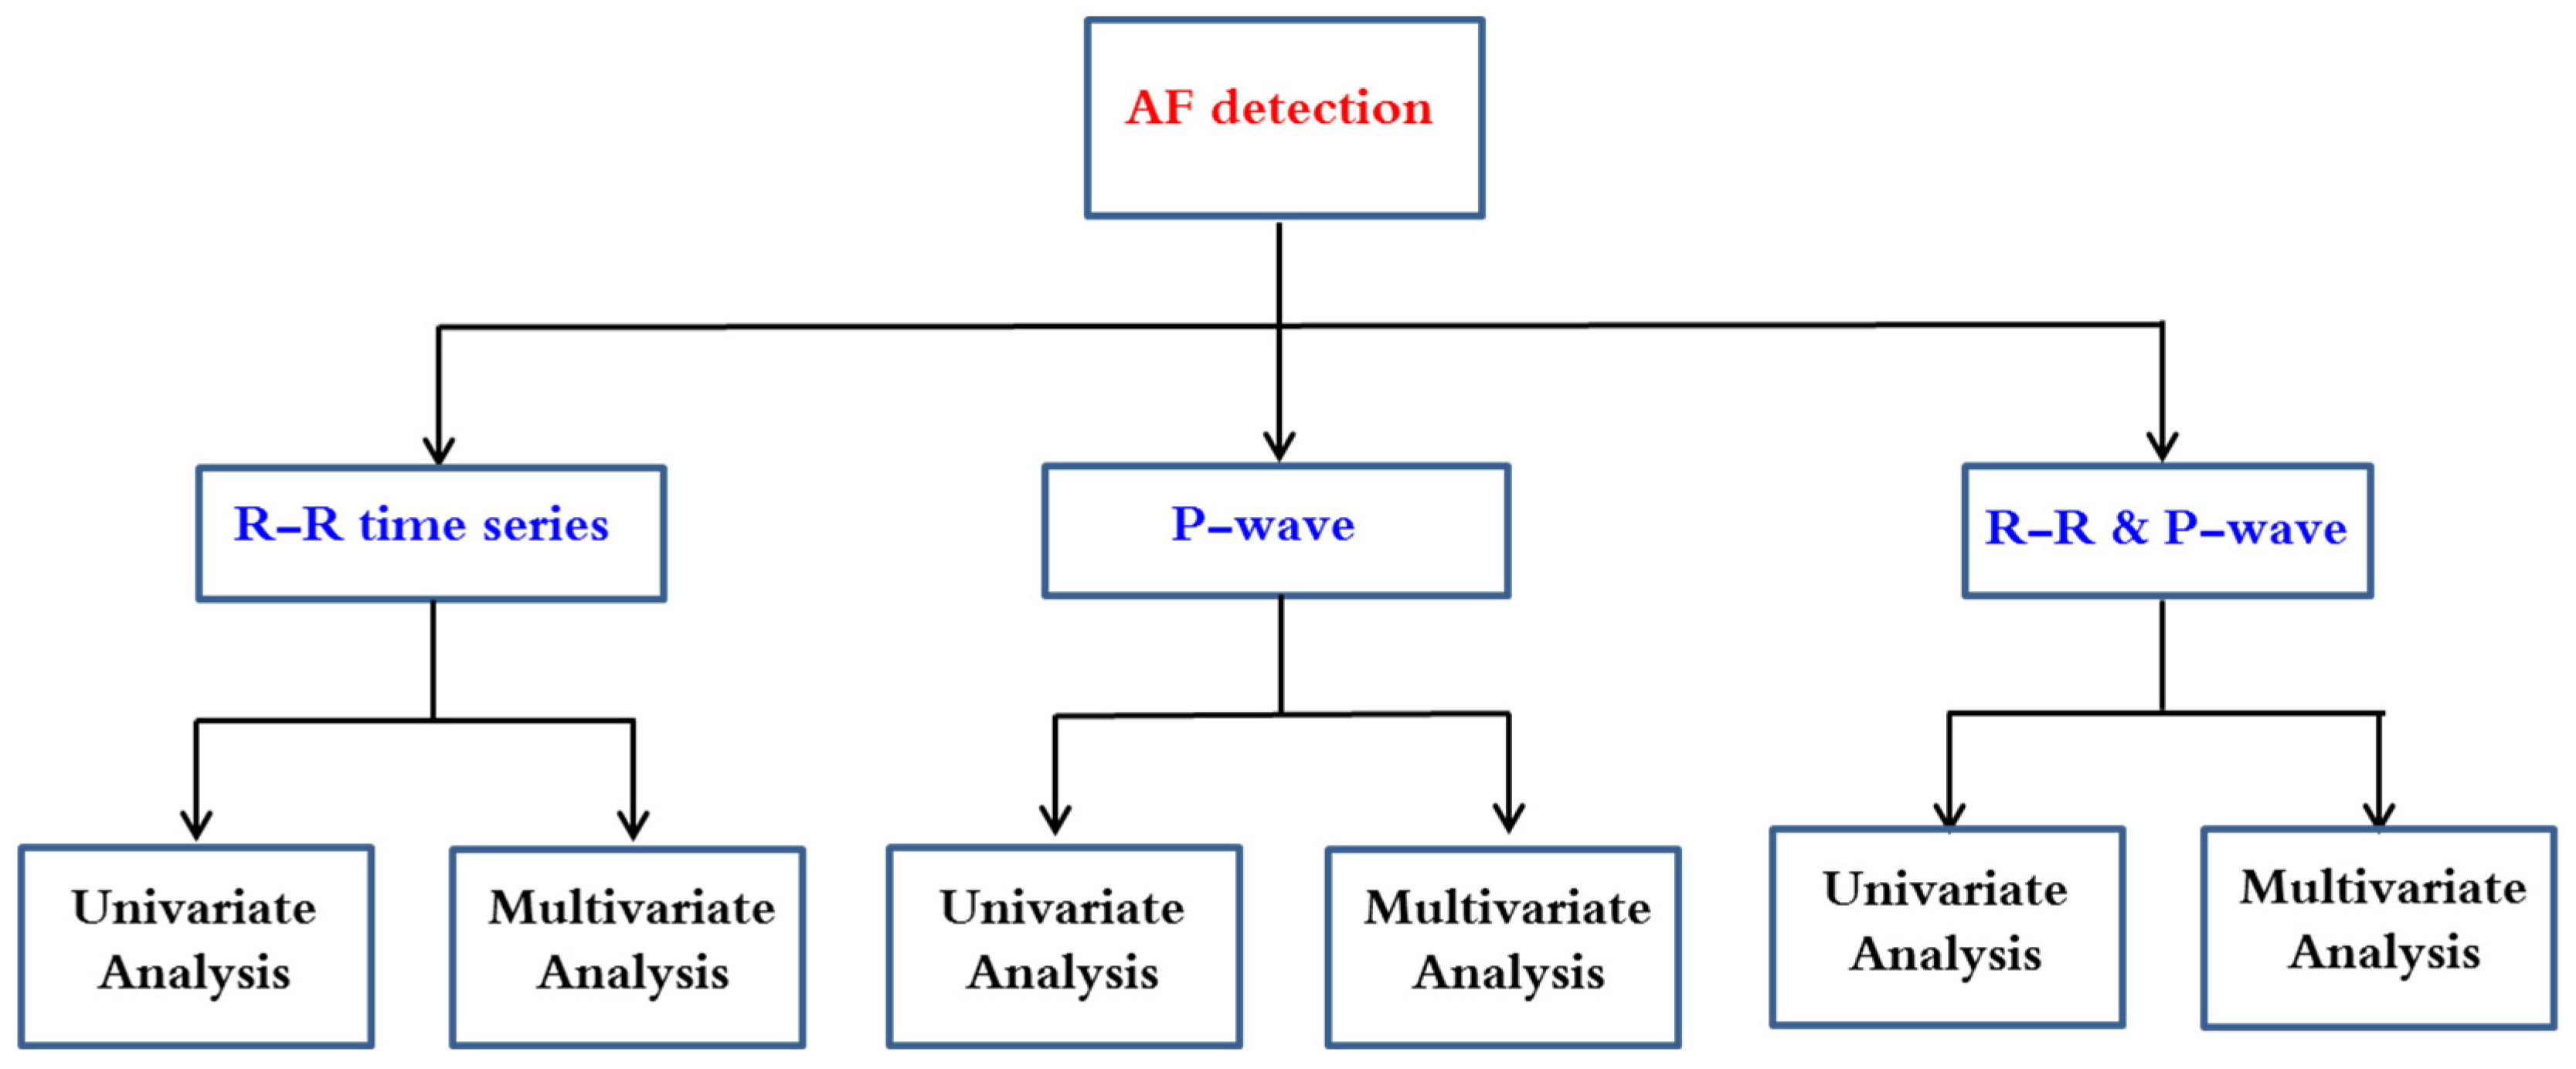
3. AF Arrhythmia Detection Methods

In this paper, a selection of works that attempt to solve the problem of detecting AF are presented. Most of them use a two-step procedure after ECG data pre-processing as shown in Figure 1: first, feature extraction from RR time series (tachogram) or P-wave or their combination is conducted and then followed by a classification building process based on the extracted parameters. The performance of the major established classification methods was evaluated on Physionet signals; a publicly accessible online database containing physiologic signals. Seven datasets are commonly used: MIT-BIH Arrhythmia Database (abbreviated MITDB or often MIT-BIH AR as well), MIT-BIH Atrial Fibrillation Database (AFDB), Long-Term AF database, Paroxysmal Atrial Fibrillation Prediction Challenge Database (ParAFDB), AF Termination Challenge Database (AFTermDB), MIT-BIH Normal Sinus Rhythm Database (NSRDB), and Normal Sinus Rhythm RR Interval Database (NSR2DB).
As said previously, cardiology experts inspect ECG recordings in an experienced-based manner to identify any type of heart rhythm. In an automated AF detection algorithm, this step is equated with extraction of interesting and discriminant variables from the ECG signals. These parameters help to characterize the P-wave (presence, morphology) and the RR intervals’ variability (regularity, irregularity, pattern).
After reviewing recent papers, we have noticed that the published works dealing with AF detection may be categorized in six methodologies as summarized in Figure 2.
This review highlights the advances in AF detection that followed RR time series analysis. Since P-waves are associated with significantly higher computational resources than are the RR-based classifiers, their integration in a low power demanding electronic device is not a realistic option. Furthermore, the detection of P-wave fiducial points is a very difficult task because of its low amplitude, which makes it prone to corruption by noise. This being so, some authors have demonstrated that opting for complex features by using morphologic analysis does not necessarily outperform that the results achieved by an RR-based AF classifier [18,19]. For these reasons, the analysis of RR irregularities is most studied by researchers rather than the absence of P-waves or the combination of both characteristics.
The AF detectors are evaluated by the following metrics:
Accuracy: Ac = (TP + TN)/N, Sensitivity: Se = TP/(TP + FN), Specificity: Sp = TN/(TN + FP), Precision, also known as Positive Predictive Value: Pr = PPV = TP/(TP + FP), and, less often, Negative Predictive Value: NPV = TN/(TN + FN); where TP is the number of True Positives or correctly detected AF episodes, TN is the number of True Negatives or correctly detected non-AF episodes, FP is the number of False Positives, i.e., normal rhythms misclassified as AF, and FN is the number of False Negatives or missed AF cases classified as normal. The total number of observations is denoted by N. Sensitivity-Specificity and Sensitivity-Precision metrics dyads are usually favored in comparison to Ac alone or more ambiguous success rates, as better describing the classification tradeoffs between the ability to capture existing cases and the certainty of the classification results obtained.
In terms of features, research on heart rate variability (HRV) traits has been paving the way for the work on arrhythmia classification based on RR metrics (demoted NN when dealing with normal heartbeats). The QRS complex, i.e., the most prominent characteristic among the PQRST electrocardiogram wave points (see Figure 3), is understandably at the basis of ECG assessment and has been extensively investigated. QRS detection algorithms and R-R interbeat computation are standard practice in ECG processing nowadays, with RR time series (tachogram) and subsequent HRV features currently being implemented in online paradigms [20] and seen in wearable health tracking domains. Established HRV analysis practice covers:
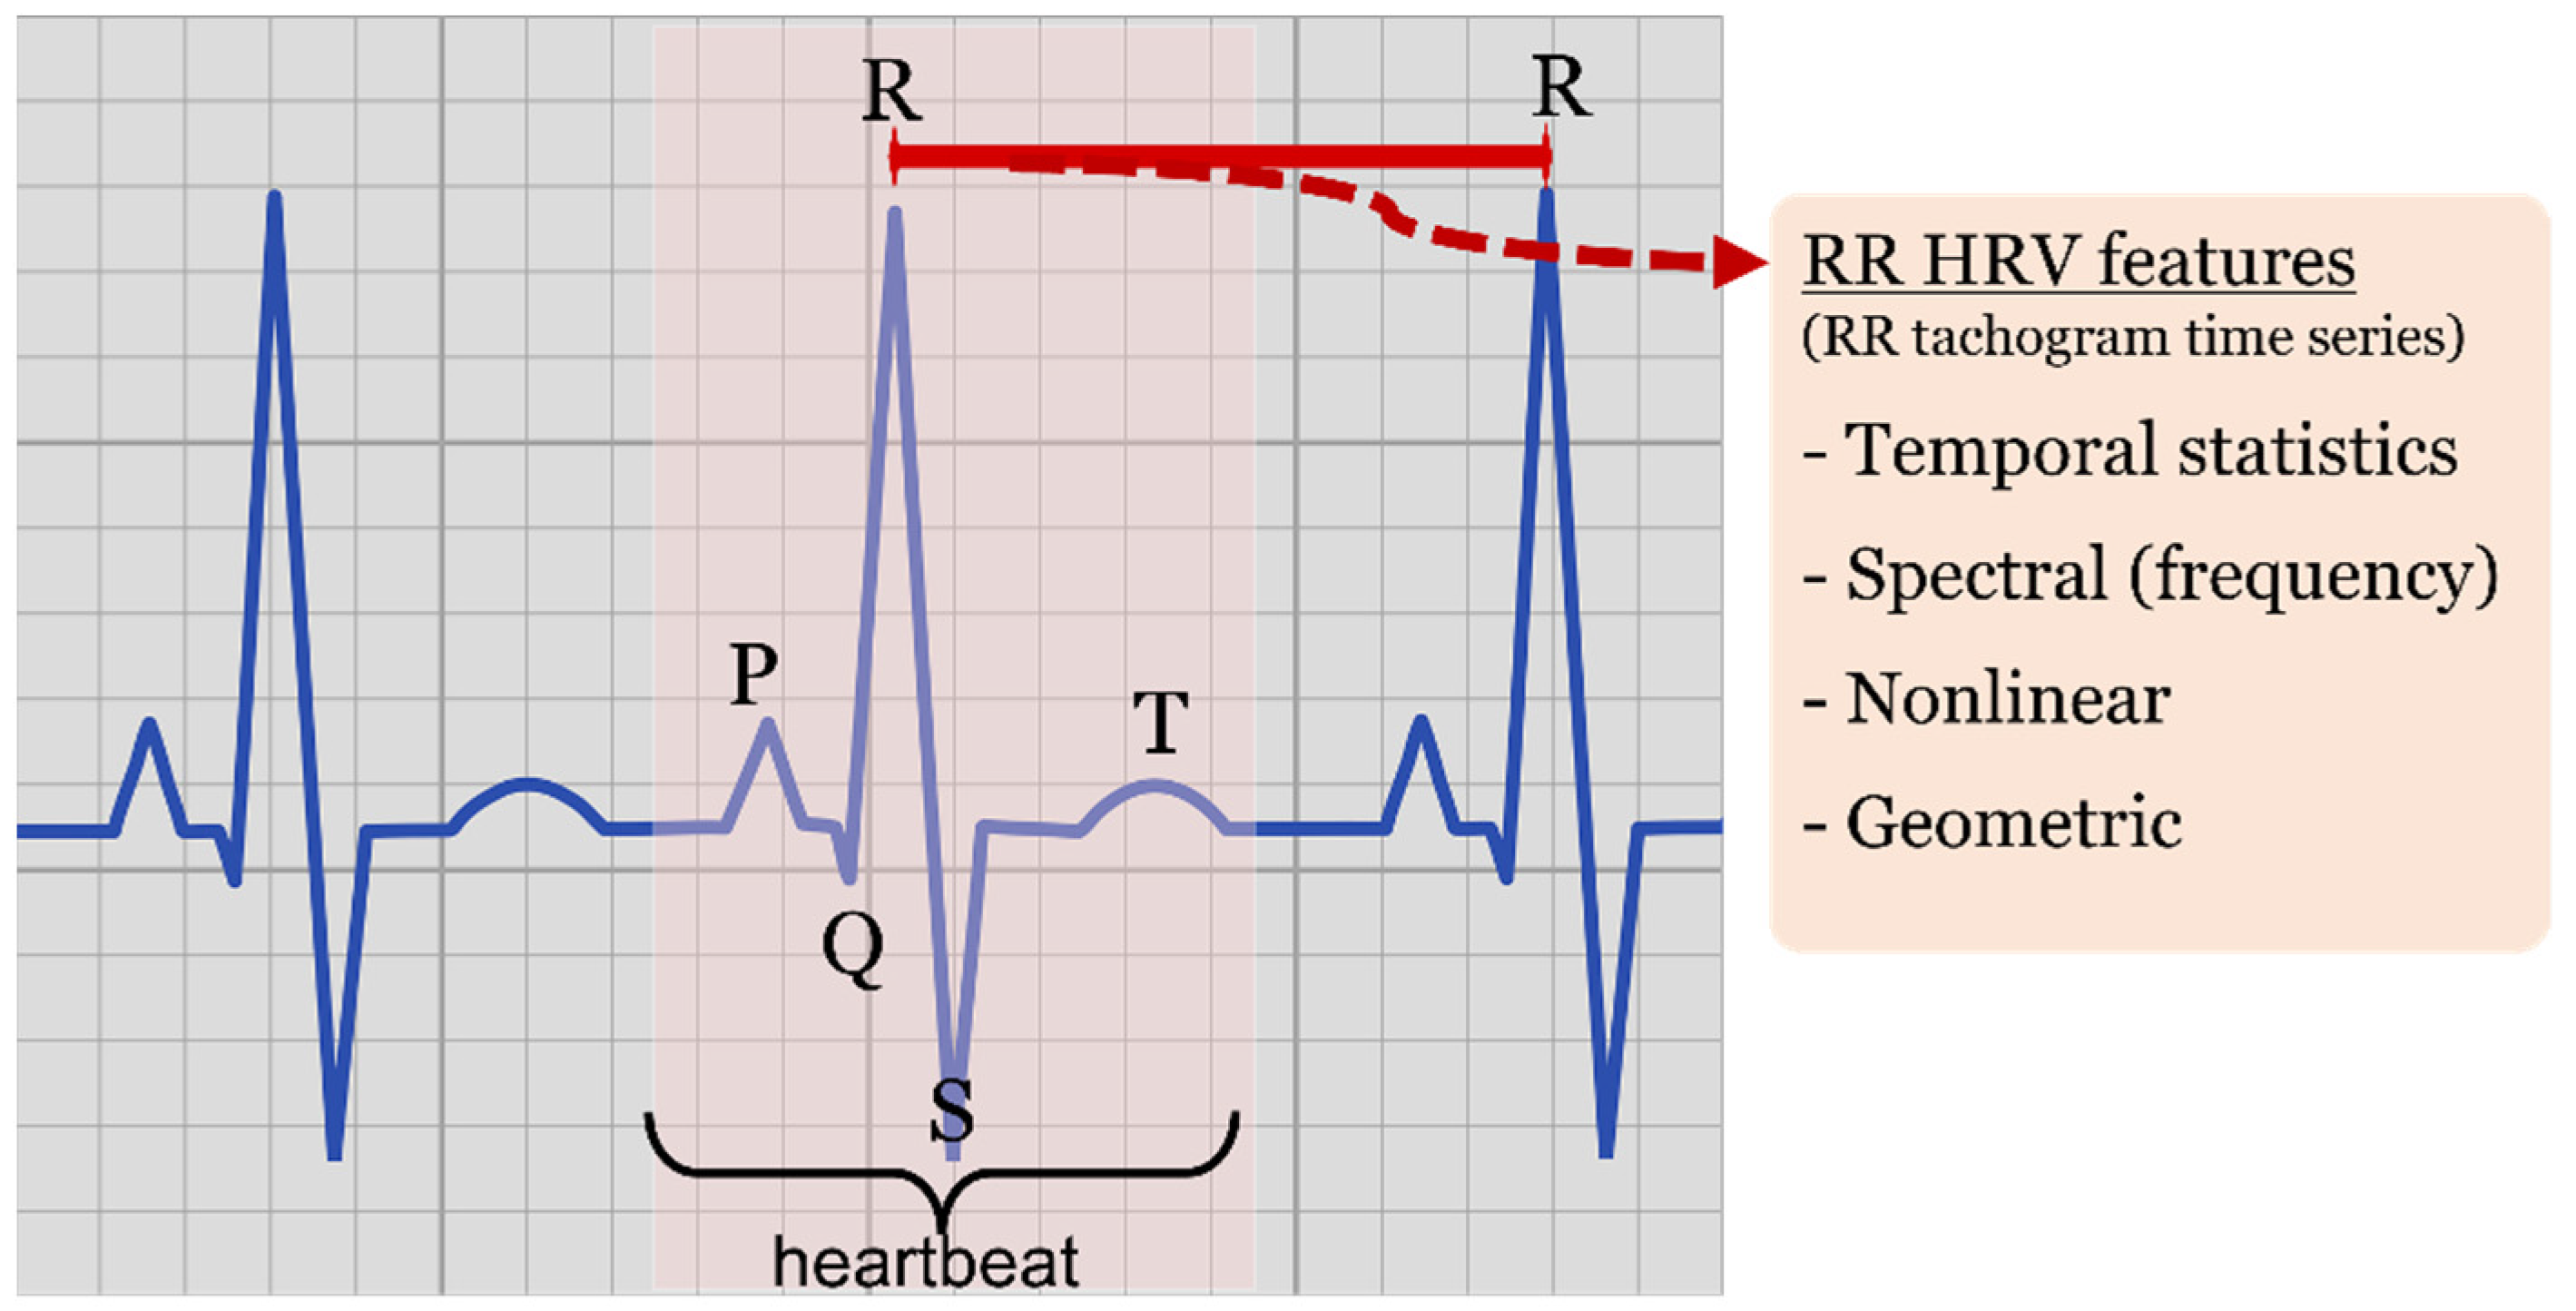
  • Statistical features of temporal nature, such as minimum RR intervals (minRR), maximum RR interval (maxRR), mean RR (<RR>), RR standard deviation (SDRR), root mean square of successive ΔRR differences (RMSSD) and standard deviation of successive differences (SDSD) working as derivative approximations, pNN20 and pNN50 ratios characterizing the amount of heartbeat intervals greater than a given value (20 or 50 milliseconds, respectively) with respect to all the intervals within the processed window.
  • Nonlinear features, such as those derived by the elliptic geometry of the recurrence plot depicting RRi-RRi+1 consecutive interval relationship (known as Poincaré recurrence plot or Lorenz plot depending on the research discipline).
  • Spectral (frequency) features of the tachogram, characterizing power spectral densities, and different spectral band ratios obtained by spectral analysis methods such as Fourier transform approximations, Lomb-Scargle estimates or wavelet transforms, among others.
  • Geometric features, derived by histogram shape analysis, such as triangular indexes and interpolation.
Other features applied to RR or directly to the ECG waveforms have often been used, such as the study of turning points, the application of different definitions of sample entropy (SampEn), Shannon entropy (ShE), and coefficient of sample entropy (COSEn), more elaborate statistics such as ANOVA analysis, statistical tests and coefficient of variation (CV) taking mean and standard deviation ratios, or different approximations to parameter derivatives. Moreover, it is well-known that the QRS complex is the least sensitive trait to muscle artefacts and/or other noises [21]. Unlike sinus rhythm, which is characterized by quite similar RR durations, AF has an irregular RR interval variability. Many researchers have developed different methods to detect AF by RR time series. Among the different AF detection methods centered on RR features, automatic techniques follow univariate or multivariate approaches.

3.1. Application of Univariate Data Analysis on RR Time Series

The best way to get a first impression about the complex data of the RR time series is a univariate data evaluation. Indeed, a great number of researchers has opted for this approach rather than multivariate data analysis. Simplicity, short computation times and efficiency are its main advantages. Major applications of univariate RR data analysis for AF diagnosis found in the literature are described in this subsection.
To begin with, the effectiveness of three methods for the analysis of patients suffering from AF or not are investigated by Kikillus et al. [22]. The first one is established on the basis of risk level which is calculated from a Poincaré plot (recurrence). In this case, this plot is obtained from the temporal differences of consecutive RR intervals, after normalization and standard deviation. A patient presenting higher risk levels than those specified in specific threshold is identified as a patient with AF. The second method consists of three different tests, based on integral calculation, that compare different frequencies of 45 min of RR intervals. Their third method consists of two tests that utilize 3500 adjacent RR interval differences. The AF decision is made based on histogram, difference feature and pNN200 (a modification of the standard parameter pNN50). The performance of the three methods was evaluated by using the AFDB and the NSRDB datasets. The sensitivity and specificity of the first method are 91.5% and 96.9%, respectively [23]. Method 2 results in a sensitivity of 93.3% and a specificity of 92.8% and method 3 in a sensitivity of 94.1% and a specificity of 93.4%. Since ectopic beats were removed from RR intervals, these results may change in real cases.
The effect of recording duration on AF detection has been studied by P. Langley et al. [24]. Three features have been studied: coefficient of variation (CV), mean successive difference (Δ) and coefficient of sample entropy (COSEn). The Receiver operating characteristic (ROC) analysis results show that for a recording duration of only 10 s, sensitivities and specificities reached more than 94% and around 93%, respectively. They demonstrated that recording durations of less than 5 s are possible but useless mainly for low heart rates, as the recorded beats will not be able to determine the classifier indices. On the other hand, detection performance using COSEn has shown less dependence on rhythm classification than the other features and is said to be a powerful detector against ectopic beats.
Another use of Entropy was studied by Douglas E. Lake et al. [25], analyzing short (12-beat) AF episodes. Optimal template length and the tolerance matching have been carefully checked. ROC analysis results showed a sensitivity of 91% and a specificity of 94% for the AFDB dataset.
Sándor Hargittai [26] has investigated the performance of Shannon entropy, Root Mean Square of Successive 80-RR Differences, other statistical methods (mean value, standard deviation, etc.), turning point ratio, various scatter plots and Sample Entropy features to detect AF. In this study, the scatter plot of successive RR differences (dRR Lorenz Plot) and Sample Entropy were used to yield an approximate error rate of 5% for the MIT-BIH Arrhythmia Database, AFDB and Long-Term AF datasets.
Another simple method to detect AF was proposed by J. Lian et al. [27]. Their algorithm is based on a map of RR vs. RR intervals change of RR intervals (RdR). The map was constructed by dividing a grid with 25-ms resolution in two axes and only non-empty cells are counted to distinguish between AF and non-AF episodes. Three recording durations have been studied: 32, 64, or 128 RR intervals. ROC curve analysis allowed to fix an optimal threshold for AF detection, which yields good sensitivity and specificity for episodes of 32 RR time series (94.4% and 92.6%, respectively), 64 (95.8% and 94.3%), and 128 (95.9% and 95.4%).
Ghodrati et al. [28] have investigated two RR irregularity characteristics for AF detection in ECG: Normalized absolute deviation of RR intervals and normalized absolute difference between successive RR intervals. Some constraints for RR intervals have been added before the calculation of these parameters. ROC results showed 87.33% and 89.33% as overall of sensitivities of three AF datasets (AFDB, MIT-BIH Arrhythmia Database and Drager Atrial Fibrillation Database). In another paper, A Ghodrati and S Marinello [29] have compared two probability density functions (Gaussian and Laplace) to model the histograms of RR intervals. They have used Neyman–Pearson (NP) detection approach to find out suitable criteria for the arrhythmia detection. Indeed, Gaussian probability density function assumption leads to a simple NP detection criterion reduced to variance test and absolute deviation [30]. Analysis has been done on windows of 30 heartbeats. Since both detection criteria are sensitive to noise measurement, they added a constraint on the absolute value of the RR time series differences and excluded those greater than a fixed threshold. RR intervals bounded by Ventricular Beats have also been excluded. These approaches did not outperform their previous study as it reached 88% and 89.33% as overall of sensitivities of the same AF datasets for Gaussian and Laplace probability density functions, respectively.
Petrėnas et al. [31] conceived a low complexity structure to detect AF arrhythmia. This method involved different blocks including preprocessing (3-point median filter), bigeminal suppression (measurement of inter-beats irregularity), data fusion, decision function, and finally detection of an appropriate threshold (specific value for which sensitivity and specificity are identical). High specificity and sensitivity (98.3%and 97.1%, respectively) were achieved for AFDB and NSRDB. However, a lot of false alarms were produced when atrial flutter or ventricular flutter is encountered. It is worth noting that this algorithm required a window of only 8 RR intervals, which is appealing for short AF episodes detection. Rather than RR intervals, L. Hong-wei et al. [32] have reconstructed a phase space of RR intervals following the application of Takens’ embedding theorem [33]. The distribution of probability density function (PDF) of the distance between two points in the attractor is then analyzed. The authors argue that the PDF possibly contains relevant information about the phase point spatial distribution in the reconstructed attractor. A new characteristic variable kn, defined as the sum of n points slope in filtered PDF curve, is established in order to detect AF arrhythmia. The use of the information on filtered PDF curve slopes contributed to higher precisions achieved in AF detection. Additionally, how the number of RR intervals affect AF detection precision has been studied. Experiments on the AFDB dataset following this technique proved correct AF identification with a performance of 97.80% sensitivity and 99% specificity for 40-RR intervals. However, the reduction of analyzed RR intervals undermines the detection precision.
Three linear and nonlinear features have been proposed by S. Cerutti et al. [34] to characterize RR dynamics for the detection of AF episodes of AFDB and local datasets. On one hand, two parameters were extracted through the identification of an autoregressive model of RR time series to assess the predictivity and to enhance the presence or absence of normal sinus and AF rhythms in the tachogram. On the other hand, the minimum of the corrected conditional entropy is calculated to verify the regularity of the RR sequences. An optimum set of threshold was selected by ROC analysis and results showed that the three parameters share the same sensitivity (93.3%), but they differed in terms of positive predictivity. The variable that characterizes the tachogram predictivity showed the best performance (94.4%).
K. Tateno and L. Glass [35] have studied the similarity between the successive difference of RR intervals (ΔRR) and the standard density histograms of 100-RR. First, a density histogram of RR and ΔRR was computed. The two histograms were then used as a template for AF detection. Benchmark standard histograms and a test record differences followed a quantitative evaluation by Kolmogorov–Smirnov (KS) test using p-value statistical significance. Test record comparisons (AFDB and the MIT-BIH Arrhythmia Database) led to the demonstration that the density histograms of ΔRR work more accurately for most subjects (the average sensitivity and specificity is 93.2% and 96.7%, respectively) than RR intervals density histograms. Nevertheless, for short AF episodes, the specificity decreased. In another paper [36], the same authors have compared coefficient of variation of RR and ΔRR intervals density histograms. The Kolmogorov–Smirnov test using RR intervals did not improve the coefficient of variation test results, while the Kolmogorov–Smirnov test using the ΔRR intervals improved both the sensitivity and specificity (94.4% and 97.2%, respectively).
Other uses of RR distribution plots and ΔRR histograms have been performed by E. Petrucci et al. for very long terms (weeks) AF monitoring [37]. Geometric features, such as width of the histogram base, its height and some characteristics from unimodal or multimodal distribution, have been studied to characterize theses distributions. Main distribution width of Δ-RR histograms has been selected as the best discrimination parameter. Sensitivity and positive predictivity reached 92% and 78%, respectively, when tested on the AFDB dataset. Only episodes longer than two minutes RR intervals segments were included in the analysis. As a clinical output linked to shorter AF episodes, authors argue that their relevance is lower in long-term monitoring use cases.
X. Ruan et al. [38] presented a scatter plot approach to distinguish AF arrhythmia from normal sinus rhythm. One-minute RR interval signals were used to represent the plots. From the plots, four geometrical features were used, namely, Vector Angular Index (VAI), Vector Length Index (VLI), Dispersion of points along the diagonal line (SD2) and perpendicular to the diagonal line (SD1). Each index was tested using Mann–Whitney test to see if there was significant difference between the two groups. Indeed, Box plots demonstrated clear difference of each index between AF and regular ECG. The optimal threshold ranges for the classification of the two groups have been found by ROC curve analysis. The best parameters to achieve high performance are SD1 and SD2 which reached a sensitivity of 98.3% and a specificity of 100%. These results have been obtained using a small dataset as it contained only 120 recordings (60 from AF Termination Challenge Database and 60 ECG recordings from healthy people) of 1 min duration, which cannot be directly integrated into an applicable tool as a generalization study involving a big dataset would be required.
The method introduced by Zhou et al. [39], comprised a three-pass procedure. The first pass, where a sequence of RR interval is pre-processed with median and low-pass integer filters, aims to generate low/high scale reference sequences. The second pass is aimed at obtaining a dynamic symbolic sequence of the first pass data. Symbolic dynamics transform the information as a variation of successive RR to a series of fewer symbols, where each symbol is representing an instantaneous state. Finally, a third pass consists in calculating Shannon entropy for the symbolic sequences to discriminate AF presence in the corresponding heartbeat. ROC analysis on Shannon entropy feature allows setting a threshold for optimal discrimination (0.353). The best performance achieved corresponds to a sensitivity and specificity of 96.72% and 95.07%, respectively (Long-Term AF used as training set). AF and normal sinus rhythm samples are found in the test dataset (AFDB), reaching a sensitivity and specificity of 96.89% and 98.25%, respectively. However, the study stresses that sporadic AF episodes of relatively short duration (e.g., ten seconds) may pose potential limitations due to false negative detections.
In another paper, Xiaolin Zhou and co-workers [40] have reapplied the same strategy with a different optimal discrimination threshold (0.639) to four clinical datasets. For the same training dataset, 96.14% and 95.73% were achieved for sensitivity and specificity, respectively. For AFDB (test dataset), they reached 97.37% and 98.44%, respectively. Therefore, by comparing results of the remaining datasets, the present threshold demonstrates a slightly better performance.
Dash et al. [41] have developed an algorithm that combines three features: root mean square of successive differences to measure the variability, the turning points ratio as a test for RR intervals randomness and Shannon entropy to characterize its complexity. Suppression of ectopic beats bas been applied prior to the calculation of parameters. AF arrhythmia presence using this method is determined in accordance to threshold-based conditions. AF detection using a beat-by-beat approach is evaluated and accuracy is shown through a ROC curve indicating that the optimal episode length is 128-RR intervals with at least half of AF to ensure correct classification of the segment/episode as AF. For AFDB, sensitivity and specificity metrics achieved were 94.4% and 95.1%, respectively; and 90.2% and 91.2% for the MIT-BIH Arrhythmia Database, respectively.
Winkler et al. [42] have studied the accuracy rate of a new algorithm for AF detection in cardiac telemonitoring with portable ECG devices. In order to do so, an AF indicator is calculated in overlapping 52-beat windows from the histogram of RR interval differences of 120-s ECG recordings. The indicator is calculated from the ratio of histogram width to height, the number of premature ventricular beats that it may include and the position of the histogram peak. The ROC analysis on only 8 recordings in the MIT-BIH Arrhythmia Database has permitted us to determine an optimal threshold value for AF detection. The reported method reached a sensitivity of 92.9% and a specificity of 90.9%. As limitations of the study, this algorithm cannot run if ECG recordings do not have enough beats because of the required minimum of 52 beats.
To screen for AF presence, B. Logan and J. Healey have used a smoothed normalized variance of 10 s of RR intervals [43]. The feature normalization was inspired by Moody and Mark [44]. This method comprised 5-step-process: RR calculation, RR normalization, variance computation and initial AF detections over each 10 s. Finally, a decision, based on a simple majority voting scheme over 600 beat windows, is formulated using the smoothed initial classifications. The algorithm, which is a morphology-independent, is suitable for ambulatory monitoring situations. ROC analysis results on the AFDB showed a sensitivity of 96% and a specificity of 89%.
Different cardiac rhythm transitions, in particular between AF and sinus rhythms, have been carefully studied by C. Huang et al. [45]. The proposed method involved 2-step process: (1) AF detection using 100 Δ-RR intervals distribution difference curve (dRDDC) and (2) AF event classification (onset, cessation, and none). The first step includes dRDDC computing, detecting a peak in the dRDDC (local maximum value) for at least each 20 beats, and filtering noise peak (distinction between noise peak and event peak). The second step involves one to four successive steps to classify event type: (1) analysis of histogram; (2) analysis of standard deviation; (3) numbering aberrant rhythms recognition; and (4) Kolmogorov–Smirnov (K–S) test. The algorithm performance increases step by step to finally reach 96.1% and 98.1% of sensitivity and specificity, respectively, for the AFDB dataset. The authors assumed that the accuracy decreases with the number of RR intervals, stating a 20-heartbeat-long limitation for AF episode detection.
Moody and Mark [44] are among the first researchers having proposed an AF automatic detector. They have compared a basic Markov model to a basic Markov model with filtering, with interpolation, and with both. The idea was to yield a Markov model in which the probabilities for transitions between short, regular and long RR intervals of a test record are compared with the transition probabilities measured during AF. Results showed that a Markov model combined with filtering and interpolation outperformed the other approaches and reached 96.09% and 86.79% of AF sensitivity and positive predictivity for the MIT-BIH Arrhythmia Database.
Brian Young et al. [46] studied Markov models as well, comparing various algorithms of AF detection to determine the best suited for clinical environment uses (real use case scenario). The investigated algorithms followed a Hidden Markov Model (HMM), measures of variance, linear predictive coding, and measurement of approximate entropy. Ectopic beat removal was performed before analysis, not having an impact on the detector assessment. The HMM algorithm turned out to be the one which performed best for this application, based on the study results from the training and test datasets. Error rate estimates amounted to 7% for training dataset (MIT-BIH Arrhythmia Database) and 5.97% in the case of the test dataset (AFDB).
A novel smart phone application has been conducted on moderately sized prospective cohort study regarding 76 patients with AF undergoing cardioversion [47]. The real-time pulse analysis was performed using two statistical techniques: normalized root mean square of successive 64-RR difference (RMSSD/mean) and Shannon entropy (ShE). Decision is given by a simple logical condition on the both features after fixing thresholds on the basis of the AFDB and NSRDB datasets. Findings revealed that the algorithm combining RMSDD/mean and ShE was 100% and 96.05% accurate for identifying pulse recordings obtained from AF patients and NSR, respectively. The authors assumed that exposure to very high temperatures or bright ambient light, or patients with a high burden of premature beats and/or atrial tachy-arrhythmias might change the performance of the app.
The same authors have introduced time-varying coherence functions (TVCF) and Shannon Entropy (ShE) for the same goal [48]. The TVCF is calculated by the multiplication of two time-varying transfer functions (TVTFs), which are obtained from two adjacent 128-RR segments. Combination of the two features has been done by logical AND condition. This approach reached a specificity of 97.54%, a sensitivity of 97.41% (accuracy of 97.49%) for the AFDB, and a specificity of 100% for the NSRDB dataset. In another study [49], they have investigated the ability of three statistical techniques, namely, the root mean square of successive differences (RMSSD), the Shannon entropy (ShE) and the sample entropy (SampE) to diagnose paroxysmal AF. SampE use led to the best performance achieved. The largest area under the ROC curve, using both the AFDB and NSRDB datasets, yields optimal thresholds as the calculated sensitivity and specificity show: 97.26% and 95.91%, respectively.
Duverney et al. has proposed a cascade of two sequential complementary analyses of RR intervals for automatic AF arrhythmia detection [50]. The first one consisted of discrete wavelet transform (DWT) to identify periods of high heart rate variability (HRV) coefficients. Afterwards, a fractal analysis based on Fourier transform was used to generate a general trend that helps slope study of a log–log plot. This procedure permits classifying high variability periods into physiological (SR) or pathological (AF) rhythms. Results, obtained on local datasets, showed that specificity has reached 99.9% in the SR group, sensitivity has reached 99.2% in the chronic AF group; and in the paroxysmal AF group, sensitivity and specificity have reached 96.1% and 92.6%, respectively. However, short AF episodes may go undetected since at least 64 consecutive beats are needed to compute the features. Supraventricular premature beats, supraventricular tachycardia, and other kinds of arrhythmias may be confused with AF detection.
G Hindricks et al. have exploited a subcutaneous insertable cardiac monitor device to detect AF [51]. The device is optimized for the subcutaneous R-wave sensing [52], and classification of all cardiac rhythms is based on the captured RR intervals. Two-minute segments’ analysis via Lorenz plot of the RR interval differences was used for HRV evaluation. Tests have been done on an internal dataset containing 2982 h of valid recordings. The detection of AF episodes reached 90.6% and 98.1% sensitivities on average, for AF episodes ≥2 min and ≥4 min, respectively. However, episodes shorter than 2 min are unlikely to be covered by these approach capabilities.

3.2. Application of Multivariate Data Analysis on RR Time Series

In RR time series analysis, it is important to quantify the randomness of the RR intervals. This is usually done by simple measures. Additionally, modeling helps in the attempt to construct a model capturing RR irregularity. AF arrhythmia’s erratic nature, though, makes it difficult to exactly model RR irregularities present in AF. However, telling apart AF RR irregularities and that of other of other cardiac arrhythmias is supported by models.
The research works on automatic AF detection using multivariate data analysis and which have been applied successfully to RR time series are discussed in the subsection. Figure 4 outlines different types of data analysis techniques. The abbreviations are listed in Table 1.
To illustrate this idea, Roberta Colloca et al. have compared univariate and multivariate data analysis to build a reliable AF detector [53]. Ten RR features present in approaches that had demonstrated high performance were tested. The classification performances of the selected features were evaluated via two methods, i.e., using univariate analysis and Support Vector Machine (SVM) as a robust multivariate data analysis. The chosen variables were as follows: COSEn; SampEn; OriginCount (the count of the number of {RRi; RRi-1} values in the bin containing the origin); PACEvidence (reflects the evidence of compensatory pauses); IrregularityEvidence (measured the sparseness of RR histogram distribution); AFEvidence (AFEvidence = IrregularityEvidence OriginCount − 2 × PACEvidence), as described by Sarkar et al. [54]; and the median of absolute deviation (MAD) [55], which is a RR variance-based AF feature. Median heart rate, minimum RR interval and mean RR interval were also included within the set of chosen features. In addition, window lengths (WL) varying from 12 to 300 s and minimum number of AF beats (minNbeat) within an N-beat segment were carefully quantified as a requirement to classify a given segment as an AF event. Indeed, researchers followed a 5-fold cross validation to assess the optimal WL using the minNbeat values. Excellent results have been obtained by using the SVM, built by nine out of ten features, on the AFDB for training purposes (Se = 99.07% and Ac = 98.84%) and both the NSRDB and the MIT-BIH Arrhythmia Database for testing (Se = 96.35% and Sp = 98.91% for a relatively short window length of 65 beats). These findings were enhanced for window length of 140 beats and outperformed all the features analyzed separately.
M. Mohebbi and H. Ghassemian have compared two cascade multivariate analysis methods to detect AF episodes of only 32 RR intervals [56]. The idea was to perform a dimensionality reduction of features and selection of discriminating ones by choosing between principal component analysis (PCA) and linear discriminant analysis (LDA) and then conduct a support vector machine (SVM) classification based on the resulting features. PCA and LDA have reduced the initial set of features from 9 (6 linear and 3 nonlinear features) to 4 principal components and 4 discriminant functions, respectively. To build a robust SVM classifier, radial basis function (RBF) as kernel function has been used and kernel width σ and regularization constant C were optimized (σ = 10 and C = 1). The overall sensitivity and specificity of the proposed method (LDA + SVM) have reached 99.07% and 100%, respectively, when tested on MIT-BIH Arrhythmia Database. These results outperformed those of PCA + SVM approach (99.28% of specificity) and were also better than the SVM classifier when it was directly used on the initial nine features (97.22% of sensitivity and 98.57% of specificity).
The same strategy has been attempted in a work with Mohammadzadeh Asl et al. to discriminate six different types of arrhythmia classes including NSR and AF [57]. Here, generalized discriminant analysis (GDA) feature reduction was used to yield 5 discriminant functions instead of 15 extracted from the input HRV signal (32 RR intervals) of MIT-BIH Arrhythmia Database. SVM-based radial basis function was then applied to both original and reduced features using the optimum values of σ (=0.08) and C (=30). The authors have compared the performances of two types of SVM decomposition method: the one-against-one and the one-against-all. This latter has outperformed the first one and therefore can discriminate the NSR with an overall accuracy of 98.94%, the AF with 98.53%, the premature ventricular contraction with 98.96%, the sick sinus syndrome with 98.51%, the ventricular fibrillation with 100%, and the 2° heart block with 100%.
In another study [58], they have extracted 14 features from HRV signal. These features consist of 4 spectrum features (spectral power in the low frequency (LF) and high frequency (HF) bands and their frequency peaks), 6 cross-spectrum features, and 4 nonlinear features including SD1, SD2, SD1/SD2, and sample entropy. ANOVA (analysis of variance) test of these features was applied to determine whether there were statistical differences in the features extracted from paroxysmal AF (PAF) and non-PAF episodes. For the AFDB, all the features exhibit statistically significant differences in two groups except frequency peaks in LF and HF bands, which were then eliminated from SVM classifier building. By using RBF Kernel function, the optimum values of SVM parameters are achieved as 3.6 and 10 for σ and C, respectively. The obtained sensitivity and specificity were 96.30% and 93.10%, respectively.
Desok Kim et al. presented a study in which HRV features of AF arrhythmia episodes, researchers hypothesize, could be different depending on the time of the day [59]. Indeed, they started by studying HRV patterns of AF episodes during entire day, daytime and evening time. From AFDB, four data acquisition sessions were chosen: morning session (6 a.m. to 12 noon, time period (1)); afternoon session (from noon to 6 p.m., time period (2)); evening session (from 6 p.m. to 12 p.m., time period (3)) and late night session (from 12 a.m. to 6 a.m., time period (4)). Only RR intervals between 0.75 and 1.5 times the accumulated RR average are kept, to avoid significantly short or long RR intervals due to issues of noisy signals or missing R peaks, respectively. Three classifiers based on Logistic regression analyses were generated for the studied session’s day. The second classifier dedicated to the daytime detection of AF episodes performed more accurately with 99.3% success rate compared to the first (whole of the day) and third (evening time) classifiers (95.2% and 93.8%, respectively).
SG. Artis et al. pioneered the use of pattern recognition methods for AF diagnosis [60], among other researchers. In the study, a backpropagation artificial neural network to detect AF in the presence of other cardiac arrhythmias was designed and evaluated. The input of the neural network consisted in a generalized interval transition matrix, similar to that discussed above by Moody and Mark in [44]. The size of the hidden layer was set empirically to 12 (established by training networks while changing hidden layer size from 4 to 16 units). A 30-point moving average post-processing technique, with two thresholds, applied to ANN output, achieved AF classification positive predictive value of 92.34% AF and a sensitivity of 92.86% for the used AFDB dataset.
M. Carrara and coworkers have proposed an effective solution to distinguish normal sinus rhythm and AF from the condition of sinus rhythm (SR) with atrial and ventricular ectopy for 10 min of RR segments [61]. First, a univariate analysis involving the coefficient of sample entropy (COSEn), local dynamics score (LDs) and detrended fluctuation analysis has been conducted using ANOVA tests (one-way Kruskal–Wallis) to compare the index values among the three groups (NSR, AF, SR with ectopy) and post hoc multiple comparisons were performed following Wilcoxon rank-sum test with Bonferroni correction. Results showed that taking one univariate metric is not sufficient to successfully achieve a separation of the three groups, for 24 h Holter recordings collected from 2722 consecutive patients (377,285 segments of 10 min RR interval) at the University of Virginia Heart Station. Afterwards, three multivariate analysis methods were compared: Logistic regression, K-nearest neighbors and Random forests. All models were validated using a 10-fold cross-validation procedure on the entire dataset. The random forests analysis, applied to the three nonlinear features with mean and standard deviation of RR segment, reached positive predictive values of 90, 98 and 97% for SR with ectopy, AF and NSR, respectively. The effectiveness of the classifier in a continuous context, mimicking real-time implementation has been also investigated. Changes in heart rhythm are faithfully detected. It is worth noting that this classifier was trained to consider atrial flutter to be the same as AF.
F. Yaghouby and co-workers [62] have compared two approaches of genetic programming, namely, linear genetic programming (LGP) [63] and multi-expression programming (MEP) [64] and a weighted least squares (WLS) regression analysis to discriminate samples of AF arrhythmia and NSR episodes. Indeed, four statistical (Mean, STD, RMSSD and pNN50) and two geometrical (HRV triangular index and triangular interpolation of normal-to-normal interval histogram) features were extracted from 64-RR segment. Then, a feature selection technique based on an improved forward floating selection (IFFS) analysis was conducted. The IFFS algorithm was an improvement upon the sequential forward floating selection (SFFS) [65] algorithm. Thus, Mean, STD and RMSSD were selected as three relevant features. The application of the statistical methods on MIT-BIH Arrhythmia Database (70% for training and 30% for testing) yields an arrhythmia class as simple functions of the three features. Results have shown that LGP model has outperformed MED and WLS models in training and test phases. Therefore, sensitivity and specificity of the LGP model for the training data were 99.56% and 99.19%, respectively. These rates are, respectively, equal to 99.11% and 98.91% for the testing data.
J. Park et al. [66] have exploited three features extracted from HRV in Poincaré plot as inputs to K-means clustering methods and Support Vector Machines with radial basis function kernel. These features are the number of clusters in Poincaré plot, mean stepping increment of inter-beat intervals, and dispersion of the points in the plot. First, a K-means clustering approach was followed to set a criterion about the number of clusters in Poincaré plot. Consequently, this helped mitigate possible inter-beat interval calculation errors that are not uncommon in AF data. In the case of clustering exhibiting either a single cluster or too many of them, an SVM is called to discriminate AF from non-AF using only two feature measures: the stepping increment of inter-beat intervals (average), and diagonal-based dispersion of the points. The SVM performance was evaluated using a 4-fold cross-validation method with leave-one-out on the Paroxysmal Atrial Fibrillation Prediction Challenge Database and Atrial Fibrillation Termination Challenge Database samples. The classification metrics achieved correspond to average values of 91.4% sensitivity and 92.9% specificity.
R. Acharya et al. [67] have attempted to classify NSR and 8 different arrhythmias including AF, collected from Kasturba Medical College Hospital, Manipal (India), by using the multilayer perceptron artificial neural networks. The spectral parameters of the RR interval variability have been extracted using fast Fourier transform algorithm and three modelling techniques, namely, autoregressive (AR) model, moving average (MA) model and autoregressive moving average (ARMA). The idea was to evaluate the frequency domain-based approaches that would yield better resolution and could be used for diagnosis in clinical practice. Results showed that the ARMA model gave better accuracy compared to the other modelling approaches, which attained 83.33% as a correct classification of the studied diseases. While this method may work very well for NSR (100% as correct classification), it seems that it often failed to detect AF (66.67% as correct classification).
Tsipouras and Fotiadis have used ANN to compare time and time–frequency (t–f) analysis to detect several arrhythmias including AF in only 32-RR intervals [68]. Standard deviation, root mean square of successive differences, standard deviation of successive differences, the percentage of intervals presenting time duration difference between adjacent normal-to-normal RR intervals greater than 5 ms, 10 ms and 50 ms, have been extracted from the tachogram. All possible combinations (63 cases) among these features were tested by a feed-forward back-propagation neural network (FFBPNN) to create the pattern set for the classification stage. Input features to FFBPNN for the t–f analysis was based on the use of short time Fourier transform (STFT) and 18-different t–f distributions (TFDs). The outputs from all neural networks are fed into a 3-step decision rule (average, vote and decision vote) to classify each RR-segment as normal or arrhythmic. These approaches were evaluated using the MIT-BIH Arrhythmia Database. The obtained findings for both sensitivity and specificity reached 87.5 and 89.5%, respectively, for time domain analysis and 90 and 93%, respectively, for t–f domain analysis. This methodology lumped together several arrhythmias (AF, ventricular fibrillation, ventricular tachycardia, supraventricular tachycardia, etc.), which assumes that all arrhythmias may pretend to be AF.
Supervised linear discriminant classifier (LDC) has been used by Shouldice et al. to estimate the likelihood of a segment of 100 RR intervals that contain PAF and NSR [69]. Trimmed mean of RR intervals, square root of spread in inter-heartbeat interval and its difference, and normalized squared sum of inter-heartbeat differences values less and greater than a fixed value (50 ms) have served as inputs to LDC. Accuracies of 92%, 94%, 100% and 100% have been reached on MIT-BIH Arrhythmia Database, AFDB, NSRDB and NSR2DB databases, respectively. However, the authors noted that other rhythms (whether arrhythmias or arising during periods that would be labeled as “normal”), ventricular premature contractions and false detection of QRS complexes, that give rise to irregular RR interval times, may also trigger the classifier.
Recently, deep learning techniques, as a new generation of machine learning pipelines, began attracting interest to AF screening. In this sense, O. Faust et al. [70] have applied a deep Recurrent Neural Network (RNN) with Long Short-Term Memory (LSTM) on 100-RR interval. The training process has been performed without feature extraction and thereby the RNN can use all the available information. This approach has been trained on data from 20 patients (AFDB) and blind tested with the data from the remaining 3 patients of AFDB. This strategy achieved 98.32% and 98.67% as sensitivity and specificity, respectively, with 10-fold cross-validation process against 99.87% and 99.61% as sensitivity and specificity, respectively, with the blind fold validation. Among the reported limitations of this work is the significant time of training phase of the algorithm and the limited number of subjects under study. Another recent account of deep learning capabilities for AF arrhythmia detection is offered by the work of Mendez et al. [71], where the high performance of convolutional neural networks (CNN) for image analysis is exploited by translating AF detection into a suitable problem using of 400-point HRV sequences transformed into four extended Poincaré plots that serve as the CNN (visual) feature matrix inputs. The final input matrix choice is supported by a genetic algorithm. Addressing the problem of Paroxysmal AF detection in 5-min HRV segments, performance achieved values of 80.4% and 89% sensitivity and specificity, respectively, in a system trained by the Paroxysmal Atrial Fibrillation Prediction Challenge data that is tested with a combination of NSRDB and AFDB HRV sequences including Paroxysmal AF cases from the latter. In the work of Ramesh et al. [72], important progress is shown in moving ECG-based AF detection methods to photoplethysmography-equipped remote health tracking devices. Although still falling short in performance with respect to benchmark tests on databases, partly due to class imbalance for the device acquired data, this work successfully paves the way for future transfer knowledge directions. Having trained CNNs fed with 13 temporal HRV features by using 30 s samples from MIT-BIH Arrhythmia, AFDB and NSRDB databases, data is downsampled to 50 Hz and tweaked to more closely match the pulse rate metrics form the device operation. As a result, the classifiers are able to achieve a performance of 94.50% sensitivity and 96.00% specificity for a 5-fold cross-validation on the ECG dataset, and a sensitivity of 77.80% and specificity of 88.54% for a test with wrist device data (25% of test datapoints, with 60% retraining and 15% validation) that has followed weight retraining and a 4-fold stratified cross-validation.

3.3. Summary of RR-Based Automated AF Detection Research Studies

By means of the state-of-the-art literature described, we presented a selection of works that have kept studies on algorithms and features suited for automated atrial fibrillation detection at the forefront of research. Originally, the QRS detection and the simple RR interbeat interval estimation supporting the computation of tachogram (RR series) and HRV features gave rise to a wide set of statistical, spectral and nonlinear approaches applied to such variables. This field, however, has recently experienced a significant surge prompted by the advances seen in health monitoring device development initiatives and the opportunities brought by a set of more mature IoT and Cloud infrastructures giving way to remote processing paradigms traditionally deemed as computationally demanding. Although the different reported performance metrics make comparisons between studies difficult, the following Table 2 (univariate) and Table 3 (multivariate) summarize the choice of studies conducted after year 2000 with the aim of providing some insight on the main features used, algorithm approaches followed, datasets utilized, best performance and observed limitations. It is worth noting that the generation of induced variables using the time derivatives of RR interval time series [73,74] coupled to machine learning is a well-established approach paving the way for a new research lead of automatic arrhythmia detection.

4. Conclusions

This work has presented an overview of automatic AF arrhythmia detection methods based mainly on inter-heartbeat intervals, roughly organized into two groups, namely univariate and multivariate classifiers. The first group focuses on the analysis of single time series features, while the second screens the arrhythmia as a multidimensional problem, in which a set of features is coupled and then evaluated at once.
As exemplified by the reviewed studies, the contribution of widely renowned open access databases is of utmost importance, covering different classes of arrhythmia but proving crucial for the development of AF detection methods. However, assessment of different AF classes remains limited, pioneered by field studies [29,50] separating AF into chronic (ChAF) and paroxysmal (ParAF). Throughout reviewed studies, the research efforts put on device-oriented and field data progress deserve special credit [25,47,49,72] regardless of the not yet remarkable performances achieved, as only the fully ambulatory approaches (online processing) that achieve success would enable future development of pacemaker-like medical devices capable of reverting AF attacks to normal rhythms. While the low computational demands of the RR-based univariate methods offer a bright future in the domain of wearables with limited but increasing computational capabilities, the interconnected IoT Cloud and services that are emerging in remote health markets may be calling for a research look at a wide range of multivariate pretrained models with renewed interest.

Author Contributions

Conceptualization, methodology and paper writing, Z.H.; formal analysis, B.A.; writing, metrics review, performance comparison and manuscript editing, M.A.; validation, M.O. and J.-C.D.; supervision, N.A. and S.D.; funding acquisition, Z.H. and M.A. All authors have read and agreed to the published version of the manuscript.

Funding

This research has received funding from the European Union’s Horizon 2020 research and innovation programme under the Marie Skłodowska-Curie grant agreement No. 101029808. The research conducted by M.A. received funding from the European Union’s Horizon 2020 research and innovation programme under the Marie Skłodowska-Curie grant agreement No. 801342 (Tecniospring INDUSTRY) and the Government of Catalonia’s Agency for Business Competitiveness.

Conflicts of Interest

The authors Z.H., M.A. and N.A. are employed by NVISION, a company developing IoT and Digital Health data processing services.

References

  1. Vilahur, G.; Badimon, J.J.; Bugiardini, R.; Badimon, L. Perspectives: The burden of cardiovascular risk factors and coronary heart disease in Europe and worldwide. Eur. Heart J. Suppl. 2014, 16, A7–A11. [Google Scholar] [CrossRef] [Green Version]
  2. World Health Organization. Cardiovascular Diseases, 2021. Available online: https://www.who.int/en/news-room/fact-sheets/detail/cardiovascular-diseases-(cvds) (accessed on 25 May 2022).
  3. Naccarelli, G.V.; Varker, H.; Lin, J.; Schulman, K.L. Increasing prevalence of atrial fibrillation and flutter in the United States. Am. J. Cardiol. 2009, 104, 1534–1539. [Google Scholar] [CrossRef] [PubMed]
  4. Stewart, S.; Murphy, N.; Walker, A.; McGuire, A.; McMurray, J.J.V. Cost of an emerging epidemic: An economic analysis of atrial fibrillation in the UK. Heart 2004, 90, 286–292. [Google Scholar] [CrossRef] [Green Version]
  5. Jabaudon, D.; Sztajzel, J.; Sievert, K.; Landis, T.; Sztajzel, R. Usefulness of ambulatory 7-day ECG monitoring for the detection of atrial fibrillation and flutter after acute stroke and transient ischemic attack. Stroke 2004, 35, 1647–1651. [Google Scholar] [CrossRef] [PubMed] [Green Version]
  6. Heeringa, J.; van der Kuip, D.A.; Hofman, A.; Kors, J.A.; van Herpen, G.; Stricker, B.H.C.; Stijnen, T.; Lip, G.Y.H.; Witteman, J.C.M. Prevalence, incidence and lifetime risk of atrial fibrillation: The Rotterdam study. Eur. Heart J. 2006, 27, 949–953. [Google Scholar] [CrossRef] [PubMed] [Green Version]
  7. Li, L.S.C.; Wang, C.C.; Xia, Y.L.; Wu, G.; Wang, F.; Xu, C.Q.; Wang, P.Y.; Li, X.C.; Wang, D.; Xiong, X.; et al. Assessment of association of rs2200733 on chromosome 4q25 with atrial fibrillation and ischemic stroke in a Chinese Han population. Hum. Genet. 2009, 126, 843–849. [Google Scholar]
  8. Go, A.S.; Hylek, E.M.; Phillips, K.A.; Chang, Y.C.; Henault, L.E.; Selby, J.V.; Singer, D.E. Prevalence of diagnosed atrial fibrillation in adults—National implications for rhythm management and stroke prevention: The AnTicoagulation and Risk Factors in Atrial Fibrillation (ATRIA) study. J. Am. Med. Assoc. 2001, 285, 2370–2375. [Google Scholar] [CrossRef] [PubMed]
  9. Stewart, S.; Hart, C.L.; Hole, D.J.; McMurray, J.J.V. Population prevalence, incidence, and predictors of atrial fibrillation in the Renfrew/Paisley study. Heart 2001, 86, 516–521. [Google Scholar] [CrossRef]
  10. Feinberg, W.M. Prevalence, Age Distribution, and Gender of Patients with Atrial Fibrillation. Arch. Intern. Med. 1995, 155, 469. [Google Scholar] [CrossRef]
  11. Murphy, N.F.; Simpson, C.R.; Jhund, P.S.; Stewart, S.; Kirkpatrick, M.; Chalmers, J.; MacIntyre, K.; McMurray, J.J.V. A national survey of the prevalence, incidence, primary care burden and treatment of atrial fibrillation in Scotland. Heart 2007, 93, 606–612. [Google Scholar] [CrossRef]
  12. Tsang, T.S.; Petty, G.W.; Barnes, M.E.; O’Fallon, W.M.; Bailey, K.R.; Wiebers, D.O.; Sicks, J.D.; Christianson, T.J.; Seward, J.B.; Gersh, B.J. The prevalence of atrial fibrillation in incident stroke cases and matched population controls in Rochester, Minnesota: Changes over three decades. J. Am. Coll. Cardiol. 2003, 42, 93–100. [Google Scholar] [CrossRef] [Green Version]
  13. Kornej, J.; Börschel, C.S.; Benjamin, E.J.; Schnabel, R.B. Epidemiology of Atrial Fibrillation in the 21st Century. Circ. Res. 2020, 127, 4–20. [Google Scholar] [CrossRef] [PubMed]
  14. Poli, S.; Barbaro, V.; Bartolini, P.; Calcagnini, G.; Censi, F. Prediction of atrial fibrillation from surface ECG: Review of methods and algorithms. Ann. Dell’istituto Super. Di Sanità 2003, 39, 195–203. [Google Scholar]
  15. Larburu, N.; Lopetegi, T.; Romero, I. Comparative Study of Algorithms for Atrial Fibrillation Detection. Comput. Cardiol. 2011, 38, 265–268. [Google Scholar]
  16. Committee to Develop Guidelines for the Management of Patients with Atrial Fibrillation. A Report of the American College of Cardiology/ American Heart Association Task Force on Practice Guidelines and the European Society of Cardiology Committee for Practice Guidelines and Policy Conferences. Circulation 2001, 104, 2118–2150. [Google Scholar] [CrossRef] [Green Version]
  17. Kirchhof, P.; Benussi, S.; Kotecha, D.; Ahlsson, A.; Atar, D.; Casadei, B.; Castella, M.; Diener, H.C.; Heidbuchel, H.; Hendriks, J.; et al. 2016 ESC Guidelines for the management of atrial fibrillation developed in collaboration with EACTS. Eur. Heart J. 2016, 37, 2893–2962. [Google Scholar] [CrossRef] [Green Version]
  18. Babaeizadeh, S.; Gregg, R.E.; Helfenbein, E.D.; Lindauer, J.M.; Zhou, S.H. Improvements in atrial fibrillation detection for real-time monitoring. J. Electrocardiol. 2009, 42, 522–526. [Google Scholar] [CrossRef]
  19. Carvalho, P.; Henriques, J.; Couceiro, R.; Harris, M.; Antunes, M.; Habetha, J. Model-based atrial fibrillation detection. In ECG Signal Processing, Classification and Interpretation; Gacek, A., Pedrycz, W., Eds.; Springer: London, UK, 2012; pp. 99–133. [Google Scholar]
  20. Ramos, G.; Alfaras, M.; Gamboa, H. Real-Time Approach to HRV Analysis. In Proceedings of the 11th International Joint Conference on Biomedical Engineering Systems and Technologies, Funchal, Portugal, 19–21 January 2018; pp. 208–215. [Google Scholar]
  21. Oster, J.; Clifford, G.D. Impact of the presence of noise on RR interval-based atrial fibrillation detection. J. Electrocardiol. 2015, 48, 947–951. [Google Scholar] [CrossRef]
  22. Kikillus, N.; Hammer, G.; Lentz, N.; Stockwald, F.; Bolz, A. Three Different Algorithms for Identifying Patients Suffering from Atrial Fibrillation during Atrial Fibrillation Free Phases of the ECG. Comput. Cardiol. 2007, 34, 801–804. [Google Scholar]
  23. Kikillus, N.; Hammer, G.; Wieland, S.; Bolz, A. Algorithm for identifying patients with paroxysmal atrial fibrillation without appearance on the ECG. In Proceedings of the 29th Annual International Conference of the IEEE Engineering in Medicine and Biology Society, Lyon, France, 23–26 August 2007; Volume 1–16, pp. 275–278. [Google Scholar]
  24. Langley, P.; Dewhurst, M.; Di Marco, L.Y.; Adams, P.; Dewhurst, F.; Mwita, J.C.; Walker, R.; Murray, A. Accuracy of algorithms for detection of atrial fibrillation from short duration beat interval recordings. Med. Eng. Phys. 2012, 34, 1441–1447. [Google Scholar] [CrossRef]
  25. Lake, D.E.; Moorman, J.R. Accurate estimation of entropy in very short physiological time series: The problem of atrial fibrillation detection in implanted ventricular devices. Am. J. Physiol. Heart Circ. Physiol. 2011, 300, H319–H325. [Google Scholar] [CrossRef] [PubMed]
  26. Hargittai, S. Is it Possible to Detect Atrial Fibrillation by Simply using RR Intervals? Comput. Cardiol. 2014, 41, 897–900. [Google Scholar]
  27. Lian, J.; Wang, L.; Muessig, D. A Simple Method to Detect Atrial Fibrillation Using RR Intervals. Am. J. Cardiol. 2011, 107, 1494–1497. [Google Scholar] [CrossRef] [PubMed]
  28. Ghodrati, A.; Murray, B.; Marinello, S. RR Interval Analysis for Detection of Atrial Fibrillation in ECG Monitors. In Proceedings of the 30th Annual International Conference of the IEEE Engineering in Medicine and Biology Society, Vancouver, BC, Canada, 20–25 August 2008; Volume 30, pp. 601–604. [Google Scholar]
  29. Ghodrati, A.; Marinello, S. Statistical Analysis of RR Interval Irregularities for Detection of Atrial Fibrillation. Comput. Cardiol. 2008, 35, 1057–1060. [Google Scholar]
  30. Kay, S.M. Fundamentals of Statistical Signal Processing: Detection Theory; Prentice Hall: Upper Saddle River, NJ, USA, 1998. [Google Scholar]
  31. Petrėnas, A.; Maroza, V.; Sörnmo, L. Low-complexity detection of atrial fibrillation in continuous long-term monitoring. Comput. Biol. Med. 2015, 65, 184–191. [Google Scholar] [CrossRef]
  32. Hong-wei, L.; Ying, S.; Min, L.; Pi-ding, L.; Zheng, Z. A probability density function method for detecting atrial fibrillation using R–R intervals. Med. Eng. Phys. 2009, 31, 116–123. [Google Scholar] [CrossRef]
  33. Takens, F. Detecting Strange Attractors in Turbulence; Springer: Berlin, Germany, 1981; pp. 366–381. [Google Scholar]
  34. Cerutti, S.; Mainardi, L.T.; Porta, A.; Bianchi, A.M. Analysis of the Dynamics of RR Interval Series for the Detection of Atrial Fibrillation Episodes. Comput. Cardiol. 1997, 24, 77–80. [Google Scholar]
  35. Tateno, K.; Glass, L. A Method for Detection of Atrial Fibrillation Using RR Intervals. Comput. Cardiol. 2000, 27, 391–394. [Google Scholar]
  36. Tateno, K.; Glass, L. Automatic detection of atrial fibrillation using the coefficient of variation and density histograms of RR and ΔRR intervals. Med. Biol. Eng. Comput. 2001, 39, 664–671. [Google Scholar] [CrossRef]
  37. Petrucci, E.; Balian, V.; Filippini, G.; Mainardi, L.T. Atrial Fibrillation Detection Algorithms for Very Long Term ECG Monitoring. Comput. Cardiol. 2005, 32, 623–626. [Google Scholar]
  38. Ruan, X.; Liu, C.; Wang, X.; Li, P. Automatic Detection of Atrial Fibrillation Using RR Interval Signal. In Proceedings of the 4th International Conference on Biomedical Engineering and Informatics (BMEI), Shanghai, China, 15–17 October 2011; Volume 4, pp. 644–647. [Google Scholar]
  39. Zhou, X.; Ding, H.; Ung, B.; Pickwell-MacPherson, E.; Zhang, Y. Automatic online detection of atrial fibrillation based on symbolic dynamics and Shannon entropy. BioMed. Eng. OnLine 2014, 13, 18. [Google Scholar] [CrossRef] [PubMed] [Green Version]
  40. Zhou, X.; Ding, H.; Wu, W.; Zhang, Y. A Real-Time Atrial Fibrillation Detection Algorithm Based on the Instantaneous State of Heart Rate. PLoS ONE 2015, 10, 0136544. [Google Scholar]
  41. Dash, S.; Chon, K.; Lu, S.; Raeder, E. Automatic real time detection of atrial fibrillation. Ann. Biomed. Eng. 2009, 37, 1701–1709. [Google Scholar] [CrossRef]
  42. Winkler, S.; Axmann, C.; Schannor, B.; Kim, S.; Leuthold, T.; Scherf, M.; Downes, R.; Nettlau, H.; Koehler, F. Diagnostic accuracy of a new detection algorithm for atrial fibrillation in cardiac telemonitoring with portable electrocardiogram devices. J. Electrocardiol. 2011, 44, 460–464. [Google Scholar] [CrossRef]
  43. Logan, B.; Healey, J. Robust Detection of Atrial Fibrillation for a Long Term Telemonitoring System. Comput. Cardiol. 2005, 32, 619–622. [Google Scholar]
  44. Moody, G.; Mark, R. A new method for detecting atrial fibrillation using RR intervals. Comput. Cardiol. 1983, 10, 227–230. [Google Scholar]
  45. Huang, C.; Ye, S.; Chen, H.; Li, D.; He, F.; Tu, Y. A Novel Method for Detection of the Transition between Atrial Fibrillation and Sinus Rhythm. IEEE Trans. Biomed. Eng. 2011, 58, 1113–1119. [Google Scholar] [CrossRef] [PubMed]
  46. Young, B.; Brodnick, D.; Spaulding, R. A Comparative Study of a Hidden Markov Model Detector for Atrial Fibrillation. In Proceedings of the IEEE Signal Processing Society Workshop, Boston, MA, USA, 25 August 1999; pp. 468–476. [Google Scholar]
  47. McManus, D.D.; Lee, J.; Maitas, O.; Esa, N.; Pidikiti, R.; Carlucci, A.; Harrington, J.; Mick, E.; Chon, K.H. A novel application for the detection of an irregular pulse using an iPhone 4S in patients with atrial fibrillation. Heart Rhythm 2013, 10, 315–319. [Google Scholar] [CrossRef] [Green Version]
  48. Lee, J.; McManus, D.; Chon, K. Atrial Fibrillation Detection using Time-Varying Coherence Function and Shannon Entropy. In Proceedings of the 2011 Annual International Conference of the IEEE Engineering in Medicine and Biology Society, Boston, MA, USA, 30 August–3 September 2011; Volume 33, pp. 4685–4688. [Google Scholar]
  49. Lee, J.; Reyes, B.; McManus, D.; Mathias, O.; Chon, K. Atrial fibrillation detection using an Iphone 4S. IEEE Trans. Biomed. Eng. 2013, 60, 203–206. [Google Scholar] [CrossRef]
  50. Duverney, D.; Gaspoz, J.M.; Pichot, V.; Roche, F.; Brion, R.; Antoniadis, A.; Barthélémy, J.C. High Accuracy of Automatic Detection of Atrial Fibrillation Using Wavelet Transform of Heart Rate Intervals. J. Pacing Clin. Electrophysiol. 2002, 25, 457–462. [Google Scholar] [CrossRef]
  51. Hindricks, G.; Taborsky, M.; Wohlgemuth, P.; Rieger, G.; Beckers, F.; Albers, B. Atrial Fibrillation Detection by a Subcutaneous Monitoring Device. Comput. Cardiol. 2008, 35, 413–416. [Google Scholar]
  52. Brignole, M.; Bellardine-Black, C.L.; Thomsen, P.E.B.; Sutton, R.; Moya, A.; Stadler, R.W.; Cao, J.; Messier, M.; Huikuri, H.V. Improved Arrhythmia Detection in Implantable Loop Recorders. J. Cardiovasc. Electrophysiol. 2008, 19, 928–934. [Google Scholar] [CrossRef] [PubMed]
  53. Colloca, R.; Johnson, A.E.W.; Mainardi, L.; Clifford, G.D. A Support Vector Machine Approach for Reliable Detection of Atrial Fibrillation Events. Comput. Cardiol. 2013, 40, 1047–1050. [Google Scholar]
  54. Sarkar, S.; Ritscher, D.; Mehra, R. A detector for a chronic implantable atrial tachyarrhythmia monitor. IEEE Trans. Biomed. Eng. 2008, 55, 1219–1224. [Google Scholar] [CrossRef]
  55. Linker, D.T. Long-Term Monitoring for Detection of Atrial Fibrillation. U.S. Patent 7,630,756, 8 December 2009. [Google Scholar]
  56. Mohebbi, M.; Ghassemian, H. Detection of Atrial Fibrillation Episodes Using SVM. In Proceedings of the 30th Annual International Conference of the IEEE Engineering in Medicine and Biology Society, Vancouver, BC, Canada, 20–25 August 2008; Volume 30, pp. 177–180. [Google Scholar]
  57. Asl, B.M.; Setarehdan, S.K.; Mohebbi, M. Support vector machine-based arrhythmia classification using reduced features of heart rate variability signal. Artif. Intell. Med. 2008, 44, 51–64. [Google Scholar] [CrossRef] [PubMed]
  58. Mohebbi, M.; Ghassemian, H. Prediction of paroxysmal atrial fibrillation based on non-linear analysis and spectrum and bispectrum features of the heart rate variability signal. Comput. Methods Programs Biomed. 2012, 105, 40–49. [Google Scholar] [CrossRef]
  59. Kim, D.; Seo, Y.; Youn, C.H. Detection of Atrial Fibrillation Episodes Using Multiple Heart Rate Variability Features in Different Time Periods. In Proceedings of the 30th Annual International Conference of the IEEE Engineering in Medicine and Biology Society, Vancouver, BC, Canada, 20–25 August 2008; Volume 30, pp. 5482–5485. [Google Scholar]
  60. Artis, S.G.; Mark, R.G.; Moody, G.B. Detection of Atrial Fibrillation Using Artificial Neural Networks. Comput. Cardiol. 1991, 173–176. [Google Scholar] [CrossRef]
  61. Carrara, M.; Carozzi, L.; Moss, T.J.; de Pasquale, M.; Cerutti, S.; Ferrario, M.; Lake, D.E.; Moorman, J.R. Heart rate dynamics distinguish among atrial fibrillation, normal sinus rhythm and sinus rhythm with frequent ectopy. Physiol. Meas. 2015, 36, 1873–1888. [Google Scholar] [CrossRef]
  62. Yaghouby, F.; Ayatollahi, A.; Bahramali, R.; Yaghouby, M. Robust genetic programming-based detection of atrial fibrillation using RR intervals. Expert Syst. 2012, 29, 183–199. [Google Scholar] [CrossRef]
  63. Brameier, M.; Banzhaf, W. Linear Genetic Programming; Springer: New York, NY, USA, 2007. [Google Scholar]
  64. Oltean, M.; Grossan, C. Evolving evolutionary algorithms using multi expression programming. In Advances in Artificial Life; Banzhaf, W., Ziegler, J., Christaller, T., Dittrich, P., Kim, J.T., Eds.; Springer: Berlin/Heidelberg, Germany, 2003; Volume 2801, pp. 651–658. [Google Scholar]
  65. Pudil, P.; Novovicova, J.; Kittler, J. Floating search methods in feature selection. Pattern Recognit. Lett. 1994, 15, 1119–1125. [Google Scholar] [CrossRef]
  66. Park, J.; Lee, S.; Jeon, M. Atrial fibrillation detection by heart rate variability in Poincare plot. BioMed. Eng. OnLine 2009, 8, 38. [Google Scholar] [CrossRef] [PubMed] [Green Version]
  67. Acharya, U.R.; Sankaranarayanan, M.; Nayak, J.; Xiang, C.; Tamura, T. Automatic identification of cardiac health using modeling techniques: A comparative study. Inf. Sci. 2008, 178, 4571–4582. [Google Scholar] [CrossRef]
  68. Tsipouras, M.G.; Fotiadis, D.I. Automatic arrhythmia detection based on time and time—Frequency analysis of heart rate variability. Comput. Methods Programs Biomed. 2004, 74, 95–108. [Google Scholar] [CrossRef]
  69. Shouldice, R.B.; Heneghan, C.; de Chazal, P. Automated Detection of Paroxysmal Atrial Fibrillation from Inter-Heartbeat Intervals. In Proceedings of the 29th Annual International Conference of the IEEE Engineering in Medicine and Biology Society, Lyon, France, 23–26 August 2007; Volume 27, pp. 686–689. [Google Scholar]
  70. Faust, O.; Shenfield, A.; Kareem, M.; San, T.R.; Fujita, H.; Acharya, U.R. Automated detection of atrial fibrillation using long short-term memory network with RR interval signals. Comput. Biol. Med. 2018, 102, 327–335. [Google Scholar] [CrossRef] [PubMed] [Green Version]
  71. Mendez, M.M.; Hsu, M.C.; Yuan, J.T.; Lynn, K.S. A Heart Rate Variability-Based Paroxysmal Atrial Fibrillation Prediction System. Appl. Sci. 2022, 12, 2387. [Google Scholar] [CrossRef]
  72. Ramesh, J.; Solatidehkordi, Z.; Aburukba, R.; Sagahyroon, A. Atrial Fibrillation Classification with Smart Wearables Using Short-Term Heart Rate Variability and Deep Convolutional Neural Networks. Sensors 2021, 21, 7233. [Google Scholar] [CrossRef]
  73. Pons, J.F.; Haddi, Z.; Deharo, J.C.; Charaï, A.; Bouchakour, R.; Ouladsine, O.; Delliaux, S. Heart rhythm characterization through induced physiological variables. Sci. Rep. 2017, 7, 5059. [Google Scholar] [CrossRef]
  74. Haddi, Z.; Ananou, B.; Trardi, T.; Pons, J.-F.; Delliaux, S.; Deharo, J.-C.; Ouladsine, M. Advanced Machine Learning Coupled with Heart-Inter-beat derivatives for Cardiac Arrhythmia Detection. In Proceedings of the American Control Conference (ACC), Denver, CO, USA, 1–3 July 2020; pp. 5433–5438. [Google Scholar] [CrossRef]
Figure 1. ECG classification flow chart analysis.
Algorithms 15 00231 g001
Figure 2. Automatic AF detection methodologies.
Algorithms 15 00231 g002
Figure 3. ECG representation. Highlighted heartbeat, PQRS wave points, RR interval (red) observed between QRS complexes and type of HRV features derived from RR time series (tachogram).
Algorithms 15 00231 g003
Figure 4. Multivariate data analysis methods organized as statistical or biologically inspired techniques.
Algorithms 15 00231 g004
Table 1. Multivariate analysis methods and abbreviations.
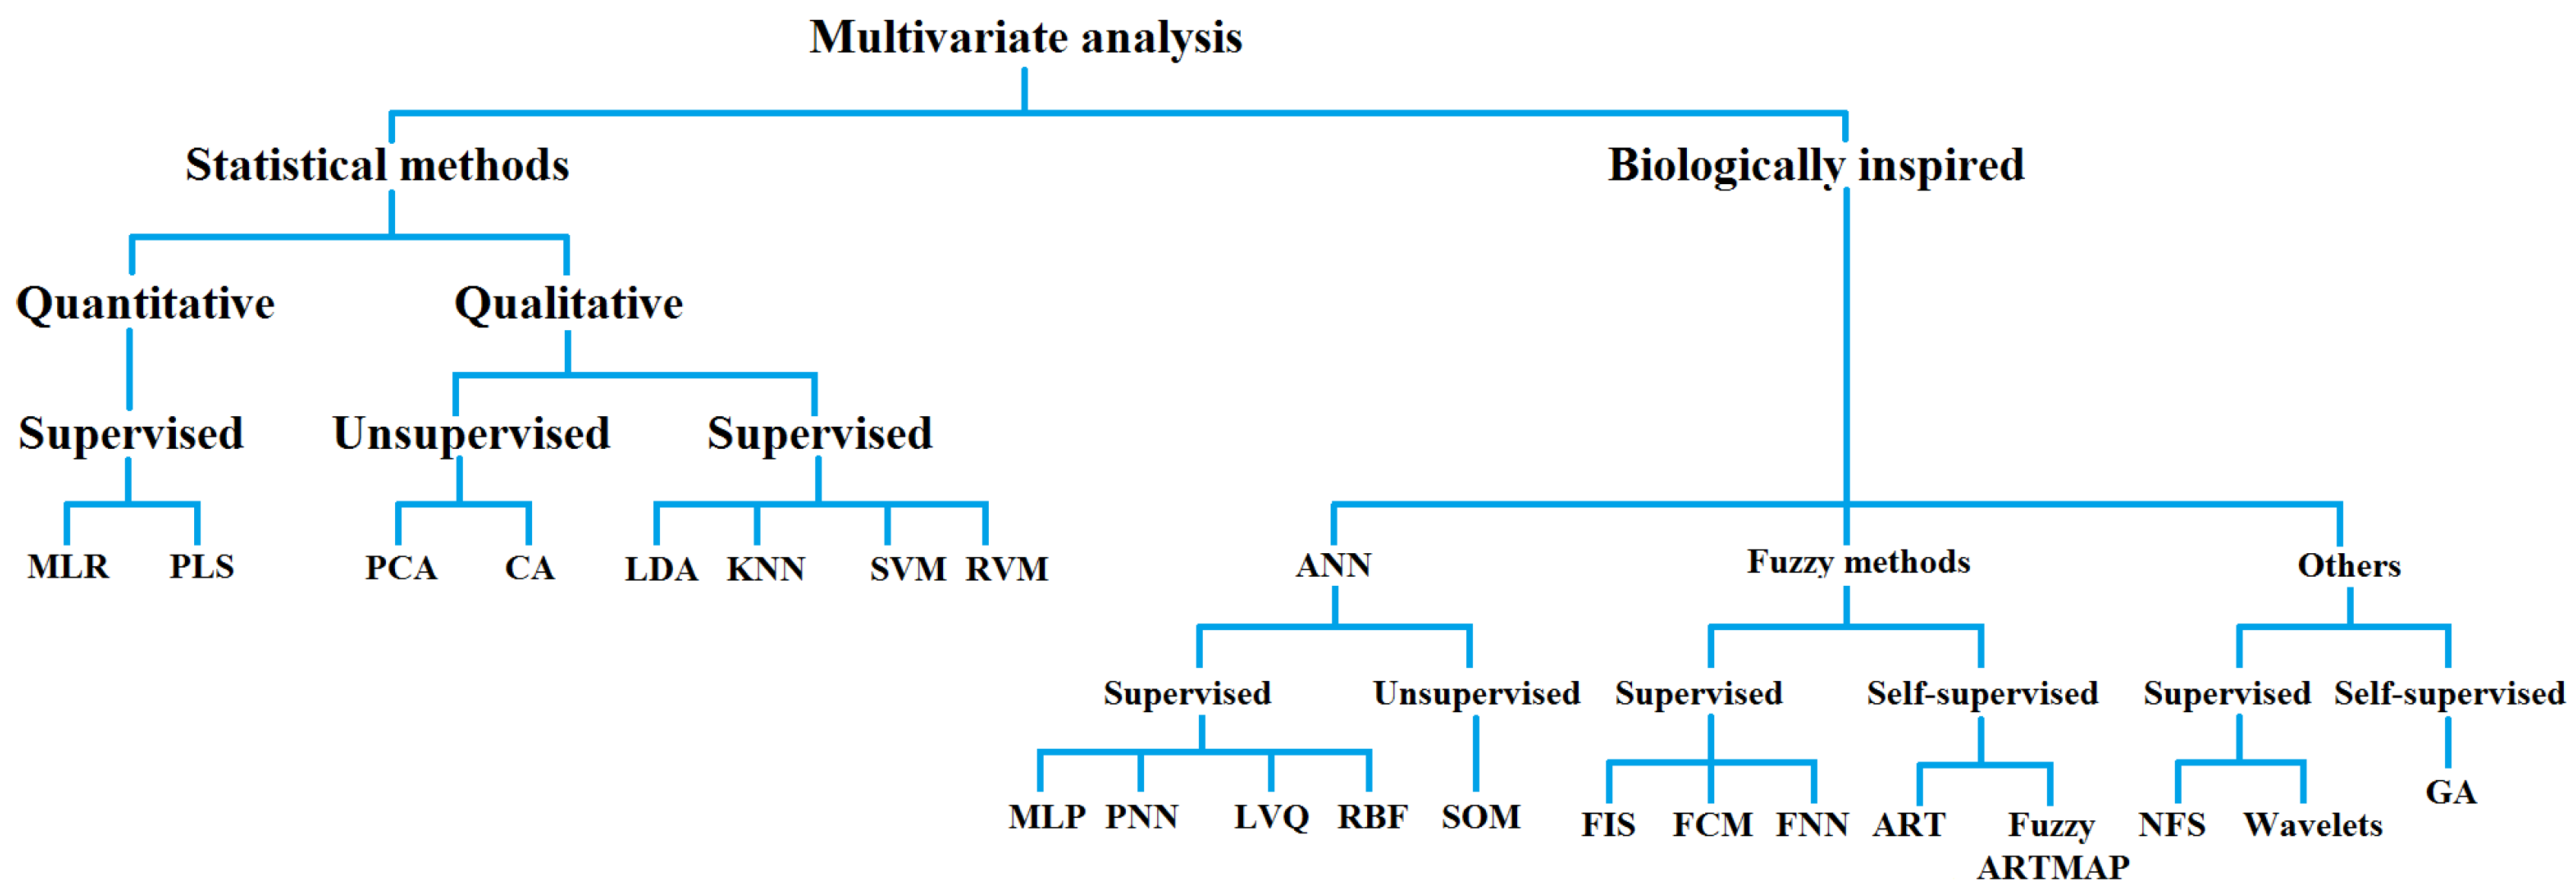
Statistical Methods of Multivariate AnalysisBiologically Inspired Methods of Multivariate Analysis
MLR: Multiple linear regressionANN: Artificial neural networks
PLS: Partial least squareMLP: Multi-layer perceptron
PCA: Principal component analysisPNN: Probabilistic neural network
CA: Cluster analysisLVQ: Learning vector quantization
LDA: Linear discriminant analysisRBF: Radial basis function
KNN: K-nearest neighborsSOM: Self-organizing map
SVM: Support vector machineFIS: Fuzzy inference system
RVM: Relevance vector machineFCM: Fuzzy c-means
FNN: Fuzzy neural network
ART: Adaptive resonance theory
NFS: Neuro fuzzy system
GA: Genetic algorithm
Table 2. Summary of chosen univariate AF research studies published after year 2000, sorted chronologically.
Year [Ref]Main FeaturesTechniques and
Algorithms Used
DatasetsBest % PERFORMANCELimitations and
Remarks
2000 [35]100-RR and ΔRR density
histogram similarity
Standard vs. Kolmogorov–Smirnov
methods (dens. hist. template matching)
AFDB,
MITDB
Se = 93.2
Sp = 96.7 (AFDB test)
Low Sp for short AF episodes
2001 [36]RR and ΔRR studied by
density histograms and
coefficient of variation CV test
Statistics and Kolmogorov–Smirnov testAFDB,
MITDB
Se = 94.4
Sp = 97.2
Higher performance for Kolmogorov–Smirnov on ΔRR
2002 [50]Spectral and nonlinear
features of high HRV
Discrete wavelet transform DWT and fractal analysis applied to Power Spectral DensityLocal or
proprietary
Se = 99.2,
Sp = N/A
(ChAF);
Se = 96.1
Sp = 92.6
(ParAF)
Class separation of
Chronic (ChAF) and Paroxysmal (ParAF); Local DB limitation on reproducibility
2005 [43]RR, smoothed normalized
RR and RR variance
Basic statistics and initial AF detection followed by
majority vote approach (600 beat)
AFDBSe = 96
Sp = 89
Application to
10 s RR segments
2005 [37]Modal behavior (statistics) and base width or height (geometrical) features of week-long histograms of RR and ΔRR distribution plotsBasic statisticsAFDBSe = 92
Pr = 78
Only applicable to
AF episodes > 2 min.
Best performance for ΔRR dist. widths
2007 [22,23]SDSD with Poincaré plot
eye diagram analysis (I),
45 min spectral integrals (II),
RR difference histograms and pNN200 (III)
Statistics, 3500 interval representation of Poincaré plots and FFT AFDB,
NSRDB
Se = 91.5
Sp = 96.9
(test I);
Se = 93.3
Sp = 92.8
(test II);
Se = 94.1
Sp = 93.4
(test III)
Tests performed on 3500-interval time
series and 60 bpm time normalization applied
2008 [28,29]Normalized absolute deviation of RR, normalized absolute difference of successive RR and probability density function comparisonsBasic statistics, Gaussian vs. Laplacian probability density function estimation, Neyman–Pearson testMITDB,
AFDB,
Draeger AF (proprietary)
Se = 92
Pr = 73
(MITDB);
Se = 89 Pr = 87
(AFDB);
Se = 87
Pr= 94
(Draeger)
Class separation of
Chronic (ChAF) and Paroxysmal (ParAF);
Normalized absolute differences and Laplacian PDF yielding the best results;
Proprietary DB limiting reproducibility
2008 [51,52]Subcutaneous R-wave and
2-min HRV RR Lorenz (Poincaré)
geometric features
Representation of RR
Lorenz plots
LocalSe = 90.6
(AF > 2 min)
Se = 98.1
(AF > 4 min)
Pr = 55.1 (mean)
In vivo study
with low Pr;
Performance limited in AF < 2 min episodes
2009 [41]RR RMSSD,
Turning point ratio,
Entropy
Basic statisticsMITDB,
AFDB
Se = 90.2
Sp = 91.2
(MITDB);
Se = 94.4
Sp = 95.1
(AFDB)
Techniques applied to 128-RR segments with 50% AF ratios
2009 [32]RR Takens phase space,
kn slope of probability density function of nonlinear attractor distance
Basic statistics and
Takens embedding for m-dimensional phase space computation
AFDBSe = 97.8
Sp = 99.0
Results achieved for time series as short as 40RRs
2011 [45]100-ΔRR distance difference
curve (dRDDC) with AF event
classification (onset, stop, none)
Basic statistics and
Kolmogorov–Smirnov test
AFDB,
NSRDB
Se = 96.1
Sp = 98.1
(AFDB)
Observed limitations in short AF episodes (4–62 beats)
2011 [25]Sample entropy, quadratic sample entropy (QSE, ad hoc) and RR variability for template matchingBasic statistics, logistic regression, Wald-χ2 statistic and developed COSEn algorithmMITDB (training),
UVa Virginia Holter (local)
Se = 91
Sp = 98
Pr = 63
2011 [27]Geometrical nonlinear features of RR vs. dRR difference maps (with different resolutions)Representation of recurrence plotsMITDB,
NSRDB,
AFDB,
NSR2DB
Se = 95.9
Sp = 95.4
(combined DBs)
Suitable for short 32-beat AF
episodes;
Different window size resolutions
studied (32/64/128)
2011 [48]Time-varying coherence using ARMA and Shannon EntropyTime-varying
transfer functions
AFDB, NSRDBSe = 97.41
Sp = 97.54
Ac = 97.49
Applied to adjacent 128-RR sets
2011 [31]RR 3-point median and specific decision thresholds (Se = Sp)Bigeminal suppression, signal fusionAFDB,
NSRDB
Se = 97.1
Sp = 98.3
Technique applied to 8-RR windows
2011 [38]Vector angular index (VAI), vector length index (VLI), SD1 and SD2
geometric features of 1-min RR
recurrence plots
Statistics (with Mann–Whitney test) and ellipse fitting for recurrence plotAFTermDBSe = 98.3
Sp = 100
(SD1 and VAI)
No generalization insight despite high performance (additional clinical samples tests)
2011 [42]AF index derived from histogram geometric features (width/height
ratio, peak) and premature
beat presence
Basic statisticsMITDB
(index setup),
Local
(testing)
Se = 92.9
Sp = 90.9
Method applied to 120 s RR series;
Limitation on generalization claims due to closed DB
2012 [24]RR Coefficient of variation (CV), mean successive difference and
COSEn
Basic statistics2 Local DBs (2130 10-s ECG samples)Se > 94
Sp ≈ 93
RR time interval
only approach
2013 [47,49]RR RMSSD, Shannon entropy,
SampEn, RMSSD/<RR> (64RR sets)
Cubic spline (interpolation) and decision logicAFDB, NSRDB Se = 97.26
Sp = 95.91 (combined)
Method developed for iPhone 4S use.
2014 [26]Modified Lorenz dRR,
RR RMSSD, Shannon entropy,
turning point ratio and
SampEn
Statistical methods and representation of dRR
recurrence plots
MITDB,
AFDB,
Long-Term AF
Se = 95.79
Sp = 95.26
(MITDB for dRR)
High performances achieved across different single features
2014 [39]Three-pass:
Median + low-pass filters,
symbolic dynamics and
Shannon entropy
Low/high scale reference sequence generation and statistics on successive differencesLong-Term AF,
AFDB
(testing)
Se = 96.89
Sp = 98.25
(AFDB)
False negative detection foreseen for short AF
episodes
2015 [40]Symbolic dynamics and
Shannon entropy with
adapted thresholds
Long-Term AF (training), AFDB, MITDB, NSRDBSe = 97.37
Sp = 98.44
(AFDB)
Adapted thresholds and test generalization to other DBs
Table 3. Summary of chosen multivariate AF research studies published after year 2000, sorted chronologically.
Year [Ref]Main FeaturesTechniques and Algorithms UsedDatasetsBest %
Performance
Limitations and
Remarks
2004 [68]RR Temporal STD, RMSSD, SDSD,
Δ%5, Δ%10, Δ%50 (ANN) and spectral t-f features (FFBPNN)
ANN and Feed-Forward Back-propagation (FFBPNN) applied
respectively to RR and time-frequency analysis obtained by Short-time FT and t-f distributions
MITDB
(AF aggregated)
Se = 87.5
Sp= 89.5 (time)
Se = 90
Sp = 93 (time-frequency)
32-RR intervals used
2007 [29]Trimmed <RR>, sqrt(spread), NormSqSum(50 ms) Linear discriminant classifier (LDC)MITDB,
AFDB,
NSRDB,
NSR2DB
Ac = 92
Ac = 94
Ac = 100
Ac = 100
Tested on 100-RR interbeat blocks, subject to performance loss due to other arrhythmia
2008 [67]Spectral FFT features and RR autoregressive (AR), moving average (MA) and Autoregressive moving average (ARMA) model features FFT for spectral analysis and Multi-layer
perceptron (MLP)
networks
Kasturba Medical
college
(proprietary)
Correct classification rate of AF = 66.67 (ARMA
features)
Not AF-centered. Ambitious study covering different arrhythmia classes, with small local datasets
2008 [57]Combination of 15 RR HRV features obtained from 32-RR sequences and reduced to 6Generalized Discriminant Analysis (GDA) and SVM with radial basis for 6 class detectionMITDBAc = 98.53 (AF)Scope is broader than AF only;
one-against-one vs. one-against-all
2008 [59]4-period RR HRV featuresLogistic regressionAFDBSuccess rate = 95.5RR filtering and day/evening
discrimination
criteria applied
2008 [56]Combination of 5 RR time, 1 frequency and 3 nonlinear featuresPrincipal component vs. Linear discriminant (PCA vs. LDA) applied before SVMMITDBSe = 99.07
Sp = 100
Pr = 100
AF episode target;
Radial-basis optimized
2009
[66]
Poincaré plot featuresK-meansParAFDB
AFTermDB
Se = 91.4
Sp = 92.9
2012 [58]Combination of 14 RR HRV features: 4 spectral, 6 cross-spectral
and 4 nonlinear
SVMAFDBSe = 96.30
Sp = 93.10
2012 [62]Combination of 5 RR temporal (Mean, STD, RMSSD and pNN50) and 2 geometrical (Triangular index and interpolation) featuresLinear genetic program. vs. Multi-expression program. vs. weighted Least Squares regression. Improved forward floating selection (IFFS)
of features
MITDBSe = 99.11
Sp = 98.91
Best performance obtained for LGP
2013 [53]Combination of 10 specific features: COSEn, SampEn, RR-RR origin counts, compensatory pause feature, AF evidence, irregularity RR sparsity, median of absolute RR deviations, median heart rate, <RR> and minRR SVM with radial basis function kernelAFDB
(training),
NSRDB,
MITDB
Se = 96.35
Sp = 98.81
(test)
5-fold CV with window lengths WL = 12–300 s
2015 [61]Nonlinear and statistic RR features: COSEn, local dynamics scores, detrended fluctuation, <RR> and standard deviationsAdvanced statistics,
Logistic Regression,
Knn and Random
forests (RF)
Local 24 h Holter (2722 samples)Pr = 9710-min RR segments used, 10-fold CV approach and best performance for RF
2018 [70]100-RR intervals with no feature extraction (simplistic approach)RNNs with Long Short-Term Memory (LSTM)AFDB database with a (20/3) patient
training/test distribution
Se = 98.32
Sp = 98.67
(10-fold CV)
Computationally demanding training.
Small dataset and splitting approach limitations
2021 [72]13 RR HRV temporal featuresCNNsMITDB,
AFDB,
NSRDB
Se = 94.50
Sp = 96.00
(5-fold CV)
Se = 77.80
Sp = 88.54
(field data)
Generalization focus via photoplethysmography field data
2022 [71]400-RR point HRV Poincaré plotsRecurrence plot representation and CNN applied to Poincaré imagesParAFDB,
NSRDB + AFDB
(testing)
Se = 804
Pr = 890
Very promising research line exploiting CNN image analysis capabilities
Publisher’s Note: MDPI stays neutral with regard to jurisdictional claims in published maps and institutional affiliations.

