Abstract
The adoption of cooperative intelligent transportation systems (cITSs) improves road safety and traffic efficiency. Vehicles connected to cITS form vehicular ad hoc networks (VANET) to exchange messages. Like other networks and systems, cITSs are targeted by attackers intent on compromising and disrupting system integrity and availability. They can repeatedly spoof false information causing bottlenecks, traffic jams and even road accidents. The existing security infrastructure assumes that the network topology and/or attack behavior is static. However, the cITS is inherently dynamic in nature. Moreover, attackers may have the ability and resources to change their behavior continuously. Assuming a static IDS security model for VANETs is not suitable and can lead to low detection accuracy and high false alarms. Therefore, this paper proposes an adaptive security solution based on deep learning and contextual references that can cope with the dynamic nature of the cITS topologies and increasingly common attack behaviors. In this study, deep belief networks (DBN) modeling was used to train the detection model. Binary cross entropy was used as a loss function to measure the prediction error. Two activation functions were used, Relu and Softmax, for input–output mapping. The Relu was used in the hidden layers, while the Sigmoid was used in the last layer to map the real vector to output between 0 and 1. The adaptation mechanism was incorporated into the detection model using a moving average that monitors predicted values within a time window. In this way, the model can readjust the classification thresholds on-the-fly as appropriate. The proposed model was evaluated using the Next Generation Simulation (NGSIM) dataset, which is commonly used in such related works. The result is improved accuracy, demonstrating that the adaptation mechanism used in this study was effective.
1. Introduction
Cooperative intelligent transportation systems (cITSs) collect data from the end nodes (i.e., endpoints). These data are stored locally and shared with the other nodes [,,]. The cITS adopts one of the two information-sharing standards, the European standard [] and the American standard []. On the one hand, the European standard defines two types of messages, the Cooperative Awareness Message (CAM) and the Decentralized Environmental Notification Message (DENM) []. The CAMs are sent periodically and carry information about the vehicles such as their position, size, speed, and angle of steering wheel. The DENM messages carry information about events which occur on sections of road section such as lane changes and (sudden) braking. On the other hand, the American standard defines context information messages called basic safety messages (BSMs), which carry different information such as position, heading, speed, acceleration, steering wheel angle, vehicle role, vehicle size and status of vehicle lights []. If an event happens, then the BSM also carries those event-related information.
Notwithstanding, cITSs enable information sharing among neighboring nodes (i.e., vehicles). Unfortunately, this comes at the cost of needing to address several threats that target data and system integrity [,]. These threats could be imposed by either human-crafted attacks or malware [,,,]. Threats which target cITS systems can disable or disrupt the function of one or more components in the vehicle’s navigation system []. For example, threats can spoof the exchanged data to inject false mobility information which is then exchanged among neighboring vehicles causing erroneous actions and calamitous outcomes.
Threat actors use sophisticated strategies and employ malware to carry out various attacks against cITSs [,]. These attacks could come from nodes inside or outside the network. Outside attacks by threat actors that are not part of the network are easy to detect, whereas inside attacks are usually carried out via legitimate but compromised vehicles. Such inside attacks are more challenging to detect. Typical cITS targeted attacks include jamming, replay, Sybil, and data falsification.
Jamming is carried out by overwhelming individual cITS nodes by an enormous amount of messages, which disrupt the connectivity with the cITS, a denial-of-service attack type []. The consequences include message loss within the cITS, causing a data insufficiency situation that adversely affects the accuracy of the intrusion detection systems (IDS) trained on such data. Replay attacks occur if the attacker can impersonate an original node enabling the interception of messages exchanged between the vehicles and thereby injecting false data by re-sending them to a victim node []. Likewise, a Sybil attack creates several identities and uses them to poison (fake) BSM messages that deceive victim nodes; as such, a Sybil attack compromises network services when an attacker subverts the service’s reputation system by creating a large number of pseudonymous identities and then using them to gain a disproportionately large influence. Thus, false data injection can be used to share and promote false information about the current traffic situation on the road for the purpose of disrupting traffic flow and triggering congestion.
Data falsification is another type of attack that can be conducted to compromise BSM messages exchanged between cITS nodes. The first step is to compromise a legitimate node and employ it to share false data with neighboring vehicles. Since the compromised node has been previously authenticated, a trust relationship was established with other nodes in the cITS network. Attackers can utilize this fact to spread the false data using the compromised node []. Attackers thus manipulate the BSM and inject false data which is then share with neighboring nodes []. The false data may cause a vehicle to take unexpected actions such as sudden braking, lane changing, and/or sudden acceleration. Therefore, taking security measures to protect BSM messages is crucial [].
2. Related Works
The current solutions proposed for protecting the cITSs can be categorized into node-centric and data-centric IDSs. Some of these solutions tried to protect the system against threats coming from the outside caused by Sybil, malware, and DoS attacks. By comparing the patterns from incoming traffic with the patterns of normal applications, those solutions can detect suspicious threats and raise alarms. Moreover, other solutions focus on detecting misbehaving nodes in cITSs. These solutions aim to protect the system against threats carried out by legitimate yet compromised nodes, which is more challenging as those nodes are trusted and thus less suspicious []. Nonetheless, most of these solutions assume that the cITS is stationary. Such an assumption is not realistic as the ephemeral nature of cITSs make it a very dynamic constantly changing topology. Developing data-driven detection solutions on presumed stationary data prohibits handling the numerous and rapid changes typical inside the cITS. These solutions quickly become outdated and consequently, their accuracy decreases. Some studies have tried to rectify the issue by adopting solutions with the dynamic nature of the operating environment in mind []. These solutions, again, are typically categorized into node-centric and data-centric.
The existing IDS proposal for cITS relies on the BSM messages exchanged between the communicating vehicles as well as the contextual metadata that describes the operating environment. Such data in many studies are static, which might not be suitable for such a dynamic cITSs where the node’s operational environment changes continuously. Therefore, static security thresholds become outdated more often. This represents a major issue for existing IDS solutions. To address this issue, some studies have proposed solutions, such as the context-aware data-centric misbehavior detection scheme (CA-DC-MDS) developed by []. This solution overcomes the aforementioned drawbacks. Static thresholds are replaced by a dynamic threshold statistically determined using a contextual model, which is constructed and updated online. The sequential analysis of temporal and spatial correlation is conducted using Kalman and Hampel filters to assess the consistency of mobility data exchanged between neighboring vehicles. The Kalman filter tracks mobility data from the neighboring vehicles, while the Hampel filter assesses the consistency of these data. Based on the proximity from the threshold, the message containing the data is classified as either normal or suspicious. However, the scheme assumes that data collected at the early phases after the model has updated its profile are sufficient for consistency assessment. This is not realistic in most cases, as the contextual data that describe the new situation are not yet ready for a variety of reasons as described below.
Node-centric IDSs determine whether a vehicle is malicious based on how it behaves on the road section []. The trustworthiness of legitimate vehicles is also assessed based on such behavior, which can be perceived by observing the number and validity of BSM messages shared by the vehicle [,]. Reputation-based evaluation is usually adopted for the trustworthiness estimation of each node in the cITS. The estimation is performed by a voting strategy whose outcome relies on the majority concept. However, relying on node behavior is sub-optimal because the cITS is non-stationary and since nodes change their behavior as the topology changes [,]. Moreover, relying on a voting approach for the trustworthiness estimation is always biased towards the majority, which in some cases, can be compromised when the attacker gains a majority foothold. A case in point occurs when attackers use advanced and sophisticated attack strategies such as malware and botnets to create a majority of rogue nodes enabling them to control the trustworthiness estimation. Consequently, such reputation-based mechanisms used by node-centric solutions cannot be trusted for the early identification of misbehaving or faulty vehicles [].
Another set of IDSs for cITS adopt the data-centric detection approach by inspecting the BSM messages exchanged between the neighboring vehicles. These solutions perform several checks to determine whether the messages are falsified. BSM messages are checked against several criteria such as consistency and plausibility to determine whether they are trustworthy []. The consistency checks that BSM messages undergo in data-centric solutions determine whether the data shared by the node are consistent with the general context from the particular cITS. By vetting these BSMs, data-centric solutions can also identify the plausibility of the shared data to help in determining validity (i.e., whether they are in-line with those coming from other nodes in the cITS system).
The node-centric and data-centric approaches adopted in existing IDS solutions for cITS rely on estimating the reputation of the nodes and trustworthiness of the data they share with each other. However, both approaches have inherent weaknesses and may not be suitable for tumultuous environments such as cITSs. In such dynamic systems, the nodes join and leave the network frequently, which creates an unstable topology. This makes it difficult to capture sufficient and consistent patterns that represent all behavioral aspects of the nodes. Therefore, existing security solutions with rigid thresholds are not suitable as they do not have the sufficient data needed for accurate decisions. Therefore, these solutions suffer from a high rate of false alarms. Thus, data insufficiency makes it difficult for adaptive mechanisms used by some solutions to accurately calculate the new thresholds, which also have a negative effect on IDS accuracy.
The contribution of this study is two-fold:
- A bi-variate moving average (BiMAV) technique was proposed. Unlike existing methods that only rely on the values estimated at the output layer, BiMAV correlates the changes of the output layer with the averaged input variables. Such an approach provides precise change detection by avoiding the instantaneous changes that could compromise the stability of the detection model.
- The proposed method was incorporated into the detection model, which helps to prevent the unnecessary re-adjustment of security thresholds at the output layer of the DBN classifier thanks to the bivariate-based moving average used to monitor and detect the change in the classification accuracy estimation.
The rest of the paper is organized as follows. Section 3 presents the methodology in which we describe the proposed solution. The results are analyzed and discussed in Section 4 along with a comparison with existing related work. Section 5 concludes the paper with a summary of the contribution and findings.
3. Methodology
Given the literature reviewed above, we have concluded that the ephemeral nature of cITSs is a major challenge that makes many existing solutions ineffective. To overcome such a challenge, herein we propose an adaptive IDS for cITS. Our adaptive approach has the ability to cope with the dynamical nature of the cITS operating environment. A bi-variate moving average (BiMAV) method was developed to detect the (potential) diversion, in practice, from the existing threshold used by the detection model. Unlike existing methods that rely only on the values estimated at the output layer, BiMAV correlates the change of output layer with the averaged input variables. Such an approach provides precise change detection by avoiding the instantaneous changes that will eventually compromise the stability of the detection model. The proposed method prevents the unnecessary re-adjustment of security thresholds at the output layer of the DBN classifier thanks to the bivariate-based moving average used to monitor and detect the change in the classification accuracy estimation. This is important for dynamic environments such as cITSs where sufficient data might not be available. Based on the amount of change, adaptation can be triggered. in other words, if the difference exceeds a certain limit (i.e., according to the standard deviation), retraining the model is triggered. Model retraining will be performed based on the new data. If the difference does not exceed the threshold, there is no need for retraining.
The proposed solution here relies on the supervised learning approach. The deep belief network (DBN), one of the famous deep learning algorithms, is used to train the IDS based on data collected from the BSM messages. Before training, the data are pre-processed to make them suitable for ingestion by the DBN. As part of the preparation, noise data are removed, and data normalization is carried out. During data normalization, the values of all attributes are converted to a range of 0–1. This ensures that all attributes are in the same scale and prevents those with higher ranges from having undue influence over the model’s output decision.
The data are now ready for the mutual information feature selection (MIFS) process that selects out discriminative features to reduce data dimensionality. This avoids the overfitting problem that negatively affects the accuracy of the IDS [,]. By selecting the most relevant features, the model also generates less false alarms, which contributes to higher precision. Furthermore, reducing data dimensionality helps decrease the model complexity, which is more favorable for ephemeral environments such as cITSs. The MIFS ranks the features based on the entropy, such that those with higher entropy value correspond to a lower rank. Then, the MIFS selects the n-top ranking features (n experimentally chosen to give higher accuracy). The selected features are then used as input for the DBN algorithm.
During the model’s training phase, the DBN is trained using the data and features selected by the MIFS. The DBN model is composed of several layers, namely input, output and hidden. The number of input layer nodes is determined by the number of features selected by the MIFS. These nodes receive data and process them into the hidden layers, after being scaled (i.e., multiply) by an input weight. In our methodology, the hidden part of the DBN is constructed from three layers. The number of hidden layers is determined based on an overfitting factor during the training phase. The number of nodes in the hidden layer is thus determined based on the bias factor during the training phase as well. The value of the bias factor was set to 0.25, multiplied by the standard deviation (W) of the previous window. Therefore, the number of nodes in hidden layers were taken as a percentage of the original number. As we start with 18 nodes (because the number of nodes in a hidden layer should be lower than then nodes in input layer), in the hidden layers, the data are processed based on the activation function used by the hidden nodes. The Relu function is used as the activation function in all nodes in the hidden layers of the DBN, except the layer that precedes the output, where the sigmoid function was used. These activation functions are used to map the output of nodes into values between 0 and 1, which are needed for prediction. The output layer receives the data from the sigmoid functions in the last hidden layer and determines whether the instance is malicious or normal based on a threshold , where values greater than are considered as attacks.
Training and Testing
The DBN model was trained using the 10-fold cross-validation method, wherein data are divided into two sets. During the training/testing process, the data were divided into two sets, i.e., training and testing. The training builds the model while testing evaluates its accuracy. The size of training set was 90% of the data and, naturally, the testing set was 10% of the data. This process was repeated 10 times and the accuracy of the model was recorded. At the end of the training/testing process, the averaged accuracy was calculated, which determines the overall model accuracy.
4. Model Adaptation Using Bi-Variate Moving Average
Our proposed model, as described above, is aimed at improving detection within the dynamic cITS environment. Therefore, here we describe an adaptation capability needed to ensure that the model can better handle the constantly changing network topology. We propose a bi-variate moving average (BiMAV) model adaptation method that observes the model performance and adapts to the change in the operating environment. The proposed method follows the progressive modeling used by works that rely on time series data []. The method uses a two-dimensional window for change detection. That is, the window defines two variables, the aggregated input values and the estimated output. Within this window, the accuracy trend is monitored against a threshold calculated based on the standard deviation from previous windows. Equation (1) implements the BiVAM method:
where and are the input features and estimated output values, respectively. The variable n represents number of features while l represents number of instances in the window. The retraining is triggered if the value of BiMAV is higher than the standard deviation of the previous windows, as expressed by Equation (2):
where represents the standard deviation of the previous windows. The decision that Equation (2) makes is binary as it determines whether the re-training is needed or not based on the threshold .
5. The Dataset
The dataset used for this study was the Next Generation Simulation (NGSIM) Vehicle Trajectories Dataset []. NGSIM is an open source publicly available dataset with a collection of real-world vehicles’ trajectories collected by smart vehicles. It contains a detailed vehicle trajectory data on southbound US 101 and Lankershim Boulevard in Los Angeles, CA, eastbound I-80 in Emeryville, CA and Peachtree Street in Atlanta, Georgia. Data in NGSIM were collected through a network of synchronized digital video cameras. NGVIDEO, a customized software application developed for the NGSIM program, transcribed the vehicle trajectory data from the video. This vehicle trajectory data provides the precise location of each vehicle within the study area every one-tenth of a second, resulting in detailed lane positions and locations relative to other vehicles. Moreover, NGSIM consists of many patterns representing different drive situations and driver behavior []. In addition, NGSIM provides high-quality contextual data that describe realistic real-world scenarios on different road sections []. Particularly, NGSIM was built by collecting data from vehicles moving on a road section with 500 m-long and seven-lane highway. For each vehicle, the data are collected (recorded) for 45 min using 16 sensors. Each record in the dataset contains s set of basic elements regarding the vehicle like position, speed, time, direction, and acceleration. Although there are similar datasets such as the Connected Vehicles Pilot (CVP), the NGSIM dataset was chosen in this study to be consistent when comparing with the related works as they used the NGSIM as well.
The dataset represents the ground truth information and each vehicle represents a cITS node. In real-world deployment, the dataset needs to be fed each cITS node. That is, each node should have a copy of the dataset to run its own applications and adjust its communication or driving behavior. As such, the collection of accurate and reliable context information is crucial. The context information in the dataset combines two types of messages, cooperative awareness message (CAM) and decentralized environmental notification message (DENM) into a basic safety message (BSM). While CAMs are sent periodically, DENMs are event-driven that only sent when an event has occurred. The CAM consists of information about the vehicles such as the position, size, speed, and steering wheel angle.
In contrast, DENM contains information about a certain event such as lane changing and sudden braking. BSM combines CAM and DENM messages. The first part of BSM, as well as CAM in the European standard, carries information about position, heading, speed, acceleration, steering wheel angle, vehicle role, vehicle size, and the status of vehicle lights [,,]. Unlike the first part of BSM that is included in all BSM messages, the second part of BSM (which corresponds to DENM in the European standard) is only included when an event happens, to carry information about such an event.
6. Experimental Environment Setup
To implement the different components of the proposed mode and evaluate its performance, the development and experimental evaluation will be conducted using several tools and software including Python, TensorFlow, Scikit Learn, SKFeature, and Numpy. These tools and libraries are all included in the Anaconda development platform. Meanwhile, the preparation of data samples, implementation of algorithms, and the analysis of the results will be carried out on a machine with Intel(R) Core (TM) i7-4790 CPU @ 3.60 GHZ and 16 GB RAM.
Evaluation Metrics
To evaluate the performance of the proposed IDS for cITS, this paper uses the accuracy, detection rate, and the false alarms rate as they are common metrics widely used by the extant research. Equations (3)–(6) are used to calculate the detection accuracy, detection rate, precision, false positive rate, and the F measure, respectively.
where , and denote the true positive, true negative, false positive, and false negative, respectively.
7. Experimental Results
Table 1 shows the accuracy (ACC), detection rate (DR), false positive rate (FPR), and F1 measure of the proposed adaptive deep belief network-based IDS (ADBN-IDS). In addition, Table 2 and Table 3 show the results of the IDS built using conventional machine learning classifiers, namely the support vector machines (SVMs), and the logistic regression (LR). As pointed out previously, the ACC, DR, FPR, and F1 were calculated based on Equations (3)–(6). In the tables, the first column in each table lists the accuracy of the proposed; while the second lists the detection rat; the third column lists the false positive rate; and the fourth column lists the F1 measure of the proposed and related models. The tables’ rows are used to list feature sets with different sizes. The feature sizes range between 5 and 25 incremented by 3. The results show that the proposed ADBN-IDS achieved higher accuracy over the other two classifiers (i.e., SVM and LR) [,]. This is attributed to the ability of the BiMAV method (incorporated into ADBN-IDS) to detect the degradation in the model’s performance and trigger the training on the right time. This contributes to keeping the model up to date and prevent the concept drift from affecting the accuracy of the model.

Table 1.
The experimental evaluation results for the proposed ADBN-IDS in terms of accuracy, detection rate, false positive rate, and F measure.
Table 2.
The experimental evaluation results for the proposed SVM-IDS in terms of accuracy, detection rate, false positive rate, and F measure.
Table 3.
The experimental evaluation results for the proposed LR-IDS in terms of accuracy, detection rate, false positive rate, and F measure.
The results also show that the accuracy increased when more features were added, until the number of features reached 20. After that, the model experienced a decrease in the accuracy. This also can be observed from the other evaluation metric, namely DR, FPR, and F1. The same trend was observed not only for the ADBN-IDS, but also for SVM and LR. The reason is that the model needs sufficient features to make correct decisions. However, when the number of features exceed a certain limit, the model would suffer from high variance that makes it prone to overfitting. The situation exacerbates when the coming observations lack the sufficient attack patterns necessary for clear and accurate decision. This would result to a model that can only recognize the patterns that it has seen, and if new patterns that have less similarity with the known ones are encountered, the likelihood that the model could miss the true classification becomes high.
Figure 1, Figure 2, Figure 3 and Figure 4 show the comparison between the proposed ADBN-IDS and the models built using the SVM and LR, in terms of accuracy, detection rate, false positive rate, and F measure, respectively. The x axis represents the number of features used for training, and the y axis represents the value of performance measure achieved. The comparison was conducted between the ADBN-IDS that employed the BiMAV for adaptation and the conventional approach used in the existing studies [,]. As depicted in the figures, the proposed ADBN-IDS outperformed the related techniques in terms of accuracy, detection rate, false positive rate, and the F measure. It can also be observed that the ADBN-IDS maintain a stable increment in the performance for the four measures when the number of features increase until it reaches 20 features where the performance shows declining trend. This is attributed to the efficacy of the BiMAV incorporated for the model adaptation and the reliance on the combination of output and averaged inputs for proximity calculation from the threshold. Such an approach makes the change detection mechanism robust, which avoids unnecessary re-training and only triggers it if the change in the cITS topology or attack behavior is significant. It is also worth noting that the frequency of adaptation varies based on the threshold. When the threshold is set to a higher value, the rate of adaptation becomes less frequent. When the threshold value is set to low, the adaptation frequency increases. Moreover, Figure 5 shows the area under the curve of the proposed model under several thresholds. The x axis represents the false positive rate while the y axis represents the true positive rate. It can be observed that the false positive rate decreases when the detection rate increases.
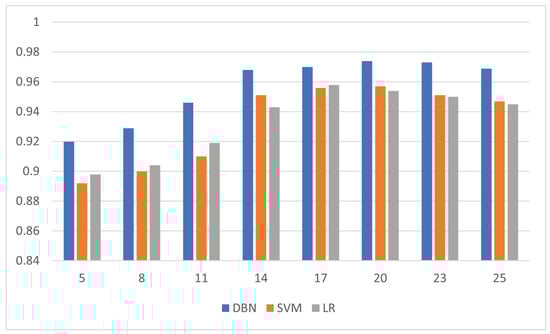
Figure 1.
Comparison of the proposed ADBN-IDS with SVM and LR in terms of detection accuracy.
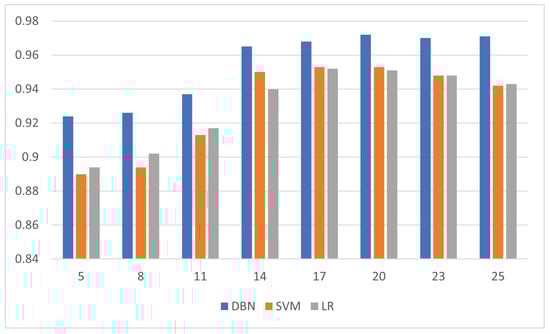
Figure 2.
Comparison of the proposed ADBN-IDS with SVM and LR in terms of detection rate.
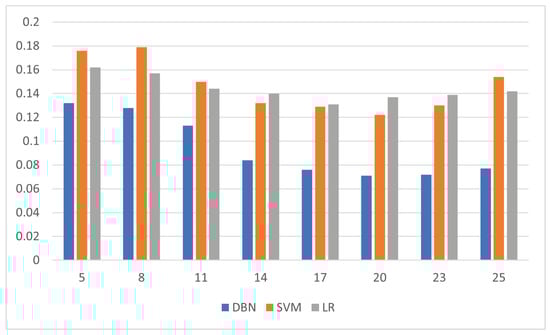
Figure 3.
Comparison of the proposed ADBN-IDS with SVM and LR in terms of false positive rate.
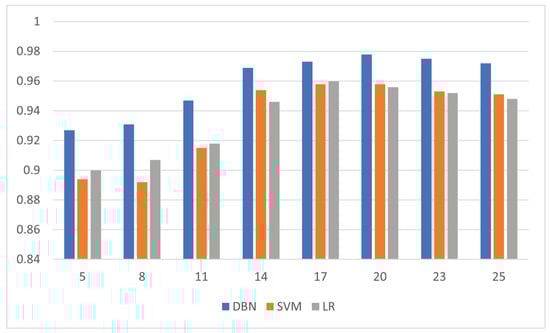
Figure 4.
Comparison of the proposed ADBN-IDS with SVM and LR in terms of F measure.
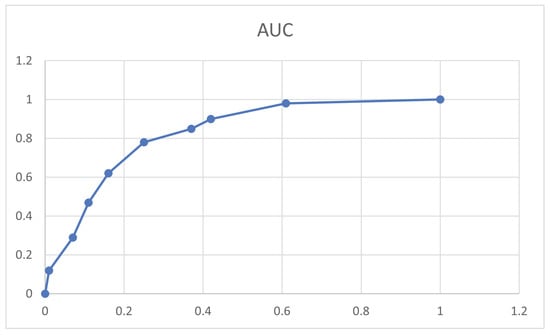
Figure 5.
Area under the curve comparison for several detection thresholds.
8. Conclusions and Summary
In this paper, our adaptive deep belief network-based intrusion detection system (ADBN-IDS) for cITS is described. ADBN-IDS is composed of three components: pre-processing, feature selection, and training/testing. Thus, the model is created from the deep belief network (DBN) classifier, and includes the bi-variate moving average (BiMAV) method as our adaptation technique. This inclusion allows the model to cope with the dynamic nature of the cITS environment and has never been tested using the NGSIM dataset.
The classifier was trained using the NGSIM dataset and tested using 10-fold cross validation. The performance of the model was evaluated using several metrics including accuracy, detection rate, false positive rate, and the F1 measure. The evaluation of our results demonstrate that the proposed ADBN-IDS achieved higher performance in terms of accuracy, detection rate, false positive rate, and F1, which indicates the importance of the BiMAV adaptation mechanism in achieving and maintaining a safer more resilient cITS.
In summary, our proposed ABDN-IDS model, for the NGSIM dataset, showed on average, an improvement of 2.35%, 2.47%, and 42% in terms of accuracy, detection and false positive rate, respectively.
Author Contributions
Conceptualization, S.A.A.; methodology, S.A.A.; software, S.A.A.; validation, S.A.A., F.T.S. and A.A.-R.; formal analysis, S.A.A.; investigation, S.A.A. and F.T.S.; resources, S.A.A.; data curation, S.A.A.; writing—original draft preparation, S.A.A.; writing—review and editing, S.A.A., F.T.S. and A.A.-R. visualization, S.A.A.; supervision, F.T.S. project administration, S.A.A.; funding acquisition, F.T.S. All authors have read and agreed to the published version of the manuscript.
Funding
This research received no external funding.
Institutional Review Board Statement
Not applicable.
Informed Consent Statement
Not applicable.
Data Availability Statement
The Next Generation Simulation (NGSIM) dataset that was used in this study is publicly available online at the following link: https://ops.fhwa.dot.gov/trafficanalysistools/ngsim.htm (accessed on 10 May 2022), and can be downloaded directly from the following link: https://data.transportation.gov/Automobiles/Next-Generation-Simulation-NGSIM-Vehicle-Trajector/8ect-6jqj (accessed on 10 May 2022).
Conflicts of Interest
The authors declare no conflict of interest.
References
- Ghaleb, F.A.; Al-Rimy, B.A.S.; Almalawi, A.; Ali, A.M.; Zainal, A.; Rassam, M.A.; Shaid, S.Z.M.; Maarof, M.A. Deep Kalman Neuro Fuzzy-Based Adaptive Broadcasting Scheme for Vehicular Ad Hoc Network: A Context-Aware Approach. IEEE Access 2020, 8, 217744–217761. [Google Scholar] [CrossRef]
- Almalki, S.A.; Song, J. A review on data falsification-based attacks in cooperative intelligent transportation systems. Int. J. Comput. Sci. Secur. (IJCSS) 2020, 14, 22. [Google Scholar]
- Talal, M.; Ramli, K.N.; Zaidan, A.; Zaidan, B.; Jumaa, F. Review on car-following sensor based and data-generation mapping for safety and traffic management and road map toward ITS. Veh. Commun. 2020, 25, 100280. [Google Scholar] [CrossRef]
- ETSI TS 102 636-4-2; Intelligent Transport Systems (ITS); Vehicular Communications; GeoNetworking; Part 4: Geographical Addressing and Forwarding for Point-to-Point and Point-to-Multipoint Communications; Sub-Part 2: Media-Dependent Functionalities for ITS-G5. ETSI: Valbonne, France, 2013; Volume 102, p. 636-4.
- Ghaleb, F.A.; Maarof, M.A.; Zainal, A.; Al-rimy, B.A.S.; Alsaeedi, A.; Boulila, W. Ensemble-based hybrid context-aware misbehavior detection model for vehicular ad hoc network. Remote Sens. 2019, 11, 2852. [Google Scholar] [CrossRef] [Green Version]
- Van der Heijden, R.W.; Dietzel, S.; Leinmüller, T.; Kargl, F. Survey on misbehavior detection in cooperative intelligent transportation systems. IEEE Commun. Surv. Tutor. 2018, 21, 779–811. [Google Scholar] [CrossRef] [Green Version]
- Maseer, Z.K.; Yusof, R.; Mostafa, S.A.; Bahaman, N.; Musa, O.; Al-rimy, B.A.S. DeepIoT. IDS: Hybrid deep learning for enhancing IoT network intrusion detection. CMC-Comput. Mater. Contin. 2021, 69, 3945–3966. [Google Scholar] [CrossRef]
- Al-rimy, B.A.S.; Kamat, M.; Ghaleb, F.A.; Rohani, F.; Razak, S.A.; Shah, M.A. A user mobility-aware fair channel assignment scheme for wireless mesh network. In Computational Science and Technology; Springer: Berlin/Heidelberg, Germany, 2020; pp. 531–541. [Google Scholar]
- Ahmed, Y.A.; Huda, S.; Al-rimy, B.A.S.; Alharbi, N.; Saeed, F.; Ghaleb, F.A.; Ali, I.M. A Weighted Minimum Redundancy Maximum Relevance Technique for Ransomware Early Detection in Industrial IoT. Sustainability 2022, 14, 1231. [Google Scholar] [CrossRef]
- Urooj, U.; Al-rimy, B.A.S.; Zainal, A.; Ghaleb, F.A.; Rassam, M.A. Ransomware detection using the dynamic analysis and machine learning: A survey and research directions. Appl. Sci. 2021, 12, 172. [Google Scholar] [CrossRef]
- Olaimat, M.N.; Maarof, M.A.; Al-rimy, B.A.S. Ransomware anti-analysis and evasion techniques: A survey and research directions. In Proceedings of the 2021 3rd international cyber resilience conference (CRC), Langkawi Island, Malaysia, 29–31 January 2021; pp. 1–6. [Google Scholar]
- Ercan, S.; Ayaida, M.; Messai, N. Misbehavior detection for position falsification attacks in VANETs using machine learning. IEEE Access 2021, 10, 1893–1904. [Google Scholar] [CrossRef]
- Ghaleb, F.A.; Maarof, M.A.; Zainal, A.; Rassam, M.A.; Saeed, F.; Alsaedi, M. Context-aware data-centric misbehaviour detection scheme for vehicular ad hoc networks using sequential analysis of the temporal and spatial correlation of the consistency between the cooperative awareness messages. Veh. Commun. 2019, 20, 100186. [Google Scholar] [CrossRef] [Green Version]
- Ghaleb, F.A.; Maarof, M.A.; Zainal, A.; Al-Rimy, B.A.S.; Saeed, F.; Al-Hadhrami, T. Hybrid and multifaceted context-aware misbehavior detection model for vehicular ad hoc network. IEEE Access 2019, 7, 159119–159140. [Google Scholar] [CrossRef]
- Azam, F.; Kumar, S.; Priyadarshi, N. Privacy and Authentication Schemes in VANETS Using Blockchain: A Review and a Framework to Mitigate Security and Privacy Issues. In AI Enabled IoT for Electrification and Connected Transportation; Springer: Singapore, 2022; pp. 127–145. [Google Scholar]
- Alharthi, A.; Ni, Q.; Jiang, R. A privacy-preservation framework based on biometrics blockchain (BBC) to prevent attacks in VANET. IEEE Access 2021, 9, 87299–87309. [Google Scholar] [CrossRef]
- Ghaleb, F.A.; Zainal, A.; Rassam, M.A.; Mohammed, F. An effective misbehavior detection model using artificial neural network for vehicular ad hoc network applications. In Proceedings of the 2017 IEEE conference on application, information and network security (AINS), Miri, Malaysia, 13–14 November 2017; pp. 13–18. [Google Scholar]
- Pandiangan, T.; Bali, I.; Silalahi, A. Early lung cancer detection using artificial neural network. Atom Indones. 2019, 45, 9–15. [Google Scholar] [CrossRef] [Green Version]
- Ghaleb, F.A.; Saeed, F.; Alkhammash, E.H.; Alghamdi, N.S.; Al-Rimy, B.A.S. A Fuzzy-Based Context-Aware Misbehavior Detecting Scheme for Detecting Rogue Nodes in Vehicular Ad Hoc Network. Sensors 2022, 22, 2810. [Google Scholar] [CrossRef]
- Alsoufi, M.A.; Razak, S.; Siraj, M.M.; Nafea, I.; Ghaleb, F.A.; Saeed, F.; Nasser, M. Anomaly-based intrusion detection systems in iot using deep learning: A systematic literature review. Appl. Sci. 2021, 11, 8383. [Google Scholar] [CrossRef]
- Qafzezi, E.; Bylykbashi, K.; Ampririt, P.; Ikeda, M.; Matsuo, K.; Barolli, L. A fuzzy-based approach for resource management in SDN-VANETs: Effect of trustworthiness on assessment of available edge computing resources. J. High Speed Netw. 2021, 27, 33–44. [Google Scholar] [CrossRef]
- Sultan, S.; Javaid, Q.; Malik, A.J.; Al-Turjman, F.; Attique, M. Collaborative-trust approach toward malicious node detection in vehicular ad hoc networks. Environ. Dev. Sustain. 2022, 24, 7532–7550. [Google Scholar] [CrossRef]
- Alghofaili, Y.; Albattah, A.; Alrajeh, N.; Rassam, M.A.; Al-rimy, B.A.S. Secure Cloud Infrastructure: A Survey on Issues, Current Solutions, and Open Challenges. Appl. Sci. 2021, 11, 9005. [Google Scholar] [CrossRef]
- Al-Rimy, B.A.S.; Maarof, M.A.; Alazab, M.; Shaid, S.Z.M.; Ghaleb, F.A.; Almalawi, A.; Ali, A.M.; Al-Hadhrami, T. Redundancy coefficient gradual up-weighting-based mutual information feature selection technique for crypto-ransomware early detection. Future Gener. Comput. Syst. 2021, 115, 641–658. [Google Scholar] [CrossRef]
- Khalaf, B.A.; Mostafa, S.A.; Mustapha, A.; Mohammed, M.A.; Mahmoud, M.A.; Al-Rimy, B.A.S.; Abd Razak, S.; Elhoseny, M.; Marks, A. An adaptive protection of flooding attacks model for complex network environments. Secur. Commun. Netw. 2021, 2021, 5542919. [Google Scholar] [CrossRef]
- Cook, A.A.; Mısırlı, G.; Fan, Z. Anomaly detection for IoT time-series data: A survey. IEEE Internet Things J. 2019, 7, 6481–6494. [Google Scholar] [CrossRef]
- Ghaleb, F.A.; Saeed, F.; Al-Sarem, M.; Ali Saleh Al-rimy, B.; Boulila, W.; Eljialy, A.; Aloufi, K.; Alazab, M. Misbehavior-aware on-demand collaborative intrusion detection system using distributed ensemble learning for VANET. Electronics 2020, 9, 1411. [Google Scholar] [CrossRef]
- Akshaya, K.; Sarath, T. Detecting Sybil Node in Intelligent Transport System. In Innovative Data Communication Technologies and Application; Springer: Berlin/Heidelberg, Germany, 2022; pp. 595–607. [Google Scholar]
- Alsarhan, A.; Alauthman, M.; Alshdaifat, E.; Al-Ghuwairi, A.R.; Al-Dubai, A. Machine Learning-driven optimization for SVM-based intrusion detection system in vehicular ad hoc networks. J. Ambient. Intell. Humaniz. Comput. 2021, 1–10. [Google Scholar] [CrossRef]
Publisher’s Note: MDPI stays neutral with regard to jurisdictional claims in published maps and institutional affiliations. |
© 2022 by the authors. Licensee MDPI, Basel, Switzerland. This article is an open access article distributed under the terms and conditions of the Creative Commons Attribution (CC BY) license (https://creativecommons.org/licenses/by/4.0/).