Article

Decision Making under Conditions of Uncertainty and Risk in the Formation of Warehouse Stock of an Automotive Service Enterprise

1
Naberezhnye Chelny Institute, Kazan Federal University, Syuyumbike Prosp. 10a, 423832 Naberezhnye Chelny, Russia
2
Institute of Digital Technologies and Economics, Kazan State Power Engineering University, Str. 2nd South West 26, 420034 Kazan, Russia
*
Author to whom correspondence should be addressed.
Algorithms 2023, 16(8), 388; https://doi.org/10.3390/a16080388
Submission received: 16 July 2023 / Revised: 8 August 2023 / Accepted: 11 August 2023 / Published: 13 August 2023
(This article belongs to the Special Issue Optimization Algorithms in Logistics, Transportation, and SCM)

Abstract

:
This article is devoted to the problem of determining the rational amount of spare parts in the warehouse of a service center of an automobile manufacturer’s branded network used for maintenance and current repairs. This problem was solved on the basis of the accumulated statistical data of failures that occurred during the warranty period of vehicle operation. In the calculation, game methods were used. This took into account the stochastic need for spare parts and the consequences of their presence or absence in stock, which are expressed in the form of a profit and an additional possible payment of a fine in case of a discrepancy between the current level of demand for spare parts and the available spare parts. Two cases of decision making are considered: under conditions of risk and uncertainty, the occurrence of which depends on the amount of information about the input flow of enters to the service center. If such statistics are accumulated, then the decision is made taking into account the possible risk associated with the uncertainty of a specific need for spare parts. Otherwise, the probability of a particular need is calculated on the basis of special criteria. To optimize the collection of information about the state of warehouse stocks, the transfer of information, and the assessment and forecasting of stocks, well-organized feedback is needed, which is shown in the form of an algorithm.

1. Introduction

The automotive industry is a highly competitive sector. Here, all components—production, supply chains, innovation, and quality—must work flawlessly. The main problem of the supply chain is its complexity, and it is necessary to achieve a single fault-tolerant system.
Spare parts are a key part of the aftermarket. Even if the vehicle model is discontinued and the vehicle is used, it is required to maintain the required level of spare parts. In the branded service system, the inventory management strategy is reduced to the maximum satisfaction of customers in terms of service time and cost of work. On the one hand, it is necessary to speed up the process of customer service, while providing high-quality services; on the other hand, to find a balance in the level of storage of spare parts in the warehouse so that there are no unnecessary and unused volumes, as this affects the cost of storage, and in the case of ordering the necessary parts for repair at the time of request on the cost of express delivery and lost profits of the client due to forced downtime. Also, the irrational work of the warehouse with a long wait for spare parts leads to the need to allocate additional premises for the storage of waiting vehicles [1].
Complicating the task of predicting the correct qualitative and quantitative composition of stocks is the uncertainty of demand caused by the probabilistic nature of vehicle failure moment, and the heterogeneity of the weight and size characteristics of spare parts that affect the speed and cost of delivery and storage costs.
In addition, it is known that when making engineering, managerial, and other decisions, there is no complete information about the system state, external conditions, and consequences of the decisions made. Thus, studies show that 80% of decisions are made with only 20% of information about the controlled system and the factors acting on it [2,3]. In the problem of planning a spare parts warehouse, an example of conditions of uncertainty at road transport enterprises is to determine the number of possible requirements for a specific type of vehicle repair during “tomorrow”, the possibility of working, or the absence of a specialist or worker. Complete information in such cases can be obtained only after the occurrence of one or another event, when the need for a proactive decision has disappeared, and the system has switched to reactive control mode. Therefore, when managing, it is necessary to be able to fill in or compensate for the lack of information in one way or another. Properly planned organization of an automotive service enterprise’s warehouse stock operation cannot do without scientific methods of analysis. One of the decision-making methods in conditions of information deficiency is the analysis of the market, and production situation using game theory and statistical decisions.
The purpose of the study is to develop a methodology for determining the volume of spare parts stored in a warehouse in order to minimize the balance of costs for organizing storage based on the optimal amount of stock in the warehouses of the service center.
The originality of the study lies in the fact that under conditions of uncertainty of demand caused by the probabilistic nature of vehicle failure moment, and the heterogeneity of the weight and size characteristics of spare parts that affect the speed and cost of delivery and storage costs, it is proposed to use game techniques that allow us to determine the minimum required level of stock while minimizing possible losses in the form of fines and overexpenditures for storage.

2. Literature Review: Methods Used in the Spare Parts Supply System

The reliability of vehicles depends not only on the quality of the vehicle design, but also on its further service support. To keep the vehicle in working condition, timely cmaintenance of its systems and mechanisms is necessary. In this sense, high-quality and timely provision of spare parts is one of the key links in this process.
To ensure that service needs are met in the shortest possible time, a certain level of spare parts is kept in stock. The authors of [4] propose the use of a centralized control strategy. Based on centralized real-time storage of spare parts demand information in each region, centralized inventory control in each sub-warehouse is carried out by the coordinating center.
The demand for spare parts depends not only on the planning of spare parts for vehicle maintenance, but also on the possible failures of the vehicle’s systems. The failure of their parts, components, and assemblies is probabilistic in nature, this can happen at any time, while the desired part may not be in stock. Therefore, automotive companies are developing their own inventory forecasting methods that will take into account various factors that affect the operational state of vehicles. For automotive companies, it is very important that the level of customer satisfaction of auto repair shops meet their expectations, while not increasing the cost of holding inventory. Demand for spare parts is not stable. Seasonal changes also affect the formation of stocks [5].
The number of heavy trucks in Russia at the beginning of 2023 amounted to 2.483 million units. The share of vehicles older than 10 years is about 69%, and KAMAZ trucks older than 10 years is 60.8%, which is lower than the national average. Experts noted that truck drivers are involved in traffic accidents 1.7 times more often than other road users. Thus, at the end of 2021, the frequency of insured events in the category of trucks was 8.3%, which is 3.2% higher than the average number [6]. All this leads to a higher failure rate. In [7], the number of spare parts is determined by the number of accidents, and the number of accidents is determined by the total number of vehicles sold.
Most service centers use a warehouse management system based on event forecasting, and it is relevant with an ideal logistics system and a minimum time factor. If these criteria cannot be met, maintenance and repair times are extended, especially away from logistics centers [8].
In [9], the authors propose a methodology that allows us to determine the required range and quantity of spare parts for a known fleet of vehicles with a given load and conditions for ensuring the calculated level of reliability and performance of equipment. The algorithms and mathematical apparatus presented in the article make it possible to determine the range of spare parts depending on the operating time parameters of special vehicles and their failure rate [10].
Many studies use the ABC classification method, that is, the division of spare parts into groups [11,12]. When repairing vehicles, spare parts are the main part. In [13], the authors studied the number of vehicles sold and their mileage associated with each of the spare parts and used rough set theory based on ABC analysis. In the article, solving the problem of the diversity of spare parts and their distribution, the ABC classification method for automotive parts based on DEA was built [14].
Various mathematical methods are used to determine the required stock, from the simplest to the most complex. Inventory formation involves maintaining such a ratio of parts with frequent or irregular demand so that there is a high turnover at the same time, so that the costs of maintaining inventory are most favorable.
In the field of forecasting, deep learning methods are rapidly developing and successfully applied, the study [15] considers the implementation of several deep learning algorithms for predicting the demand for vehicle spare parts, including fully connected networks, convolutional neural networks, and networks with long short-term memory. In [16], a method for predicting spare parts of discontinuous feature adaptation is proposed in terms of transfer learning. So, to predict the failure of aircraft parts that have the highest demand, an artificial neural network model is built, and it is first optimized, and then trained and tested using known sets of demand data for past periods [17]. Machine learning, multilevel generalization, and time series have been used as basic methods for demand forecasting in military logistics [18]. However, in some enterprises, due to insufficient data, if data is not systematically collected, predictive models will not work well and there will be difficulties with the data management system.
It is impossible to manage inventory by placing an order strictly when the volume of spare parts falls below a given threshold, which is complicated by the uncertainty of demand and the uneven range of spare parts and depends on the volume, storage cost, and delivery cost. Parts in high demand are difficult to predict and, for this reason, the company Daimler-Benz in the 1970s refused to create warehouses for parts in frequent demand.
The authors of [19] structured vehicle services into three different segments depending on the services provided, which made it possible to identify the risks of making wrong logistics decisions in each of the selected segments.
Additive technologies can contribute to increasing the flexibility of spare parts supply [20]. Traditional prototyping is time-consuming and expensive as the product goes through more iterations. With 3D printing, it is possible to create high-quality prototypes in one day. The use of 3D printing is possible in the repair of technological equipment when replacing parts. Let us assume that the fastener on the manipulator is broken. When contacting the manufacturer for the purchase of one part, they would spend RUB 5000–10,000 and several days for delivery, if it is available for sale. The work of the 3D printer costs five hours and 500 rubles. The difference is obvious [21]. An example of the use of additive manufacturing in the automotive industry is the production of 100 headlight washer caps for a Lamborghini Gallardo, made by CRP Technologies using SLS processing of a material filled with carbon fibers. Additive technologies were used mainly for the manufacture of individual expensive parts, so now the focus is shifting to the mass production of parts and the production of spare parts [22]. Companies should pay attention to the flexibility of the supply chain by using additive technologies to increase its efficiency [23]. Additive manufacturing of automobiles will contribute to more efficient inventory management.
A lot of research is devoted to improving work with suppliers. In reference [24], the problem is modeled using a probability tree and Markov chains to determine the optimal number of spare parts and suppliers. When selecting suppliers, an enterprise must have a supplier selection system. The reference [25] proposes a software module that will help select suppliers of spare parts based on their reliability from a logistical point of view. A problem tree was built to identify risks. The study [26] uses a Markov decision process to formulate a sequential decision problem that takes into account spare parts inventory information from two suppliers and takes into account which component will be replaced first in a two-component system.
The right choice of suppliers facilitates strategic supply management to reduce the risk of purchasing spare parts. When choosing suppliers, many criteria must be taken into account, which is a difficult task to implement in a risky environment. An artificial neural network is used to create an effective and inefficient supplier selection model, four criteria are obtained from an artificial neural network; these are the criteria for quality, delivery, price, and warranty and claim service [27]. The article [28] focuses on the classification of ship spare parts using transfer learning theory with the help of deep convolutional neural networks. An algorithm for selecting suppliers and an evaluation method based on cluster analysis of supplier reliability indicators are proposed in [29].
The interaction between the manufacturing plant, dealers, vehicle workshops, and online stores selling spare parts involves many parties who need to reach an agreement [30]. The study [31] aims to show the potential of Blockchain technology in providing a high degree of competitive advantage, especially for automotive service providers, in relation to its functions, and more efficient data storage. Instead of each party independently verifying and reconciling transactions, the blockchain allows them to work with a single source of truthful information. Counterfeit auto parts that are genuine in appearance can find their way into the supply chain of service centers. Blockchain can solve this problem by creating a distinctive identifier for each part, including immutable timestamps made at the time the part was created. These tags are connected to the blockchain and can be used to add a layer of authentication protection [32].
Thus, there are a large number of methods for predicting the rational amount of spare parts in the warehouse of a service center of an automobile manufacturer’s branded network. All of them are suitable for certain conditions. However, in market conditions, most of the parameters that affect the consumption of spare parts in branded service centers are stochastic. In addition, the economic activity of any service company is reduced not only to maximize profits, but also to minimize the payment of penalties to the client in the event of a delay in repairs and its own expenses for ensuring activities. The latter is also determined by the stock formation strategy. Therefore, in solving the problem of predicting the amount of spare parts in the warehouse of a service center of an automobile manufacturer’s branded network, we suggest using gaming methods.

3. Materials and Methods

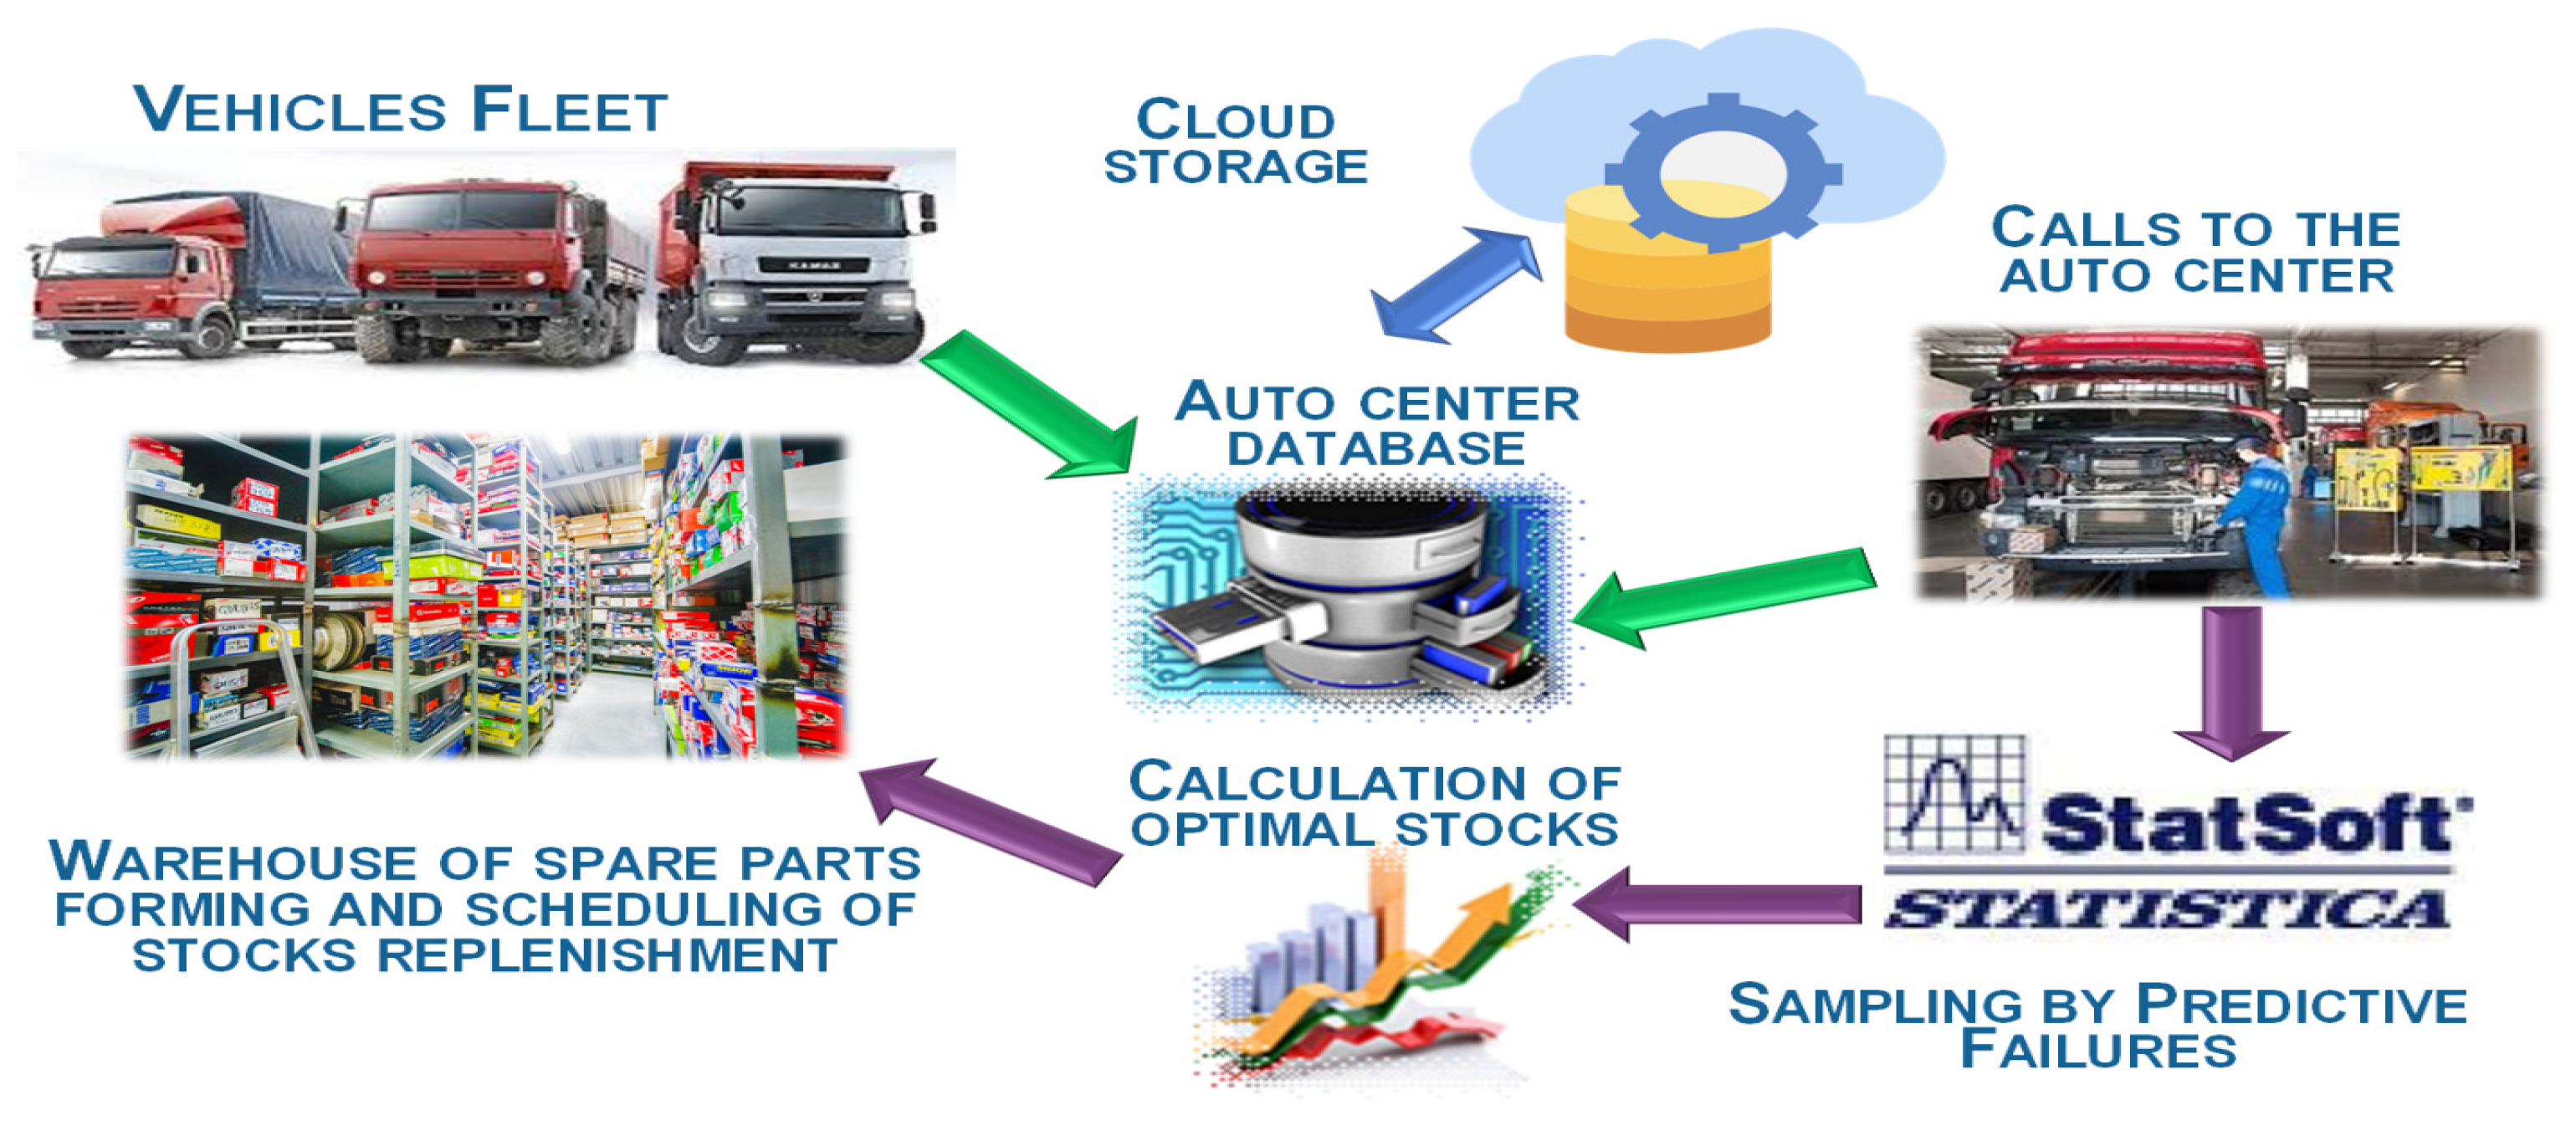
3.1. Spare Parts Management System

The spare parts supply management system deals with a certain set of vehicles dispersed over the dislocation territory, disciplined according to the service centers serving them in the branded network of the automotive enterprise. Vehicles form a stream of failures and service needs that form the stream of requirements for spare parts entering the spare parts management system. The spare parts supply management system is implemented by means and methods of organizing the delivery and storage of spare parts.
The main objects of the spare parts management system are:
  • A vehicle that can be in one of three states—serviceable, faulty, and planned to be handled;
  • A service center that provides maintenance of vehicles using supplied spare parts.
The spare parts supply management system is considered a closed queuing system, in which the processes occurring are determined by the cumulative action of random variables. When planning the activities of such systems, it becomes necessary to determine the quantitative characteristics of the distribution laws of random variables, which are their parameters. They include the intensity of the incoming flow of customer requests. This intensity directly determines the amount of required spare parts. Since this value can be determined through the reliability indicators of serviced vehicles, it is necessary to study the dynamics of changes in the flow of requirements, which means knowledge of the distribution laws.
The moments of failures’ occurrence at the stages of running-in and normal operation occur according to the laws of failure distribution for various nodes, assemblies, and systems, obtained on the basis of processed statistical information about customer requests in previous periods in a given region. Thus, it seems possible, based on the accumulated statistics, to calculate the probabilities of component failures and identify among them the so-called limiting reliability.
When the vehicle arrives at the service center and a demand arises for a spare part, depending on its type, the following options for the system reaction are possible:
  • If the spare part belongs to the group of limited reliability, then it is necessary to plan its quantity so that it is available. However, here it is necessary to take into account the weight and size characteristics that affect the cost of storage. Therefore, most often the reaction of the system is in the form of a decision to ship spare parts from the warranty warehouse of the service center in the event of a vehicle failure at the stage of running in the warranty period due to a defect. When contacted during normal operation, the shipment of spare parts is carried out from the warehouse of the service center. If the required item is not in the warehouse of the service center, the regional warehouse is contacted.
  • If the spare part belongs to the group of rarely failed parts, an order to the manufacturer for urgent delivery of the required items is made.
The point of delivery is set depending on the delivery time of spare parts to the service center. The volume of the supply lot of this nomenclature depends on the needs of the region as a whole.
When planning the volume of stored spare parts, the following components should be considered:
  • Losses from storage of unclaimed spare parts, which are adjusted daily after the planned period of the customer’s call, taking into account the daily cost of storing a storage unit;
  • Losses from the costs of urgent delivery, which are calculated when the flow of spare parts from the automobile manufacturer to the service center;
  • Losses associated with the cost of fines for shortages are calculated for the planned period for those requests, the deadline for which exceeds the declared standard, taking into account the costs of downtime of service posts and personnel, as well as lost profits for customers during the vehicle commercial operation.
There is a spare parts distribution point (management center of the company’s service network). From this point, it is necessary to distribute in M regions lots of spare parts of volume qij  ( i = 1 , N ¯ ) , ( j = 1 , M ¯ ) , where N is the total number of items in the spare parts supply lot. Deliveries are carried out in sets of the i-th spare part, which can be considered a generalized nomenclature.
The level of stock in the warehouses of the service center decreases in accordance with the intensity of service requests, which in turn correspond to the value of λij—the failure rate of i-th parts, assemblies, and assemblies in the j-th region of operation.
Based on the value of λij, the corporate service network control center plans customer requests for the planned period tP in the future. Upon reaching the time τ—the point of realization of batches, depending on the distance of the j-th region of operation from the control center of the branded service network, as well as upon reaching the existing stock kij (amount of existing stock of i-th spare part in the j-th region) in the warehouses of service centers Sij—the value of the minimum stock of the i-th spare parts in j-th region, the control center of the branded service network delivers spare parts in the amount of qij with the least cost gij. In conditions of random demand, the model does not include the indicator of the supplies’ frequency. Instead, it is more expedient to use the value of the total number of deliveries B for the period (year).
Thus, through the planning of customer requests and the calculated failure rate of the i-th parts in the j-th region, the stock of stored spare parts is replenished by the control center of the branded service network, and additional costs are associated with each such replenishment.
When minimizing expenses for a period, storage costs and penalties are calculated based on the expected balance (deficit) by the end of the period (year). The penalty is determined by the probability of shortage.
First of all, the service center bears the costs hij (storage costs of the i-th spare part in the j-th region) for the storage of the i-th spare parts in their warehouse for the entire period and the delivery of the batch volume gij.
Service requests are satisfied until their total volume (since the beginning of the planning period) exceeds the initial stock. All subsequent requests cannot be serviced immediately, causing the customer’s vehicle to sit idle while waiting for service. Downtime results in lost profits for the customer and fines for the service center.
The penalties for the absence of the required spare parts in the warehouse of the service center include the excess of the costs of emergency delivery over the costs of ordinary and lost profits (percentage of working capital frozen in the service center due to a shortage):
d = i = 1 N j = 1 M λ i j B 2 2 g i j 1 h i j .
A shortage of spare parts can lead to the loss of customers if they decide to service the vehicle in another service center.
It is required to choose the moment, volume, and structure of deliveries of spare parts batches in such a way that the total costs of storage, delivery, and a penalty for shortages are minimal. Some restrictions should be imposed on the operation of the service center warehouse. The maximum stock should not exceed the capacity of the warehouse, and its cost is a given amount. In this case, the conditional minimum cost is determined by the formula:
Z = τ t Π i = 1 N j = 1 M λ i j h i j k i j + B i = 1 N j = 1 M g i j q i j + i = 1 N j = 1 M d i j ( S i j + q i j ) p i j m i n
with restrictions:
i = 1 N j = 1 M h i j d i j i = S + 1 p i 0 ,
i = 1 N j = 1 M d i j i = S p i h i j 0
The above constraints are general stock optimality conditions S i j .
To ensure the minimum amount of costs Z in the conditions of the smallest shortage and the best values of performance indicators, it is necessary to calculate the optimal value of the delivery point. So, the delivery should be carried out at the time:
τ j = i = 1 N q i l + S i j λ i j t Π + g i j B
An indicator of efficiency can be the average customer downtime waiting for spare parts:
υ j = i = 1 N ρ i j / Λ j ,
where ρij—the average number of applications for the replacement of a faulty i-th part, assembly, or unit to the service center of the j-th region;
Λ j = i = 1 N λ i j —the total intensity of the flow of serviced requests, according to the law of applications’ conservation, is equal to the intensity of the incoming flow.
The spare parts supply system model can be described as a structure of functional relationships between a variable composition of significant factors and output parameters. In such a model, it is necessary to provide a similarity of the reaction of “exit” to “input”, which must be in both static and mathematical equilibrium.
The task of determining the optimal control is to find such optimal values X1: the period of early delivery of spare parts at the stage of normal operation of the warranty period; X2: the optimal volume of the supplied batch; X3: the value of the minimum stock for each group of spare parts; and X4: the ratio of spare parts of each group to the total quantity (grouping coefficient), at which the value of function Y (total costs for organizing the supply and storage of spare parts in the warehouses of the service center) will be minimal:
Y ( X 1 ,   X 2 ,   X 3 ,   X 4 ) min .
Function Z (X1, X2, X3, X4) is the total cost of organizing the supply of spare parts for servicing vehicles during the entire warranty period, and consists of the following sub-functions:
Z ( X 1 , X 2 , X 3 , X 4 ) = Z 1 + Z 2 + Z 3 m i n ,
where Z1—the cost of storing spare parts in the warehouse of the service center
Z 1 = 1 / 2 B ( τ X 1 ) i = 1 N j = 1 M λ i j h i j ( X 2 X 3 ) ,
where X 1 = t p —point of delivery of a batch of spare parts;
  • X 2 X 3 = k i j —surplus in warehouses for each i-th position of spare parts.
Z2—costs associated with the delivery of consignments of spare parts to the warehouse of the service center
Z 2 = i = 1 N j = 1 M g i j X 2 X 4 ,
where X 2 X 4 = q i j is the volume of the supply lot of the i-th positions of spare parts in the j-th region of operation.
Z3—the cost of penalty for the lack of necessary spare parts in the warehouse of the service center (downtime of service posts and personnel, loss of customer loyalty)
Z 3 = i = 1 N j = 1 M d i j ( X 3 + X 2 X 4 ) p i j ,
where X 3 = S i j is the minimum stock of i-th spare parts in the warehouse of the service center of the j-th region of operation.

3.2. Game Methods When Deciding on the Volume of Stored Spare Parts

Within the framework of the above-described statement on the issue of managing the provision of spare parts, we will develop a methodology for determining the value of the irreducible stock for each group of spare parts using game theory.
Game theory is widely used in making strategic decisions under uncertainty in various fields: medicine [33], military affairs, modeling the behavior of autonomous vehicles [34], building houses [35], supplier selection, etc.
In order to perform a mathematical analysis of the situation of planning the volume of stored spare parts, a simplified model, cleared of minor details, called the game, was built. In the game, the parties function and their possible strategies are considered (reproduced); that is, a set of rules that prescribe certain actions depending on the situation that has developed during the game. Usually, there are two sides in the game, and such a game is called a pair. If several participants participate in the game, then the game is called multiple.
If in a real situation actively opposing parties (competing enterprises in the market, sports competitions, and military operations) collide, then the game simulating this situation is called conflict or antagonistic. In these games, the parties meaningfully oppose each other, and the gain of one side means the loss of the other. In conflict (antagonistic) games, two or more opposing sides collide, having their own interests and striving to improve their position at the expense of others. For example, the struggle in the market is limited by the demand of a group of enterprises (motor transport company, service station) for the clientele. Usually, they tend to reduce the multiple games to a series of paired games, in which two sides participate, conditionally called “attacking” A and “defending” B. The attacking side is the first to take certain actions (release of new products, services, change in pricing policy, etc.) and seeks to obtain a certain gain. If one side’s gain is equal to the other’s loss, then it is a zero-sum game.
In solving our problem, we considered two sides:
A is production organizers (active side); that is, the heads of the engineering and technical service of a motor transport enterprise, a service station, and other enterprises of all forms of ownership that provide services to consumers.
P is a set of randomly arising production or market situations (“nature”).
The active side must choose such a strategy, that is, make a decision in order to get the maximum effect. At the same time, “nature”, that is, the emerging production situations, does not actively oppose the activities of the organizers of production, but they do not know the exact state of “nature” (P). Such games are called “games with nature” (production), and the methods used are called statistical solutions.
Decision making by game methods is based on certain rules that regulate possible options (strategies) for the actions of the parties participating in the game; availability and volume of information of each party about the behavior of the other; the result of the game, that is, the change in the objective function with combinations of certain strategies of the parties.
During the game, the parties assess the situation, make decisions, and make moves; that is, they take certain actions to change the situation in their favor. The moves are personal—a conscious choice of the side from the possible options for action. Random—this is a choice from a number of possible ones, determined by the mechanism of probabilistic selection of options, and not by the participant in the game. Mixed moves are a combination of personal and random moves. If the number of possible strategies is limited, then the games are called finite, and if the number of strategies is unlimited, they are called infinite.
Depending on the content of the information, two options were considered: decision making under risk and uncertainty.

3.2.1. Decision Making under Risk

To make a decision under risk conditions, the following algorithm was used:
  • Formation of strategies of the sides (Table 1). Production strategies or service market requirements are determined by the number of spare parts of a certain type required during the change nj.
2.
Calculation of the consequences from a random combination of sides’ strategies. In real conditions, the combination of strategies Ai and Pj is random, but each combination of strategies corresponds to certain consequences bij.
For example, if the need for a spare part for repair exceeds their availability in the warehouse, then the company incurs damage from additional downtime of the vehicle for repair (in the case of a warrantied vehicle, the manufacturer is responsible for maintaining the vehicle in operatable condition and must fulfill obligations according to the concluded contract for warranty service on the restoration of the vehicle within a strictly allotted time or pay a penalty) or refusal to provide the client with the corresponding service. If there are fewer replacement requirements than there are spare parts in stock, then there are additional costs associated with storing “surplus” units (“frozen assets”, heating, lighting, and other costs). Quantitatively, the consequences of combining the strategies Ai and Pj are estimated using the gain bij. Gain bij > 0 is called profit, and bij < 0 is called loss. Excess stock causes additional costs for the storage of units (Table 2).
3.
Determining the gain for all possible combinations of strategies in this example of Ai and Pj (in this case 25).
For example, the combination of strategies A2 and P4 means that the need for spare parts for repairs during this shift is (P4) n4 = 3 spare parts, and there is (A2) only one spare part in stock. Therefore, the gain (Table 3) will be b24 = 1 × b2 (with demand 3, there is 1 spare part in stock, and 1 application is satisfied)—2 × b3 (two applications are not satisfied); a combination of strategies A4 and P2 (one spare part is needed for replacement, 3 are in stock) b42 = 1 × b2 (one requirement is satisfied)—b1 (two spare parts are not in demand), etc. Winnings when combining all possible strategies of the parties are summarized in the payment matrix (Table 3). In fact, the payment matrix is a list of all possible alternatives from which it is necessary to choose a rational one.
4.
Choice of the rational strategy of production organizers Ai 0. The simplest solution arises when a strategy Ai is found, each gain of which, for any state Πj, is not less than the gain for any other strategy. In the general case, with known probabilities of each state Πj, a strategy Ai is chosen, in which the mathematical expectation of the profit of the production organizers will be maximum. To do this, calculate the weighted average gain for each row of the payment matrix for the i-th strategy:
Bi = qi bi1 + qi bi2 +…+ qn bin.
The results obtained in this way are summarized in the profit matrix (the last column of Table 4).
5.
From the profit matrix, we choose the optimal strategy that provides the maximum profit (bi) max.
6.
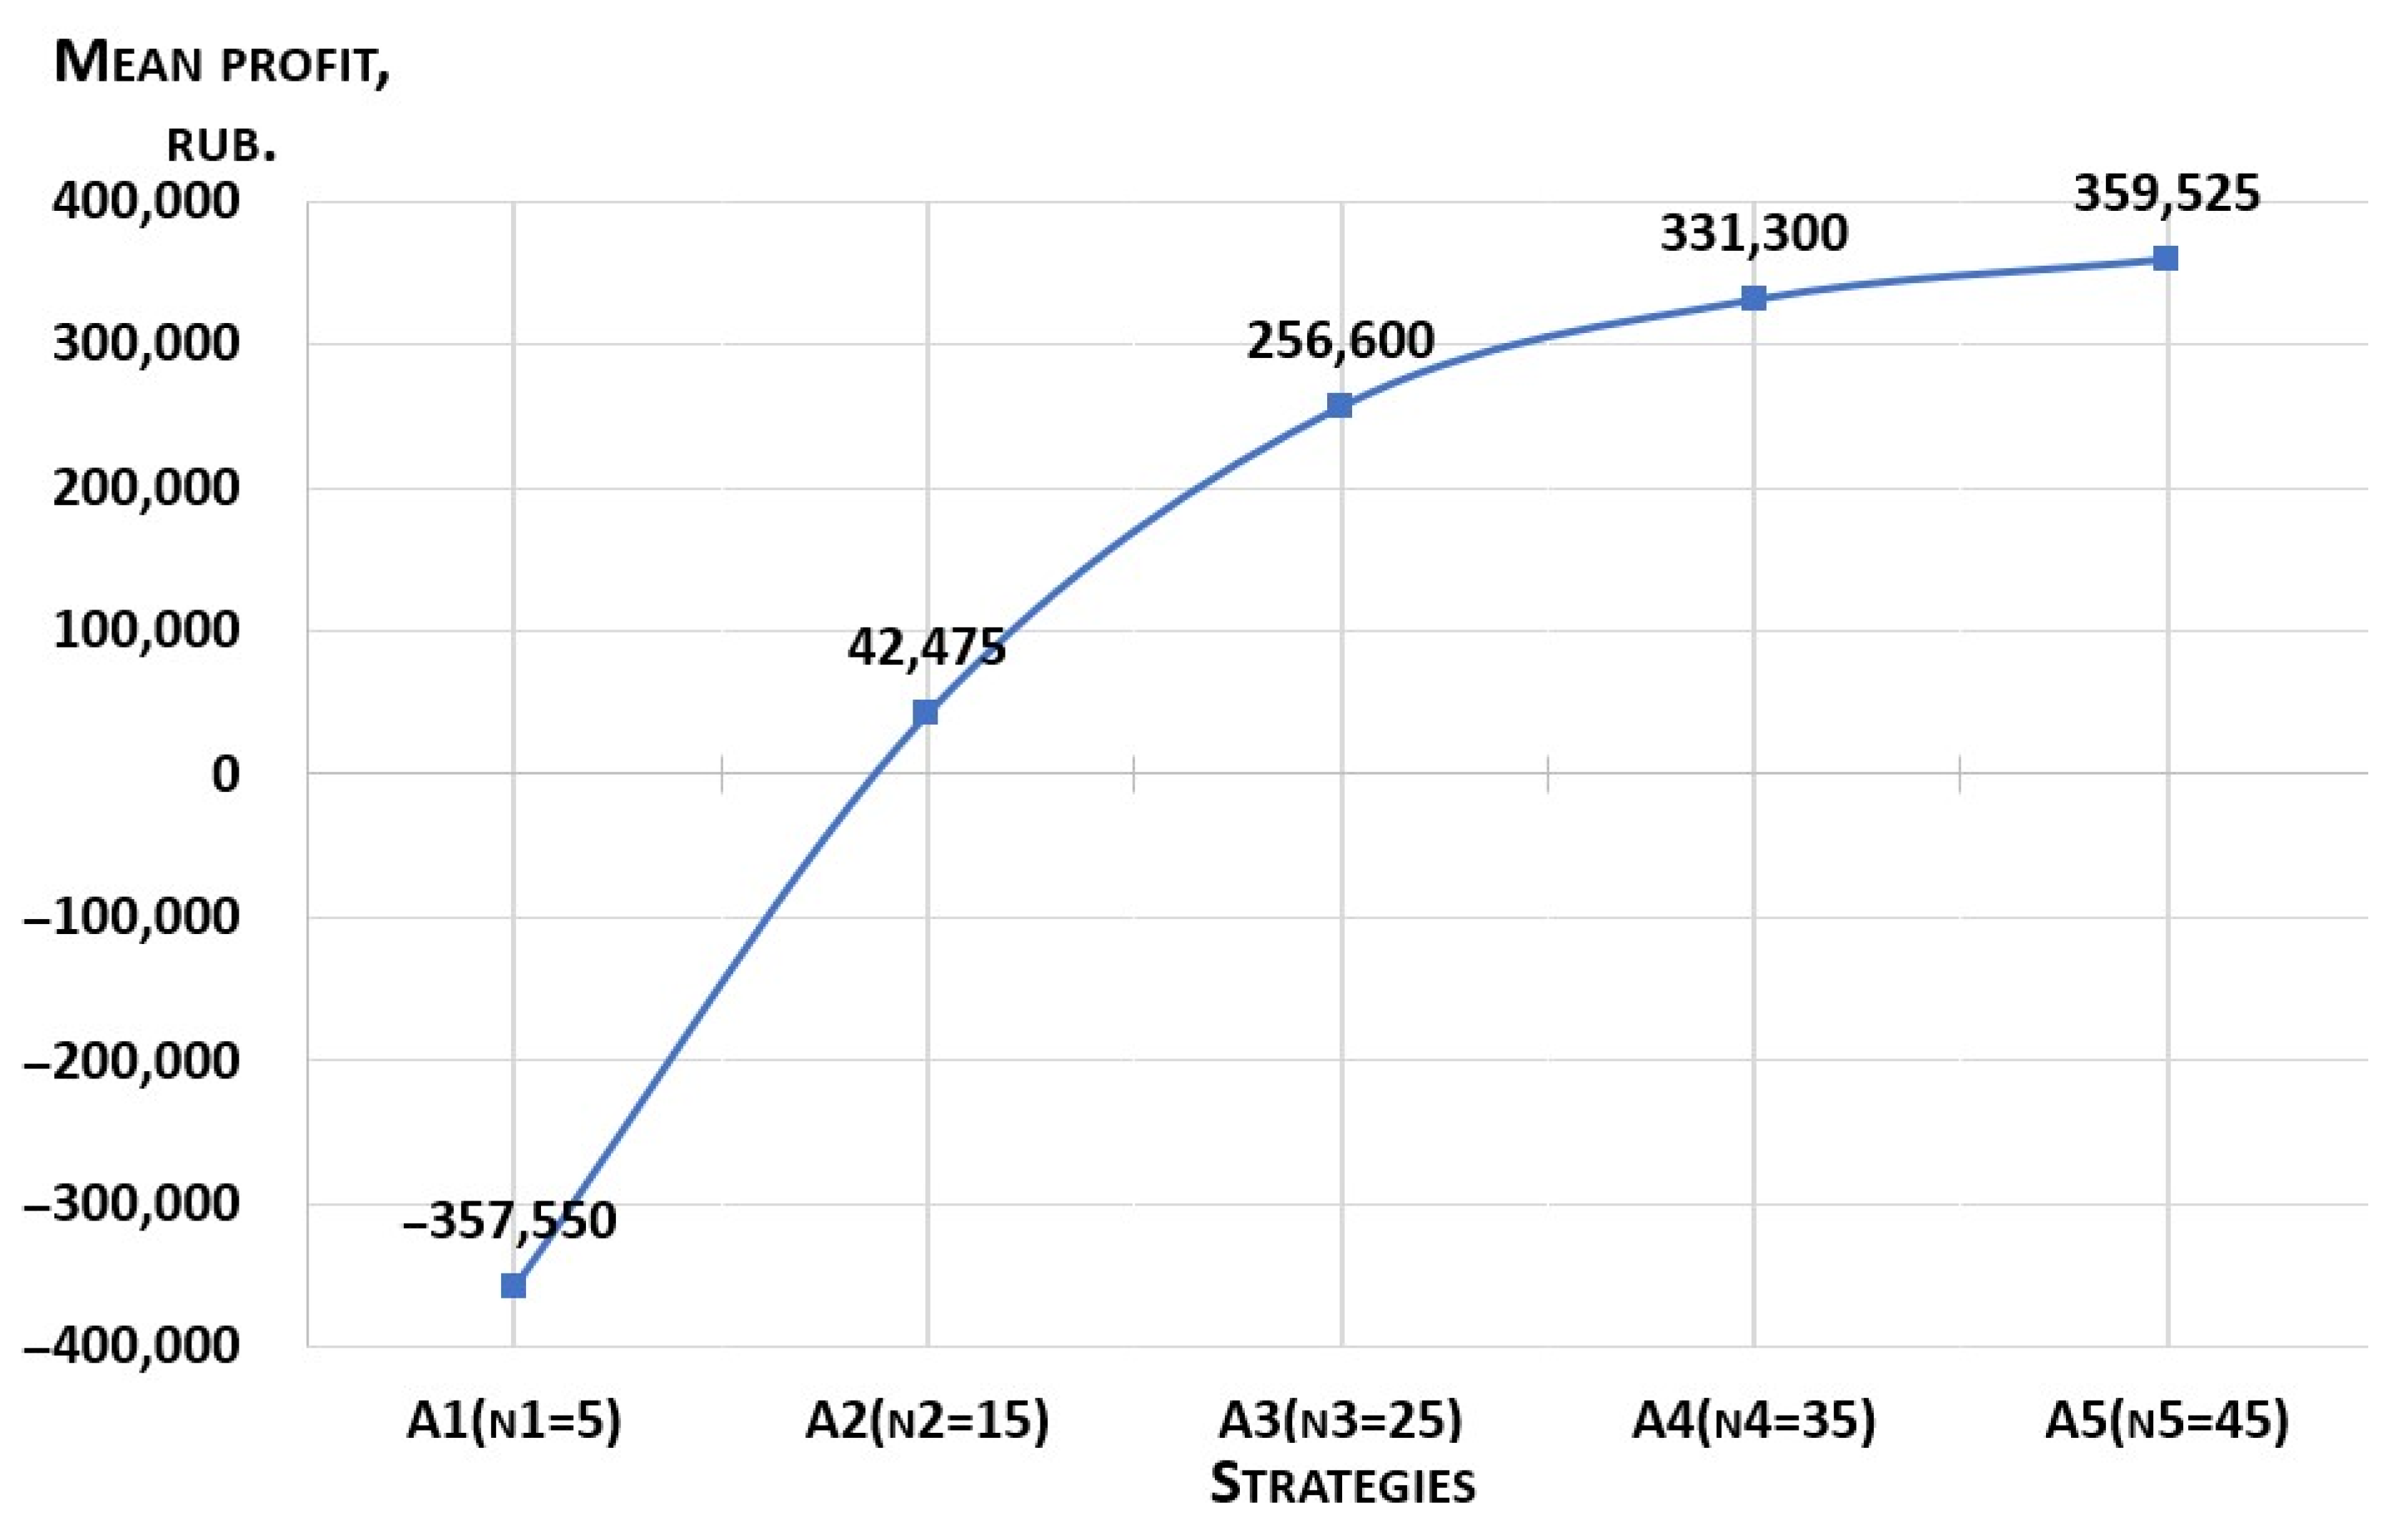
The results obtained for the change in gain depending on the stock of aggregates in the warehouse (strategies A) are shown graphically.
7.
Determine the economic effect of using the optimal strategy.
The peculiarity of the performed calculation is that it took into account not only the probability of a certain need for units, but also the consequences of their presence or absence in the warehouse. Therefore, economic efficiency can be obtained by comparing the profit for the optimal strategy b0 = bmax with the profit bc, which can be obtained while maintaining the weighted average demand for aggregates nc in the warehouse, when the consequences of the decisions made are not taken into account.
nc = Σqi nj,
where nj—the need for aggregates in stock;
  • qi—the probability of this need.
The economic effect when using the optimal strategy is
E (A°) = (b0 − bc)/b0.
8.
We analyze the obtained solutions. Conclusions are given on the basis of the data obtained in Table 4 and the calculation of economic efficiency from the application of the optimal strategy.

3.2.2. Decision Making under Uncertainty

These conditions differ from decision making under risk conditions in that there is no information about the state of nature Pj (qj = ?). This is where the uncertainty of the problem lies. We can use the following decision-making methods under uncertainty when playing with nature:
  • Reduction of unknown probabilities qj to known ones, which means transition to the problem of decision making is under risk. The simplest way is Laplace’s principle of insufficient reason, according to which none of the j-th states of nature Pj is given preference and equal probability is assigned to them, which means q1 =q2 =q3 =… qj = 1/j for all states.
  • If there is no information about the probability of states Pj, then events can be ranked based on previously accumulated experience, which means they are arranged in decreasing (or increasing) order of probabilities, for example, using an expert method. In this case, the ranks are translated into places and the probabilities are determined using the following formula.
q k = 2 ( k M + 1 ) k ( k + 1 ) ,
where: M is the ranking place; k is the number of strategies.
It is natural that
i = 1 k q k = 1,0 .
3.
After determining the probabilities qj, the calculation is carried out according to the decision-making method under risk conditions.
If the probabilities of the system state Pj cannot be determined or estimated by the considered methods, then special criteria are used: maximin, minimax, and intermediate.
The maximin criterion KI (Wald) ensures the choice of strategy Ai, under which, under any conditions, a profit is guaranteed that is not less than the maximin:
K I = α = m a x i α i = m a x i m i n j b i j .
To determine such a strategy for the payment matrix, we determine for each strategy of the organizers Ai minimum gain αi, which means αi = min bjj. To do this, in the payment matrix for each strategy Ai, we look through the data line and choose the minimum gain. Next, from the minimum values of gain, we choose the maximum value, which corresponds to the rational strategy of the production organizers.
The maximum criterion KI is based on the most pessimistic assessment of possible production situations and guarantees the organizers of production a gain not less than the value of this criterion.
This criterion is used in risky operations in the market, in the development of new niches in the market of goods and services, the approbation of fundamentally new technologies and high-value products.
4.
The minimax criterion KII (Savage) provides the choice of such a strategy in which the risk value will be minimal in the most unfavorable production conditions:
K I I = m i n i m a x j r i j .
Choosing one or another strategy of behavior in production or the market, the organizers of production take risks. In relation to the situation under consideration, the risk is the difference between the maximum gain in a known state of production (nature) and using the optimal strategy and an unknown state when other strategies Ai can be applied:
Rij = (βi)max − bij.
For example, with the strategy A1 and P2 risk r12 = (β2) − b12; with strategies A4 and P2 risk r42 = (β2) − b42, etc. The data obtained are summarized in a risk matrix (Table 5), in which for each strategy Ai we determine the maximum risk (the last column in the risk matrix).
Of all the strategies of production organizers, we chose the one that provides the minimum value of the maximum risk.
With a minimax strategy, the risk value will be minimal in the most unfavorable conditions, which means the enterprise is guaranteed against excessive losses.
5.
The criterion of pessimism–optimism (Hurwitz) is focused on the choice as an intermediate between the two considered strategies:
K I I I = m a x i d m i n j b i j + ( 1 d ) max b i j j .
The coefficient d is set on the basis of experience or expertise in the range 0 ≤ d ≤ 1; moreover, the more serious the consequences of the decisions being made, the greater d. When d = 0, there is over-optimism, and when d = 1, the criterion turns into KI.
A comparison of the strategies chosen by different methods shows that under conditions of uncertainty, applying the appropriate methods and criteria, it is possible to identify strategies that are very close to optimal.

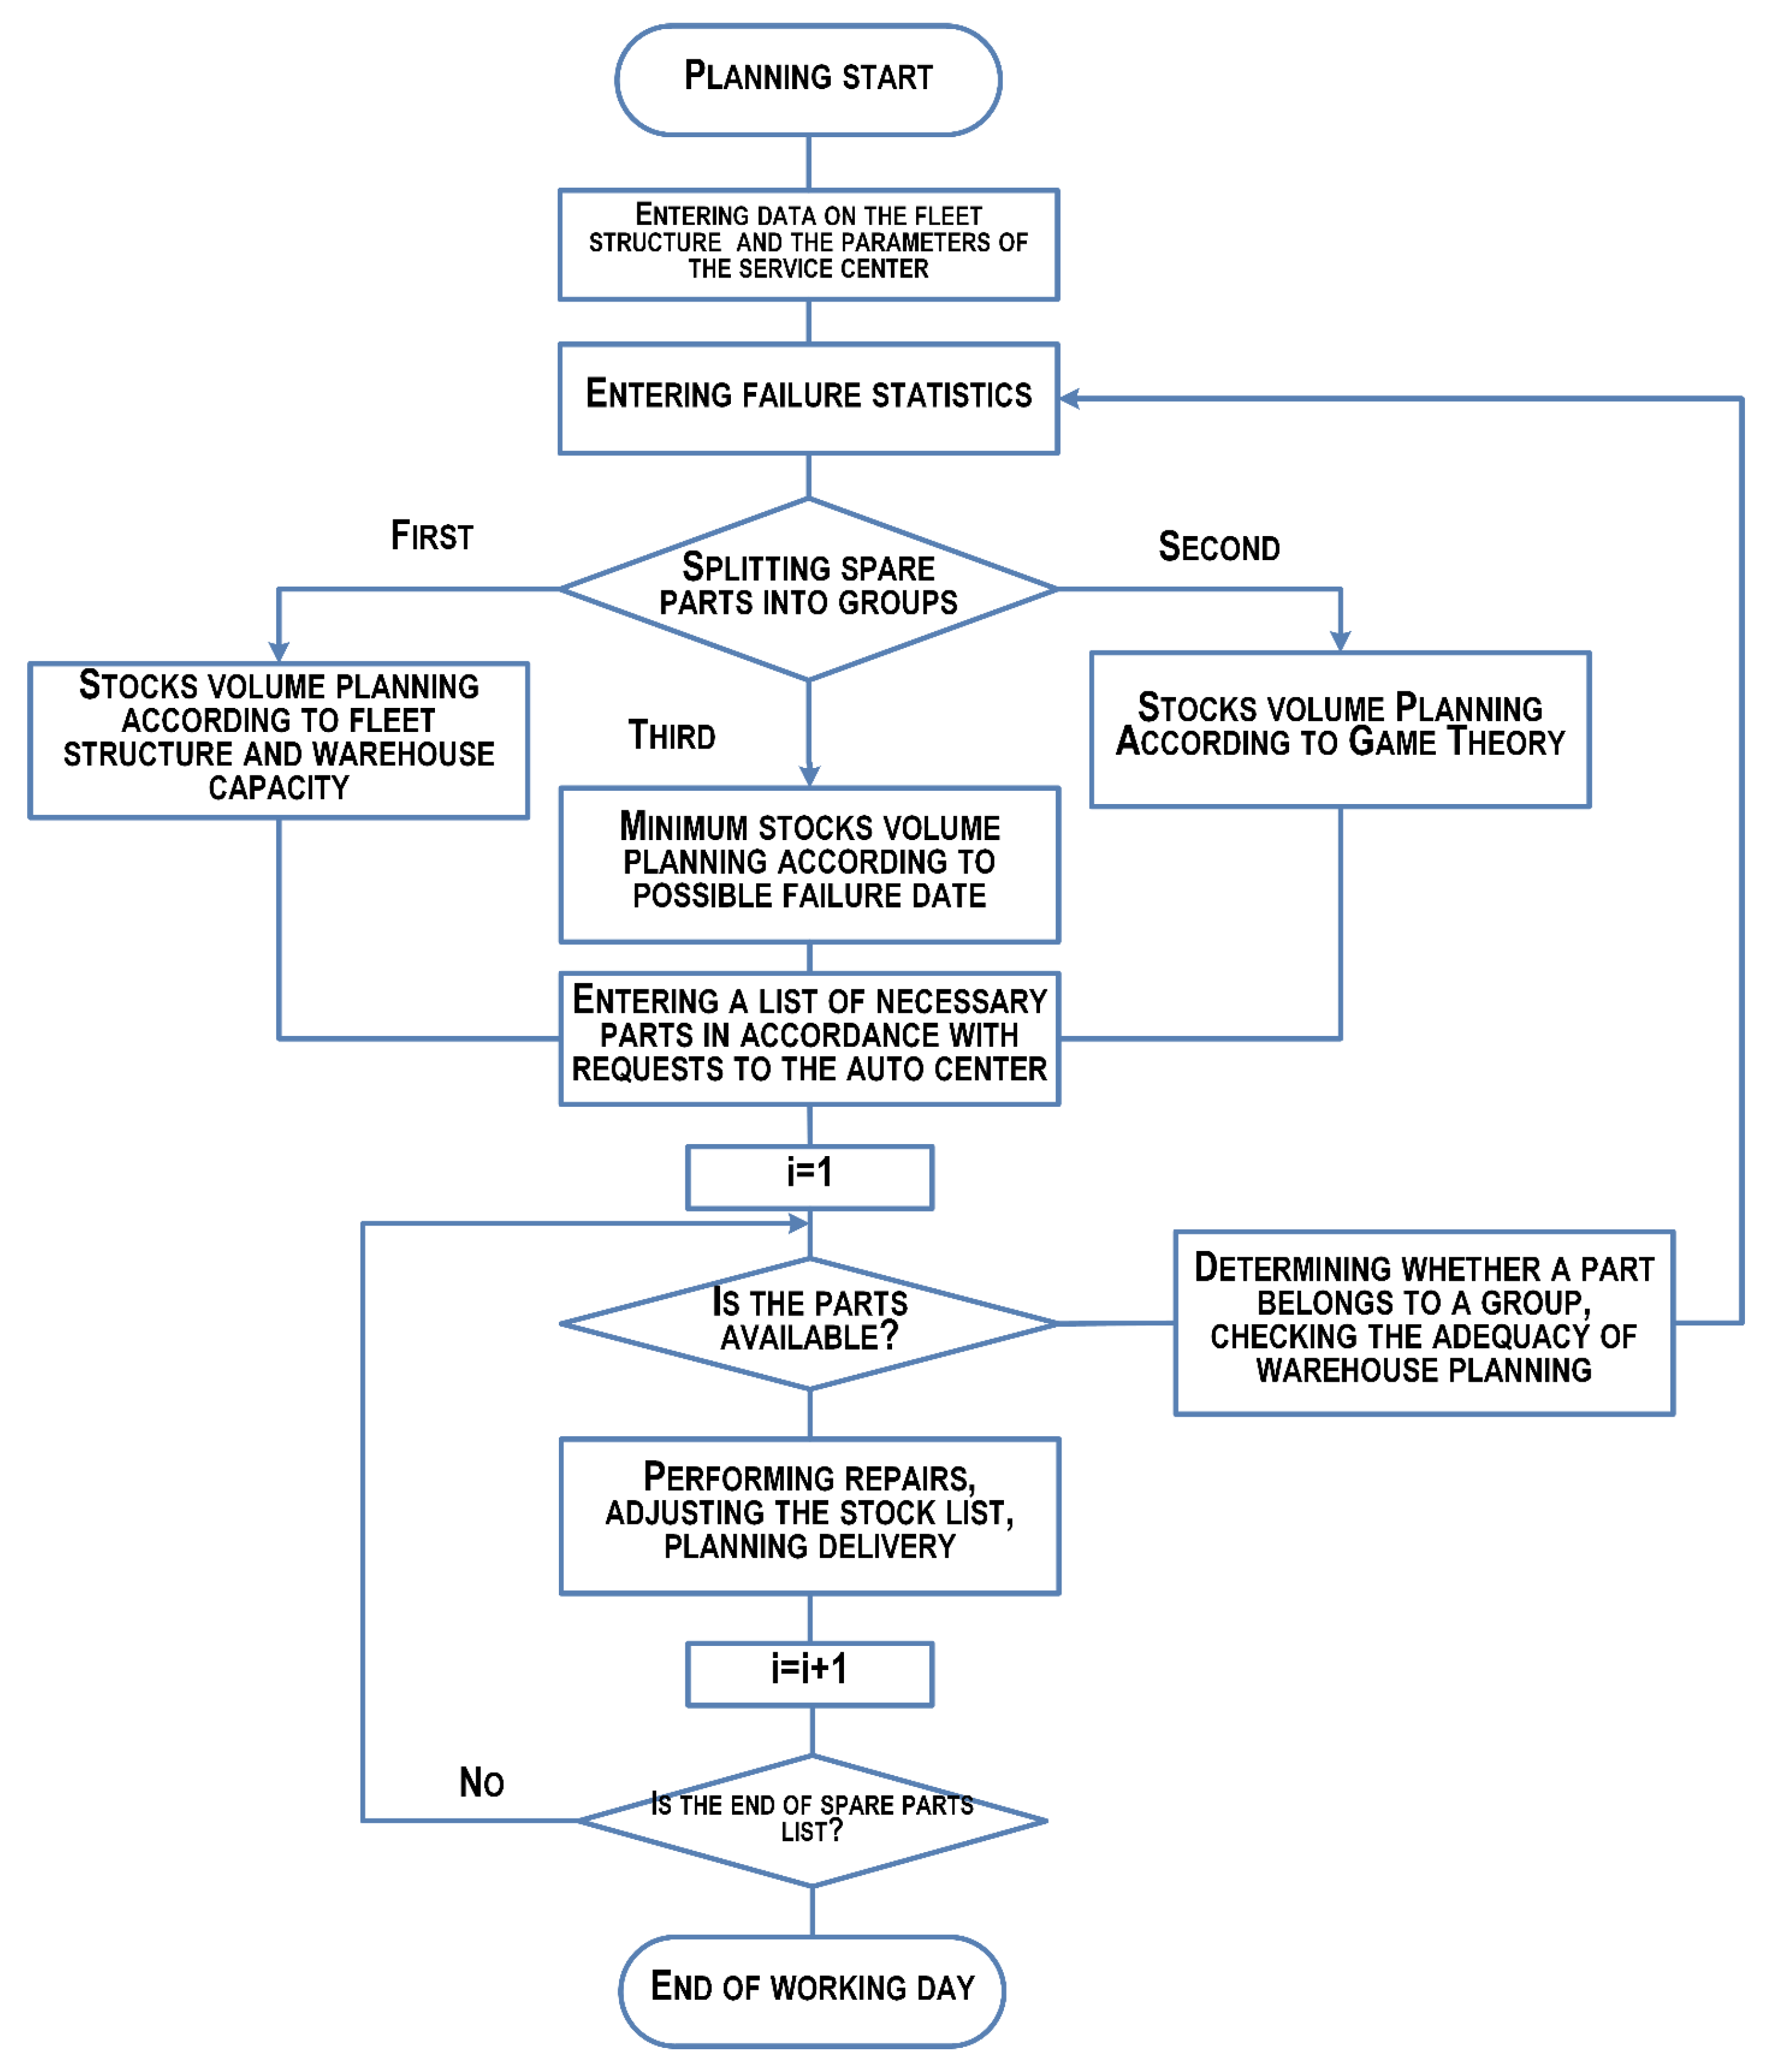
3.2.3. Feedback in the Spare Parts Supply Chain

The proposed method is also complemented by service centers’ data collecting and processing system. With continuous forecasting of the need for service centers in spare parts, a mechanism for monitoring system parameters is needed to correct trends in the process of customer service. A necessary condition is the presence of a database that is stored in the cloud storage, where data on vehicle requests from service centers of the entire branded network of an automotive enterprise are collected (Figure 1). These data are used to form samples of predicted failures for each item group. On the basis of the obtained probabilities of needs, warehouse and replenishment schedules are formed.
At the start of planning (Figure 2), data on the structure of the park and the parameters of the service center are entered.
Then, failure statistics are entered, and the entire range of parts is divided into three groups in accordance with the found failure probabilities:
  • For parts with a high probability of failure—stock planning according to the structure of the fleet and the capacity of the warehouse;
  • For parts with an average probability of failure—planning for a moderate stock in accordance with game theory;
  • For parts with a low probability of failure—planning the minimum stock according to the date of possible failure.
Next, a list of the necessary parts is entered in accordance with the requests to the auto center. If the part is in stock, then repairs are carried out, the list of availability in the warehouse is adjusted, and deliveries are planned. Otherwise, the part belongs to a group and checks the adequacy of warehouse planning.
Thus, the entire list of required spare parts is sorted out during the working shift of the service enterprise and, based on the feedback, the system for managing the circulation of spare parts in the company’s service network is verified.

4. Results

Analysis of the Needs of Service Centers for Spare Parts

To form the optimal level of stocks, we have considered the possibility of applying the described methodology to real data. Data on failures of KAMAZ trucks during the warranty period of operation were obtained by processing the statistical data of the PJSC “KAMAZ” service center based on the results of 2021. We have considered the case of making a decision under risk conditions since there were accumulated failure statistics in the database of the information system, which made it possible to calculate the probabilities of failures of spare parts. Among them, components and assemblies with the highest percentage of failure were identified (Table 6 and Table 7), including those that limit the reliability of the vehicle as a whole.
The optimal inventory size will take into account the following principles:
  • A group of spare parts with a high probability of failure means limiting reliability; thus, it is necessary to make a decision on the volumes of expedient storage, limited by the weight and size characteristics of spare parts;
  • For spare parts with medium turnover and failure probability, include moderate inventory and implement game theory methods;
  • The planning of the third group of stocks is carried out on demand or the creation of stocks in a small amount.
In this case, the maximum volume of reserves can be determined by the formula:
Z m a x = K i × V w h K r ,
where Z m a x —the maximum volume of warehouse stocks, cash units; K i —coefficient of warehouse volume utilization, depending on the type of storage,%;   V w h —storage volume, calculated as the product of storage area to the height of the warehouse minus 0.5 m to the protruding ceiling structures ;   a n d   K r —the coefficient of reduction of the appraised value into volumetric units, m.
Based on the analysis of the accumulated statistical data obtained using the information system, the probabilities of the need for starters, which relate to electrical equipment, were obtained for the delivery period (Table 8). Data on the required number of starters were grouped and the average was taken as the value used in the calculations.
We determine the consequences of a random combination of sides’ strategies. Satisfying the need for spare parts is associated with reducing vehicle downtime for repairs or retaining a clientele, which makes a profit. Excess inventory causes additional storage costs for starters (Table 9).
We determine the gain for all combinations of strategies possible in the example under consideration and summarize them in a payment matrix (Table 10).
We chose a rational strategy for production organizers Ai0. To do this, calculate the weighted average gain for each row of the payment matrix for the i-th strategy bi, and the results obtained in this way are summarized in the profit matrix (the last column of Table 11).
From the profit matrix, we choose the optimal strategy A5 (n5 = 45) that provides the maximum profit (bi) max = RUB 359,525.
The results obtained for the change in profit depending on the stock of starters in the warehouse (strategies A) are shown graphically (Figure 3).
We determine the economic effect of using the optimal strategy.
Demand for starters in stock: nc = 0.1∙5 + 0.4 ∙ 15 + 0.3 ∙ 25 + 0.1 ∙ 35 + 0.1 ∙ 45 = 22 units. The presence of twenty-two units in the warehouse corresponds as closely as possible to strategy A3, which provides an average gain of bc = RUB 256,600 (Table 11). Thus, the economic effect when using the optimal strategy is E (A5°) = 0.29 or 29%
The data shown in Table 11 allow us to draw the following practical conclusions. Firstly, the optimal strategy (A5°) was determined, following which the production organizers receive a guaranteed gain of 359,525 rubles. Obviously, the presence of 45 units in the warehouse is a given target standard for the organizers of the storage facilities of the service center. As follows from Figure 3, the reduction of the working capital is inappropriate compared to the optimal. As for the excessive increase in the working capital, here we do not observe negative trends, since the dimensions of the starter are small and do not entail large costs in organizing storage. At the same time, the shortage of starters will force the service center to organize an urgent delivery, during which the owner of the vehicle will need to provide a replacement vehicle. The latter is also associated with additional costs for the service company. It should be noted once again that strategy A5° is optimal when it is used repeatedly, which means on average for repetitive situations. For a one-time implementation, it may not be optimal. For example, with P1 (initial variant), it will have a minimum profit of RUB 18,500, and for P2, the profit will be less than when using the A2 strategy.
Secondly, a zone of a rational stock of aggregates in a warehouse has been identified, in which the enterprise is guaranteed income, which means bj > 0. Such a zone is the presence in the warehouse Pi = 15–45 starters, which corresponds to the strategies A2, A3, A4, and A5. This zone should be considered as an interval assessment of the target standard for warehouse management.
Thirdly, an instrumental base is being created to determine the amount of material incentives the enterprise organizes for warehouse management, which should be proportional to the income actually received by the enterprise from meeting the need for aggregates. Obviously, while maintaining a stock of 45 starters in the warehouse, material incentives will be maximum. If there are 35 starters in the warehouse, and then the amount of material incentives is reduced in proportion to A = RUB 359,525 − 331,030 = 28,225, and if there are 25 units in the warehouse—even more—then A = RUB 359,525 − 256,600 = 102,925. The presence in the warehouse of less than 15 may lead to a financial sanction against the organizers of the warehouse or partners (dealers and distributors).

5. Discussion

Researchers around the world and automotive companies are developing their own inventory forecasting techniques that consider various factors that affect the vehicle’s operational condition. For automotive companies, it is very important that the level of customers’ satisfaction meet their expectations, while not increasing inventory costs and related costs. Demand for spare parts is unstable, the moment of vehicles’ faults has a stochastic character, and seasonal changes also affect the formation of stocks.
Various methods are used to determine the required margin. Inventory management involves maintaining such a ratio of parts with frequent or irregular demand, so that at the same time there is a high turnover, and the cost of maintaining stocks is minimal. Most service centers use a warehouse management system based on the classical principles of inventory management, and it is relevant with an ideal logistics system and a minimum time factor. If these criteria cannot be met, service and repair times are extended, especially away from logistics centers.
In this paper, we tried to solve the problems of demand uncertainty, failure moments, and other factors and the complexity of calculations and forecasting for a warehouse with a multi-item load using game theory. We have described two cases of decision making: under conditions of risk and uncertainty, the occurrence of which depends on the amount of information about the input flow of enters to the service center. In addition, since we had access to statistics at our disposal, we were able to check the result of the calculation using the first method. Existing methods also allow for solving the problem of determining the minimum stock in the warehouse. But the volume of data that is collected from service centers is very large and it is almost impossible to process them without automation. Thus, the proposed method, in contrast to solving the problem by representing the process under consideration in the form of Markov chains, allows the use of a tabular form with subsequent automation of calculations. In addition, it allows us to consider when calculating the amount of penalties for unrepaired vehicles and the costs associated with illiquid stocks.

6. Conclusions

The growth of motorization and competition in the automotive market, the development of a branded service network of automotive enterprises, and the expansion of the model range complicate the solution of the problems of rational management and optimization of both production and service processes.
Storage of spare parts implies costs, it is required to evaluate the most optimal storage plan from an economic point of view, which applies to dynamic deterministic tasks. When planning warehouse stocks, the demand for spare parts is random and refers to the tasks of a stochastic plan. Predicting the required number of spare parts is probabilistic in nature and leads to a certain random process, which is considered in queuing systems, and risk assessment under uncertain conditions.
When planning a spare parts supply system, it must be taken into account that each part or assembly has its own level of reliability, which determines the parameters of the failure probability function and the very moment of failure. Based on the analysis of the accumulated statistical data obtained using the information system, a method for managing the volume of spare parts stored in the warehouse is proposed. As a result, the balance of costs for organizing the storage of spare parts in the warehouses of service centers and the profit received from the implementation of repair activities is minimized.

Author Contributions

Conceptualization, I.M.; methodology, I.M., P.B., L.G., E.B. and E.M.; investigation, I.M., P.B., L.G., E.B. and E.M.; resources, I.M., P.B., L.G., E.B. and E.M.; writing—original draft preparation, I.M., P.B., L.G., E.B. and E.M.; writing—review and editing, I.M., P.B., L.G., E.B. and E.M.; visualization, I.M. and P.B. All authors have read and agreed to the published version of the manuscript.

Funding

This research received no external funding.

Data Availability Statement

Not applicable.

Conflicts of Interest

The authors declare no conflict of interest.

References

  1. Makarova, I.; Khabibullin, R.; Belyaev, A.; Belyaev, E. Dealer-service center competitiveness increase using modern management methods. Transp. Probl. 2012, 7, 53–59. [Google Scholar]
  2. Ivančić, V. Improving the decision making process trought the pareto principle application. Ekon. Misao Praksa 2014, 23, 633–656. [Google Scholar]
  3. Dobbs, I. Externality, efficiency and the pareto principle. Int. Rev. Law Econ. 1981, 1, 167–181. [Google Scholar] [CrossRef]
  4. Li, J. Distributed Multi-level Inventory Algorithms for Automotive Maintenance Spare Parts Based on Centralized Control Model. Jordan J. Mech. Ind. Eng. 2020, 14, 89–99. [Google Scholar]
  5. Milicevic, R.M.; Sokolovic, V.S.; Milenkov, M.A. Repairable spare parts flow in a multi-echelon inventory system. Vojnoteh. Glas. 2016, 64, 110–129. [Google Scholar] [CrossRef] [Green Version]
  6. In 2022, Truck Accidents in Russia Occurred More Often than Others. Available online: https://iz.ru/1490483/2023-03-29/v-2022-godu-dtp-s-gruzovikami-v-rossii-proiskhodili-chashche-ostalnykh (accessed on 5 August 2023).
  7. Amirkhanova, L.; Tereshin, O. Development of a method for forecasting the volume of purchases of spare parts for the body center of a car service enterprise. News Ural. State Univ. Econ. 2010, 1, 37–42. Available online: https://cyberleninka.ru/article/n/razrabotka-metodiki-prognozirovaniya-obemov-zakupok-zapasnyh-chastey-dlya-kuzovnogo-tsentra-avtoservisnogo-predpriyatiya (accessed on 5 August 2023).
  8. Mitrofanovs, V.; Boiko, I.; Geriņš, Ē. Management of Parts and Components for Units and Assemblies in Mechanical Engineering Industry and Its Impact on the Environment. Agron. Res. 2019, 17, 1138–1145. [Google Scholar]
  9. Kim, B.; Nadzhi, S.Z.; Kuznetsov, S. Methodology for calculating the required number of reserve elements to ensure the required machinery fleets’ serviceability. In Networked Control Systems for Connected and Automated Vehicles; Springer: Cham, Switzerland, 2022. [Google Scholar]
  10. Bauer, V.I.; Mukhortov, A.A.; Kozin, E.S.; Bazanov, A.V. Providing special vehicles with spare parts in the oil-and-gas sector. In Proceedings of the International Conference Actual Issues of Mechanical Engineering 2017 (AIME 2017), Tomsk, Russia, 27–29 July 2017. [Google Scholar] [CrossRef] [Green Version]
  11. Subochev, A.; Sichko, A.; Volkov, M. Increasing the level of providing service enterprises with spare parts and materials. Mech. Agric. Conserv. Resour. 2020, 66, 63–67. [Google Scholar]
  12. Jiang, S.; Xu, F.; Fan, S.Q.; Jiang, Y.; Zhang, Y.; Chen, Y.J. Researches on Spare Parts Management of Truck Assembly Shop. Adv. Mater. Res. 2011, 403–408, 1262–1265. [Google Scholar] [CrossRef]
  13. Mehdizadeh, M. Integrating ABC analysis and rough set theory to control the inventories of distributor in the supply chain of auto spare parts. Comput. Ind. Eng. 2020, 139, 105637. [Google Scholar] [CrossRef]
  14. Wang, X. Optimization of ABC Classification Method for Automobile Spare Parts based on DEA. IOP Conf. Ser. Earth Environ. Sci. 2019, 252, 022005. [Google Scholar] [CrossRef]
  15. Ma, Z.; Wang, C.; Zhang, Z. Deep Learning Algorithms for Automotive Spare Parts Demand Forecasting. In Proceedings of the 2021 International Conference on Computer Information Science and Artificial Intelligence (CISAI), Kunming, China, 19 September 2021. [Google Scholar] [CrossRef]
  16. Fan, L.; Liu, X.; Mao, W.; Yang, K.; Song, Z. Spare Parts Demand Forecasting Method Based on Intermittent Feature Adaptation. Entropy 2023, 25, 764. [Google Scholar] [CrossRef] [PubMed]
  17. Shafi, I.; Sohail, A.; Ahmad, J.; Espinosa, J.C.M.; Lopez, L.A.D.; Thompson, E.B.; Ashraf, I. Spare Parts Forecasting and Lumpiness Classification Using Neural Network Model and Its Impact on Aviation Safety. Appl. Sci. 2023, 13, 5475. [Google Scholar] [CrossRef]
  18. Kim, J.D.; Kim, T.H.; Han, S.W. Demand Forecasting of Spare Parts Using Artificial Intelligence: A Case Study of KX Tanks. Mathematics 2023, 11, 501. [Google Scholar] [CrossRef]
  19. Jacyna, M.; Semenov, I. Models of vehicle service system supply under information uncertainty. Eksploat. Niezawodn. Maint. Reliab. 2020, 22, 694–704. [Google Scholar] [CrossRef]
  20. Basu, R.J.; Abdulrahman, M.; Yuvaraj, M. Improving agility and resilience of automotive spares supply chain: The additive manufacturing enabled truck model. Socio-Econ. Plan. Sci. 2023, 85, 101401. [Google Scholar] [CrossRef]
  21. KAMAZ Uses Additive Technologies. Available online: https://www.vestikamaza.ru/posts/na_kamaze_primenyayut_additivnye_tehnologii/ (accessed on 25 June 2023).
  22. Orgeldinger, C.; Seynstahl, A.; Rosnitschek, T.; Tremmel, S. Surface Properties and Tribological Behavior of Additively Manufactured Components: A Systematic Review. Lubricants 2023, 11, 257. [Google Scholar] [CrossRef]
  23. Delic, M.; Eyers, D.R. The effect of additive manufacturing adoption on supply chain flexibility and performance: An empirical analysis from the automotive industry. Int. J. Prod. Econ. 2020, 228, 107689. [Google Scholar] [CrossRef]
  24. Farhadi, M.; Shahrokhi, M.; Rahmati, S.H.A. Developing a supplier selection model based on Markov chain and probability tree for a k-out-of-N system with different quality of spare parts. Reliab. Eng. Syst. Saf. 2022, 222, 108387. [Google Scholar] [CrossRef]
  25. Makarova, I.; Shubenkova, K.; Buyvol, P.; Mukhametdinov, E. A software module for multi-criteria suppliers’ selection with respect to the spare parts logistics. Transp. Probl. 2020, 15, 105–116. [Google Scholar]
  26. Zheng, M.; Ye, H.; Wang, D.; Pan, E. Joint Optimization of Condition-Based Maintenance and Spare Parts Orders for Multi-Unit Systems with Dual Sourcing. Reliab. Eng. Syst. Saf. 2021, 210, 107512. [Google Scholar] [CrossRef]
  27. Ishak, A.; Wijaya, T. Rubber Spare Parts Supplier Selection Model Using Artificial Neural Network: Multi-Layer Perceptron. In Proceedings of the 2019 1st International Conference on Engineering and Management in Industrial System (ICOEMIS 2019), Malang, Indonesia, 8–9 August 2019. [Google Scholar] [CrossRef] [Green Version]
  28. Yang, K.; Yang, T.; Yao, Y.; Fan, S.-D. A transfer learning-based convolutional neural network and its novel application in ship spare-parts classification. J. Clean. Prod. 2021, 326, 129358. [Google Scholar] [CrossRef]
  29. Makarova, I.; Khabibullin, R.; Belyaev, E.; Gabsalikhova, L.; Mukhametdinov, E. Improving the Logistical processes in corporate service system. Transp. Probl. 2016, 11, 5–18. [Google Scholar] [CrossRef] [Green Version]
  30. Makarova, I.; Pashkevich, A.; Buyvol, P.; Mukhametdinov, E. Risk analysis in the appointment of the trucks’ warranty period operation. Adv. Intell. Syst. Comput. 2019, 854, 293–302. [Google Scholar]
  31. Yuksel, H.B.; Bolat, S.; Bozkurt, H.; Yucekaya, A. The Implementation of Smart Contract via Blockchain Technology in Supply Chain Management: A Case Study from The Automotive Industry in Turkey. In Proceedings of the 2021 International Conference on Artificial Intelligence and Blockchain Technology (AIBT), Beijing, China, 25–27 June 2021. [Google Scholar]
  32. Blockchain in the Automotive Industry. Available online: https://vc.ru/crypto/59207-blokcheyn-v-avtomobilnoy-industrii (accessed on 25 June 2023).
  33. Chang, S.L.; Piraveenan, M.; Pattison, P.; Prokopenko, M. Game theoretical modeling of infectious disease dynamics and intervention methods: A review. J. Biol. Dyn. 2020, 14, 57–89. [Google Scholar] [CrossRef] [PubMed] [Green Version]
  34. Smirnov, N.; Liu, Y.; Validi, A.; Morales-Alvarez, W.; Olaverri-Monreal, C. A Game Theory-Based Approach for Modeling Autonomous Vehicle Behavior in Congested Urban Lane-Changing Scenarios. Sensors 2021, 21, 1523. [Google Scholar] [CrossRef]
  35. Sadooghi, S.E.; Taleai, M.; Abolhasani, S. Simulation of urban growth scenarios using integration of multi-criteria analysis and game theory. Land Use Policy 2022, 120, 106267. [Google Scholar] [CrossRef]
Figure 1. Flow diagram (green arrows—saving raw data, blue arrows—storage exchange, purple arrows—processed data.
Algorithms 16 00388 g001
Figure 2. Algorithm for managing the spare parts supply system.
Algorithms 16 00388 g002
Figure 3. Dependence of the payoff on the strategy.
Algorithms 16 00388 g003
Table 1. Strategies of the sides.
Production (P)Warehouse Organizers (A)
Strategies Notation PjNeed Spare Parts for Repairs, njThe Probability of This Need, qjStrategy Designation, AiThere Are Serviceable Spare Parts in Stock, ni
P1n1q 1A1n1
P2n2q2A2n2
P3A3
P4A4
P5n5q 5A5n5
Table 2. Conditions for determining the winnings.
SituationsWinning in Conventional Units
PenaltiesProfit
Storage in the warehouse of one unit of actually unclaimed spare partb1-
Satisfying the need for one spare part-b2
Lack of a spare part necessary to fulfill the requirement in the warehouseb3-
Table 3. Payment matrix.
Number of Spare Parts Needed and Gain by StrategyMinimum Win by Strategies (Line Minimums)
P1P2P3P4P5
n1n2
Available number of aggregates and strategy payoffAinib11b12b1j
A1n1b21b22b2j
A2n2b31b32b3j
A3
A4
A5bi1bi2bij
Max win (column maxima) β1β2β3β4β5
Table 4. Profit matrix.
Ai (ni)Pj (nj)Average Profit with Strategy
P1
(n1 = 0)
P2
(n2 = 1)
P3
(n3 = 2)
P4
(n4 = 3)
P5
(n5 = 4)
A1 (n1 = 0)q1 b11 q2 b12q5 b1jb1
A2 (n2 = 1)q1 b21 q2 b22q5 b2jb2
A3 (n3 = 2)q1 b31 q2 b32q5 b3jb3
A4 (n4 = 3)q1 b41 q2 b42q5 b4jb4
A5 (n5 = 4)q1 b51 q2 b52q5 b5jb5
State probabilities, qiq1q2 q3q4q5
Table 5. Risk matrix.
AiPj
P1P2P3P4P5Maximum Risk at Ai (Row Maximums)
A1r11r12r1j
A2r21r22r2j
A3r31r32r3j
A4
A5
(βi)maxβ1β2β3β4β5
Table 6. Statistics of the most common failures.
Components and Assemblies of the Vehicle* Absolute Value,
** Reduced Value
Mileage, Thousand km
0–1010–2020–3030–4040–5050–6060–7070–85
Engine*1521251128675522622
**0.230.170.160.150.100.200.090.07
Transmission*906852472119149
**0.280.180.150.1360.130.1180.100.07
Electrical equipment and appliances*1361221008956382415
**0.230.210.200.170.140.130.90.06
Clutch*624229251915129
**0.290.200.1890.160.140.130.120.07
Table 7. Relative number of failures by units and assemblies per year.
Node Name,
Unit
Total Number of Failures% of Failures from the Number of Vehicles Sailed
Electrical equipment58038.6
Engine65043.3
Transmission32021.3
Clutch21314.2
Table 8. Strategies of the sides.
Production (P)Warehouse Organizers (A)
Strategies Notation, PjAverage Required Number of Starters for Repair, njThe Probability of This Need, qjStrategy Designation, AiThere Are Serviceable Starters in Stock, ni
P15 (0–9)0.1A 15
P215 (10–19)0.4A 215
P325 (20–29)0.3A 325
P435 (30–39)0.1A 435
P545 (40–50)0.1A 545
Table 9. Conditions for determining winnings.
SituationsWinning in RUB
LesionProfit
Storage in the warehouse of one actually unclaimed starter−1825-
Satisfying the need for one starter-18,250
Starter to fulfill the requirement in the warehouse−26,400-
Table 10. Payment matrix.
Required Number of Starters and Winnings by Strategies
PjP1P2P3P4P5
nj515253545
Number of starters available and winnings by strategyAini
A1591,250−172,750−436,750−700,750−964,750
A21573,000273,7509750−254,250−518,250
A32554,750255,500456,250192,250−71,750
A43536,500237,250438,000638,750374,750
A54518,250219,000419,750620,500821,250
Table 11. Profit matrix.
Ai (ni)Pj (nj)Average Profit with Strategy
P1
(n1 = 5)
P2
(n2 = 15)
P3
(n3 = 25)
P4
(n4 = 35)
P5
(n5 = 45)
A1 (n1 = 5)9125−69,100−131,025−70,075−96,475−357,550
A2 (n2 = 15)7300109,5002925−25,425−51,82542,475
A3 (n3 = 25)5475102,200136,87519,225−7175256,600
A4 (n4 = 35)365094,900131,40063,87537,475331,300
A5 (n5 = 45)182587,600125,92562,05082,125359,525
State probabilities, qi 0.10.40.30.10.1
Disclaimer/Publisher’s Note: The statements, opinions and data contained in all publications are solely those of the individual author(s) and contributor(s) and not of MDPI and/or the editor(s). MDPI and/or the editor(s) disclaim responsibility for any injury to people or property resulting from any ideas, methods, instructions or products referred to in the content.

