Article

A Machine Learning Approach to Identifying Risk Factors for Long COVID-19

School of Medicine, Bond University, Robina, QLD 4226, Australia
*
Author to whom correspondence should be addressed.
Algorithms 2024, 17(11), 485; https://doi.org/10.3390/a17110485
Submission received: 30 September 2024 / Revised: 18 October 2024 / Accepted: 25 October 2024 / Published: 28 October 2024
(This article belongs to the Special Issue Advancements in Signal Processing and Machine Learning for Healthcare)

Abstract

:
Long-term sequelae of coronavirus disease 2019 (COVID-19) infection are common and can have debilitating consequences. There is a need to understand risk factors for Long COVID-19 to give impetus to the development of targeted yet holistic clinical and public health interventions to reduce its associated healthcare and economic burden. Given the large number and variety of predictors implicated spanning health-related and sociodemographic factors, machine learning becomes a valuable tool. As such, this study aims to employ machine learning to produce an algorithm to predict Long COVID-19 risk, and thereby identify key predisposing factors. Longitudinal cohort data were sourced from the UK’s “Understanding Society: COVID-19 Study” (n = 601 participants with past symptomatic COVID-19 infection confirmed by serology testing). The random forest classification algorithm demonstrated good overall performance with 97.4% sensitivity and modest specificity (65.4%). Significant risk factors included early timing of acute COVID-19 infection in the pandemic, greater number of hours worked per week, older age and financial insecurity. Loneliness and having uncommon health conditions were associated with lower risk. Sensitivity analysis suggested that COVID-19 vaccination is also associated with lower risk, and asthma with an increased risk. The results are discussed with emphasis on evaluating the value of machine learning; potential clinical utility; and some benefits and limitations of machine learning for health science researchers given its availability in commonly used statistical software.

1. Introduction

The acute manifestations of coronavirus disease 2019 (COVID-19) infection have been well established since the 2019 pandemic; long-term complications affect millions of people globally but are yet ill defined. Several names have been adopted for these sequelae including Long COVID-19, post-COVID-19 condition or syndrome, and Long Haul COVID-19 [1,2,3].
Long COVID-19 is a largely poorly understood clinical entity wherein relatively non-specific symptoms occur or persist after acute COVID-19 infection, akin to a post-viral syndrome. Several studies have attempted to define it, leaving a few accepted definitions by major institutions including World Health Organisation (WHO) and National Institute for Health and Care Excellence (NICE). Most definitions outline the following parameters for their criteria, exemplified below by excerpts from the WHO definition that was used to code Long COVID-19 in the tenth edition of the International Classification of Diseases (ICD-10):
(i)
Past COVID-19 infection: history of probable or confirmed COVID-19 infection;
(ii)
Onset of symptoms: usually three months from onset of COVID-19 symptoms;
(iii)
Duration of symptoms: symptoms lasting for at least two months;
(iv)
Diagnosis of exclusion: symptoms cannot be explained by alternative diagnoses [1,2,3,4].
There are a plethora of symptoms involving multiple systems which may be experienced, including fatigue, joint and muscle aches, flu-like or respiratory symptoms and neurological disturbances [5,6]. Some definitions also further characterise the condition by describing how symptoms may persist following acute infection or new symptoms may develop, symptoms may fluctuate with time, and symptoms typically cause a level of functional impact [2,4].
The first reports of Long COVID-19 emerged early in the pandemic in 2020. Estimates of prevalence vary significantly among studies, largely due to the lack of a strict definition of Long COVID-19, particularly with studies differing in onset of Long COVID-19 symptoms following acute COVID-19 infection [3,7]. A review by the Australian Institute of Health and Welfare demonstrated an estimated 5% to 10% prevalence of Long COVID-19 in Australia, with prevalence among global data ranging from 9% to 81% [7]. Whilst the exact prevalence is unknown, the consensus in the literature is that Long COVID-19 has likely impacted an extensive portion of the population, having an incidence of approximately 10% among COVID-19 cases [1,5]. The prevalence of Long COVID-19 among COVID-19 cases has also been shown to be greater than that of other post-viral syndromes following non-COVID-19 respiratory infections [8]. Furthermore, Long COVID-19 has been associated with increased morbidity and decreased quality of life [1,9], as well as increased financial burden for patients and healthcare systems due to the subsequent long-term management and follow-up required [7]. Complete recovery is also uncommon, with up to 85% of patients reporting symptoms persisting past one year [1,5].
With the potential for such a significant long-term impact, understanding risk factors for developing Long COVID-19 is thus key in facilitating risk stratification of patients, which can guide management and preventative measures to reduce associated morbidity and healthcare burden. Thus far, risk factors are likewise largely ill-defined, with those that are well established in the literature being primarily demographic and clinical in nature.
Several studies including two large meta-analyses in 2023 and 2024 have demonstrated strong evidence for two of the most consistently identified risk factors for Long COVID-19: female sex and middle age (between 40 and 65 years, approximately). Other high-risk groups include those with underlying comorbidities such as asthma and diabetes, their associated risk factors such as smoking and obesity, as well as mental health conditions. A history of severe acute COVID-19 infection with a high symptom burden or requiring hospital or ICU admission has also been found to place patients at higher risk of Long COVID-19 [5,7,8,10,11]. Interestingly, a protective effect has been observed for COVID-19 vaccination and the use of antiviral medication for acute infection [7,10,12]. A lower risk of Long COVID-19 has also been reported with the recent Omicron COVID-19 variant and greatest risk with the earliest variants [5,7,13]; whilst this has typically been observed in association with the effect of vaccination, there is some evidence for its effect independent of vaccination timing [11].
Studies have also begun exploring social risk factors for developing Long COVID-19; however, data in this domain are much less robust as compared to those for acute COVID-19. There is emerging evidence for lower socioeconomic status and certain minority ethnic groups including Hispanic, African American and mixed ethnicity being associated with an increased risk of Long COVID-19 [5,7,11,14]. However, the literature at present is conflicting, highlighting the need for further investigation; an analysis of 10 UK longitudinal studies, for example, demonstrated similar findings for demographic and clinical risk factors but no association with socioeconomic status and lower risk of Long COVID-19 in minority ethnic groups and lower education levels [15].
Much of the existing literature that examines risk factors for Long COVID-19 analyses electronic health record or online cohort data to discover differences in baseline characteristics and associations by logistic regression and other statistical analyses; studies that utilise machine learning to develop predictive models are few. One US study that utilised XGBoost machine learning techniques to identify predictors for Long COVID-19 using electronic health record data reported similar findings to the literature with the most significant predictors in the model being middle age, having common chronic health conditions, and markers of severe acute infection [16]. The findings of two similar studies, one employing both logistic regression and random forest analysis on electronic health record data, and another utilising a gradient boosting classifier on healthcare data from German primary care centres, yielded similar predictors [17,18]. Such studies hold promising prognostic value that can support clinical decision-making; expanding to include sociodemographic predictors can also influence targeted public health interventions.
This study thus aimed to produce a machine learning algorithm to identify key risk factors for Long COVID-19 in a community-based sample from which a broad and detailed set of potential health-related and sociodemographic factors can be analysed.

2. Methods

2.1. Sample and Inclusion Criteria

The study sample was derived from the UK’s “Understanding Society: COVID-19 Study”, sourced from the UK Data Service [19,20]. It contains detailed health, relationship and socioeconomic information in relation to COVID-19 collected from household web-based or telephone surveys between April 2020 and September 2021 as part of a broader longitudinal cohort study.
There was a total of 20,427 study participants aged 16 and over living in the UK; data for younger children were available but deemed outside of the scope of this study. As there were multiple datasets representing each wave of survey data collected, these were merged to create a single dataset. To reflect the definition of Long COVID-19, which requires past COVID-19 infection, only participants who were positive upon this study’s serological testing were included. Participants with negative results and missing values were excluded, reducing the sample size to 1040.

2.2. Features (Variables)

The outcome variable in this study was whether the participant had Long COVID-19. In the survey, this was measured as whether respondents who had previously reported having COVID-19 symptoms reported a return to their baseline level of health or were experiencing ongoing symptoms. As such, participants who had not previously reported COVID-19 symptoms were excluded, yielding the final dataset, a subset of the total cohort with a sample size of 601. As the Long COVID-19 variable was first included in the November 2020 survey wave, the previous wave being in September 2020, ongoing symptoms had to have been present for a minimum of two months. As aforementioned, participants without positive serology for COVID-19 were excluded from the final dataset, thereby eliminating the possibility of those who reported having symptoms of COVID-19 without having evidence of infection being captured as having Long COVID-19 and affecting the results. Therefore, the outcome variable in this study reflects participants in the UK aged 16 and over with past symptomatic COVID-19 infection experiencing ongoing symptoms for a minimum of two months.
Predictor variables were considered for inclusion in the final model based on a review of the literature surrounding risk factors for developing Long COVID-19. Variables were excluded if their incidence was low in the sample dataset. In particular, some comorbidities were excluded from the total pool of variables for the model if their incidence was less than 50 in the full dataset. Seventy-five predictors were selected for inclusion in the total pool of variables, relating to respondent demographics, long-term health comorbidities, lifestyle choices and markers of socioeconomic status. Variable coding for categorical variables can be found in Supplementary Materials Tables S1 and S2. Missing values were mitigated by assigning missing responses and responses such as “inapplicable” a value of 0, and these were excluded from the final model. Two-way or higher interaction terms were not added to the model, as there was no a priori reason for including specific interactions, and including all two-way interactions would result in too many features given the study’s sample size.

2.3. Data Analysis

JASP 0.17.2.0 [21] was used to perform descriptive statistics on the final predictor variables. Random forest analysis was selected as the optimal machine learning approach and performed using JASP. Random forest was selected after weighing the merits of different approaches. These included logistic regression, K-Nearest Neighbours and Support Vector Machine classification, all of which are classifiers that can include a mix of categorical and continuous predictors. Random forests appeared to offer an ideal trade-off between accuracy and interpretability for our question, given that we were interested in both creating an algorithm with high sensitivity and identifying important features. In addition, interpretability was aided by creating two-way plots for the features identified as most important in predicting Long COVID-19.
The dataset was split into training and test subsets. Optimising for recall (sensitivity), 29 predictors were ultimately included in the final algorithm through analysis of feature importance. The model’s performance was interpreted using recall and additional metrics including precision, validation and test accuracy, F1 score and area under the receiver operating characteristic curve (AUROC). Out-of-bag (OOB) accuracy was used to assess overfitting in the model. Plots to demonstrate the direction of effect of the most important predictors were generated using Stata 16.1.

2.4. Sensitivity Analysis

Sensitivity analysis was carried out, relaxing the inclusion criterion of receipt of a positive serology test. The sensitivity analysis included all individuals who experienced COVID-19 symptoms during the study period. This led to a larger sample size for analysis but may have included cases in which symptoms were due to another illness, such as Influenza. However, given the availability of rapid antigen COVID-19 testing, it is likely that most cases would represent COVID-19 rather than other infections.

3. Results

3.1. Descriptive Statistics

Table 1 below outlines the descriptive statistics performed using JASP for the most significant predictor variables in the random forest classification model. Results for the remainder of the variables included in the algorithm are shown in Table S1.
Examining the data more closely, 440 out of 601 participants (approximately 73%) in this study reported experiencing Long COVID-19 symptoms. The cohort appears to be representative of a largely middle-aged adult population-based cohort with a mean age of approximately 48–50 years, standard deviation of 14 and relatively wide range from 17 to 83. Comparing the maximum ages between those who did and did not report having Long COVID-19, the oldest age group in the cohort (78–83 years) all notably reported having Long COVID-19. Timing of acute COVID-19 infection corresponds to which of the nine survey waves of the longitudinal study the participant reported having acute COVID-19 infection in, outlined in further detail in Table S2. Participants who had Long COVID-19 typically reported acute COVID-19 infection earlier in the pandemic compared to those who did not have Long COVID-19, given the mean values of 5 and 7, which correspond to the September 2020 and January 2021 survey waves, respectively. The vast majority of the cohort did not have uncommon chronic health conditions at baseline, with the proportion of those having uncommon conditions being approximately three-fold lower in those who reported Long COVID-19 compared to those who did not (relative frequency of 6% and 18%, respectively). Furthermore, approximately 87% of participants who did not have Long COVID-19 reported feeling lonely only sometimes or never compared to 96% of those who had Long COVID-19, suggesting that feeling lonely often was not prevalent amongst the cohort, but was, however, more common amongst those who did not report Long COVID-19. The average number of hours worked per week was approximately 22–24, with considerable variability amongst the cohort given the relatively wide range from 0 to 78 h per week and the standard deviation of approximately 19. Similar to the findings for age, by comparing maximum values, the highest number of hours worked per week in the cohort (61–78) was in the group that had Long COVID-19. Lastly, financial security on a scale of 0–100% was the only predictor with a significant number of missing values (26). With averages of 7% and 11% in those who did and did not report Long COVID-19, respectively, it can be inferred that whilst relatively similar, self-perception of financial security was slightly lower in those who had Long COVID-19.

3.2. Model Results

Table 2 shows the data split for the random forest classification model into training (n = 327), validation (n = 82) and test (n = 102) subsets, with a total of 94 trees with five features per split. The accuracy of the validation subset was 0.780 and 0.892 in the test subset. The OOB accuracy was 0.962.
The confusion matrix, shown below in Table 3, indicates the model correctly predicted 74 Long COVID-19 cases, with 9 misclassifications of Long COVID-19 cases as No Long COVID-19. Conversely, it correctly predicted 17 negative cases with 2 misclassifications. Using these values, the calculated sensitivity of the model is excellent at 97.4%, with a low specificity of 65.4%. These values are also displayed in Table 4 below.
The evaluation metrics table (Table 4) demonstrates the overall performance of the model. The model was optimised for recall, ultimately achieving a value of 0.974. Precision and accuracy were both 0.892, the F1 score was 0.931 and the Matthews correlation coefficient for the model was 0.702.
Figure 1 shows the receiver operating characteristic (ROC) plot for the model. In addition, the area under the ROC curve from Table 4 above is 0.791.
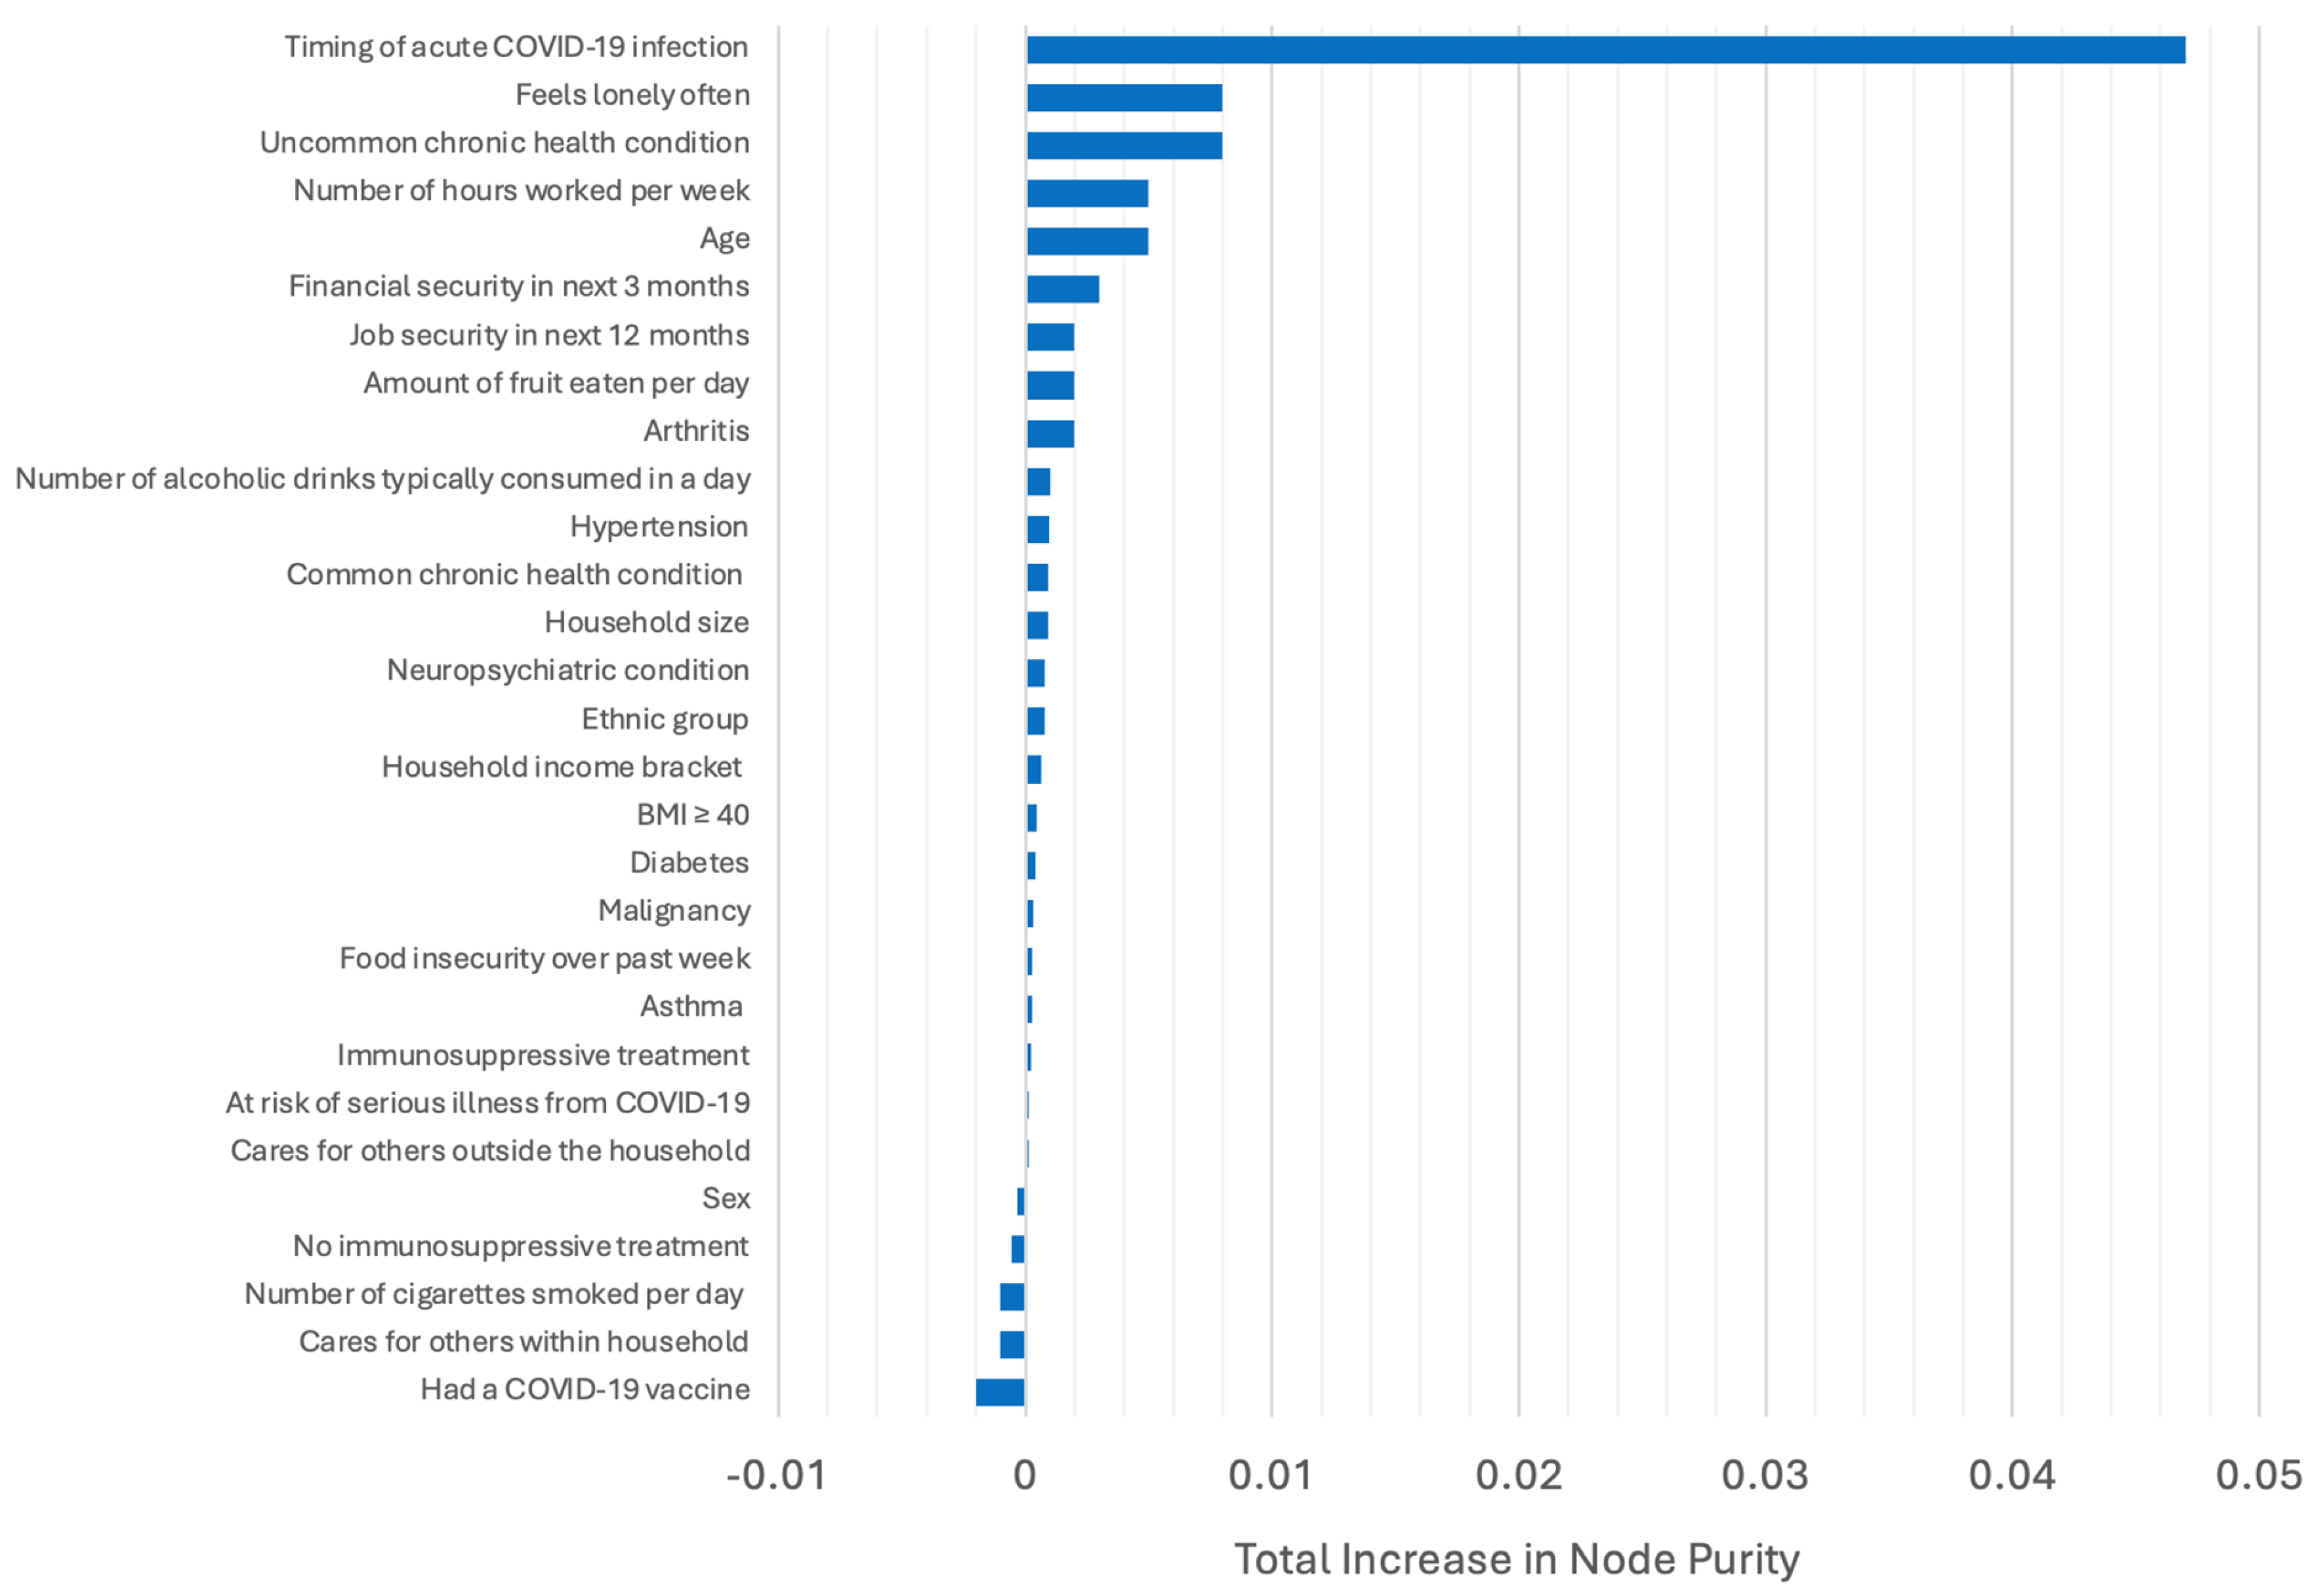
Table 5 identifies the predictor variables from most to least important in the classification model, displaying the total increase in node purity and mean decrease in accuracy for each predictor. The total increase in node purity for each predictor is also illustrated in Figure 2 below. Timing of acute COVID-19 infection had the greatest total increase in node purity (0.047), followed by loneliness (0.008), having an uncommon chronic health condition (0.008), hours worked per week (0.005), age (0.005) and financial security (0.003).
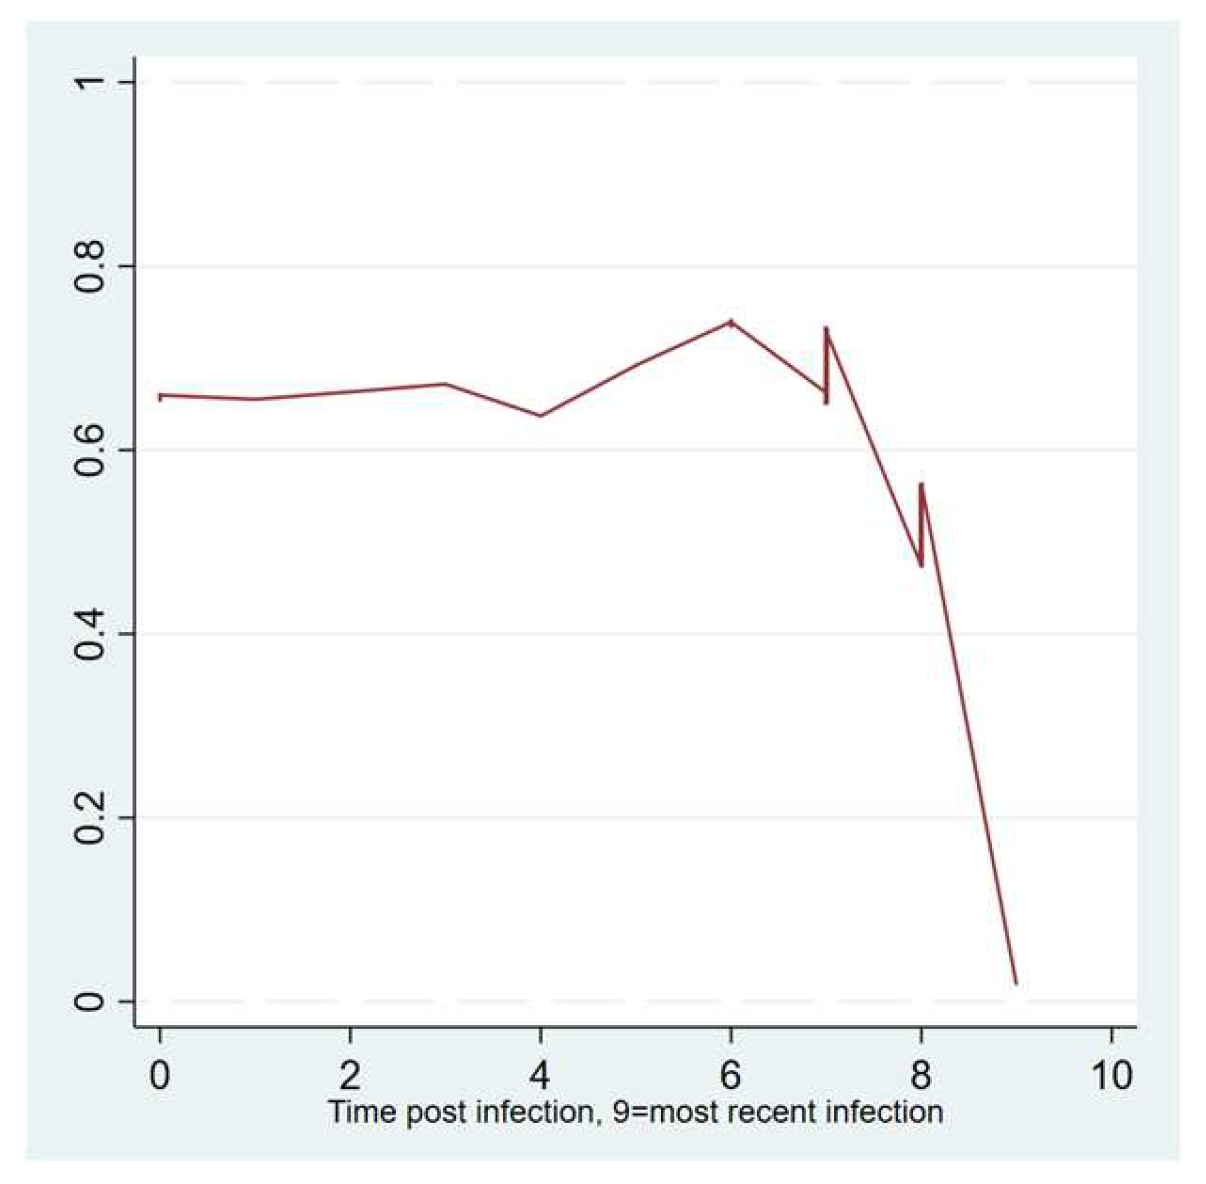
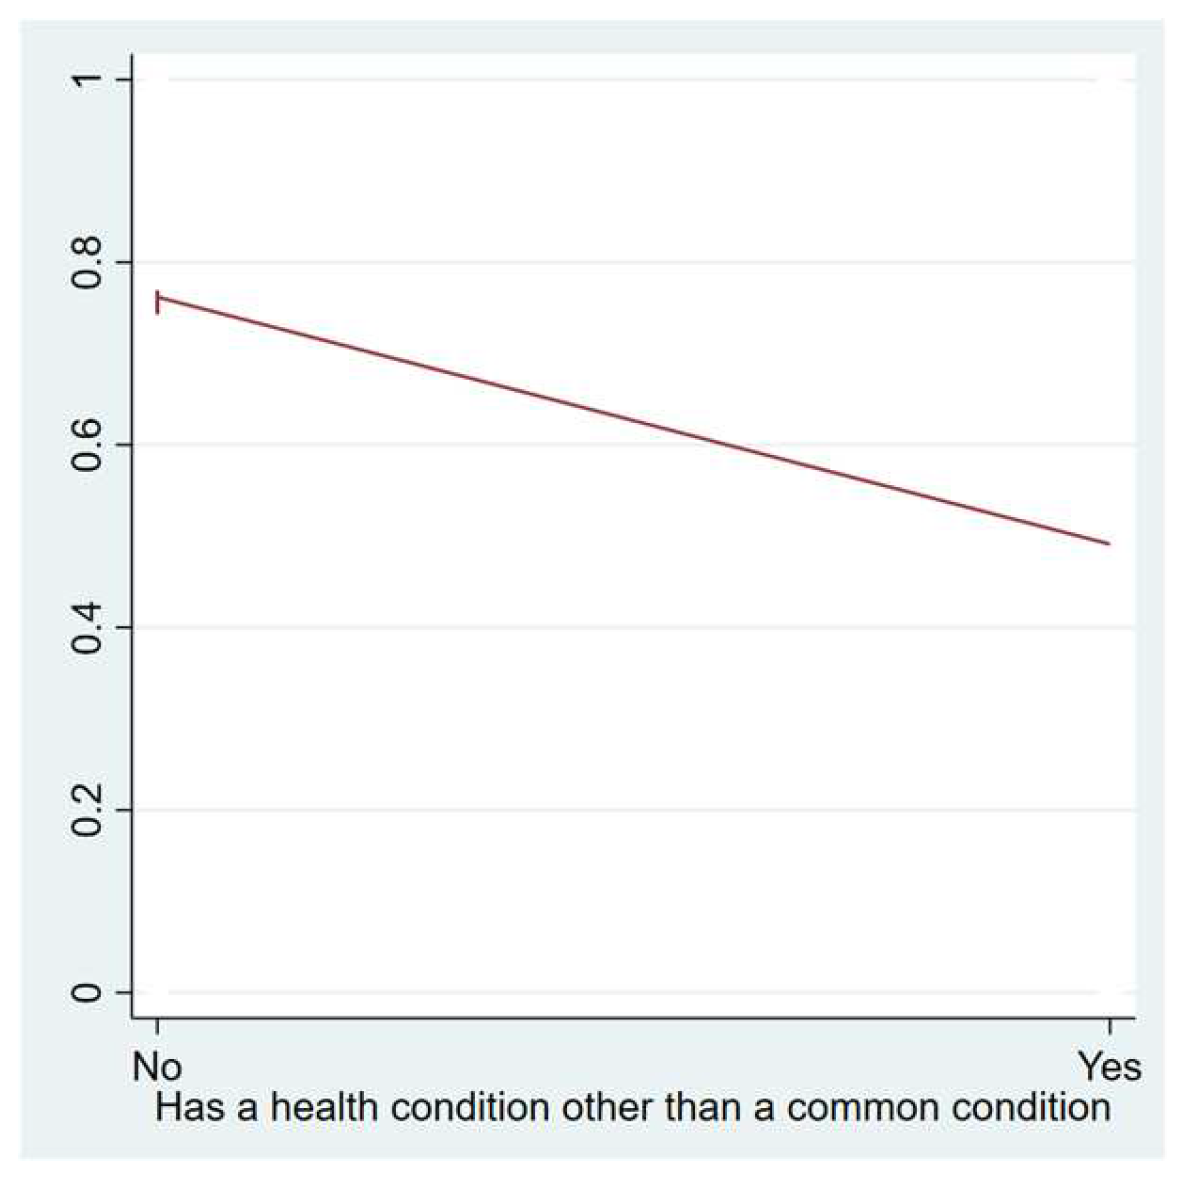
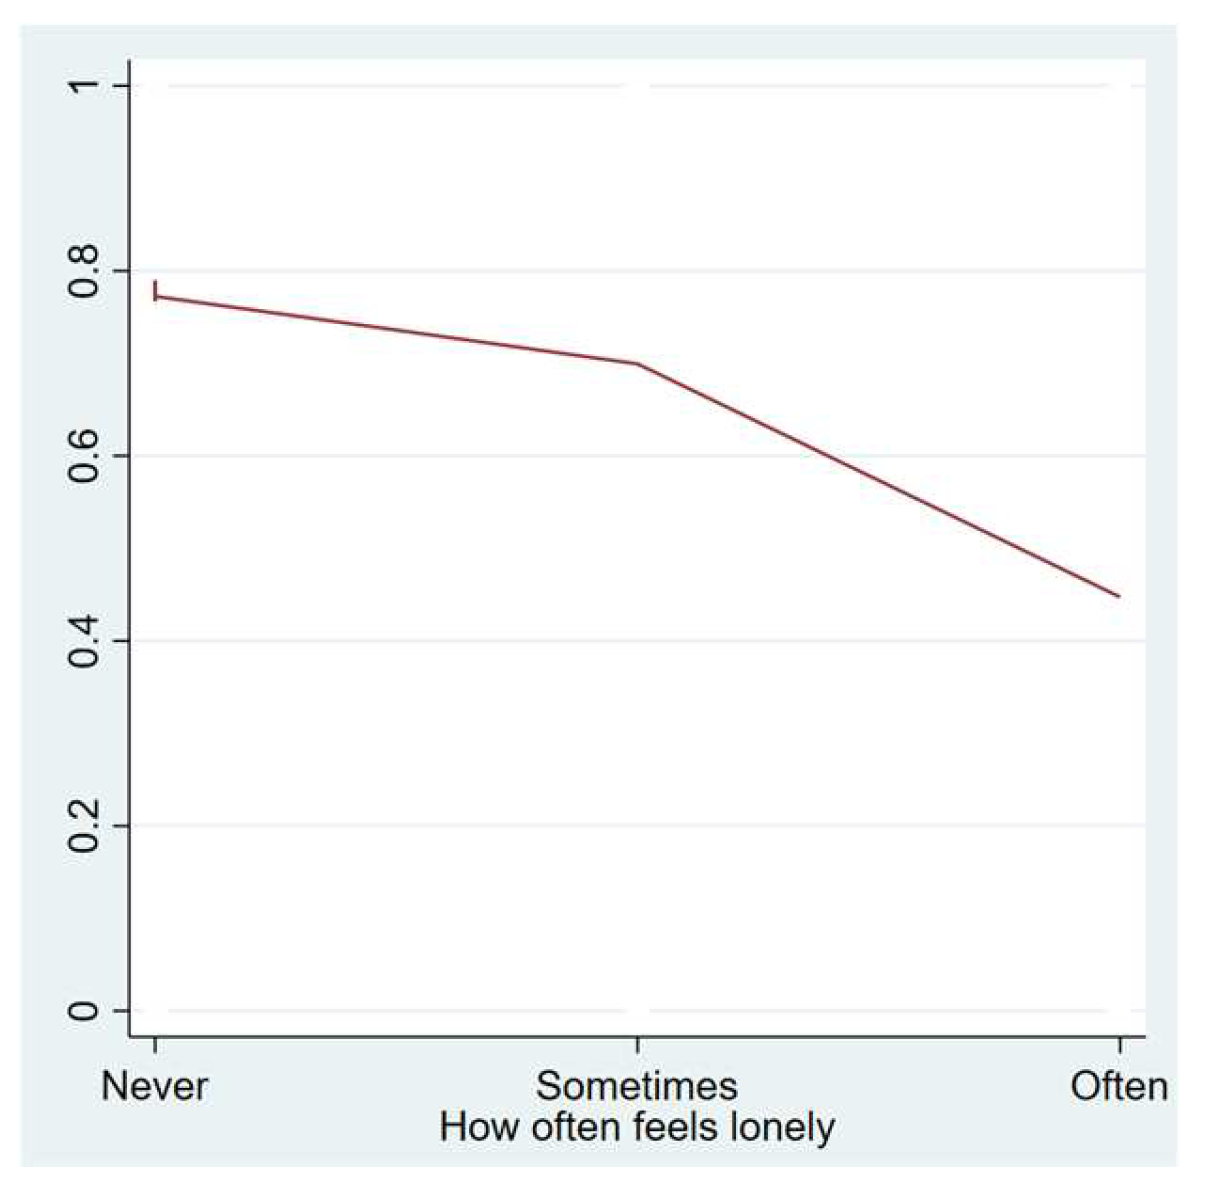
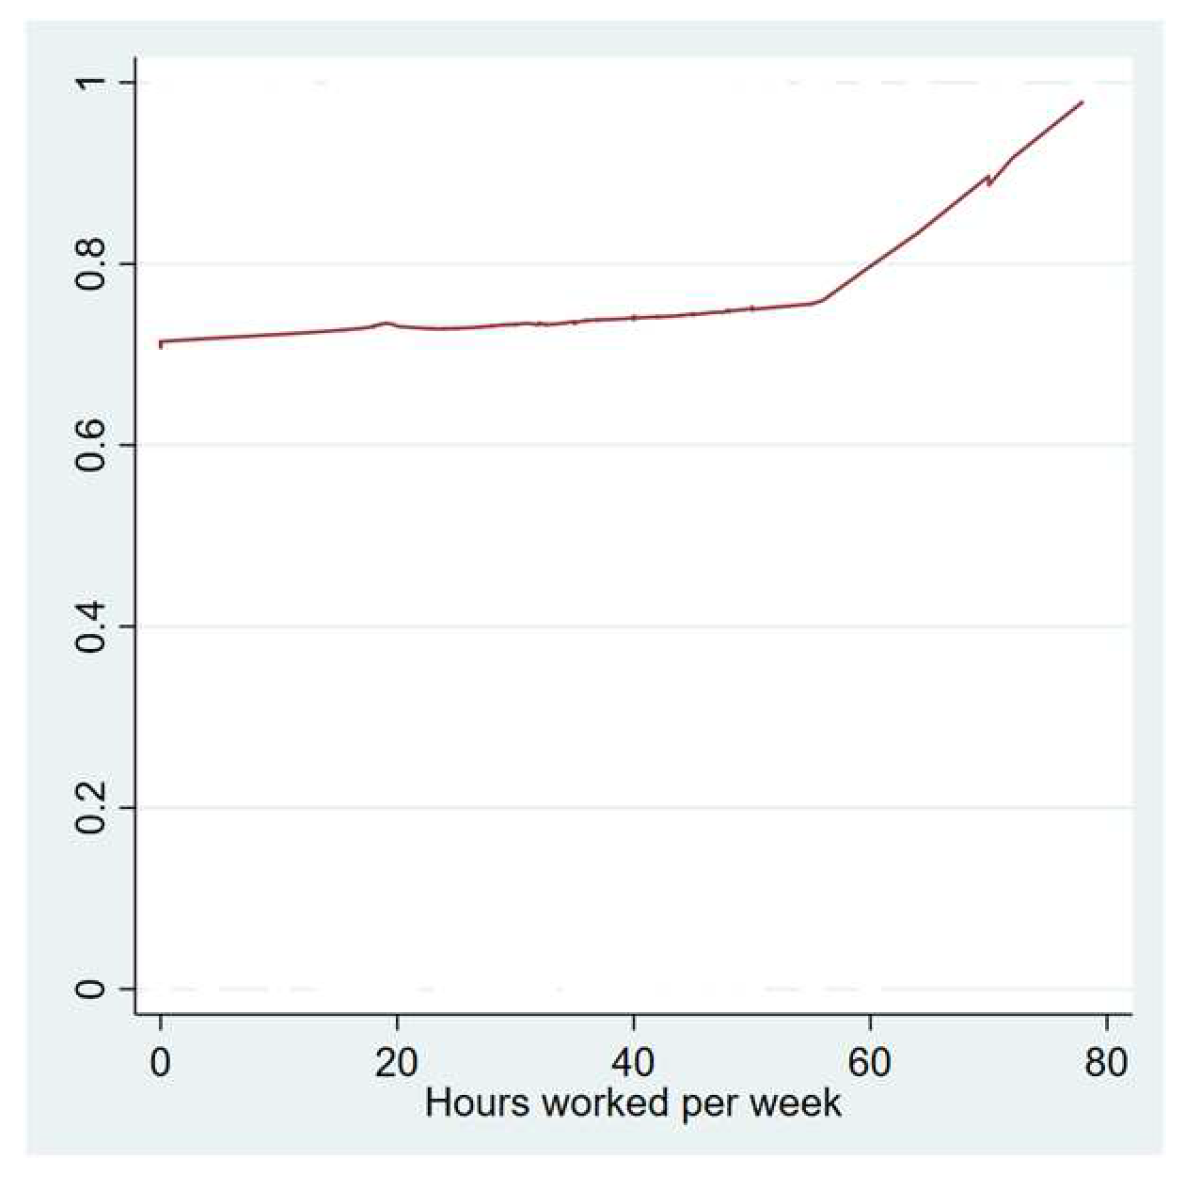
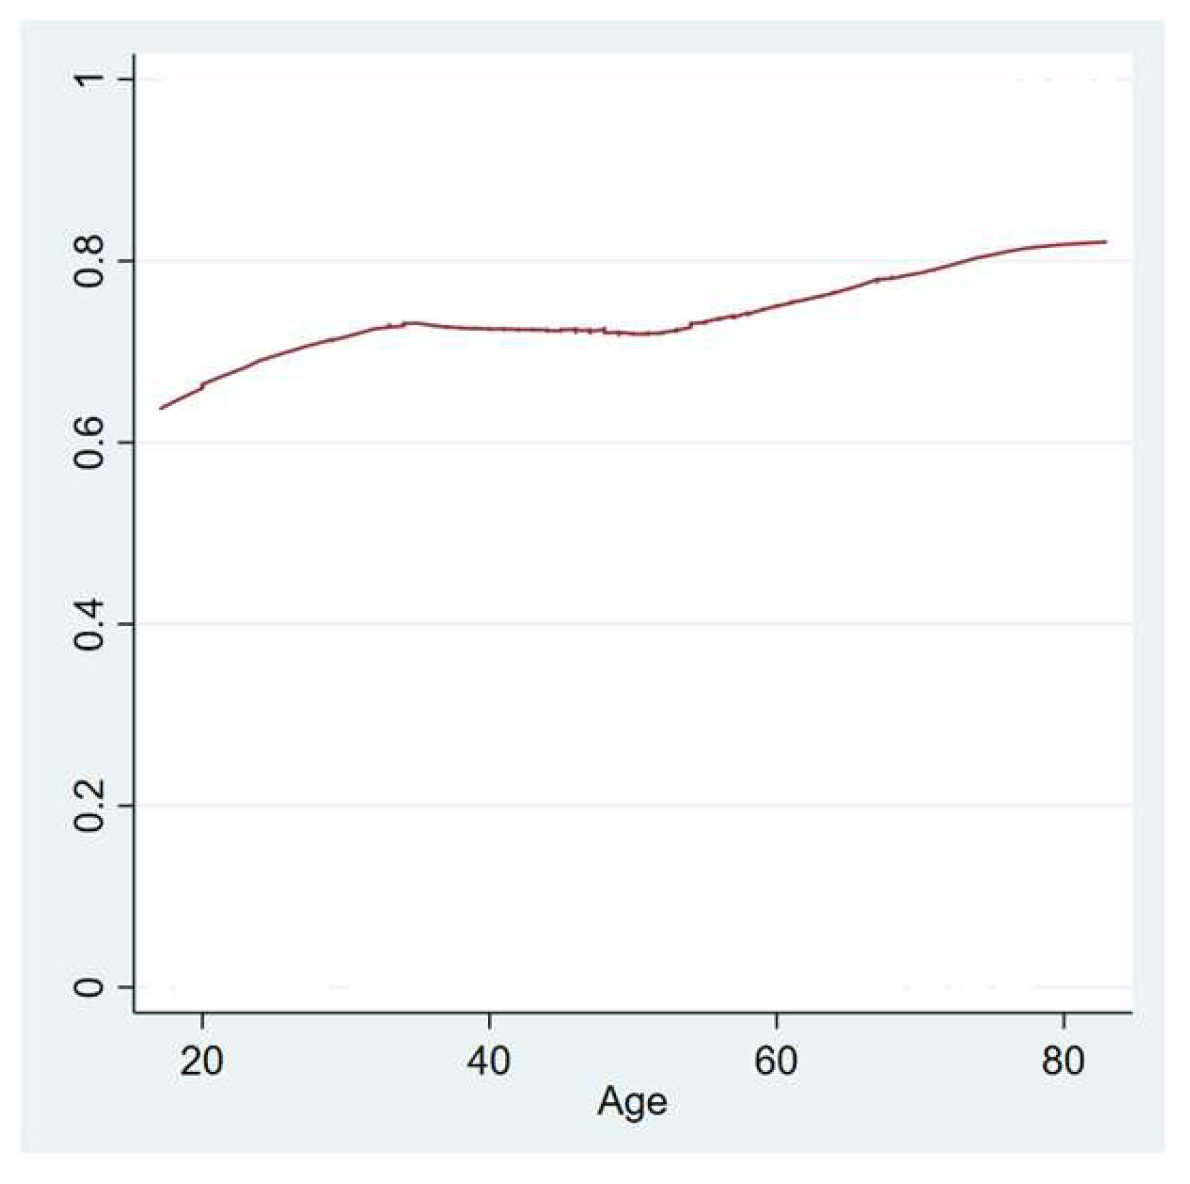
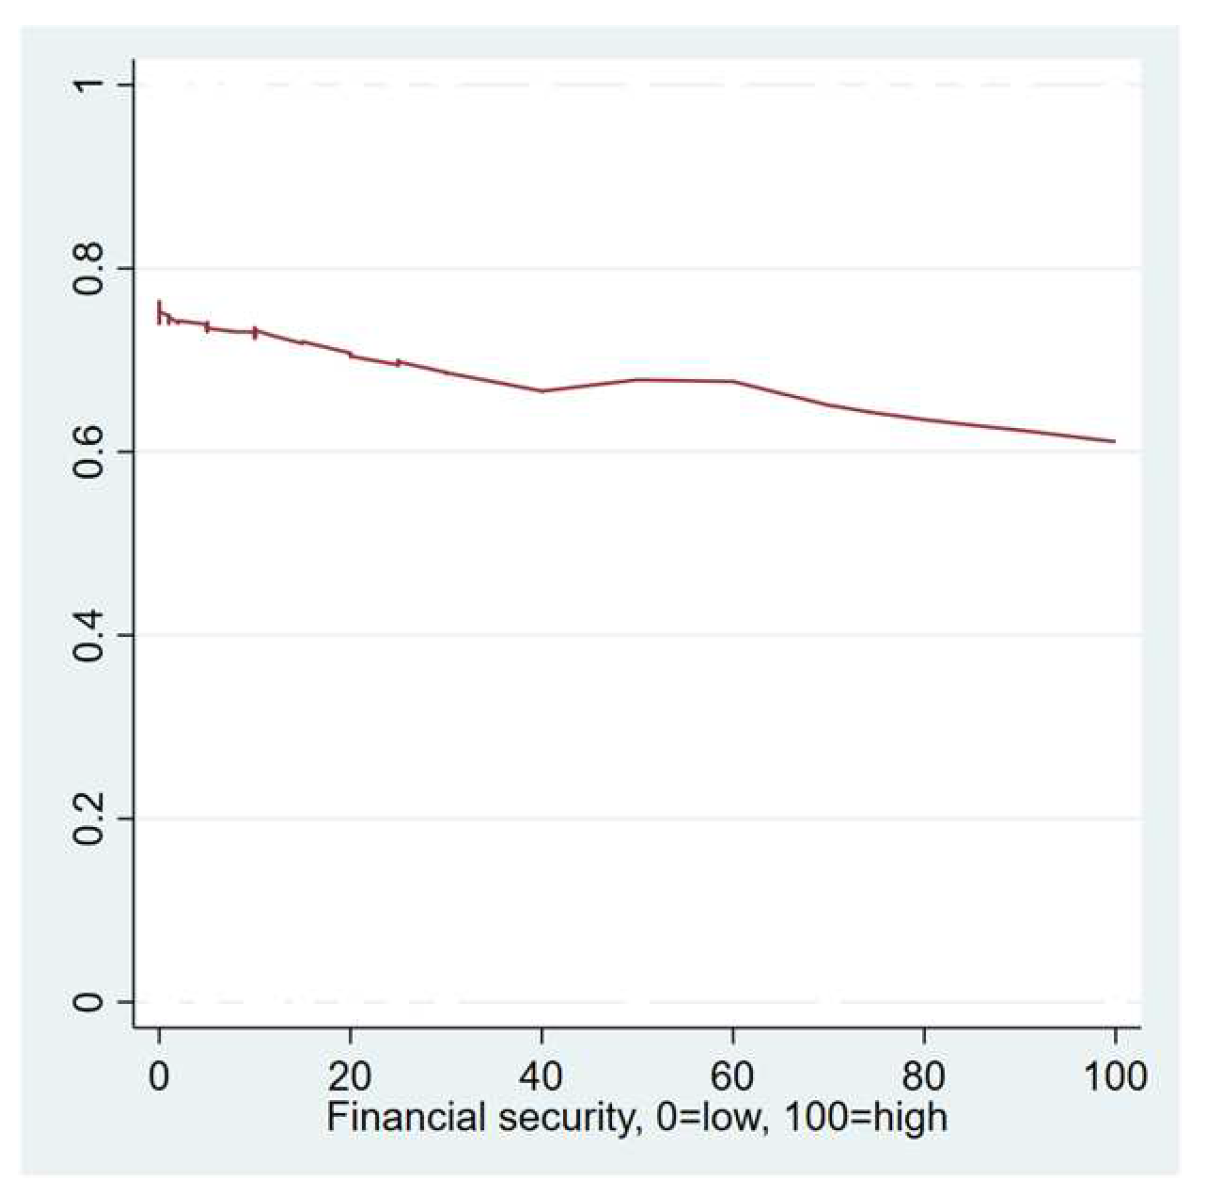
Figure 3, Figure 4, Figure 5, Figure 6, Figure 7 and Figure 8 are plots illustrating the proportion of the sample reporting one or more Long COVID-19 symptoms on the y-axis for predictors with the highest increase in node purity in the model.

3.3. Sensitivity Analysis Results

Sensitivity analysis was carried out to determine whether the results changed substantially without the limitation on sample size imposed by including only cases with definitive evidence from serology test results that they had COVID-19. Of particular interest is whether a different group of features becomes important with a larger sample size, which if true would call into question the main study’s repeatability. For all participants who reported having COVID-19 symptoms, the sample size for analysis was 1997. With the increased sample size, the sensitivity of the random forest algorithm was 1.00, and the specificity was 0.879. Table 6 displays node purity scores of the most important features, and their rank in the main analysis for ease of comparison. While many of the most important features in the main analysis remained important in the sensitivity analysis, two lifestyle variables and presence of uncommon health conditions did not have high importance scores in the sensitivity analysis. Vaccination and asthma had much higher importance scores in the sensitivity analysis than in the main analysis.

4. Discussion

The random forest model in this study demonstrated good performance in classifying the dataset as per the outcome variable of Long COVID-19, identifying key clinical and sociodemographic risk factors for the condition. The model can thus serve as a generalisable tool with prognostic value that can inform clinical and public health decisions. However, limitations of this study and gaps in the existing literature indicate the need for further research.

4.1. Model Performance

Optimised for recall, the model ultimately demonstrated high performance, as evidenced by its recall of 0.974 and other accuracy metrics including a precision of 0.892, an excellent F1 score of 0.931 and AUROC of 0.791 (Table 4). These results are comparable to the few published risk prediction models for Long COVID-19 [16,17,18]. The OOB accuracy in Table 2 estimates the model’s performance on unseen data by evaluating each tree on the instances not included in its bootstrap sample. Notably, the model yielded an exceptional OOB accuracy of 0.962, demonstrating its robustness and generalisability due to its low susceptibility to overfitting. Furthermore, the Matthews correlation coefficient of 0.702 reinforces the model’s predictive power, even in the presence of class imbalance. The model achieved a high sensitivity (97.4%) yet a poor specificity (65.4%), as reported in Table 4. This indicates that the model performs better as an exclusion tool as it accurately identifies positive cases of Long COVID-19 with minimal false negatives. Overall, the results suggest that this model is accurate, reliable and generalisable as a risk prediction tool, with clinical utility in risk stratification, particularly in identifying those who are at low risk of developing Long COVID-19.

4.2. Identified Risk Factors for Long COVID-19

The most significant predictors for Long COVID-19 in our model were timing of acute COVID-19 infection, having uncommon chronic health conditions, loneliness, hours worked per week, age and financial security, derived from the feature importance data as the predictors with the greatest increase in node purity (Table 5 and Figure 2). This result partially aligns with the existing literature.
Firstly, timing of acute COVID-19 infection was the most significant predictor in our model, with a considerably greater contribution to node purity than the next most important feature (refer to Table 5 and Figure 2). In accordance with the literature, our model shows that participants who had COVID-19 earlier in the pandemic were more likely to report Long COVID-19 symptoms (Figure 3). This is also endorsed by findings from similar studies that generate risk prediction models for Long COVID-19. A study by Kessler et al. also found COVID-19 variant to be the most influential feature in their gradient booster classification model, with a similar direction of effect [18]. Analysing the trend in more detail, Long COVID-19 risk in our model was highest early in the pandemic, with peak risk being approximately between the November 2020 and January 2021 survey waves, representing early wild-type COVID-19 variants. Long COVID-19 risk then decreases slightly in the next survey wave, which corresponds to the rise of the Delta variant. By the last survey wave, Long COVID-19 risk sharply declines to zero; this is due to missing responses, as the presence of Long COVID-19 was not yet assessable for participants who only reported acute infection in the last wave. Kessler et al. found similar results, with earlier wild-type COVID-19 variants being associated with highest risk of Long COVID-19, followed by the Delta variant. As their study included data until July 2022, they were able to capture further trends that begin to emerge in our model, with the more recent Omicron variant being associated with lowest risk of Long COVID-19 [18]. This is consistent with the current literature, with most data supporting lowest risk of Long COVID-19 following infection with Omicron variants, with risk increasing with the Delta variant and highest risk in the earlier wild-type variants [5,7,11,13].
Having uncommon health conditions and loneliness were associated with a lower risk of Long COVID-19 (Figure 4 and Figure 5, respectively). Our model included predictors for common health conditions that are among the more well-established risk factors for Long COVID-19 in the literature, including asthma, cancer, diabetes, hypertension, high BMI and neuropsychiatric conditions [5,7,8,10], as well as in similar machine learning models and online cohort longitudinal studies [11,15,16,17,18]. Interestingly, it appears that the absence of these may be a stronger classifier of not having Long COVID-19 in our model, thus supporting the converse of the current literature and suggesting a possible protective effect. It is also important to note that whilst several of these comorbidities are becoming recognised as risk factors, there are still studies that report conflicting results. For example, a systematic review of diabetes as a risk factor for Long COVID-19 found that pre-existing diabetes was an identified risk factor for Long COVID-19 in 44% of the included studies, with no significant associations found in the remaining 56% and evidence for new-onset diabetes to be a complication of Long COVID-19 itself [22]. As for loneliness, those who reported feeling lonely more often may have been more isolated and hence less likely to develop acute COVID-19 infection; however, its relationship with Long COVID-19 is less intuitive. Rather, studies have postulated that loneliness may be a risk factor for Long COVID-19 due to its association with mental health conditions and socioeconomic deprivation and may lead to predominant neuropsychiatric symptoms [23,24]. This and the limitations of self-reported data could explain our results, whereby lonelier patients may be less likely to self-report Long COVID-19 symptoms, as these more non-specific neuropsychiatric symptoms may be more likely to be misattributed to mental health conditions or loneliness itself, resulting in an apparent lower risk. However, in contradiction, two studies that also utilised self-reported survey data found pre-pandemic depression, anxiety, stress and loneliness to be associated with increased risk of Long COVID-19 [11,25]. These findings thus suggest further analysis is required in the domain of medical and psychiatric comorbidities to elucidate the definite direction of their relationship with Long COVID-19.
With respect to age, the model showed an increasing risk of Long COVID-19 with increasing age, with the highest risk being in the 55–80 age group (Figure 6). Our result is partially consistent with the existing literature, which typically reports middle-aged patients as the peak risk group, with older patients having equal or lower risk compared to younger age groups. A similar result to the literature was observed in the model by Kessler et al. [18]. This is thought to be due to higher mortality risk in older patients during acute COVID-19 infection, theorising that some may not survive to develop Long COVID-19 despite this age group being more likely to have other predisposing factors such as medical comorbidities, which pose higher risk of Long COVID-19 [10]. It is possible that our cohort has captured older patients who experienced milder acute infections given the nature of population-based data, which include both hospitalised and non-hospitalised patients, resulting in the discrepancy in the age group at highest risk.
The main social determinants that proved significant in our model were hours worked per week and financial security. Working more hours per week—in particular, greater than 55 h—and financial insecurity were associated with higher Long COVID-19 risk (Figure 7 and Figure 8, respectively). Both of these factors serve as markers of socioeconomic status, thereby supporting studies in the existing literature that have found evidence for lower socioeconomic groups being at higher risk [5,7,14]. Notably, lower socioeconomic status and financial insecurity were found to be associated with Long COVID-19 risk in a multivariable logistic regression model of an online longitudinal cohort [11].
In contrast to recent studies, there were also several variables that did not appear to be significant features in our algorithm, including sex, ethnicity, vaccination status, lifestyle factors and other markers of socioeconomic status (Table 5 and Figure 2). Typically, these variables would as such be removed from the analysis; however, on trialling this, it was found that the model performance significantly declined, with a much poorer recall value. This suggests that these variables may be resulting in some interaction effects with more significant variables despite their relatively insignificant independent importance. Although these are not able to be adequately measured based on the data available, the literature may explain their significance as part of complex relationships that require further exploration within the scope of Long COVID-19, for example, the known relationship between vaccination status and timing of acute infection exerting a protective effect on Long COVID-19 risk, or the correlation between increasing age and health comorbidities, loneliness and mental health conditions, and lifestyle and socioeconomic factors [5,7,11,12].

4.3. Sensitivity Analysis Discussion

Sensitivity analysis interpretation requires some caution without positive evidence that the participant had COVID-19, as some Long COVID-19 symptoms can occur after Influenza or be associated with other health problems. Given this caveat, the sensitivity analysis results suggested that vaccination is more protective than the main analysis showed, and that asthma is a risk factor for Long COVID-19. Uncommon health conditions dropped from third most important feature but remained in the top twenty features. Overall, the sensitivity analysis demonstrated that more than doubling the sample size did not lead to major changes in which features had high importance scores. This analysis had perfect recall (sensitivity) and good specificity.

4.4. Strengths and Limitations

Our model’s strength lies in its robustness and generalisation capabilities, suggesting its potential for integration into clinical and public health decision support systems. By incorporating potential predictors of Long COVID-19 risk in this study across several domains (demographic, clinical and socioeconomic), the final model can provide accurate and holistic insight into Long COVID-19 risk, offering value to researchers, clinicians and those in public health. Another key strength of this study is the use of high-quality data from a population-based longitudinal study. Population-based cohort data have advantages in the domain of COVID-19, as they include data from both hospitalised or healthcare-seeking and non-hospitalised patients. In comparison, several studies in the existing literature utilise electronic health record data, which only include hospitalised patients or those who seek healthcare, which can introduce significant bias and limit the generalisability of results. The data being prospective and observational in nature also decreases bias in risk prediction models by incorporating pre-pandemic baseline health information.
It is important, however, to note the limitations of the model, which largely stem from the ambiguity in the definition of Long COVID-19 and the available data. Given that the definition of Long COVID-19 continues to evolve with no consensus or diagnostic method, it is difficult to source data with robust and consistent definitions of Long COVID-19 outcome variables, especially as several, including the outcome variable in this study, were designed prior to the WHO and NICE definitions [7]. An implication for the analysis presented here is that Long COVID-19 cases are likely to be undercounted, as participants with symptoms not recognised at the time of study design will be categorised as not having Long COVID-19.
The sensitivity analysis was included to handle the sample size problem created by the inclusion criteria of requiring a positive serology COVID-19 test. However, the sample size is likely to remain problematic in that rare medical conditions were not included separately in the analysis. It is very possible that some health conditions predispose individuals to Long COVID-19, but our methodology did not allow for these to be identified. Instead, our feature “uncommon chronic health conditions” put all rare conditions into a single category as an attempt to mitigate the small sample size problem of their rarity.
Another consideration is the limitations of self-reported data, which can introduce several biases, including recall and non-response bias. Particularly when conducting analysis in the healthcare domain, differing levels of participant health literacy and COVID-19 awareness, and the lack of physician input in diagnosis and medical history may influence the accuracy of health data and decrease objectivity, and thereby affect findings. Mitigating these limitations by sourcing data with more precise definitions of Long COVID-19 as it becomes available, utilising additional data sources such as health records or utilising a combination of meaningful data sources for training and testing could yield more robust predictive models.
Examining random forests and similar machine learning techniques at a broader level, while these methods are suited to analysis of datasets with large numbers and a wide variety of predictors, and do not require linear associations between predictors and the outcome, there are some limitations that impact their utility. Firstly, whilst regression-based data analysis can be included in meta-analysis and umbrella reviews to gain a more reliable understanding of research results, machine learning does not lend itself to meta-analysis. In addition, researchers will typically wish to view the direction of effects to extract more meaningful analysis: for example, does job security positively or negatively associate with Long COVID-19? The output from random forests does not include the direction of effect, leaving researchers to separately assess this visually, as was carried out in our study (see Figure 3, Figure 4, Figure 5, Figure 6, Figure 7 and Figure 8). Practical application to new cases is also more computationally inefficient in machine learning than in regression; where a new case’s values for predictor variables can be entered into a regression equation, machine learning algorithms must be re-run to produce predictions.

4.5. Future Implications

Our predictive model is one of the few of its kind, offering initial insights into the risk factors associated with Long COVID-19. The identification of key predictors is paramount in facilitating patient risk stratification, which has significant clinical and public health implications. This prognostic information can aid clinicians in the diagnosis and treatment of Long COVID-19, particularly in providing more holistic yet targeted care through a better understanding of both clinical and sociodemographic risk factors. It can also inform the development of risk stratification and diagnostic tools, which can be translated into future clinical practice to provide clinical decision-making support. Such predictive models for Long COVID-19 risk can also be utilised to guide public health interventions, including more effective resource allocation, policy-making and prevention strategies targeted to high-risk groups. This in turn can reduce the healthcare burden and subsequent economic consequences associated with Long COVID-19, particularly in clinically and socioeconomically vulnerable populations. By leveraging the identified risk factors and addressing limitations with present study designs, future research can resolve conflicts in the current literature, and clearly elucidate risk and protective factors for Long COVID-19 to work towards mitigating its prevalent and far-reaching impacts.

5. Conclusions

Overall, this study presents an accurate and generalisable predictive model for Long COVID-19 risk using random forest classification, identifying several critical clinical and sociodemographic predictive features from a wide range of predictors available in the UK Understanding Society: COVID-19 dataset. The number of variables and non-linear nature of some of the associations with Long COVID-19 would be difficult to successfully analyse using regression, which made machine learning a more ideal technique. This study thus exemplifies the potential of machine learning techniques to address the challenges posed by Long COVID-19 and uncover the ambiguity that still surrounds the condition. By offering valuable insight into the complexities of Long COVID-19 and providing decision-making support, such risk prediction models can facilitate risk stratification of patients, leading to targeted management and population-based prevention to improve patient outcomes and reduce the economic consequences associated with Long COVID-19.

Supplementary Materials

The following supporting information can be downloaded at: https://www.mdpi.com/article/10.3390/a17110485/s1, Table S1: Descriptive statistics for all predictor variables in the model split by whether the participants reported Long COVID-19 (outcome variable). Table S2: Variable coding for the outcome variable and selected categorical predictor variables.

Author Contributions

Conceptualization, D.W.; Data curation, R.S.D. and D.W.; Formal analysis, R.M., R.S.D., A.S. and D.W.; Investigation, R.M.; Methodology, R.M., R.S.D. and D.W.; Project administration, R.M. and D.W.; Software, R.M.; Supervision, D.W.; Validation, R.M., R.S.D. and D.W.; Visualization, R.M., R.S.D. and D.W.; Writing—original draft, R.M., R.S.D., A.S., K.R., A.L. and D.W.; Writing—review and editing, R.M., R.S.D., A.S., K.R., A.L. and D.W. All authors have read and agreed to the published version of the manuscript.

Funding

This research received no external funding.

Data Availability Statement

The original data presented in this study are openly available from the UK Data Service at http://doi.org/10.5255/UKDA-SN-8644-11 (accessed on 23 June 2023). Further documentation from the “Understanding Society: COVID-19 Study” is also available at https://www.understandingsociety.ac.uk/documentation/covid-19/ (accessed on 23 June 2023).

Conflicts of Interest

The authors declare no conflicts of interest.

References

  1. Michelen, M.; Manoharan, L.; Elkheir, N.; Cheng, V.; Dagens, A.; Hastie, C.; O’Hara, M.; Suett, J.; Dahmash, D.; Bugaeva, P.; et al. Characterising long COVID: A living systematic review. BMJ Glob. Health 2021, 6, e005427. [Google Scholar] [CrossRef] [PubMed]
  2. Soriano, J.B.; Murthy, S.; Marshall, J.C.; Relan, P.; Diaz, J.V. A clinical case definition of post-COVID-19 condition by a Delphi consensus. Lancet Infect. Dis. 2022, 22, e102–e107. [Google Scholar] [CrossRef] [PubMed]
  3. Chen, C.; Haupert, S.R.; Zimmermann, L.; Shi, X.; Fritsche, L.G.; Mukherjee, B. Global Prevalence of Post-Coronavirus Disease 2019 (COVID-19) Condition or Long COVID: A Meta-Analysis and Systematic Review. J. Infect. Dis. 2022, 226, 1593–1607. [Google Scholar] [CrossRef] [PubMed]
  4. National Institute for Health and Care Excellence: Clinical Guidelines. In COVID-19 Rapid Guideline: Managing the Long-Term Effects of COVID-19; National Institute for Health and Care Excellence (NICE): London, UK, 2020.
  5. Davis, H.E.; McCorkell, L.; Vogel, J.M.; Topol, E.J. Long COVID: Major findings, mechanisms and recommendations. Nat. Rev. Microbiol. 2023, 21, 133–146. [Google Scholar] [CrossRef] [PubMed]
  6. Long COVID. Long COVID. Centers for Disease Control and Prevention. Updated 14 March 2024. Available online: https://www.cdc.gov/coronavirus/2019-ncov/long-term-effects/index.html (accessed on 30 September 2024).
  7. Australian Institute of Health and Welfare. Long COVID in Australia—A Review of the Literature. 2022. Available online: https://www.aihw.gov.au/reports/covid-19/long-covid-in-australia-a-review-of-the-literature (accessed on 15 June 2024).
  8. Luo, D.; Mei, B.; Wang, P.; Li, X.; Chen, X.; Wei, G.; Kuang, F.; Li, B.; Su, S. Prevalence and risk factors for persistent symptoms after COVID-19: A systematic review and meta-analysis. Clin. Microbiol. Infect. 2024, 30, 328–335. [Google Scholar] [CrossRef] [PubMed]
  9. Malik, P.; Patel, K.; Pinto, C.; Jaiswal, R.; Tirupathi, R.; Pillai, S.; Patel, U. Post-acute COVID-19 syndrome (PCS) and health-related quality of life (HRQoL)-A systematic review and meta-analysis. J. Med. Virol. 2022, 94, 253–262. [Google Scholar] [CrossRef] [PubMed]
  10. Tsampasian, V.; Elghazaly, H.; Chattopadhyay, R.; Debski, M.; Naing, T.K.P.; Garg, P.; Clark, A.; Ntatsaki, E.; Vassiliou, V.S. Risk Factors Associated with Post-COVID-19 Condition: A Systematic Review and Meta-analysis. JAMA Intern. Med. 2023, 183, 566–580. [Google Scholar] [CrossRef] [PubMed]
  11. Durstenfeld, M.S.; Peluso, M.J.; Peyser, N.D.; Lin, F.; Knight, S.J.; Djibo, A.; Khatib, R.; Kitzman, H.; O’brien, E.; Williams, N.; et al. Factors Associated with Long COVID Symptoms in an Online Cohort Study. Open Forum Infect. Dis. 2023, 10, ofad047. [Google Scholar] [CrossRef] [PubMed]
  12. Lundberg-Morris, L.; Leach, S.; Xu, Y.; Martikainen, J.; Santosa, A.; Gisslén, M.; Li, H.; Nyberg, F.; Bygdell, M. COVID-19 vaccine effectiveness against post-COVID-19 condition among 589 722 individuals in Sweden: Population based cohort study. BMJ 2023, 383, e076990. [Google Scholar] [CrossRef] [PubMed]
  13. Padilla, S.; Ledesma, C.; García-Abellán, J.; García, J.A.; Fernández-González, M.; de la Rica, A.; Galiana, A.; Gutiérrez, F.; Masiá, M. Long COVID across SARS-CoV-2 variants, lineages, and sublineages. iScience 2024, 27, 109536. [Google Scholar] [CrossRef] [PubMed]
  14. Subramanian, A.; Nirantharakumar, K.; Hughes, S.; Myles, P.; Williams, T.; Gokhale, K.M.; Taverner, T.; Chandan, J.S.; Brown, K.; Simms-Williams, N.; et al. Symptoms and risk factors for long COVID in non-hospitalized adults. Nat. Med. 2022, 28, 1706–1714. [Google Scholar] [CrossRef] [PubMed]
  15. Thompson, E.J.; Williams, D.M.; Walker, A.J.; Mitchell, R.E.; Niedzwiedz, C.L.; Yang, T.C.; Huggins, C.F.; Kwong, A.S.F.; Silverwood, R.J.; Di Gessa, G.; et al. Long COVID burden and risk factors in 10 UK longitudinal studies and electronic health records. Nat. Commun. 2022, 13, 3528. [Google Scholar] [CrossRef] [PubMed]
  16. Pfaff, E.R.; Girvin, A.T.; Bennett, T.D.; Bhatia, A.; Brooks, I.M.; Deer, R.R.; Dekermanjian, J.P.; Jolley, S.E.; Kahn, M.G.; Kostka, K.; et al. Identifying who has long COVID in the USA: A machine learning approach using N3C data. Lancet Digit. Health 2022, 4, e532–e541. [Google Scholar] [CrossRef] [PubMed]
  17. Antony, B.; Blau, H.; Casiraghi, E.; Loomba, J.J.; Callahan, T.J.; Laraway, B.J.; Wilkins, K.J.; Antonescu, C.C.; Valentini, G.; Williams, A.E.; et al. Predictive models of long COVID. eBioMedicine 2023, 96, 104777. [Google Scholar] [CrossRef] [PubMed]
  18. Kessler, R.; Philipp, J.; Wilfer, J.; Kostev, K. Predictive Attributes for Developing Long COVID-A Study Using Machine Learning and Real-World Data from Primary Care Physicians in Germany. J. Clin. Med. 2023, 12, 3511. [Google Scholar] [CrossRef] [PubMed]
  19. University of Essex; Institute for Social and Economic Research. Understanding Society: COVID-19 Study, 2020–2021, 10th ed.; UK Data Service: Essex, UK, 2021. [Google Scholar] [CrossRef]
  20. COVID-19. University of Essex, Institute for Social and Economic Research. Available online: https://www.understandingsociety.ac.uk/documentation/covid-19/ (accessed on 23 November 2023).
  21. JASP; Version 0.17.2; JASP Team: Amsterdam, The Netherlands, 2023.
  22. Harding, J.L.; Oviedo, S.A.; Ali, M.K.; Ofotokun, I.; Gander, J.C.; Patel, S.A.; Magliano, D.J.; Patzer, R.E. The bidirectional association between diabetes and long-COVID-19—A systematic review. Diabetes Res. Clin. Pract. 2023, 195, 110202. [Google Scholar] [CrossRef] [PubMed]
  23. Renaud-Charest, O.; Lui, L.M.; Eskander, S.; Ceban, F.; Ho, R.; Di Vincenzo, J.D.; Rosenblat, J.D.; Lee, Y.; Subramaniapillai, M.; McIntyre, R.S. Onset and frequency of depression in post-COVID-19 syndrome: A systematic review. J. Psychiatr. Res. 2021, 144, 129–137. [Google Scholar] [CrossRef] [PubMed]
  24. Zakia, H.; Pradana, K.; Iskandar, S. Risk factors for psychiatric symptoms in patients with long COVID: A systematic review. PLoS ONE 2023, 18, e0284075. [Google Scholar] [CrossRef] [PubMed]
  25. Wang, S.; Quan, L.; Chavarro, J.E.; Slopen, N.; Kubzansky, L.D.; Koenen, K.C.; Kang, J.H.; Weisskopf, M.G.; Branch-Elliman, W.; Roberts, A.L. Associations of Depression, Anxiety, Worry, Perceived Stress, and Loneliness Prior to Infection with Risk of Post-COVID-19 Conditions. JAMA Psychiatry 2022, 79, 1081–1091. [Google Scholar] [CrossRef] [PubMed]
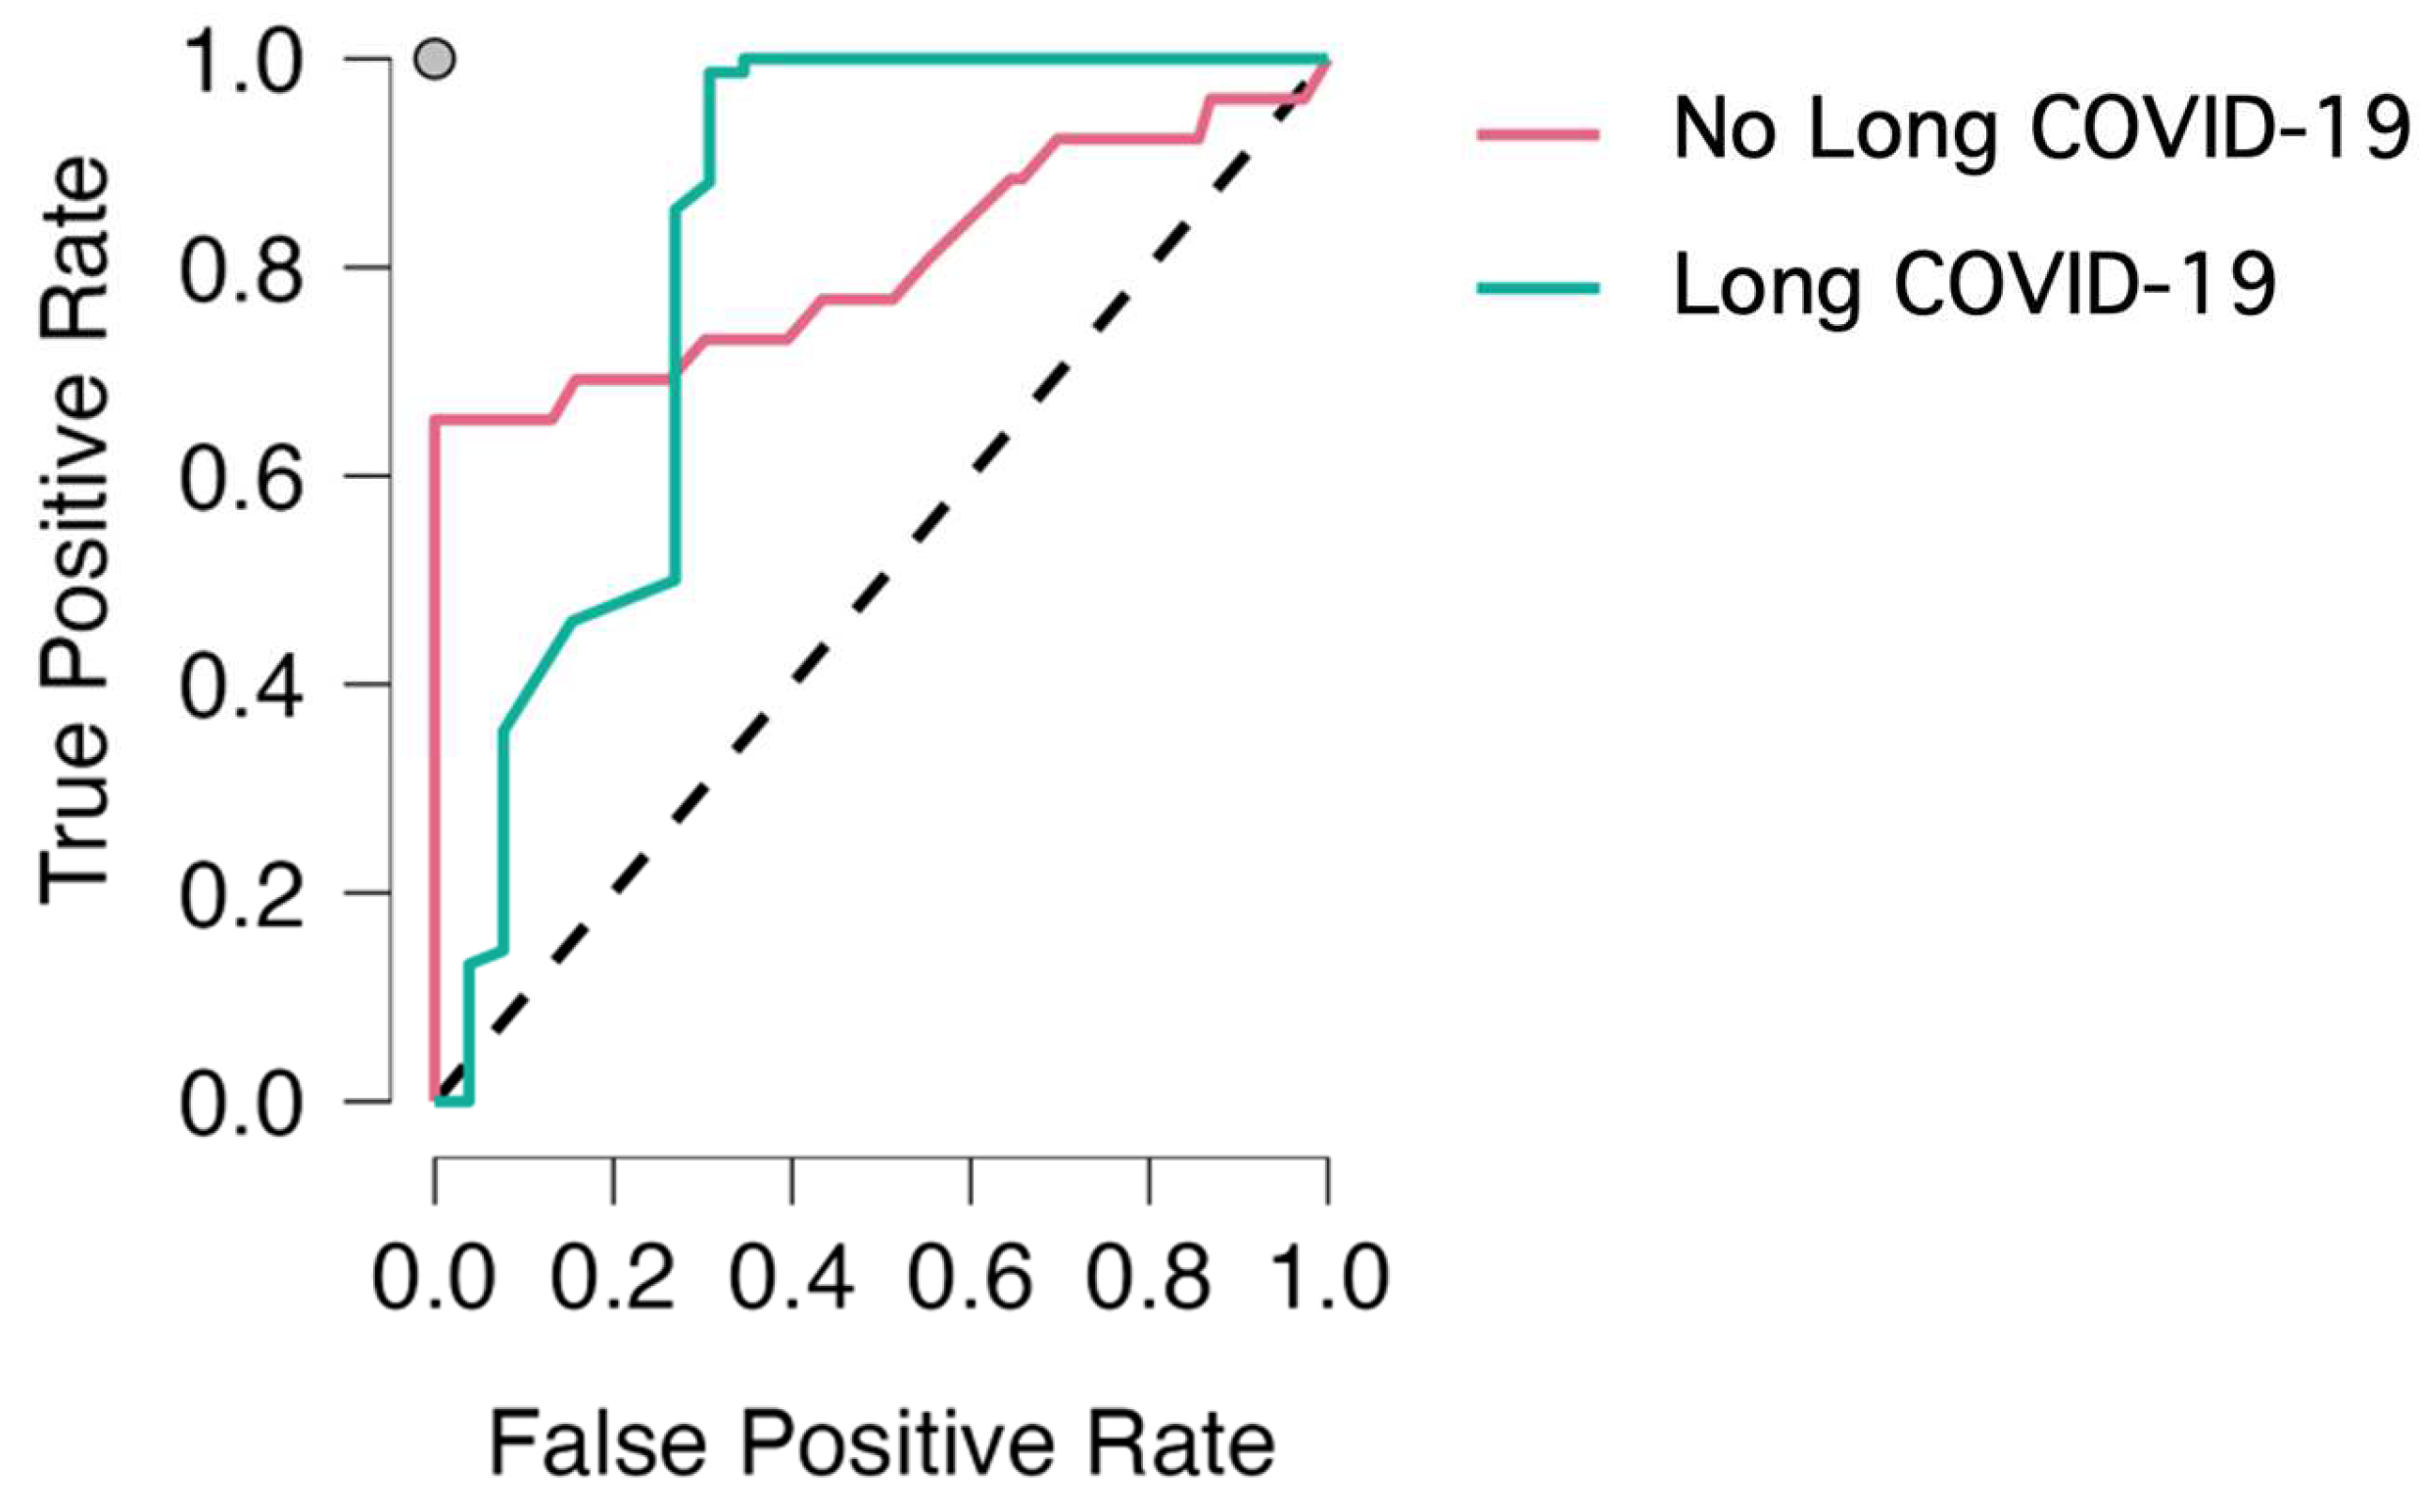
Figure 1. ROC curve.
Algorithms 17 00485 g001
Figure 2. Variable contribution to node purity.
Algorithms 17 00485 g002
Figure 3. Proportion of sample reporting Long COVID-19 symptoms by timing of acute COVID-19 infection.
Algorithms 17 00485 g003
Figure 4. Proportion of sample reporting Long COVID-19 symptoms by whether they had an uncommon chronic health condition.
Algorithms 17 00485 g004
Figure 5. Proportion of sample reporting Long COVID-19 symptoms by how often they report feeling lonely.
Algorithms 17 00485 g005
Figure 6. Proportion of sample reporting Long COVID-19 symptoms by number of hours worked per week.
Algorithms 17 00485 g006
Figure 7. Proportion of sample reporting Long COVID-19 symptoms by age.
Algorithms 17 00485 g007
Figure 8. Proportion of sample reporting Long COVID-19 symptoms by self-reported perception of financial security.
Algorithms 17 00485 g008
Table 1. Descriptive statistics for the most significant predictors in the model.
Predictor VariableLong COVID-19Valid (N)MissingMeanStandard DeviationRelative Frequency (%) or Minimum, Maximum
AgeNo161048.19914.01117.000, 77.000
Yes440049.92714.09418.000, 83.000
Timing of acute COVID-19 infectionNo16106.5342.9730.000, 9.000
Yes44004.7073.2170.000, 9.000
Other/uncommon chronic condition
0.000 = No
1.000 = Yes
No1610--No = 81.988
Yes = 18.012
Yes4400--No = 93.636
Yes = 6.364
Feels lonely often
1.000 = Never
2.000 = Sometimes
3.000 = Often
No1610--Never = 54.658
Sometimes = 32.298
Often = 13.043
Yes4373--Never = 68.421
Sometimes = 27.689
Often = 3.890
Number of hours worked per weekNo161021.93819.0090.000, 60.000
Yes438223.56619.4080.000, 78.000
Financial security in next 3 monthsNo155611.25823.4520.000, 100.000
Yes420207.48118.8600.000, 100.000
Table 2. Data split of the random forest classification model.
Trees94
Features per split5
n (train)327
n (validation)82
n (test)102
Validation accuracy0.780
Test accuracy0.892
OOB accuracy0.962
Table 3. Confusion matrix.
Observed
Long COVID-19No Long COVID-19
PredictedLong COVID-19749
No Long COVID-19217
Table 4. Evaluation metrics.
Sensitivity (recall, true positive rate)0.974
Specificity (true negative rate)0.654
False positive rate0.346
False negative rate0.026
Precision (positive predictive value)0.892
Negative predictive value0.895
Accuracy0.892
F1 score0.931
Matthews correlation coefficient0.702
Area under the receiver operating characteristic curve (AUROC)0.791
False discovery rate0.108
False omission rate0.105
Table 5. Feature importance.
Predictor VariableTotal Increase in Node PurityMean Decrease in Accuracy
Timing of acute COVID-19 infection0.0470.120
Feels lonely often0.0080.011
Uncommon chronic health condition0.0080.010
Number of hours worked per week0.005−0.008
Age0.005−0.006
Financial security in next 3 months0.003−0.001
Job security in next 12 months0.0024.939 × 10−4
Amount of fruit eaten per day0.002−0.004
Arthritis0.002−0.002
Number of alcoholic drinks typically consumed in a day0.0010.005
Hypertension9.650 × 10−4−1.318 × 10⁻⁵
Common chronic health condition9.372 × 10−40.004
Household size9.360 × 10−40.003
Neuropsychiatric condition7.889 × 10−4−0.001
Ethnic group7.773 × 10−4−0.003
Household income bracket6.385 × 10−40.001
BMI ≥ 404.676 × 10⁻⁴−0.001
Diabetes4.320 × 10−42.604 × 10⁻⁴
Malignancy3.094 × 10−44.576 × 10⁻⁴
Food insecurity over past week2.961 × 10−4−2.935 × 10⁻⁵
Asthma2.667 × 10−4−8.832 × 10⁻⁴
Immunosuppressive medication2.164 × 10−41.407 × 10⁻⁴
At risk of serious illness from COVID-191.472 × 10−41.447 × 10−4
Cares for others outside the household6.645 × 10−5−0.005
Sex−3.437 × 10⁻⁴−0.002
No immunosuppressive treatment−5.427 × 10−46.861 × 10−4
Number of cigarettes smoked per day−0.001−8.703 × 10⁻⁴
Cares for others within household−0.001−7.602 × 10⁻⁴
Had a COVID-19 vaccine−0.0020.001
Table 6. Node purity increase statistics showing the features with the highest importance in the sensitivity analysis compared with their importance rank in the main analysis.
Total Increase in Node PurityNode Purity Rank in Main Analysis
Timing of acute COVID-19 infection0.0161
Age0.0095
Number of hours worked per week0.0054
Financial security in next 3 months0.0056
Feels lonely often0.0042
Had a COVID-19 vaccine0.00428
Hypertension0.00411
Common chronic health condition0.00312
Job security in next 12 months0.0017
Asthma0.00121
Disclaimer/Publisher’s Note: The statements, opinions and data contained in all publications are solely those of the individual author(s) and contributor(s) and not of MDPI and/or the editor(s). MDPI and/or the editor(s) disclaim responsibility for any injury to people or property resulting from any ideas, methods, instructions or products referred to in the content.