Article

Highly Imbalanced Classification of Gout Using Data Resampling and Ensemble Method

1
School of Biomedical Engineering, Division of Life Science and Medicine, University of Science and Technology of China, Hefei 230026, China
2
CAS Key Lab of Bio-Medical Diagnostics, Suzhou Institute of Biomedical Engineering and Technology, Chinese Academy of Sciences, Suzhou 215163, China
*
Author to whom correspondence should be addressed.
Algorithms 2024, 17(3), 122; https://doi.org/10.3390/a17030122
Submission received: 22 February 2024 / Revised: 8 March 2024 / Accepted: 12 March 2024 / Published: 15 March 2024
(This article belongs to the Special Issue Artificial Intelligence Algorithms in Healthcare)

Abstract

:
Gout is one of the most painful diseases in the world. Accurate classification of gout is crucial for diagnosis and treatment which can potentially save lives. However, the current methods for classifying gout periods have demonstrated poor performance and have received little attention. This is due to a significant data imbalance problem that affects the learning attention for the majority and minority classes. To overcome this problem, a resampling method called ENaNSMOTE-Tomek link is proposed. It uses extended natural neighbors to generate samples that fall within the minority class and then applies the Tomek link technique to eliminate instances that contribute to noise. The model combines the ensemble ’bagging’ technique with the proposed resampling technique to improve the quality of generated samples. The performance of individual classifiers and hybrid models on an imbalanced gout dataset taken from the electronic medical records of a hospital is evaluated. The results of the classification demonstrate that the proposed strategy is more accurate than some imbalanced gout diagnosis techniques, with an accuracy of 80.87% and an AUC of 87.10%. This indicates that the proposed algorithm can alleviate the problems caused by imbalanced gout data and help experts better diagnose their patients.

1. Introduction

Over the past decade, many researchers have shown significant research interest in the classification and management of chronic diseases. As a chronic disease, gout can cause severe pain and has been linked to several health conditions, including heart disease, kidney damage, and diabetes [1,2]. It is important to diagnose gout in patients, as this can lead to more effective treatment strategies and reduce the likelihood of disease progression while alleviating patient suffering. The traditional method for diagnosing gout relies on the patient’s biochemical indicators and medical images. This approach can be expensive and financially burdensome for the patient. Fortunately, the use of machine learning saves a great deal of time and enhances the effectiveness of the diagnosis; it depends on the availability of clinical data and patient medical records [3]. Computer-assisted diagnosis has the potential to reduce the dependence on expensive imaging and testing procedures, resulting in more cost-effective and accessible diagnostic solutions for patients. Previous work has diagnosed medical conditions by collecting information from electronic medical records and creating machine learning models.
Based on the clinical record, gout can be classified into four distinct periods: asymptomatic hyperuricemia, acute gouty attack, intercritical period, and chronic tophaceous gout [4]. However, studies of gout patients have not focused on the four distinct periods of the disease; instead, they typical categorize patients as having either gout or asymptomatic hyperuricemia [5]. Additionally, medical diagnoses often involve imbalanced datasets, which can lead to biased predictions towards the majority class [6]. The class imbalance problem (CLP) is the non-uniform distribution of classes in a dataset. The term ‘majority class’ refers to the class with the highest number of instances, while the term ‘minority class’ refers to the class with the lowest number of instances [7]. A classifier trained with imbalanced data tends to be biased towards the majority class and may overlook the more important minority class. Models often exclude the minority class in order to achieve higher accuracy, which can lead to biased results. Addressing data imbalance in gout can improve the model’s ability to learn the features from the minority classes, reducing the risk of misdiagnosis during gout diagnosis. In medical diagnostics, the SMOTE algorithm, which creates synthetic examples by interpolating between minority class instances and their k-nearest neighbors, is the primary method for addressing class imbalance [8]. Nevertheless, SMOTE has some weaknesses. It depends on the parameter k and the quality of the generated samples; it also has an over-density of synthetic samples. On the other hand, medical diagnostics often employ separate classifiers that fail to fully extract the dataset’s features, which reduces the classification’s effectiveness [9].
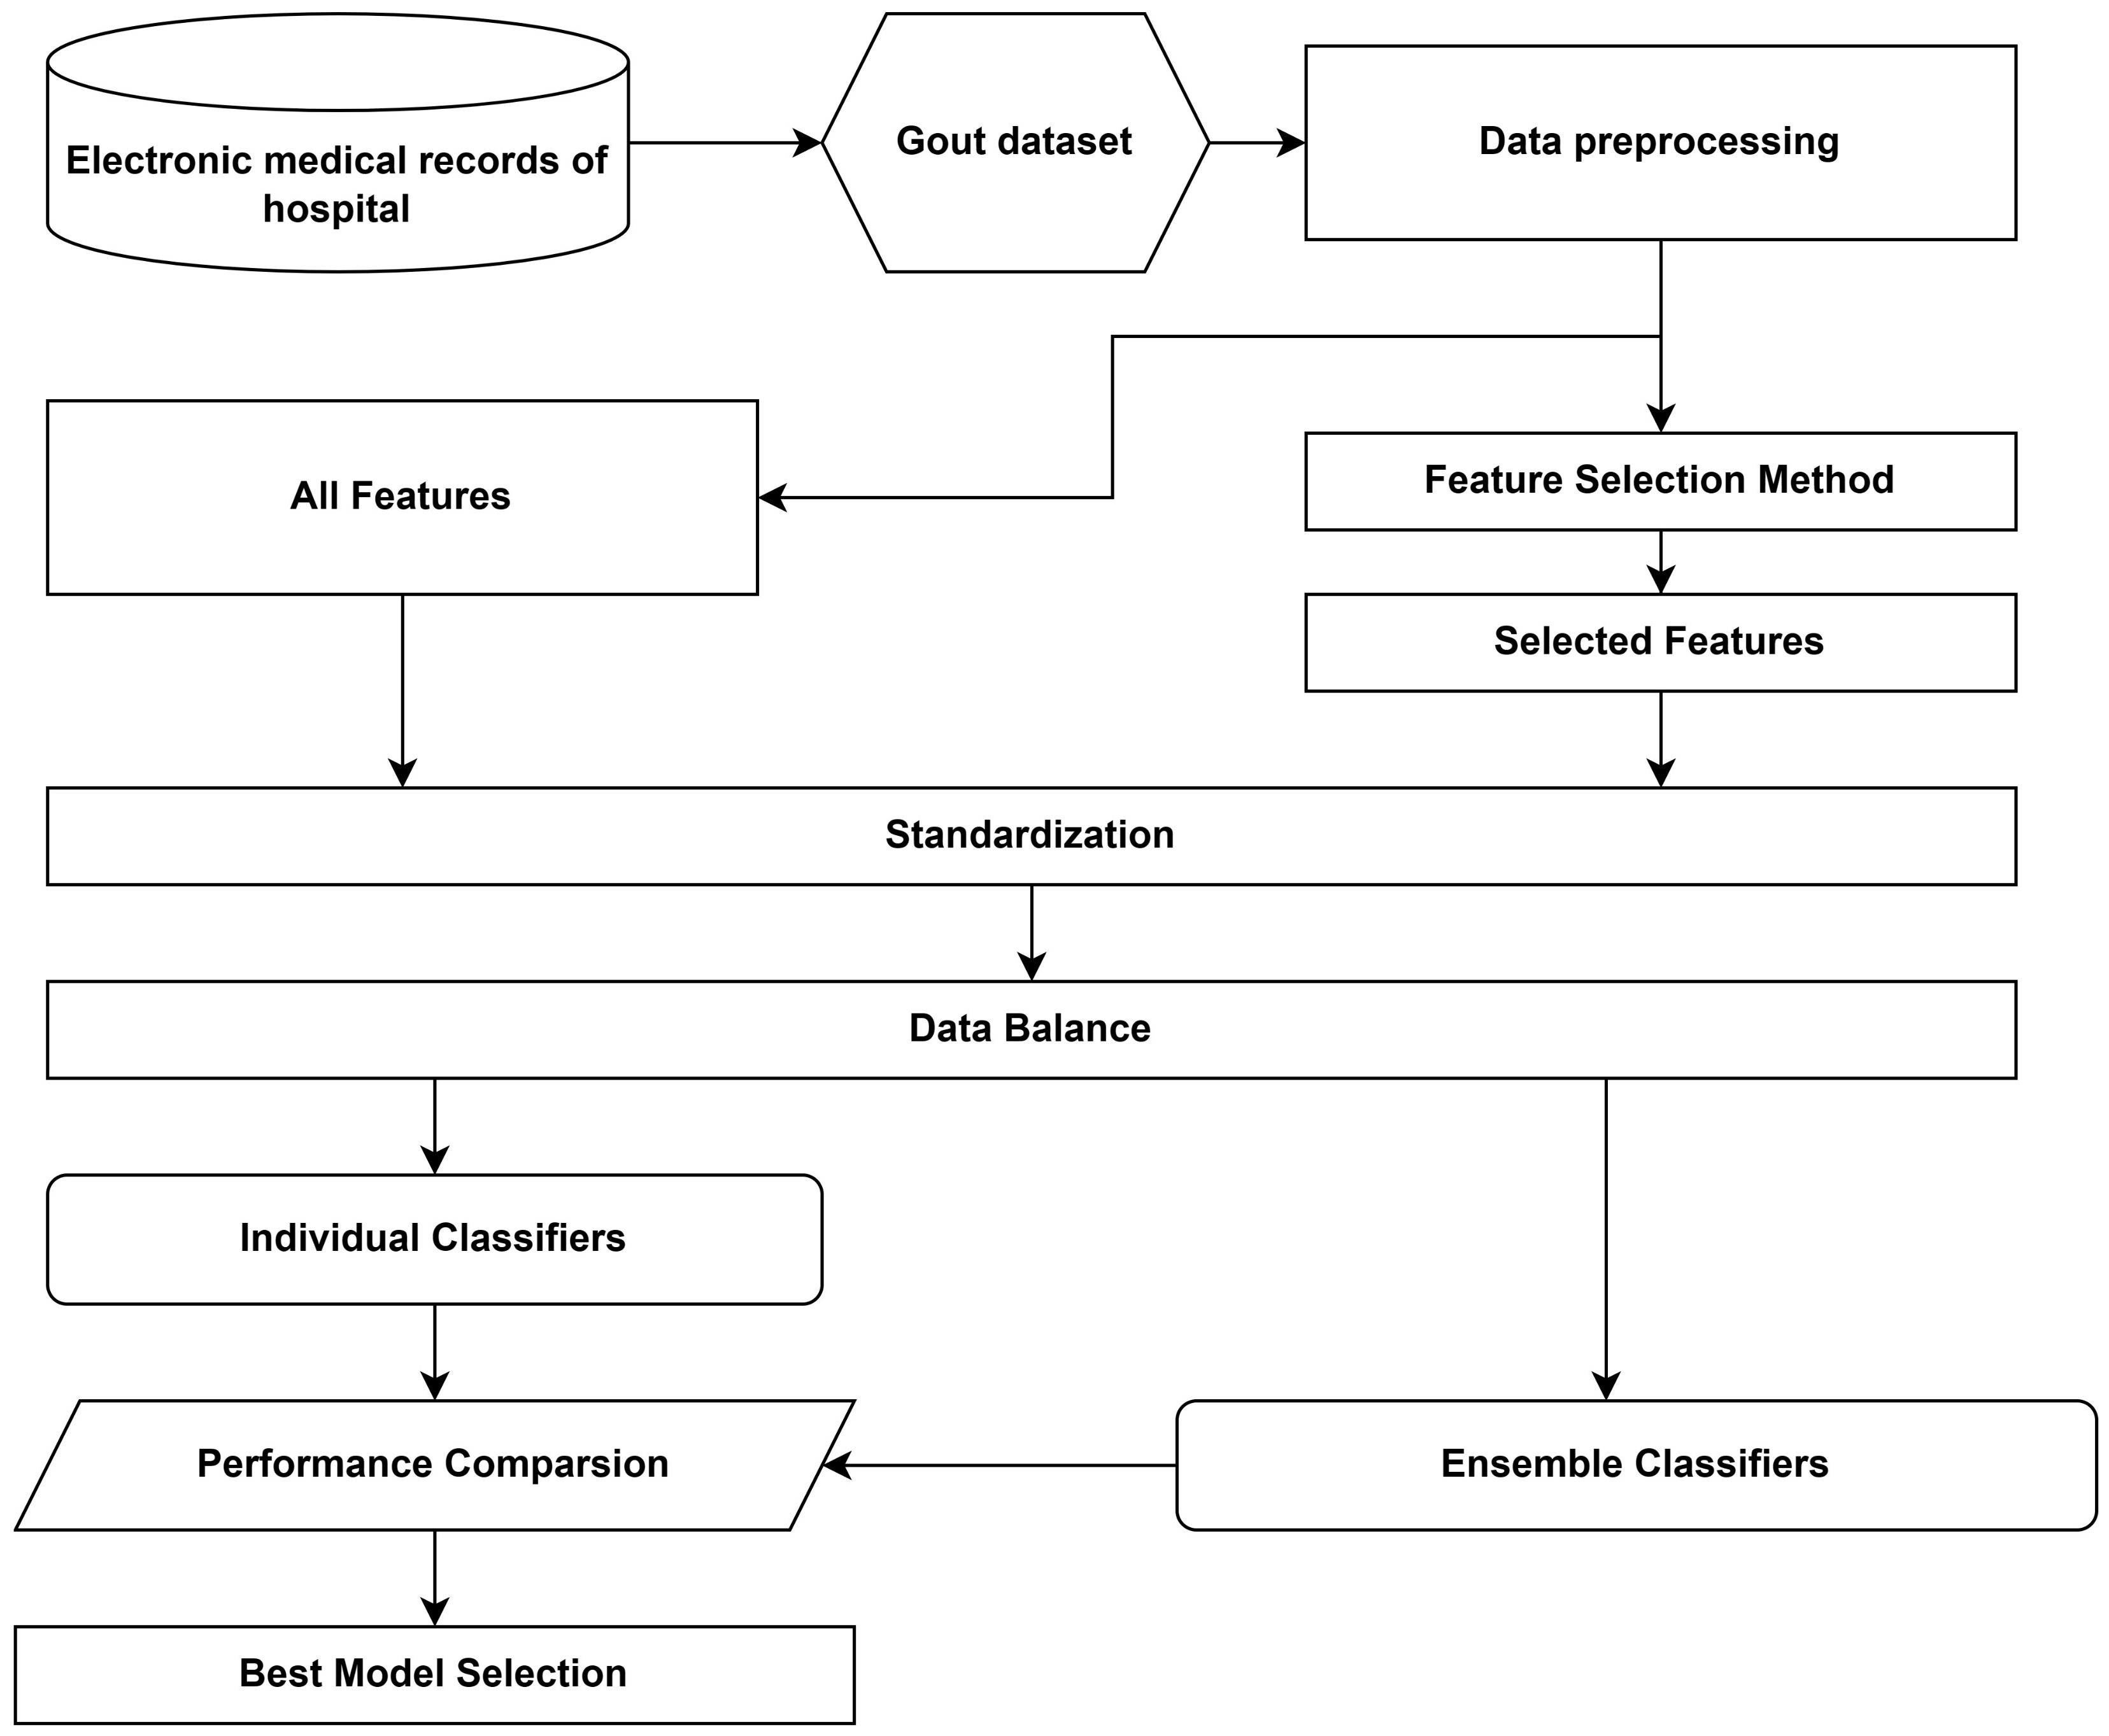
This study addresses the lack of research for accurately staging gout beyond a simple diagnosis and aims to address the imbalance in gout data. To address the imbalanced data problem, this study proposes a new hybrid sampling strategy based on an extended natural neighbor. And, ensemble learning is then combined to alleviate the problem of data imbalance. After acquiring and preprocessing data from hospital medical records, ENaNSMOTE-Tomek link is proposed as a solution to the imbalanced data problem caused by the gout dataset. ENaNSMOTE-Tomek link uses extended natural neighbors with SMOTE to generate new samples for the minority class and removes noise with Tomek link, achieving data balance. The bagging ensemble strategy is used to improve the recognition accuracy of both the majority and minority classes by addressing the uneven distribution of the data. Because the study utilized a dataset with an imbalanced distribution of classes and a relatively high number of features, correlation analysis and random forest are used to select features that improve the accuracy of the proposed models. Feature selection aims to identify the features that significantly impact the final prediction results, and random forest can calculate feature importance and reduce model calculation costs. Also, this study uses six classifiers—support vector machines (SVMs), decision trees (DTs), k-nearest neighbors (KNN), gradient boosting (GB), multilayer perceptron (MLP), and extreme gradient boosting (XGB)—and selects the optimal classifier through a proposed resampling method and ensemble learning for the diagnosis of gout. This study employs commonly used classification performance metrics, including accuracy, precision, recall, and F1 score. Additionally, AUC, a performance metric that captures imbalanced classification, is also utilized. All experimental results are based on physical examination and clinical laboratory indicators of real gout patients. Figure 1 illustrates the method and process of this algorithm. The key contributions of this study are as follows:
(1) A predictive model is proposed for accurately classifying different periods of gout. Experimental results demonstrate that it outperforms the same type of disease diagnosis approach for diseases such as heart disease and diabetes.
(2) The ENaNSMOTE-Tomek link algorithm is proposed to address the issue of imbalanced data. The algorithm uses the extended natural neighbors to generate reliable samples for the minority class and employs data cleaning techniques by using Tomek links.
(3) An ensemble model that combines a bagging technique and a hybrid resampling technique is proposed to handle the CIP in the classification of gout.
(4) This study utilizes correlation analysis and random forests to reduce the number of attributes and to enhance the performance of classifiers.
The paper is structured as follows: Section 2 presents the literature review. Section 3 provide a comprehensive explanation of the methods used in this study. Section 4 provides a comprehensive review of the experiment. Section 5 provides an overview of the results. Section 6 concludes the entire work.

2. Literature Review

The diagnosis of gout patients is primarily based on pathology and pharmacology. For instance, Xue et al. classified patients with gout and clinical hyperuricemia based on target serum urate levels [10]. Wang et al. utilized oxylipin biomarkers to differentiate between gout and hyperuricemia [11]. Shen et al. used potential biomarkers of metabolites to distinguish between gout and hyperuricemia [12]. Also, some progress has been made in predicting gout using traditional machine learning. Cheng et al. employed machine learning and natural language processing techniques to automatically detect gout attacks from electronic clinical records [13]. Bai et al. introduced neighborhood rough sets into multivariate variational mode decomposition and used them to construct a method for classifying potential gout patients [14]. Ma et al. applied deep reinforcement learning to solve the gout staging task [15].
Research has been conducted in the literature to develop disease diagnostics based on machine learning models in order to create more accurate prediction models. Rois et al. used a random forest algorithm, while Bisht et al. employed the k-nearest neighbors method to predict the factors that contribute to perceived stress [16,17]. Jaques et al. utilized support vector machines to predict students’ happiness [18]. Chou et al. and Laila et al. both used machine learning algorithms to predict the onset and early-stage risk of diabetes, respectively. Chou et al. employed a decision tree, while Laila et al. used a random forest [19,20]. Nilashi et al. proposed a KNN + SOM + PCA + Fuzzy support vector machine (SVM) model for diagnosing heart disease [21]. Almazroi et al. used decision trees to predict heart disease by utilizing clinical records [22]. Ahmad et al. utilized a gradient boosting classifier to diagnose human heart disease [23].
Resolving imbalanced data can improve predictions and reduce errors in medical diagnosis. For data balancing in cardiovascular disease, RandomOverSampler has been used [24]. In order to improve the survival rate of heart failure patients, the extra tree classifier (ETC) was proposed; it uses SMOTE to balance the data [25]. Also, the authors used SMOTE to classify diabetes and reliable stress levels [26,27]. Fitriyani et al. proposed using extreme gradient boosting with SMOTE-ENN to solve the cardiovascular prediction problem [28]. The use of ensemble methods for classification has gained momentum in recent years. Ensemble techniques combine the predictions of multiple base classifiers to produce a final result, resulting in improved accuracy. They are objective and avoid subjective evaluations, as demonstrated from the following articles. For example, Baker employed different machine learning methods with majority votes to predict credit card fraud transactions [29]. In the field of disease diagnosis, Liu utilized DNN, IF, and LR with ensemble learning to evaluate stroke records [30]. Meanwhile, Mehr employed random forest, extra tree (ET), AdaBoost, and MLP (multilayer perceptron) with ensemble learning, along with various feature selection methods, to classify polycystic ovary syndrome [31]. Similarly, Emine used AdaBoost ensemble learning to classify neuromuscular disorders, while Schreiber developed machine learning models using ensemble methods to identify patients with VIPN-free survival [32,33]. Asif employed an ensemble voting method to combine random forest, extreme gradient boosting, and gradient boosting to enhance the prediction of heart disease [9].
Previous studies have shown that disease diagnosis models perform well. However, there are still several shortcomings. Classification on imbalanced datasets can result in biased outcomes, as most standard classification algorithms favor the majority class, leading to poor prediction accuracy for the minority class. To balance the data distribution, most prior studies employed the SMOTE method [24,25,26,27,28], which has some disadvantages. The quality of the samples generated by SMOTE depends on the parameter k, which is difficult to determine due to the variety of datasets. It is important to consider these limitations when using SMOTE for data augmentation. Additionally, the new samples generated by SMOTE use the same number of nearest neighbors without considering the sample distribution, which may result in noisy examples. Furthermore, SMOTE only generates synthetic samples along the line segment between two minority samples, which may cause an over-density of synthetic samples. Currently, models are trained using simple machine learning algorithms such as DT [16], SVM [15], XGB [28], or KNN [10]. Recent developments in machine learning methodologies have enabled the successful use of ensemble learning frameworks and deep learning in computational biology and healthcare. These advancements have led to the development of more reliable and stable models, enhancing the performance for the diagnosis of gout.

3. Methods

This study aims to classify gout using the proposed resampling and ensemble techniques. These techniques address overfitting and poor generalization issues. By combining these techniques, the proposed approach provides a useful solution for handling CLP. The study uses t-SNE visualization to assess the efficiency of the imbalanced dataset before and after sampling. The dataset consists of majority and minority samples across four different labels. To address the class imbalance, the ENaNSMOTE-Tomek link resampling technique is applied to achieve a balanced distribution of the classes. A gout dataset that is balanced using this technique is utilized to train an ensemble model. The model’s performance is evaluated on a separate test dataset to optimize it, as shown in Figure 2.

3.1. Random Forest Feature Selection

Random forest is a machine learning method that constructs multiple decision trees using random resampling bootstrap technology and random node classification technology. The final classification results are produced through voting. Random forest can analyze features with complex interactions, is robust to noise and missing data, and has a fast learning speed. Variable importance measures can be used as feature selection tools for high-dimensional data [34,35,36]. The two goals of random forest feature selection are to find highly correlated feature variables and to find feature variables with relatively fewer data and better ability to express prediction results. By calculating the importance of each feature, only the attributes with higher importance are selected to train the final model, reducing the calculation cost.

3.2. ENaNSMOTE-Tomek Link

Oversampling techniques, such as random repeating minority class instances or SMOTE, aim to address class imbalance by increasing the number of minority instances. SMOTE uses existing minority class data to create new synthetic samples instead of duplicating them. Minority class samples are often scarce and highly valuable. However, the nearest neighbors of minority data points may be too far or from different classes due to the limitations of k-nearest neighbors. SMOTE may discard some minority class samples, resulting in over-density of synthetic samples. To address this concern, the ENaNSMOTE technique introduces the concept of extended natural neighbors which are different from the k-nearest neighbors theory used in SMOTE. ENaNSMOTE is not limited to a specific parameter k: it searches for the extended natural neighbor of each minority sample to generate new synthetic samples. This approach ensures that the generated synthetic samples maintain a similar distribution as and characteristics of the original minority class instances. ENaNSMOTE enables a flexible and adaptive resampling process, ensuring that no valuable minority class sample is overlooked and that the resulting synthetic samples accurately represent the minority class. ENaN is an extension of NaN based on the concept of true friendship between two individuals [37]. ENaN expands on this concept by incorporating the ideas of unilateral friendship and true friendship, which are inspired by friendships in human society, referring to two people who consider each other to be friends. A natural stable structure holds if everyone has at least one true friend. If example x is one of the λ -nearest neighbors of example y or y is one of the λ -nearest neighbors of x, then x is called the extended natural neighbor of y, and vice versa. The definition of the extended natural neighbor is displayed in the following equation.
x E N a N ( y ) x N N λ ( y ) y N N λ ( x )
λ = a r g m i n r ( r N + ) ( y ) ( x y ) , ( x E N a N ( y ) )
where λ is called the natural neighbor eigenvalue and is the minimum number of searches r required to build a naturally stable structure. That is, all examples (except noise) have ENaN until the number of neighbors r increases from 1 to λ . Therefore, the value of λ is related to the data distribution and varies from one dataset to another. The symbols x and y denote two examples, and N + denotes the set 1, 2, 3, ⋯.
However, it is important to note that the relationship captured by the extended natural neighbor may not be robust. Samples generated using the extended natural neighbor may potentially mislead the classifier and result in incorrect judgments. To address this concern, the proposed method combines the Tomek link algorithm to undersampling the dataset after the ENaNSMOTE oversampling step.
The Tomek link algorithm evaluates each sample separately and identifies pairs of samples that are Tomek links [38]. A Tomek link is when two samples of different classes are each others’ nearest neighbors. In such cases, the sample that is farther away from the decision boundary is considered the noisy sample and is subsequently removed. This removal process is repeated until no further deletions can be made, ensuring that only reliable and representative samples are retained.
By combining the ENaNSMOTE and Tomek link techniques, this study create a hybrid sampling algorithm that aims to balance the dataset effectively while minimizing the introduction of noisy or irrelevant samples. This algorithm selectively oversamples the minority class using ENaN and undersamples using Tomek link to create a balanced and high-quality dataset for training a classifier. The pseudocode for the hybrid sampling algorithm that encompasses both the ENaNSMOTE and Tomek link steps is presented as Algorithm 1.
Algorithm 1 The process of the ENaNSMOTE-Tomek link algorithm.
  • Step 1: Start of ENaNSMOTE: Identification of minority class
  • Step 2: Identify extended natural neighbors from minority classes for resampling of the random instances and determine the distances between them.
  • Step 3: For a synthetically created sample, add the result to the minority class by multiplying the difference by a random value between 0 and 1.
  • Repeat Steps 2 and 3 as necessary to reach the appropriate ratio of obtained minority class samples.
  • End of ENaNSMOTE
  • Step 6: Start of Tomek link: For more in-depth data cleaning, Tomek links will be applied.
  • Step 7: First, compute the pairwise distances between all samples.
  • Step 8: Find each sample‘s k-nearest neighbors based on the computed distances. Check if any of the nearest neighbors are of a different class. If a Tomek link is found, mark it as noisy.
  • Step 9: For each noisy sample, find its Tomek link, which is its nearest neighbor that is of a different class. If the sample is closer to the decision boundary than its Tomek link, remove it from the dataset.
  • Repeat Steps 8 and 9 to reach the appropriate ratio for each class.
  • End of Tomek link

3.3. Machine Learning Classifiers

3.3.1. Support Vector Machine

The support vector machine (SVM) is a classifier that uses supervised learning to classify data with a simple structure and strong generalization ability [39]. Its goal is to find a hyperplane that can correctly separate all samples. In SVM binary classification, the problem is transformed into determining the hyperplane with the maximum margin in the feature space. The margin is the maximum width of the flat plate without data points inside and parallel to the hyperplane.

3.3.2. Decision Trees

Decision trees can be used for both regression and classification problems [40]. The model is constructed by iteratively splitting the data based on different attributes to form a tree-like structure. When using a decision tree classifier to make predictions, the process starts at the root node and compares the attribute values of the input data with the attribute values of the current node. The algorithm compares attributes and determines the branch to follow, moving to the next node until it reaches a leaf node, where the final prediction is made. This iterative attribute comparison is the core of decision tree prediction. The decision tree captures the relationships between attributes and their corresponding target classes, enabling accurate predictions for new instances. The decision tree model provides a clear and understandable representation of how the attributes are related to the target variable. This makes it especially valuable in scientific applications.

3.3.3. K-Nearest Neighbors

The k-nearest neighbors (KNN) algorithm is a simple yet powerful supervised learning technique used for classification and regression tasks [41]. It operates by identifying the k-nearest neighbors of a given data point based on a distance metric, such as the Euclidean distance. The algorithm then determines the class or predicts the value of the target variable based on the majority vote or average of the values of these k neighbors. The selection of the value k, which represents the number of nearest neighbors to consider, is a crucial factor in KNN. It is important to choose an appropriate value of k to achieve optimal performance. A smaller value of k may result in a more flexible and sensitive model that captures local patterns, but it may also be affected by noise or outliers. Conversely, a larger value of k can provide smoother decision boundaries, but it may lead to oversimplification or loss of finer details in the data. Overall, the KNN algorithm is versatile and can be applied to various classification and regression tasks. It offers simplicity, interpretability, and adaptability to different datasets.

3.3.4. Gradient Boosting

Gradient boosting (GB) is a popular machine learning technique used mainly for classification problems [42]. It combines multiple weak learners to create a powerful learning model. The technique works by training a weak learner, such as a decision tree, on the data and calculating the residuals or errors. It then fits a subsequent weak learner to the residuals, with the aim of reducing the overall loss. This process is repeated iteratively, with each additional weak learner used to correct the errors made by the previous learners. The final model is a more accurate and powerful predictive model. Gradient boosting has the advantage of being able to effectively handle missing data values, making it robust and versatile for working with real-world datasets that often contain missing or incomplete data. To summarize, gradient boosting is a widely used technique for classification tasks. It involves combining a set of weak learners to create a powerful and precise model.

3.3.5. Multilayer Perceptron

Multilayer perceptron (MLP) is a type of deep artificial neural network that comprises multiple perceptron layers [43]. Typically, MLP consists of three types of layers: an input layer that receives input signals, an output layer that makes final predictions, and one or more hidden layers that serve as the computational mechanism of the MLP. Hidden layers enable MLP to perform complex computations and capture intricate relationships in the data. One of the main advantages of MLP is its ability to classify datasets that are not linearly separable. MLP can capture nonlinear relationships present in the data through its hidden layers, enabling it to solve complex classification problems. In summary, MLP is a deep artificial neural network that consists of multiple perceptron layers. It is capable of approximating any continuous function and handling non-linearly separable datasets. MLP is widely used for classification, recognition, and prediction tasks in a variety of domains.

3.3.6. Extreme Gradient Boosting

Extreme gradient boosting (XGB) is a powerful machine learning algorithm that excels at various classification, regression, and ranking tasks [44]. XGB is an ensemble model that utilizes a collection of weak predictive models, typically decision trees, to make accurate predictions. The algorithm constructs an ensemble of decision trees in a sequential manner, with each tree learning from the mistakes made by the previous one to improve the overall predictive power of the model. XGB effectively extracts valuable information from high-dimensional data to enhance the model’s generalization ability and computational efficiency through feature splitting and selection.

3.4. Bagging Algorithm

Bagging is a technique for homogeneous ensemble learning that involves training multiple base classifiers on random subsets with replacement from the training set [45]. Each base classifier can be trained using different algorithms, such as support vector machines (SVMs), decision trees (DTs), k-nearest neighbors (KNN), gradient boosting (GB), multilayer perceptron (MLP), and extreme gradient boosting (XGB). During the prediction phase, bagging combines the predictions of these base classifiers through voting or averaging to obtain the final prediction. By combining the predictions of various base classifiers, bagging aims to enhance the generalization performance and robustness of the models.

4. Experiment

4.1. Dataset and Data Preprocessing

4.1.1. Dataset

The dataset used in this study comprises medical records of gout patients who visited the hospital between 2016 and 2021. The data were manually recorded by doctors and include various patient information. The dataset on gout comprises 4362 records, consisting of 4240 male records and 122 female records. Each patient’s record contains 111-dimensional attribute values, including blood lipid indicators TG, HDL-C, and LDL-C; blood glucose index GLU; a renal function index that includes urea and Cr; a liver function index that includes ALT, AST, AST/ALT, GGT, TBIL, DBIL, and ALB; as well as uric acid levels; gender; smoking history; random urine analysis; age and frequency of onset; past medical history; family history; gout stones; height and weight; blood pressure; VAS score; exercise history; etc.

4.1.2. Data Preprocessing

To conduct experiments, the patient dataset was preprocessed due to its large feature dimensions and numerous irrelevant data for the final prediction results. The data preprocessing process involves handling missing values and normalizing the data. Columns with more than 50% missing data and some data that could not confirm the patient’s disease stage were deleted. Blank features were filled in with the average value of the entire column. And the experiment data were anonymized and did not include any personal information of the patients.
After preprocessing, the attributes of each instance were ultimately determined, and the dataset attributes are shown in Table 1. The dataset comprised 4362 patient samples, with 133 cases of asymptomatic hyperuricemia (Ah), 281 cases of acute gouty attack (Aga), 1993 cases of intercritical period (Ip), and 1955 cases of chronic tophaceous gout (Ctg). The model was trained using standardized data and a feature scaling technique after preprocessing the dataset.

4.2. Feature Selection

Figure 3 shows the correlation between the dataset features and the final classification. The analysis revealed that several features had minimal impact on the diagnosis and could be removed to reduce the calculation load. The feature variables of the dataset were selected using random forest by calculating the Gini value and OOB value of each variable. To reduce the computational cost of the model and to improve the final classification accuracy, we selected the attributes that had the greatest impact on the final result. Figure 4 shows the importance of certain features as calculated using random forest.

4.3. Data Balancing

Dividing the complete dataset into training and testing datasets is crucial to avoid inefficient model training and poor validation results. After experimenting with different ratios, we found that a ratio of 80:20 produced the best results. The dataset in this study consisted of four classes, which were highly imbalanced. The proposed algorithm balances not only the samples between the minority and majority classes but also eliminates noisy samples that affect classification. Table 2 shows the samples of each class processed by the resampling algorithm, as well as the testing data samples.

4.4. Performance Measures

This study examines five evaluation metrics for comparative analysis of individual classifiers and ensemble models: accuracy, precision, recall, F1 score, and AUC. Accuracy and precision are commonly used performance evaluation metrics. However, evaluating the overall performance of a model based solely on accuracy is impractical because it does not reflect the efficiency of minority class samples or the accuracy of a specific class sample. Therefore, to evaluate the performance, F1 score, recall, and AUC are used. Accuracy refers to the percentage of correctly classified predictions out of the total number of predictions. Precision indicates the percentage of instances classified as positive that are actually positive. Recall describes the percentage of correct predictions in the sample with a positive true value. F1 score is the harmonic average of precision and recall. AUC refers to the area under the receiver operating characteristic curve, which indicates the performance of the classifier [6].
P r e c i s i o n = T P T P + F P
R e c a l l = T P T P + F N
A c c u r a c y = T P + T N T N + F P + T P + F N
F 1 S c o r e = 2 P r e c i s i o n R e c a l l P r e c i s i o n + R e c a l l
A U C = T P r a t e + T N r a t e 2

5. Results

This section presents the classification results between the proposed method and six basic learners. A comparison between the proposed model and previous works from the literature is made to highlight the superiority of the proposed model. The proposed method is evaluated using a confusion matrix and various validation metrics, which are tabulated for visualization.

5.1. Classification Performance

Table 3 summarizes the evaluation results of different models. The confusion matrix of the proposed method is shown in Figure 5. The results indicate that the proposed method outperformed the other classifiers with an accuracy of 80.87%, precision of 84.02%, recall of 82.53%, F1 score of 82.57%, and AUC value of 87.10%. The algorithm in this study demonstrates an average improvement of 3% across all metrics when compared to the sub-optimal algorithm. And models such as XGB, GB, and DT also perform well, indicating that the tree structure is useful for dealing with high-dimensional features and imbalance problems. The results indicate that the model can fully learn the minority class features while also removing noisy samples that can affect classification, which addresses the issue of data imbalance in gout.
In this part, the effectiveness of the proposed method in addressing data imbalances is discussed. This study evaluates the performance of various resampling methods, including SMOTE, BorderSMOTE, SMOTE+ENN, SMOTE+Tomek link, RandomOver, and the proposed ENaNSMOTE-Tomek link, using a single XGB model. The results are presented in Table 4. It is evident that the proposed method outperforms the other resampling methods in terms of classification performance. SMOTE, BorderSMOTE, and RandomOver achieve AUCs of 84%, but the proposed method generates higher-quality samples, resulting in an AUC of 85.98%, accuracy of 80.52%, precision of 82.62%, recall of 81.96%, and F1 score of 81.08%. The proposed method exhibits the best overall performance, which indicates the effectiveness of the resampling method proposed in this study for addressing the imbalance problem.

5.2. Ablation Experiment

This section discusses the verification of the proposed method’s generalization ability. The experiment involved training models on a balanced dataset that was created using the proposed resampling algorithm. After training, classification tasks were performed on the test dataset. The confusion matrix of the XGB model on the balanced dataset that was created using the proposed resampling algorithm is shown in Figure 5. Table 5 presents the the performance evaluation indicators of the classification results for various models. XGB has the highest indicators with an accuracy of 80.52%, precision of 81.85%, recall of 80.40%, F1 score of 81.08%, and AUC value of 85.98%. The model improves accuracy by 0.8%, recall by 2.62%, F1 score by 0.55%, and AUC by 1.57% compared to the imbalanced data. Although precision indicators decreased, the overall performance improved. Furthermore, the results show that other classification models also achieved better performance after using the proposed resampling algorithm, with most indicators improving. This indicates that the proposed resampling algorithm has addressed the issue of bias in the model caused by an imbalanced dataset. T-SNE (t-distributed stochastic neighbor embedding) was used to visualize high-dimensional data in a three-dimensional space. The scatter plot in the three-dimensional space represents each class with a different color and pattern. Figure 6 shows imbalanced samples, where classes Ah and Aga have fewer instances than the other classes. Figure 7 shows that the instances of the four classes are almost the same after balancing.
After conducting experiments on two different datasets, the XGB model was found to perform the best. To address the issue of data imbalance, the bagging method was employed to combine different models with the proposed resampling algorithm. Table 5 and Table 6 show the values of different performance measures for the different ensemble models. The results indicate that XGB with bagging achieved the highest AUC of 87.10% and had enhanced recall and F1 scores of 82.53% and 82.57%, respectively. The final confusion matrix of the model is shown in Figure 5. The bagging method improved the performance of different models slightly, demonstrating its effectiveness compared to a single classifier. Additionally, the bagging method alleviates the problem of an imbalanced dataset.

6. Conclusions

This paper presents a study on the classification of periods of gout that can aid medical professionals with diagnosing the disease quickly and accurately. The proposed method can assist doctors with diagnosing gout. By referring to diagnostic results and exercising professional judgment, the accuracy of diagnoses can be improved, reducing the economic burden to patients. Solving the data imbalance problem in medical diagnosis is necessary to improve the accuracy of the model, and this paper proposes a new method that can solve the medical data imbalance problem. To address data imbalance in medical datasets, a resampling method ENaNSMOTE-Tomek link was proposed. The proposed method generates high-quality resampled data using the extended natural neighbor algorithm and filters out synthetic data by assessing pairs of samples that exhibit a Tomek link. The proposed approach enhances the performance of machine learning models in dealing with severely imbalanced data by improving the quality of resampled data. Additionally, a bagging algorithm was utilized for data balancing, which overcomes the limitations of individual classifiers and provides more accurate classification of gout staging in noisy and highly imbalanced environments. Six classifiers—SVM, DT, KNN, GB, MLP, and XGB—were implemented and compared using metrics. The results demonstrate that the proposed ensemble model, bagging-XGB, with the proposed resampling method outperforms all other models with an accuracy of 80.87% and an AUC of 87.10%. Although the proposed method performs well in gout, it is important to note that the study is limited by the relatively small size of the training dataset in terms of the number of patients. For future work, the effective use of a small amount of labeled data and a large amount of unlabeled data for semi-supervised learning or self-supervised learning using unlabeled data only are important directions for our work.

Author Contributions

Conceptualization, X.S.; Funding acquisition, L.W.; Investigation, W.X.; Methodology, X.S. and L.W. ; Supervision, X.S. and W.X.; Validation, B.W. and W.C.; Visualization, X.S.; Writing—original draft, X.S.; Writing—review and editing, X.S. and L.W. All authors have read and agreed to the published version of the manuscript.

Funding

This work was supported by the National Key Research and Development Plan Project of China 2022YFC2503300 and the Key Research and Development Plan of Shandong Province (2021CXGC011103, 2021SFGC0104).

Data Availability Statement

The data that support the findings of this study are available from the corresponding author and will be made available on request. The code is available at https://github.com/lanmei666/classification-of-gout- (accessed on 20 January 2024).

Conflicts of Interest

The authors declare no conflicts of interest.

References

  1. Wortmann, R.L. Gout and hyperuricemia. Curr. Opin. Rheumatol. 2002, 14, 281–286. [Google Scholar] [CrossRef] [PubMed]
  2. Punzi, L.; Scanu, A.; Galozzi, P.; Luisetto, R.; Spinella, P.; Scire, C.; Oliviero, F. One year in review 2020: Gout. Clin. Exp. Rheumatol. 2020, 38, 807–821. [Google Scholar] [PubMed]
  3. Beunza, J.J.; Puertas, E.; García-Ovejero, E.; Villalba, G.; Condes, E.; Koleva, G.; Hurtado, C.; Landecho, M.F. Comparison of machine learning algorithms for clinical event prediction (risk of coronary heart disease). J. Biomed. Inform. 2019, 97, 103257. [Google Scholar] [CrossRef] [PubMed]
  4. Ragab, G.; Elshahaly, M.; Bardin, T. Gout: An old disease in new perspective—A review. J. Adv. Res. 2017, 8, 495–511. [Google Scholar] [CrossRef] [PubMed]
  5. Hoskison, T.K.; Wortmann, R.L. Advances in the management of gout and hyperuricaemia. Scand. J. Rheumatol. 2006, 35, 251–260. [Google Scholar] [CrossRef]
  6. Kumari, R.; Singh, J.; Gosain, A. SmS: SMOTE-stacked hybrid model for diagnosis of polycystic ovary syndrome using feature selection method. Expert Syst. Appl. 2023, 225, 120102. [Google Scholar] [CrossRef]
  7. Gosain, A.; Sardana, S. Handling class imbalance problem using oversampling techniques: A review. In Proceedings of the 2017 International Conference on Advances in Computing, Communications and Informatics (ICACCI), Udupi, India, 13–16 September 2017; IEEE: Toulouse, France, 2017; pp. 79–85. [Google Scholar]
  8. Chawla, N.V.; Bowyer, K.W.; Hall, L.O.; Kegelmeyer, W.P. SMOTE: Synthetic minority over-sampling technique. J. Artif. Intell. Res. 2002, 16, 321–357. [Google Scholar] [CrossRef]
  9. Asif, S.; Wenhui, Y.; Yueyang, Y.; Jinhai, S. Improving the accuracy of diagnosing and predicting coronary heart disease using ensemble method and feature selection techniques. Clust. Comput. 2023. [Google Scholar] [CrossRef]
  10. Xue, X.; Yuan, X.; Han, L.; Li, X.; Merriman, T.R.; Cui, L.; Liu, Z.; Sun, W.; Wang, C.; Yan, F.; et al. Effect of clinical typing on serum urate targets of benzbromarone in Chinese gout patients: A prospective cohort study. Front. Med. 2022, 8, 806710. [Google Scholar] [CrossRef]
  11. Wang, C.; Lu, J.; Sun, W.; Merriman, T.R.; Dalbeth, N.; Wang, Z.; Wang, X.; Han, L.; Cui, L.; Li, L.; et al. Profiling of serum oxylipins identifies distinct spectrums and potential biomarkers in young people with very early onset gout. Rheumatology 2023, 62, 1972–1979. [Google Scholar] [CrossRef]
  12. Shen, X.; Wang, C.; Liang, N.; Liu, Z.; Li, X.; Zhu, Z.J.; Merriman, T.R.; Dalbeth, N.; Terkeltaub, R.; Li, C.; et al. Serum metabolomics identifies dysregulated pathways and potential metabolic biomarkers for hyperuricemia and gout. Arthritis Rheumatol. 2021, 73, 1738–1748. [Google Scholar] [CrossRef]
  13. Zheng, C.; Rashid, N.; Wu, Y.L.; Koblick, R.; Lin, A.T.; Levy, G.D.; Cheetham, T.C. Using natural language processing and machine learning to identify gout flares from electronic clinical notes. Arthritis Care Res. 2014, 66, 1740–1748. [Google Scholar] [CrossRef] [PubMed]
  14. Bai, J.; Sun, B.; Chu, X.; Wang, T.; Li, H.; Huang, Q. Neighborhood rough set-based multi-attribute prediction approach and its application of gout patients. Appl. Soft Comput. 2022, 114, 108127. [Google Scholar] [CrossRef]
  15. Ma, C.; Pan, C.; Ye, Z.; Ren, H.; Huang, H.; Qu, J. Gout Staging Diagnosis Method Based on Deep Reinforcement Learning. Processes 2023, 11, 2450. [Google Scholar] [CrossRef]
  16. Rois, R.; Ray, M.; Rahman, A.; Roy, S.K. Prevalence and predicting factors of perceived stress among Bangladeshi university students using machine learning algorithms. J. Health Popul. Nutr. 2021, 40, 50. [Google Scholar] [CrossRef]
  17. Bisht, A.; Vashisth, S.; Gupta, M.; Jain, E. Stress Prediction in Indian School Students Using Machine Learning. In Proceedings of the 2022 3rd International Conference on Intelligent Engineering and Management (ICIEM), London, UK, 27–29 April 2022; IEEE: Toulouse, France, 2022; pp. 770–774. [Google Scholar]
  18. Jaques, N.; Taylor, S.; Azaria, A.; Ghandeharioun, A.; Sano, A.; Picard, R. Predicting students’ happiness from physiology, phone, mobility, and behavioral data. In Proceedings of the 2015 International Conference on Affective Computing and Intelligent Interaction (ACII), Xi’an, China, 21–24 September 2015; IEEE: Toulouse, France, 2015; pp. 222–228. [Google Scholar]
  19. Chou, C.Y.; Hsu, D.Y.; Chou, C.H. Predicting the onset of diabetes with machine learning methods. J. Pers. Med. 2023, 13, 406. [Google Scholar] [CrossRef]
  20. Laila, U.E.; Mahboob, K.; Khan, A.W.; Khan, F.; Taekeun, W. An ensemble approach to predict early-stage diabetes risk using machine learning: An empirical study. Sensors 2022, 22, 5247. [Google Scholar] [CrossRef]
  21. Nilashi, M.; Ahmadi, H.; Manaf, A.A.; Rashid, T.A.; Samad, S.; Shahmoradi, L.; Aljojo, N.; Akbari, E. Coronary heart disease diagnosis through self-organizing map and fuzzy support vector machine with incremental updates. Int. J. Fuzzy Syst. 2020, 22, 1376–1388. [Google Scholar] [CrossRef]
  22. Almazroi, A.A. Survival prediction among heart patients using machine learning techniques. Math Biosci. Eng. 2022, 19, 134–145. [Google Scholar] [CrossRef]
  23. Ahmad, G.N.; Fatima, H.; Ullah, S.; Saidi, A.S. Efficient medical diagnosis of human heart diseases using machine learning techniques with and without GridSearchCV. IEEE Access 2022, 10, 80151–80173. [Google Scholar] [CrossRef]
  24. Ishaq, A.; Sadiq, S.; Umer, M.; Ullah, S.; Mirjalili, S.; Rupapara, V.; Nappi, M. Improving the prediction of heart failure patients’ survival using SMOTE and effective data mining techniques. IEEE Access 2021, 9, 39707–39716. [Google Scholar] [CrossRef]
  25. Kibria, H.B.; Matin, A. The severity prediction of the binary and multi-class cardiovascular disease A machine learning-based fusion approach. Comput. Biol. Chem. 2022, 98, 107672. [Google Scholar] [CrossRef]
  26. Uddin, M.J.; Ahamad, M.M.; Hoque, M.N.; Walid, M.A.A.; Aktar, S.; Alotaibi, N.; Alyami, S.A.; Kabir, M.A.; Moni, M.A. A comparison of machine learning techniques for the detection of type-2 diabetes mellitus: Experiences from bangladesh. Information 2023, 14, 376. [Google Scholar] [CrossRef]
  27. Anand, R.V.; Md, A.Q.; Urooj, S.; Mohan, S.; Alawad, M.A. Enhancing Diagnostic Decision-Making: Ensemble Learning Techniques for Reliable Stress Level Classification. Diagnostics 2023, 13, 3455. [Google Scholar] [CrossRef] [PubMed]
  28. Fitriyani, N.L.; Syafrudin, M.; Alfian, G.; Rhee, J. HDPM: An effective heart disease prediction model for a clinical decision support system. IEEE Access 2020, 8, 133034–133050. [Google Scholar] [CrossRef]
  29. Baker, M.R.; Mahmood, Z.N.; Shaker, E.H. Ensemble Learning with Supervised Machine Learning Models to Predict Credit Card Fraud Transactions. Rev. D’Intelligence Artif. 2022, 36, 509–518. [Google Scholar] [CrossRef]
  30. Liu, J.; Chou, E.L.; Lau, K.K.; Woo, P.Y.; Li, J.; Chan, K.H.K. Machine learning algorithms identify demographics, dietary features, and blood biomarkers associated with stroke records. J. Neurol. Sci. 2022, 440, 120335. [Google Scholar] [CrossRef] [PubMed]
  31. Danaei Mehr, H.; Polat, H. Diagnosis of polycystic ovary syndrome through different machine learning and feature selection techniques. Health Technol. 2022, 12, 137–150. [Google Scholar] [CrossRef]
  32. Yaman, E.; Subasi, A. Comparison of bagging and boosting ensemble machine learning methods for automated EMG signal classification. BioMed Res. Int. 2019, 2019, 9152506. [Google Scholar] [CrossRef]
  33. Schreiber, B. Vincristine-Induced Peripheral Neuropathy: Assessing Preventable Strategies in Paediatric Acute Lymphoblastic Leukaemia. Ph.D. Thesis, UNSW, Sydney, Australia, 2022. [Google Scholar]
  34. Strobl, C.; Boulesteix, A.L.; Kneib, T.; Augustin, T.; Zeileis, A. Conditional variable importance for random forests. BMC Bioinform. 2008, 9, 307. [Google Scholar] [CrossRef]
  35. Joelsson, S.R.; Benediktsson, J.A.; Sveinsson, J.R. Feature Selection for Morphological Feature Extraction using Randomforests. In Proceedings of the 7th Nordic Signal Processing Symposium-NORSIG 2006, Reykjavik, Iceland, 7–9 June 2006; IEEE: Toulouse, France, 2006; pp. 138–141. [Google Scholar]
  36. Orovas, C.; Orovou, E.; Dagla, M.; Daponte, A.; Rigas, N.; Ougiaroglou, S.; Iatrakis, G.; Antoniou, E. Neural networks for early diagnosis of postpartum PTSD in women after cesarean section. Appl. Sci. 2022, 12, 7492. [Google Scholar] [CrossRef]
  37. Guan, H.; Zhao, L.; Dong, X.; Chen, C. Extended natural neighborhood for SMOTE and its variants in imbalanced classification. Eng. Appl. Artif. Intell. 2023, 124, 106570. [Google Scholar] [CrossRef]
  38. Zeng, M.; Zou, B.; Wei, F.; Liu, X.; Wang, L. Effective prediction of three common diseases by combining SMOTE with Tomek links technique for imbalanced medical data. In Proceedings of the 2016 IEEE International Conference of Online Analysis and Computing Science (ICOACS), Chongqing, China, 28–29 May 2016; IEEE: Toulouse, France, 2016; pp. 225–228. [Google Scholar]
  39. Pisner, D.A.; Schnyer, D.M. Support vector machine. In Machine Learning; Academic Press: New York, NY, USA, 2020; pp. 101–121. [Google Scholar]
  40. Kotsiantis, S.B. Decision trees: A recent overview. Artif. Intell. Rev. 2013, 39, 261–283. [Google Scholar] [CrossRef]
  41. Guo, G.; Wang, H.; Bell, D.; Bi, Y.; Greer, K. KNN model-based approach in classification. In Proceedings of the on the Move to Meaningful Internet Systems 2003: CoopIS, DOA, and ODBASE: OTM Confederated International Conferences, CoopIS, DOA, and ODBASE 2003, Catania, Sicily, Italy, 3–7 November 2003; Springer: Berlin/Heidelberg, Germany, 2003; pp. 986–996. [Google Scholar]
  42. Natekin, A.; Knoll, A. Gradient boosting machines, a tutorial. Front. Neurorobot. 2013, 7, 21. [Google Scholar] [CrossRef]
  43. Glorot, X.; Bengio, Y. Understanding the difficulty of training deep feedforward neural networks. In Proceedings of the Thirteenth International Conference on Artificial Intelligence and Statistics, JMLR Workshop and Conference Proceedings, Sardinia, Italy, 13–15 May 2010; pp. 249–256. [Google Scholar]
  44. Pathy, A.; Meher, S.; Balasubramanian, P. Predicting algal biochar yield using eXtreme Gradient Boosting (XGB) algorithm of machine learning methods. Algal Res. 2020, 50, 102006. [Google Scholar] [CrossRef]
  45. Breiman, L. Bagging predictors. Mach. Learn. 1996, 24, 123–140. [Google Scholar] [CrossRef]
Figure 1. Algorithm flow diagram.
Algorithms 17 00122 g001
Figure 2. Flowchart of the proposed approach.
Algorithms 17 00122 g002
Figure 3. Pairwise correlation matrix of proposed features. The color of each pixel in the figure represents the correlation between the corresponding feature pairs on the horizontal and vertical coordinates.
Algorithms 17 00122 g003
Figure 4. The importance of some features in the gout dataset.
Algorithms 17 00122 g004
Figure 5. The confusion matrix of the experiments. (a) Imbalanced dataset with features selected. (b) Balanced dataset with resampling algorithm. (c) Results with resampling and ensemble algorithm.
Algorithms 17 00122 g005
Figure 6. Distribution of imbalanced gout dataset.
Algorithms 17 00122 g006
Figure 7. Distribution of gout dataset after resampling.
Algorithms 17 00122 g007
Table 1. Gout dataset attributes.
NoAttributesNoAttributes
1Sex21Triglycerides (mg/dL)
2Age (yrs)22Total cholesterol (mg/dL)
3Smoking history23Blood urea nitrogen (mg/dL)
4VAS score24Serum creatinine (mg/dL)
5Joint tenderness assessment25Uric acid (mg/dL)
6Joint swelling assessment26Creatinine clearance (mL/min)
7Systolic blood pressure (mmHg)27Glomerular filtration rate (mL/min/1.73 m × m)
8Diastolic blood pressure (mmHg)28Random urine creatinine
9Height (cm)29Random urine uric acid
10Weight (Kg)30Random urine pH
11Bmi31Fractional excretion of uric acid
12Heart rate (bpm)32Age at onset
13Uric acid33Medical history
14Alanine transaminase (U/L)34Family history
15Aspartate transaminase (U/L)35Frequency of hospital visits
16AST/ALT ratio36Time of follow-up visit
17Blood glucose (mg/dL)37Gout quantification score
18Sport (before gout)38Waist
19Sport (after gout)39Hip
20Drink alcohol
Table 2. Distribution of gout in train and test datasets before and after resampling.
ClassOriginTestOrigin TrainAfter Resampling
Asymptomatic hyperuricemia133281051585
Acute gouty attack281742071672
Intercritical period199340815851473
Chronic tophaceous gout195536315921480
Total436287334896210
Table 3. Performance of the different models.
ModelAccuracyPrecisionRecallF1 ScoreAUC
Proposed80.8784.0282.5382.5787.10
[28] XGB79.7282.8077.7880.5384.41
[15] SVM71.3659.5147.4749.8567.25
[10] KNN65.1755.2144.5346.6764.62
[17] GB78.4683.4376.9879.7883.71
[16] DT71.3666.0667.0166.5377.47
[31] MLP72.9667.2655.4459.0071.76
Table 4. Performance of the different resampling methods with the XGB model.
ClassAccuracyPrecisionRecallF1 ScoreAUC
Proposed method80.5282.6281.9681.0885.98
SMOTEENN77.3172.8880.4076.0484.27
SMOTETomek78.5780.9479.3180.0084.99
SMOTE79.6182.4879.6780.9885.39
BorderSMOTE79.7281.8580.2381.0384.68
RandomOver78.5781.9979.0580.4484.85
Table 5. Performance of the individual classifiers when using the resampling algorithm.
ClassAccuracyPrecisionRecallF1 ScoreAUC
Proposed80.8784.0282.5382.5787.10
XGB80.5281.8580.4081.0885.98
SVM68.4957.1163.7658.4575.69
KNN56.2446.5954.0445.5069.34
GB77.6680.5879.3179.8984.79
DT67.6963.1168.5765.4777.55
MLP71.1361.7069.5364.2278.94
Table 6. Performances of the different classifiers when using the bagging method.
ClassAccuracyPrecisionRecallF1 ScoreAUC
XGB80.8782.8082.5382.5787.10
SVM70.6757.2959.8358.0474.00
KNN57.2746.7454.6446.6169.68
GB78.5781.1680.1180.5885.39
DT71.4866.4673.7169.2880.92
MLP71.1362.4069.0564.7478.64
Disclaimer/Publisher’s Note: The statements, opinions and data contained in all publications are solely those of the individual author(s) and contributor(s) and not of MDPI and/or the editor(s). MDPI and/or the editor(s) disclaim responsibility for any injury to people or property resulting from any ideas, methods, instructions or products referred to in the content.

