Article

Application of Evolutionary Computation to the Optimization of Biodiesel Mixtures Using a Nature-Inspired Adaptive Genetic Algorithm

by
Vasileios Vasileiadis
,
Christos Kyriklidis
,
Vayos Karayannis
* and
Constantinos Tsanaktsidis
Department of Chemical Engineering, University of Western Macedonia (UOWM), GR-50100 Kozani, Greece
*
Author to whom correspondence should be addressed.
Algorithms 2024, 17(5), 181; https://doi.org/10.3390/a17050181
Submission received: 20 March 2024 / Revised: 22 April 2024 / Accepted: 24 April 2024 / Published: 28 April 2024
(This article belongs to the Special Issue Bio-Inspired Algorithms)

Abstract

:
The present research work introduces a novel mixture optimization methodology for biodiesel fuels using an Evolutionary Computation method inspired by biological evolution. Specifically, the optimal biodiesel composition is deduced from the application of a nature-inspired adaptive genetic algorithm that first examines percentages of the ingredients in the optimal mixtures. The innovative approach’s effectiveness lies in problem simulation with improvements in the evaluation of the specific function and the way to define and tune the genetic algorithm. Environmental imperatives in the era of climate change currently impose the optimized production of alternative environmentally friendly biofuels to replace fossil fuels. Biodiesel in particular, appears to be more attractive in recent years, as it originates from renewable bio-derived resources. The main ingredients of the specific biofuel mixture investigated in this research are diesel and biodiesel (100% from bioresources). The assessment of the new biodiesel examined was performed using a fitness function that estimated both the density and cost of the fuel. Beyond the evaluation criterion of cost, density also influences the suitability of this biofuel for commercial use and market sale. The outcomes from the modeling process can be beneficial in saving cost and time for new biodiesel production by using this novel decision-making tool in comparison with randomized laboratory experimentations.

1. Introduction

1.1. Literature Review

After a 4.5% decline in 2020 caused by COVID-19 restrictions, the Global Energy Consumption rose by 5% in 2021. The impact of societal development was estimated to be 3 points above the 2%/year average over the 2000–2019 period [1]. Because of Russia’s reductions in gas supplies to Europe during the last years, along with increased global demands following the easing of COVID-19 restrictions, energy prices became significantly higher. Following the global economic downturn since 2010, coupled with the realization that conventional diesel fuel sources are finite and environmentally harmful, numerous research efforts focus on enhancing the performance of complex fuel and energy systems [2,3] and assessing alternative fuel options, including coal-bed methane, biofuel and lately hydrogen [4,5]. Biodiesel, in particular, emerges as a sustainable energy alternative, environmentally clean, boasting eco-friendly attributes. In fact, it lacks aromatic and toxic compounds, is biodegradable, and significantly reduces sulfur oxide, carbon monoxide, and unburned hydrocarbon emissions, as well as soot released by diesel engines, either produced by heterogeneous catalysis [6,7] or using supercritical methanol [8]. Although fossil fuels could be considered one of the most important development pillars for humanity, their emissions and the environmental issues they initiate restrict the appreciation towards them. Researchers nowadays are trying to propose good, feasible alternatives to traditional fossil fuels possessing nearly identical characteristics that have been sought after. Biodiesel appears to be a viable option, offering a clean and sustainable fuel source at competitive costs. Biodiesel is not only economical but also has important advantages, including non-toxicity, low pollution, and biodegradability, in comparison to conventional diesel. This ecological solution leads to an increasing high-quality fuel in abundant availability and biodiesel demand. Production principles [9,10] and recent needs in biomass oil analysis and final product specifications were outlined [11,12]. Strategies that can improve biodiesel-integrated processing, including reactive distillation [13,14,15], standards and testing methods [16], and sustainability issues [17,18], were also described. Europe stands out as the primary global producer of biodiesel, attributed to its environmental directives aimed at curbing greenhouse gas emissions (GHGs) alongside ensuring energy security [19]. EU goals for the year 2030 are the following:
  • From 1990, at least a 40% reduction in greenhouse gas emissions
  • Revision by 2023: 32% at least renewable energy apportion
  • Energy efficiency improvement at least 32.5%.
Biodiesel can be categorized into three groups based on the sources of ingredients:
  • 1st Generation: Consumable Vegetable Oils
  • 2nd Generation: Non-edible Oils and Animal Fats
  • 3rd Generation: Microalgal Oils.
In contrast, traditional diesel fuel contains sulfur, a primary contributor to harmful emissions. Despite the lengthy and costly process of diesel desulfurization demanding substantial investments, the most effective means of reducing emissions lies in enhancing fuel quality using biodiesel blending. This approach not only lowers sulfur content but also upholds fuel quality standards. Moreover, fuel density is a crucial factor in determining the efficiency of different fuel mixtures containing diesel, biodiesel, and alkanols in compression ignition engines [20,21,22]. The labor-intensive and costly procedures involved in fuel mixture experimentation often result in extensive analyses to achieve optimal fuel quality and pricing [23,24]. This problem finds a solution using evolutionary computation that offers efficient solutions, decreasing the execution time and the cost of the necessary experiments in parallel.
A new decision-making approach involves the setup of a specific experimental procedure that can propose an optimized mixture composition with the lowest fuel price combined with the appropriate fuel density. Thus, the experiment process in the laboratory is more effective, concentrating the research interest around better results. Sophisticated methods drawing from natural phenomena, bio-inspired computational intelligence, algorithms in machine learning, and evolutionary computation strategies yield superior outcomes close to the optimal for intricate optimization challenges. Consequently, the practical applications of operational research rely on their utilization and advancement, i.e., on resource leveling and fuzzy clustering [25,26]. Machine Learning (ML) and Artificial Intelligence (AI) approach [27,28], and especially more than 100 studies were presented in recent years [29] focusing on the application of ML and AI on different aspects of renewable and sustainable energy [30,31], i.e., bioenergy [32] and low-carbon energy advancement [33], power dispatch systems [34], chemical process systems [35], and particularly biodiesel production [36] and conversion [37], as well as microalgal biofuel development [2,38], amplifying the design, handling, control, optimization, and monitoring. Specifically, relatively powerful methodologies employed include the following ML and AI algorithms evolved with deep learning:
  • Linear Regression
  • Principal component analysis (PCA),
  • Genetic Algorithms (GA),
  • K-Nearest Neighbors (KNN)
  • Random Forest Regression (RF),
  • Artificial Neural Networks (ANNs) or simulated neural networks (SNNs),
  • Support Vector Machines (SVMs).
  • Fuzzy Multi-Criteria methodologies
The algorithms discussed above can demonstrate superior predictive capabilities, boasting the highest levels of accuracy among methods utilized in Biodiesel production. Their effectiveness stems from the brain’s inherent ability to learn and improve autonomously, tackling complex challenges posed by the survey. Consequently, these algorithms prove immensely valuable for modeling trans-esterification processes, studying physicochemical properties, real-time monitoring of biodiesel systems, analyzing emission composition, estimating temperatures, and assessing engine performance during the combustion phase. Some algorithms provide fatty methyl acid ester as an output, and they take different types of oil and catalyst as inputs, methanol-to-oil ratios, catalyst concentrations, reaction rates, domains, and frequencies. However, the aforementioned approaches concentrate on biodiesel mixture properties optimization via the prediction of the conversion into biodiesel under various conditions. Moreover, they do not suggest an optimal mixture on the basis of raw material availability, considering both cost and density, as achieved by the Genetic Algorithm for the optimal Fuel Mixture Problem presented hereunder.

1.2. Novel Contribution of the Research

The current research introduces a novel approach for biodiesel mixture optimization, employing an Evolutionary Computation method. The optimal Biodiesel Solution is a result of an adaptive genetic algorithm application.
It should be noticed that standard diesel emissions are high in sulfur oxides. As a result, desulfurization would have been an ideal process to achieve low sulfur oxide emissions. However, because of the high time and cost required for desulfurization, the approach of using mixtures of standard diesel and biodiesel was proposed. In the Environmental Technology Lab., Chemical Engineering Dept, UOWM, Greece, thorough experiments (approximately 3500) were conducted to develop a novel blend of Diesel and Biodiesel. These experiments yielded valuable insights into the characteristics of both components. Biodiesel, serving as the secondary ingredient, is derived from a combination of animal fat and vegetable sources. Specifically in this work, the key components of the optimal biodiesel blend are diesel and biodiesel, derived from a combination of animal fat (50%) and vegetable sources (50%), as determined by the experimental settings of the Laboratory of Environmental Technology.
So, the sequence in which cost and density affect the raw material percentages in optimal mixtures is investigated. More specifically, the higher the quality of a product is, the higher the price of the raw material. In parallel, the higher the density of a mixture is, the greater both power output and fuel economy are generated in a diesel engine. Those two properties (cost and density) are used as inputs in the genetic algorithm operation and the relevant experimental simulations. The mixture evaluation is implemented from a new mathematical function that combines the two parameters. The basic operators’ Crossover and Mutation contribute to mixture improvement, producing the final bio-diesel fuel. When the Crossover operator creates biodiesel blending within the optimal solution range of the previous iteration, the Mutation process generates biodiesel combinations across the entire spectrum of feasibility, preventing potential entrapment in a localized optimal solution. The effectiveness of this approach revolves around:
(a)
implementing innovative modeling techniques, including specific evaluations to enhance modeling.
(b)
refining and defining the genetic algorithm.
Moreover, significant findings emerge from the experimental simulations conducted using this approach, including:
  • Reducing Experiment Costs
  • Minimizing Experiment Duration
  • Improving Cost and Density using Enhanced Evaluation Functions
  • Developing Environmentally Sustainable Fuels
This novel decision-making tool is now accessible to laboratory researchers, promoting the advancement of optimal fuel formulations. The genetic algorithm rapidly suggests the best mixture for experimentation within a vast pool of approximately 1.5 × 10⁹ alternative combinations per experiment set. The benefits of this approach enhance the fuel production process, making the new Biodiesel more appealing compared to other competitive fuels.
This document is organized in the following parts: the mathematical representation of the Biofuel Blend Issue is presented, and the constraints in relation to ingredient accessibility are discussed in Section 2. Section 3 explores the principal methodological elements of the suggested methodology, aiming to enhance comprehension of the algorithm’s fundamental workings. Lastly, the concluding segment provides a recapitulation of significant discoveries and emphasizes notable aspects.

2. Modeling of Biofuel Mixture

The Fuel Mixture Problem is a dynamic real-world problem explored by many researchers. Because of its high complexity, it does not facilitate the feasibility of all mixtures produced by laboratory experimentation due to the large set numbers demanded, implying high costs given a prolonged execution duration. Hence, the current method offers adaptable control over mixture production during the simulation phase. Utilizing the present Genetic Algorithm (GA), each mixture undergoes thorough evaluation, yielding precise and high-quality blends, thus expediting the identification of optimal solutions within a short experimental timeframe. The minimization of mixture function values arises from a multifaceted mathematical function that encompasses multiple objectives.
The objective is to minimize the Total Mixture Cost that is calculated for the ingredient as the weighted sum (w1) of the product of the normalized cost/liter of the ingredient and the percentage of the ingredient in the mixture minus the weighted sum (w2) of the product of the normalized density/liter of the ingredient and the percentage of the ingredient in the mixture:
T M F V = w 1 × i 1 , , n c i c max × p i w 2 × i 1 , , n d i d max 4 × p i
The raw materials optimization problem lies in minimizing the function value of the new fuel mixture:
min T M F V
Problem Restrictions:
  • Min Ingredient Percentage% ≤ pi ≤ Max Ingredient Percentage%
  • ci, where c1: diesel cost and c2: biodiesel cost
  • di, where d1: diesel density and d2: biodiesel density
  • wi, where weights: w1 + w2 = 100%
i = 1: c1 = 2.000 EUR/L, d1 = 0.8191 g/mL and 1% ≤ pi ≤ 99%
i = 2: c2 = 0.7901 EUR/L, d2 = 0.8855 g/mL and 1% ≤ pi ≤ 30%
w1 (0% ≤ w1 ≤ 100%) and w2 (0% ≤ w2 ≤ 100%)
Restrictions on the percentage of ingredients help make chromosome development feasible. For instance, the second ingredient could range from 1% at the lowest to 30% at the most in the biodiesel blend. Values over 30% are then automatically rejected. 82% and 18% represent a feasible chromosome, including all the components.
The final mixture cost can be calculated using the raw material cost restrictions, where c1 = 2.000 EUR/L (diesel cost) and c2 = 0.7901 EUR/L (biodiesel cost).
Mixture Cost Calculation: 2.000 EUR/L × 82% + 0.7901 EUR/L × 18% = 1.7822 EUR/L.
The density of ingredients, d1 = 0.8191 g/mL (diesel density at 5 °C) and d2 = 0.8855 g/mL (biodiesel density at 5 °C) are applied to provide the final mixture density.
Mixture Density Calculation: 0.8191 g/mL × 75% + 0.8855 g/mL × 25% = 0.8357 g/mL.
The mixture function value evaluation uses weights w1 and w2, providing more significance either on mixture cost or mixture density. The research of these two characteristics provides the necessary information for the ingredient’s participation in the optimal fuel mixture.

3. Algorithmic Framework

In various fields, genetic algorithms (GAs) employ nature-inspired methodologies to deliver superior outcomes. Initially proposed by Holland [39], genetic algorithms are rooted in evolutionary computation principles [40]. The current paper addresses the biodiesel mixture problem by introducing a novel evolutionary approach utilizing a Genetic Algorithm (GA) (Figure 1). Similar algorithms iteratively update population chromosomes over subsequent generations by utilizing selection, crossover, and mutation operators [26].

3.1. GA—Chromosome Representation

Example of Chromosome Representation: a random mixture made up of two ingredients, with percentages (w1, w2) always adding up to 100%. For instance, if Diesel is 78.22% and then Biodiesel is 21.78%.
The definitions and abbreviations of the main concepts that will be used hereunder are presented in Table 1.

3.2. GA—Chromosome Representation

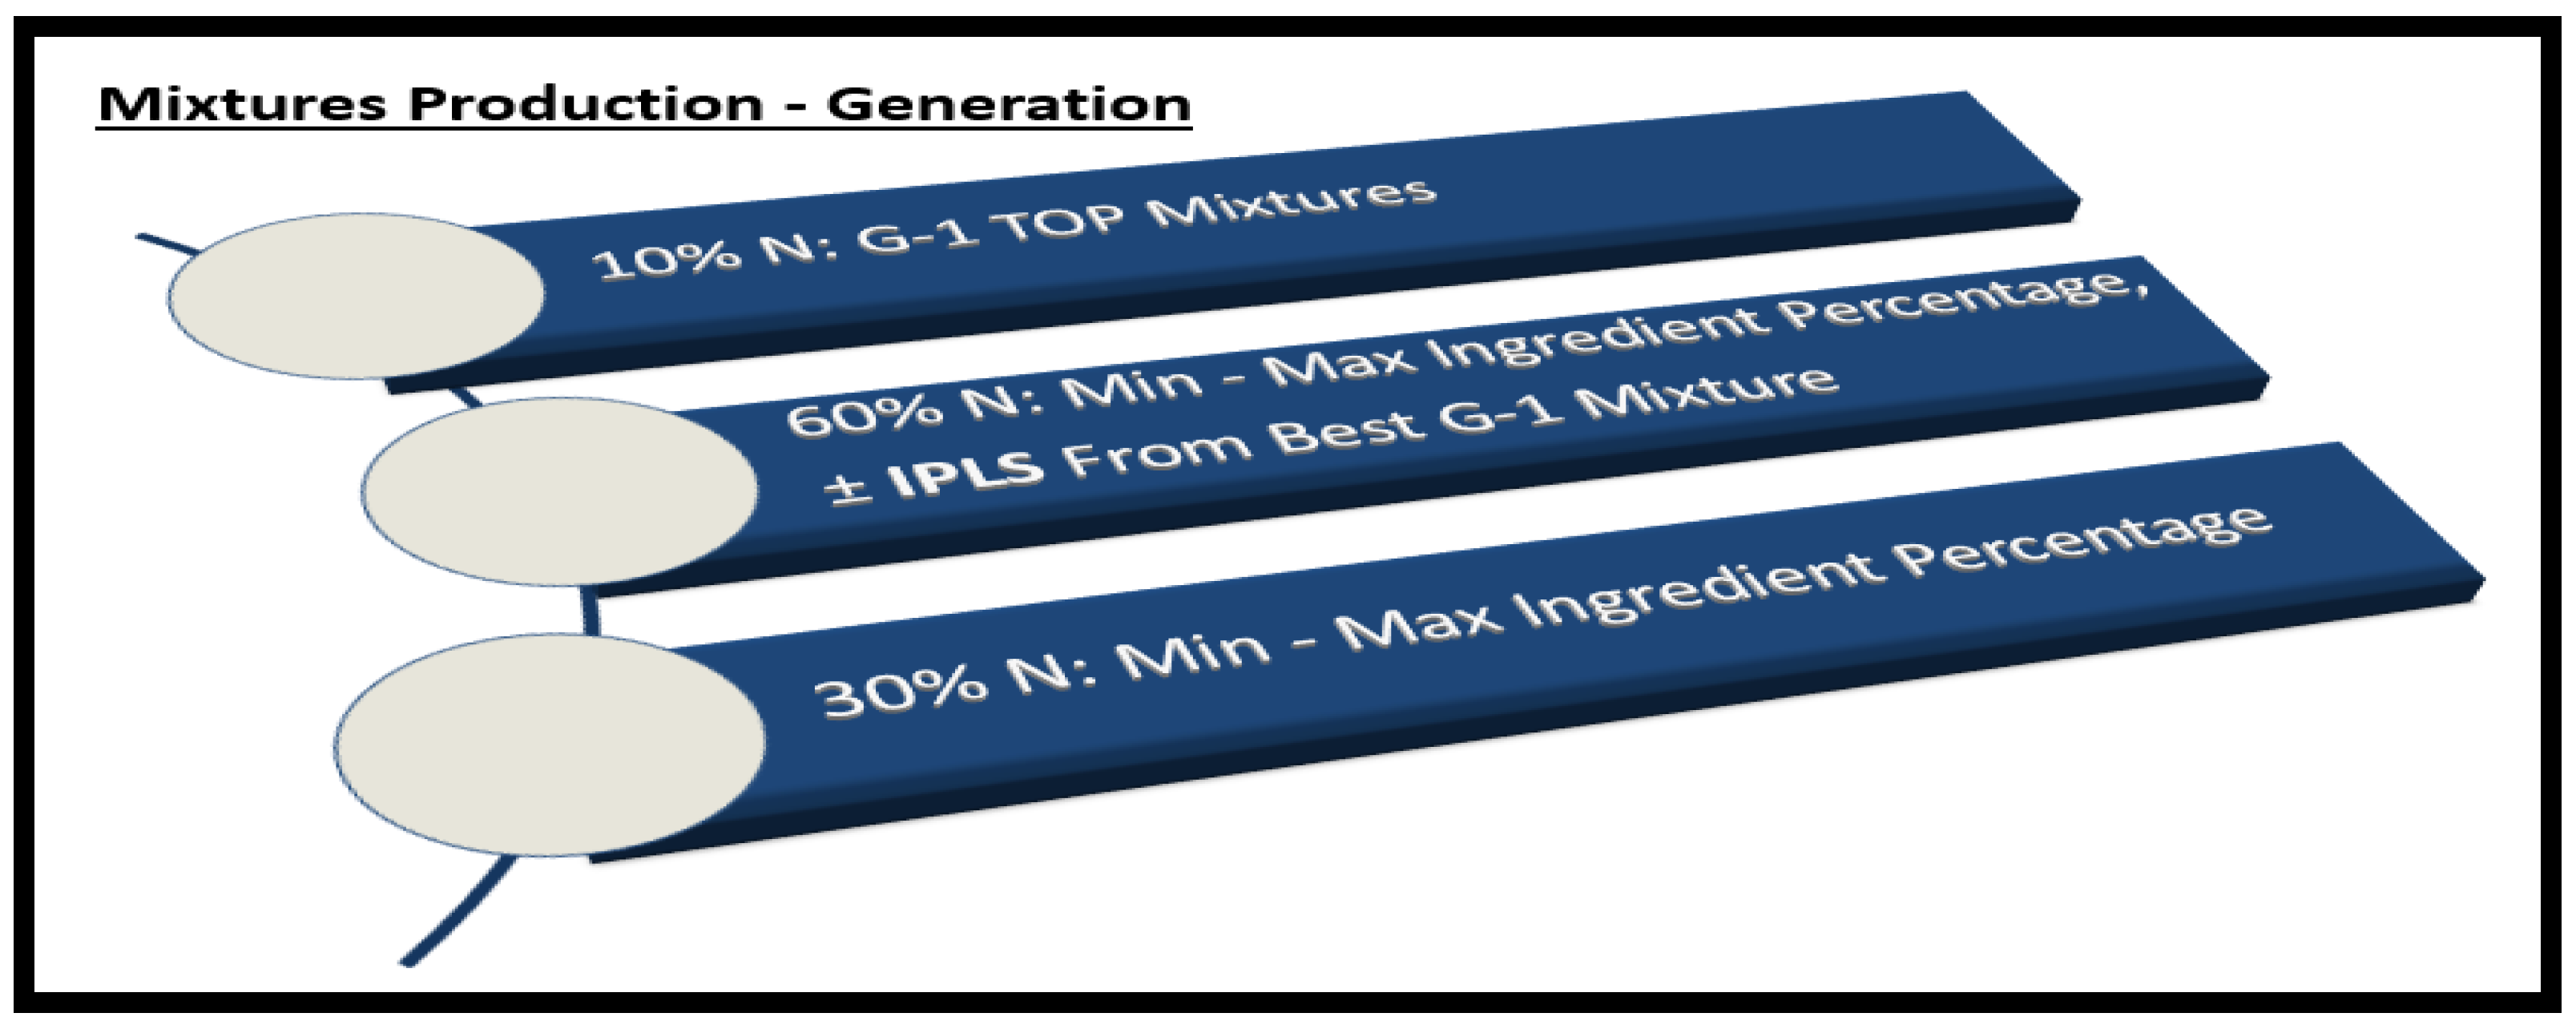
The process of generating generations involves two distinct phases. Initially, the first generation is established using the random creation of viable blends. Subsequently, in the subsequent phases, the formation of chromosomes for the generations follows a three-part process (also illustrated in Figure 2):
(a) Phase 1: A selection of the top-performing 10% of chromosomes from the current generation, known as the “TOP Mixtures,” is carried over to the next generation.
(b) Phase 2: The next 60% of results are derived from the application of the Crossover operator, which produces new chromosomes.
(c) Phase 3: The remaining 30% of chromosomes are generated via mutation, utilizing the same method employed for the initial population’s formation.
The creation of fuel mixtures involves determining the diesel and biodiesel proportions within each chromosome. Subsequently, a fitness function assesses each mixture based on criteria such as cost and density, thereby ordering all mixtures accordingly.
The solutions generated via crossover and mutation adhere to specified ingredient percentage ranges (minimum%–maximum%), ensuring that the sum of ingredient percentages always equals 100%. This approach guarantees the production of viable solutions, with no exclusion of feasible options during the evaluation process.
Following the establishment of the initial population, a framework is implemented, encompassing a range of ±IPLS (Incremental Percentage of the Last Solution) from the best chromosome percentages. This framework, suggested by Kyriklidis et al. [41], facilitates the optimization process by focusing on the optimal solution around the best chromosome from the previous generation. Each generation randomly selects a new IPLS value within a defined range (e.g., Generation 1, IPLS: 6%; Generation 2, IPLS: 9%; … Generation 100, IPLS: 10%).
This method targets the prime solution domain from the preceding generation, acquiring values within the range of:
min I P L S = 1 % : max IPLS = max I n P e r min I n P e r + 1
The decision-maker sets IPLS boundaries that meet the requirements of minimum and maximum ingredient percentages:
f o r   t h e   IPLSB 1 : IPLSB 1 min I n P e r a n d   f o r   t h e   IPLSB 2 : IPLSB 2 max I n P e r
The IPLSB1 and IPLSB2 limits derived from the process outlined above serve as the updated constraints for the new Biodiesel production. Enforcing these bounds ensures the creation of viable mixtures.
The present fuel mixture approach provides the following advantages:
  • Focusing on last-generation best solutions (10% N) and leveraging them in next-generation production.
  • The frame ± I, which leads to a faster optimal solution convergence, implements the local search method.
  • Mutation operator prevents the GA from a premature convergence in a semi-optimal solution of moderate-quality fuel.
In summary, all GA parameters were carefully selected following thorough experimentation and the evaluation of over 100,000 simulations. Their efficacy remains on par with contemporary methods, yielding superior outcomes.

3.3. GA—Chromosome Representation

The effectiveness of the proposed GA methodology was assessed through two distinct sets of experiments categorized by mixture temperature: 5 °C, 10 °C, 15 °C, 20 °C, and 25 °C (referred to as sets henceforth):
(a) Set 1—Focused on Cost:
Within Evaluation Function TMFV, the weight value w1 exceeds or equals 50%, denoted as w1 ≥ 50% (Table 2).
(b) Set 2—Focused on Density:
Within Evaluation Function TMFV, the weight value w2 surpasses or equals 50%, denoted as w2 ≥ 50% (Table 2).
(c) Combination of Set 1 and Set 2:
The population size was fixed at 200, with 300 generations, and the costs of ingredients were set to diesel at 2.0000 EUR/L and biodiesel at 0.8091 EUR/L. The ingredient densities were diesel at 0.8191 g/mL and biodiesel at 0.8855 g/mL at 5 °C. Ingredient density varies based on temperatures between 5 and 25 °C (Table 3).
(d) The top 10% best-performing chromosomes from the preceding evaluated generation were directly carried over to the subsequent generation.
(e) The Crossover operator generated 70% of the population, adjusted by the IPLS value, randomly defined per generation within a range of ±5% to 10%.
(f) The Mutation operator was applied to the remaining 20% of chromosomes.
(g) Each experiment comprised 1000 independent simulations per Set and temperature (e.g., Set 1: 5 °C-1000 iterations, Set 1: 10 °C-1000 iterations, …, Set 2: 25 °C-1000 iterations).
In summary, comprehensive experimentation yielded the aforementioned configurations. The algorithm was implemented in the Matlab R2022a environment and executed on an AMD Ryzen 3 2200 G with Radeon Vega Graphics 3.50 GHz and 8.00 GB RAM. Biodiesel, as the secondary ingredient, is comprised of sources from 50% animal fat and 50% vegetable origin. The prices of vegetable origins (rap oil and sun oil) are globally available [42,43].
Table 2 categorizes the experimental sets according to temperature parameters ranging between 5 and 25 °C, distinguishing between sets emphasizing Cost (Set 1: w1 ≥ 50%) and Density (Set 2: w2 ≥ 50%). For instance, settings such as w1 = 70% and w2 = 30% prioritize Cost, as the cost criterion holds greater weight than the density criterion.
Further experimental details are outlined in Table 3. Diesel and biodiesel are priced at 2.000 EUR/L and 0.8091 EUR/L, respectively, while their densities range from 0.8191 g/mL to 0.8915 g/mL, varying with temperature. Additionally, the proportions of ingredients in the mixtures are specified. Diesel percentage ranges from 1% to 99%, and biodiesel percentage ranges from 1% to 30%. The values presented in Table 3 reflect the availabilities and current prices observed during the laboratory experiments.

3.4. Experimental Results

Initially, the suggested GA approach was applied to Set 1, involving 25,000 individual simulations per temperature (ranging between 5 and 25 °C) and weight combinations (w1 and w2). This process spanned a duration of 3925.80 s (equivalent to approximately 65.43 min or approximately 1.09 h).
Table 4 presents these experimental results from temperatures 5 °C to 25 °C, with columns information: w1 and w2 weights combination, diesel ingredient percentage in the mixture, biodiesel ingredient percentage in the mixture, evaluation function value of mixture, mixture cost, and mixture density. Weights w1 and w2 always sum up to 100% and w1 ≥ 50% due to the Emphasis on Cost criterion. Diesel ingredient percentage ranges between 74.89% and 75.02%, while biodiesel ingredient percentage amounts to 24.98–25.11%. Evaluation Function values stand from −0.0771 to 0.7007.
A positive evaluation function value provides more influence on the cost criterion than the density criterion. On the other hand, a negative evaluation function value emphasizes the density criterion than the cost criterion. The Evaluation Function values in all groups are positive, except for w1 = 50% and w2 = 50%, which is negative but close to 0 value, which, as a result, provides a neutral criterion assessment. All the other groups offer clear priority to the cost criterion.
Regarding cost criterion values, the new fuel mixtures cost between 1.6976 EUR/L and 1.7386 EUR/L. The last information concerns density criterion values that range from 0.8340 g/mL–0.8395 g/mL, satisfying the ASTM D1298-99 limits: 0.8200 g/mL–0.8450 g/mL.
Each row in Table 4 provides details regarding the best mixture determined from 1000 independent simulations (totaling 25 optimal mixtures). The evaluation is centered around the minimum Total Mixture Function Value (TMFV). As the weight of w1 increases, the TMFV value increases as well, signifying a greater emphasis on the cost criterion over the density criterion. There are slight variations in the percentages of ingredients, cost, and density among the optimal mixtures, as mentioned previously. Each experiment suggests an optimal solution—a biodiesel mixture (determined by temperature along with w1 and w2). The lowest TMFV value was achieved in Set 1 at a temperature of 5 °C with w1 = 50% and w2 = 50%.
A statistical analysis of the optimal solution in Set 1 follows.
Set 1 (temperature 5 °C, w1 = 90%, w2 = 10%) Optimal Mixture:
  • Diesel percentage: 74.95%
  • Biodiesel percentage: 25.05%
  • TMFV: 0.6322
  • Mixture Cost: 1.6976 EUR/L
  • Mixture Density: 0.8378 g/mL
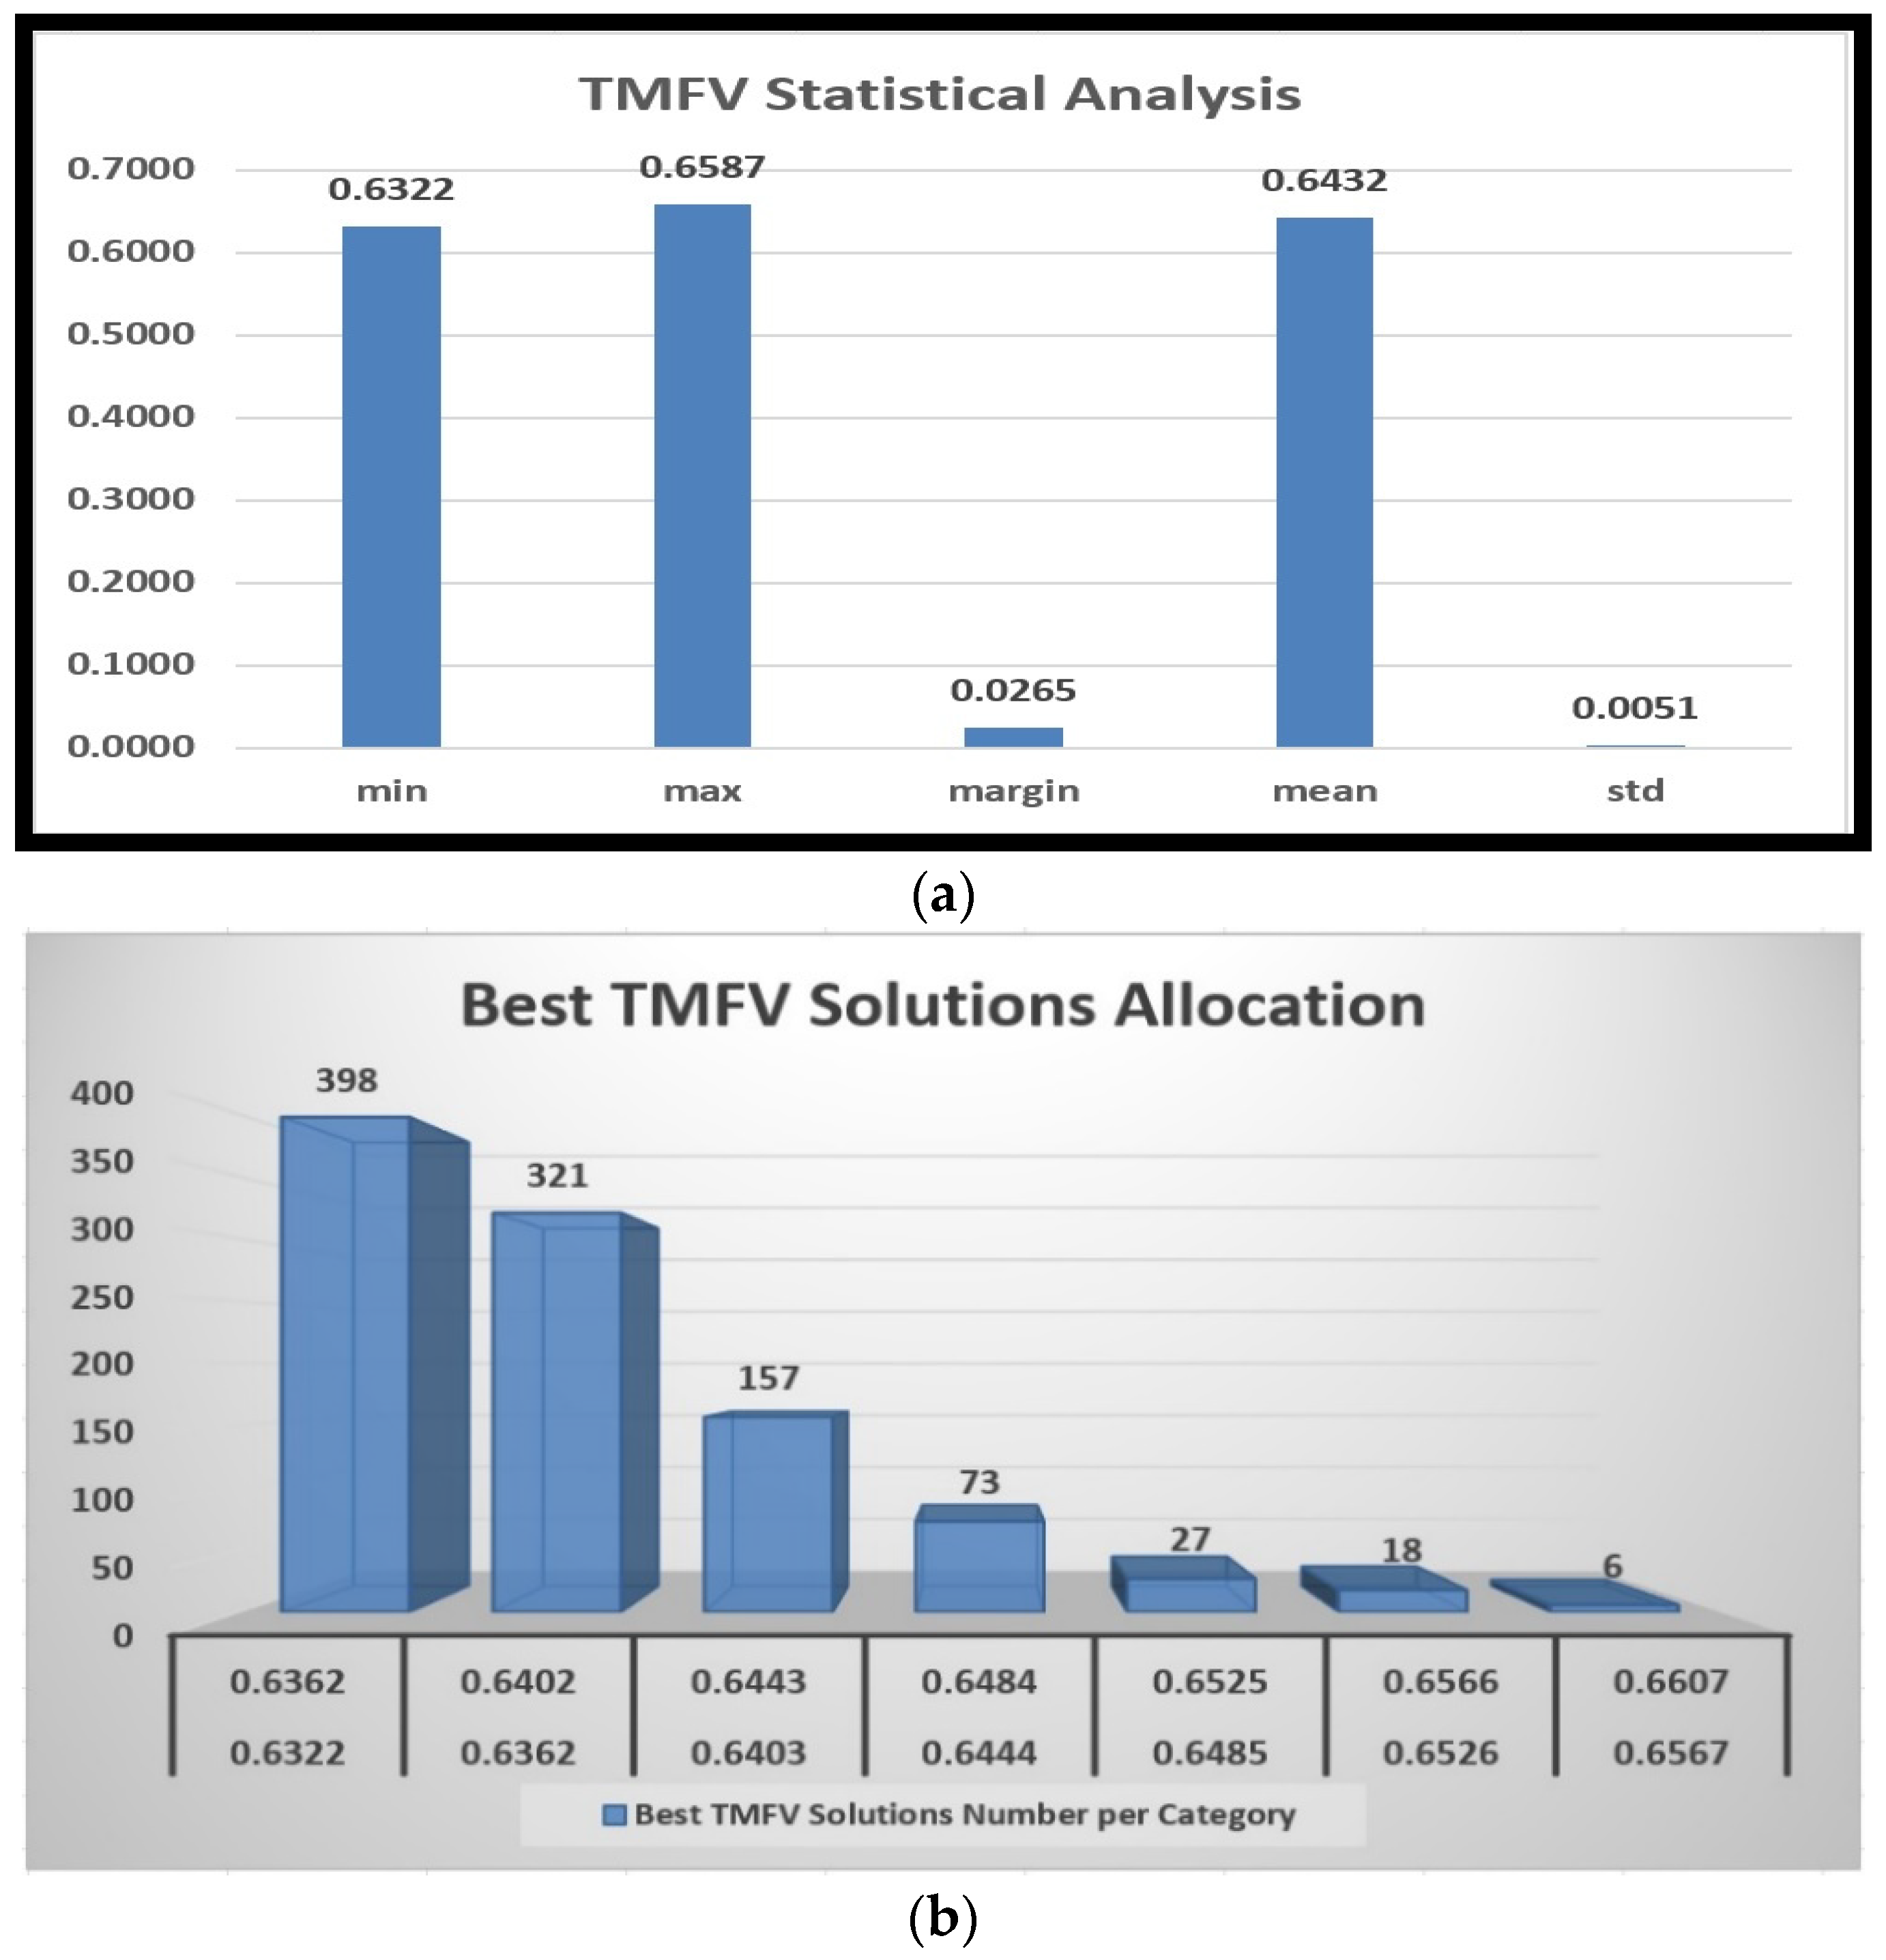
In a series of 1000 separate trials, the lowest Total Mixture Function Value (TMFV) recorded was 0.6322, while the highest TMFV reached was 0.6587. The difference between the minimum and maximum TMFV values is 0.0265. Meanwhile, the average TMFV across all trials stands at 0.6432, with a standard deviation of 0.0051 (refer to Figure 3a).
The performance of the approach is illustrated in Figure 3b, revealing that the majority of optimal solutions, comprising 764 mixtures (equivalent to 94.9% of the total), fall within the range of 0.6322 to 0.6484 TMFV (with 0.6322 being the minimum TMFV). This outcome underscores the effectiveness of the GA in generating solutions closely aligned with the Min fitness function within a short timeframe. Conversely, on the basis of the allocation of best solutions, only 51 mixtures (comprising 5.1% of the total) lie within the range of 0.6485 to 0.6607 TMFV (with 0.6587 being the maximum TMFV).
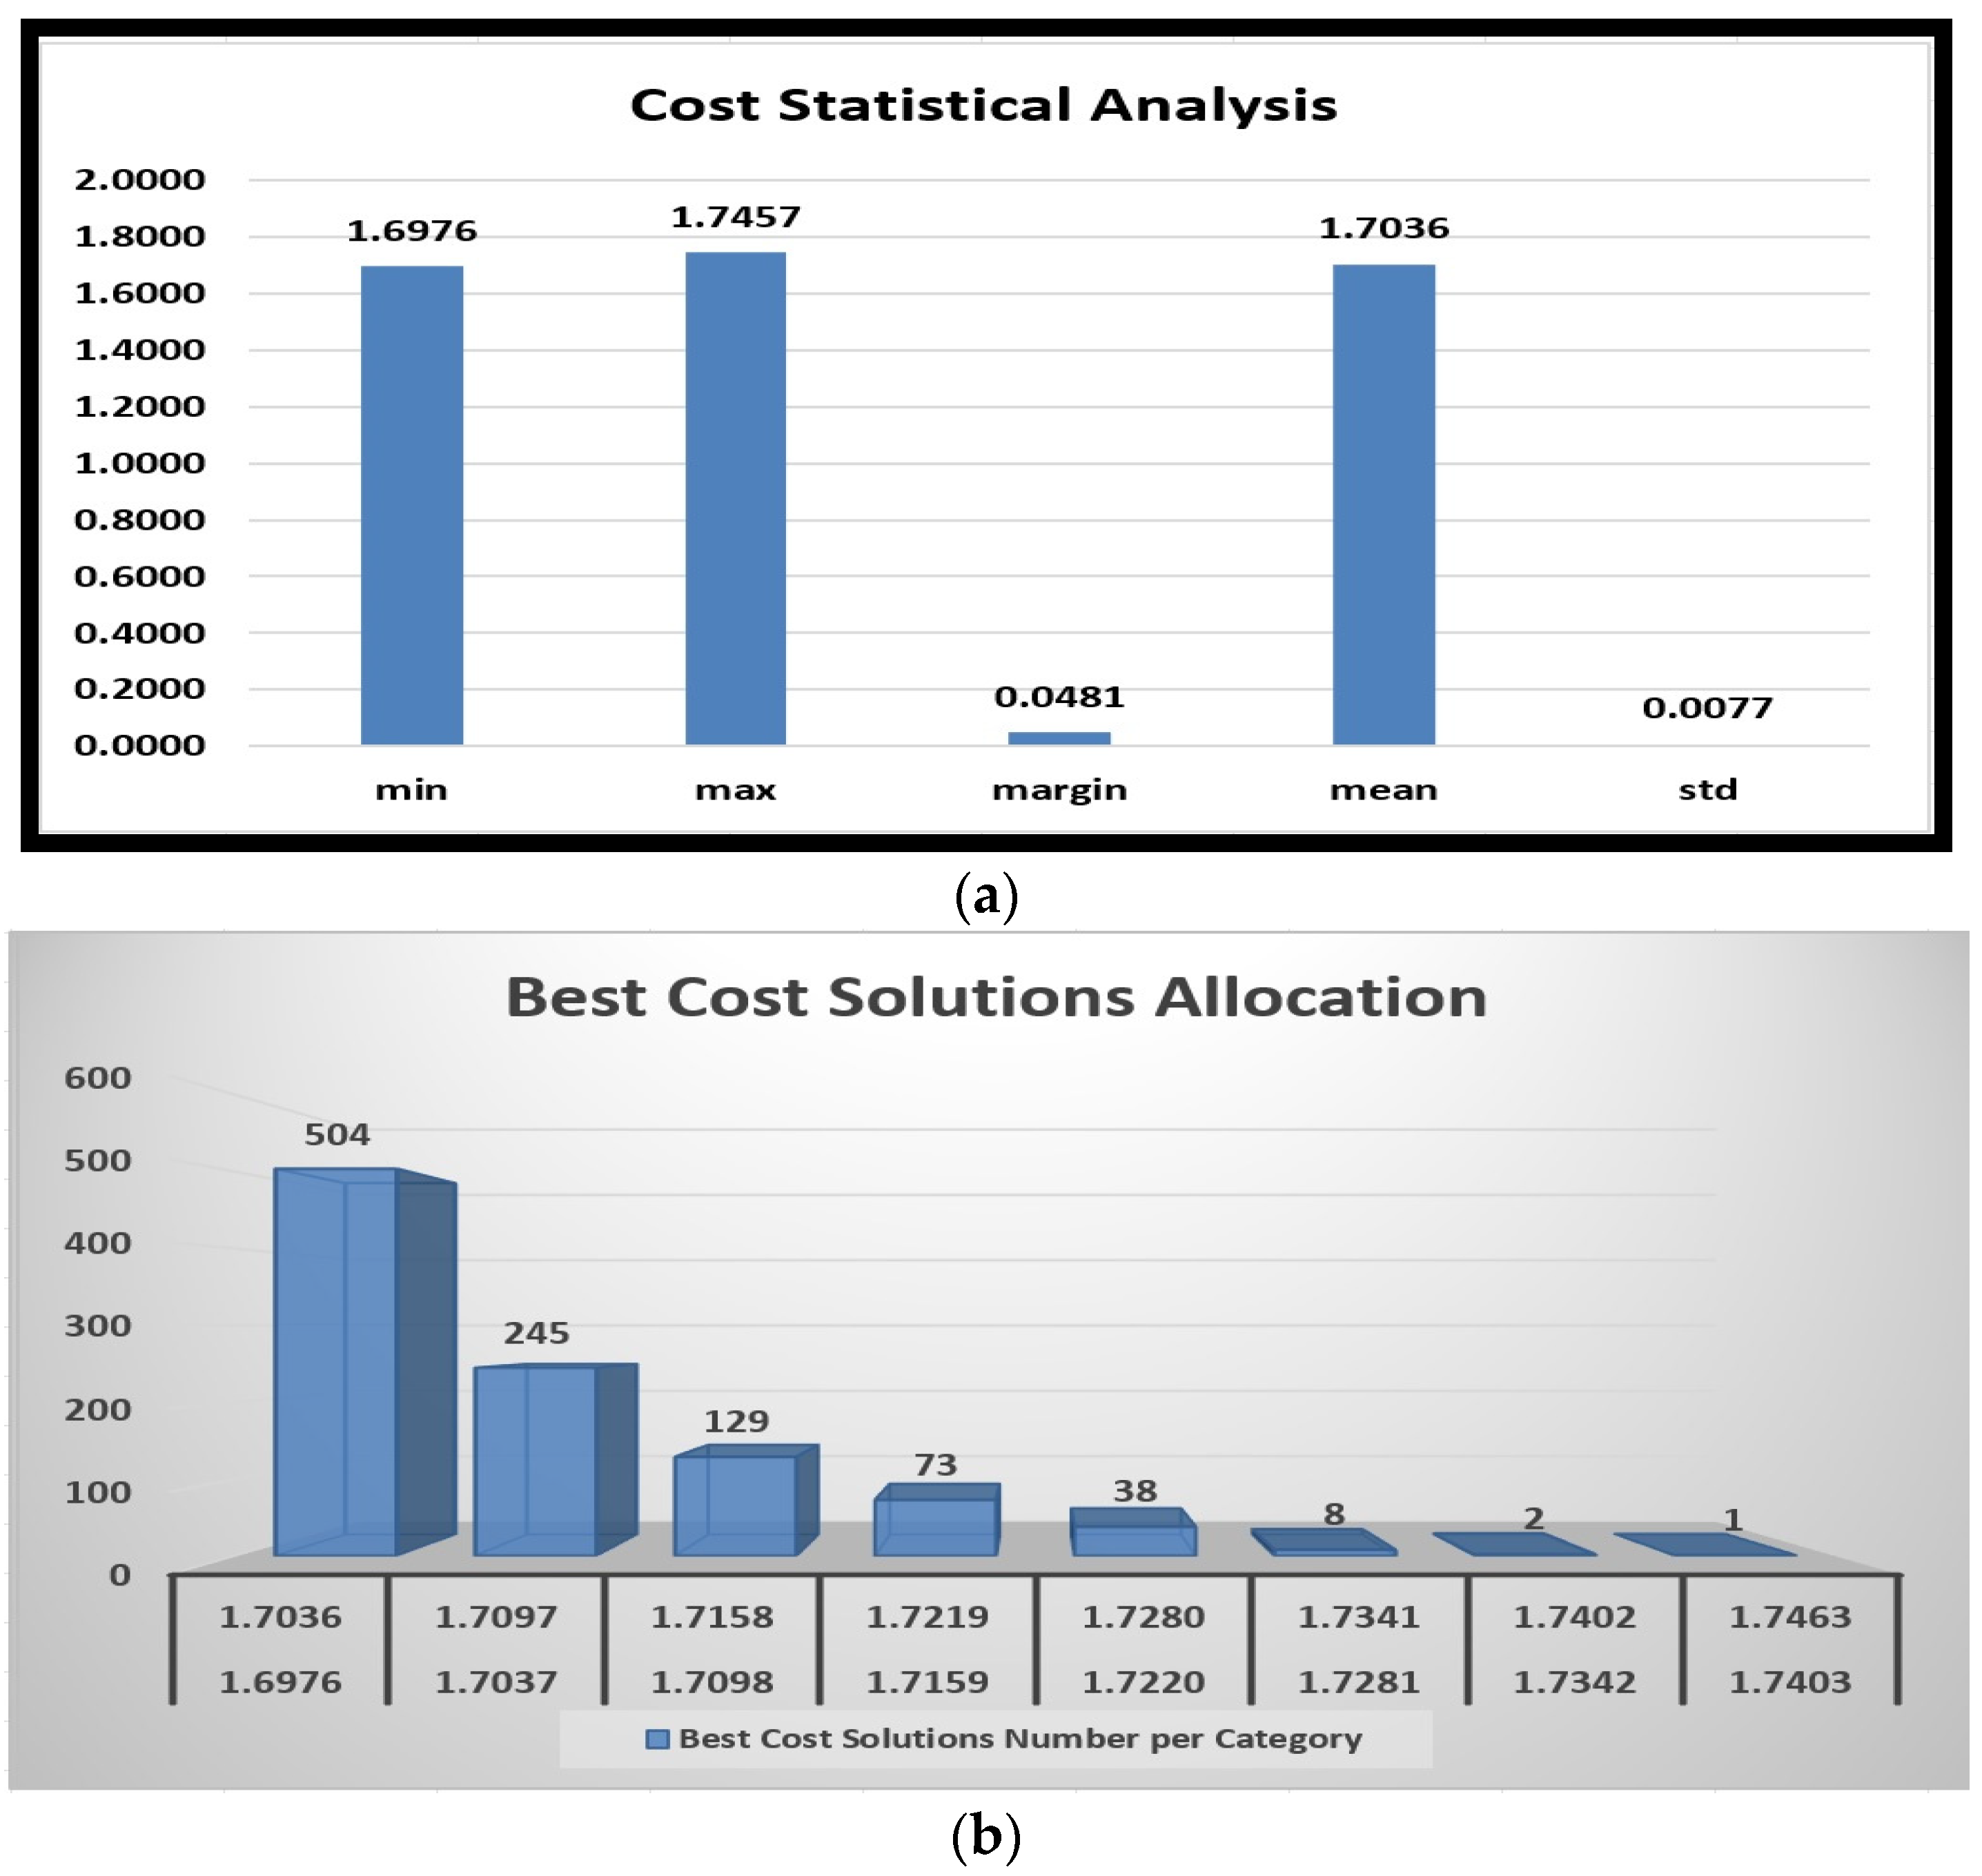
Regarding the cost of mixtures, a series of 1000 separate experiments suggest a 1.6976 EUR/L minimum and a 1.7457 EUR/L maximum mixture cost. The difference between the minimum and maximum costs is 0.0481. Meanwhile, the average mixture cost across all experiments stands at 1.7036 EUR/L, with a standard deviation of 0.0077 (as depicted in Figure 4a).
The allocation of Best Cost solutions is presented in Figure 4b. For most best solutions, 877 mixtures (951 = 504 + 245 + 129 + 73) or 95.1% are between 1.6976 EUR/L and 1.7219 EUR/L (minimum mixture cost 1.6976 EUR/L). The above results confirm the GA’s effectiveness in providing fuel costs close to the minimum value. Based on the best solutions, the allocation of only (49 = 38 + 8 + 2 + 1) mixtures (4.9%) was between 1.7220 EUR/L and 1.7463 (maximum mixture cost 1.7457 EUR/L).
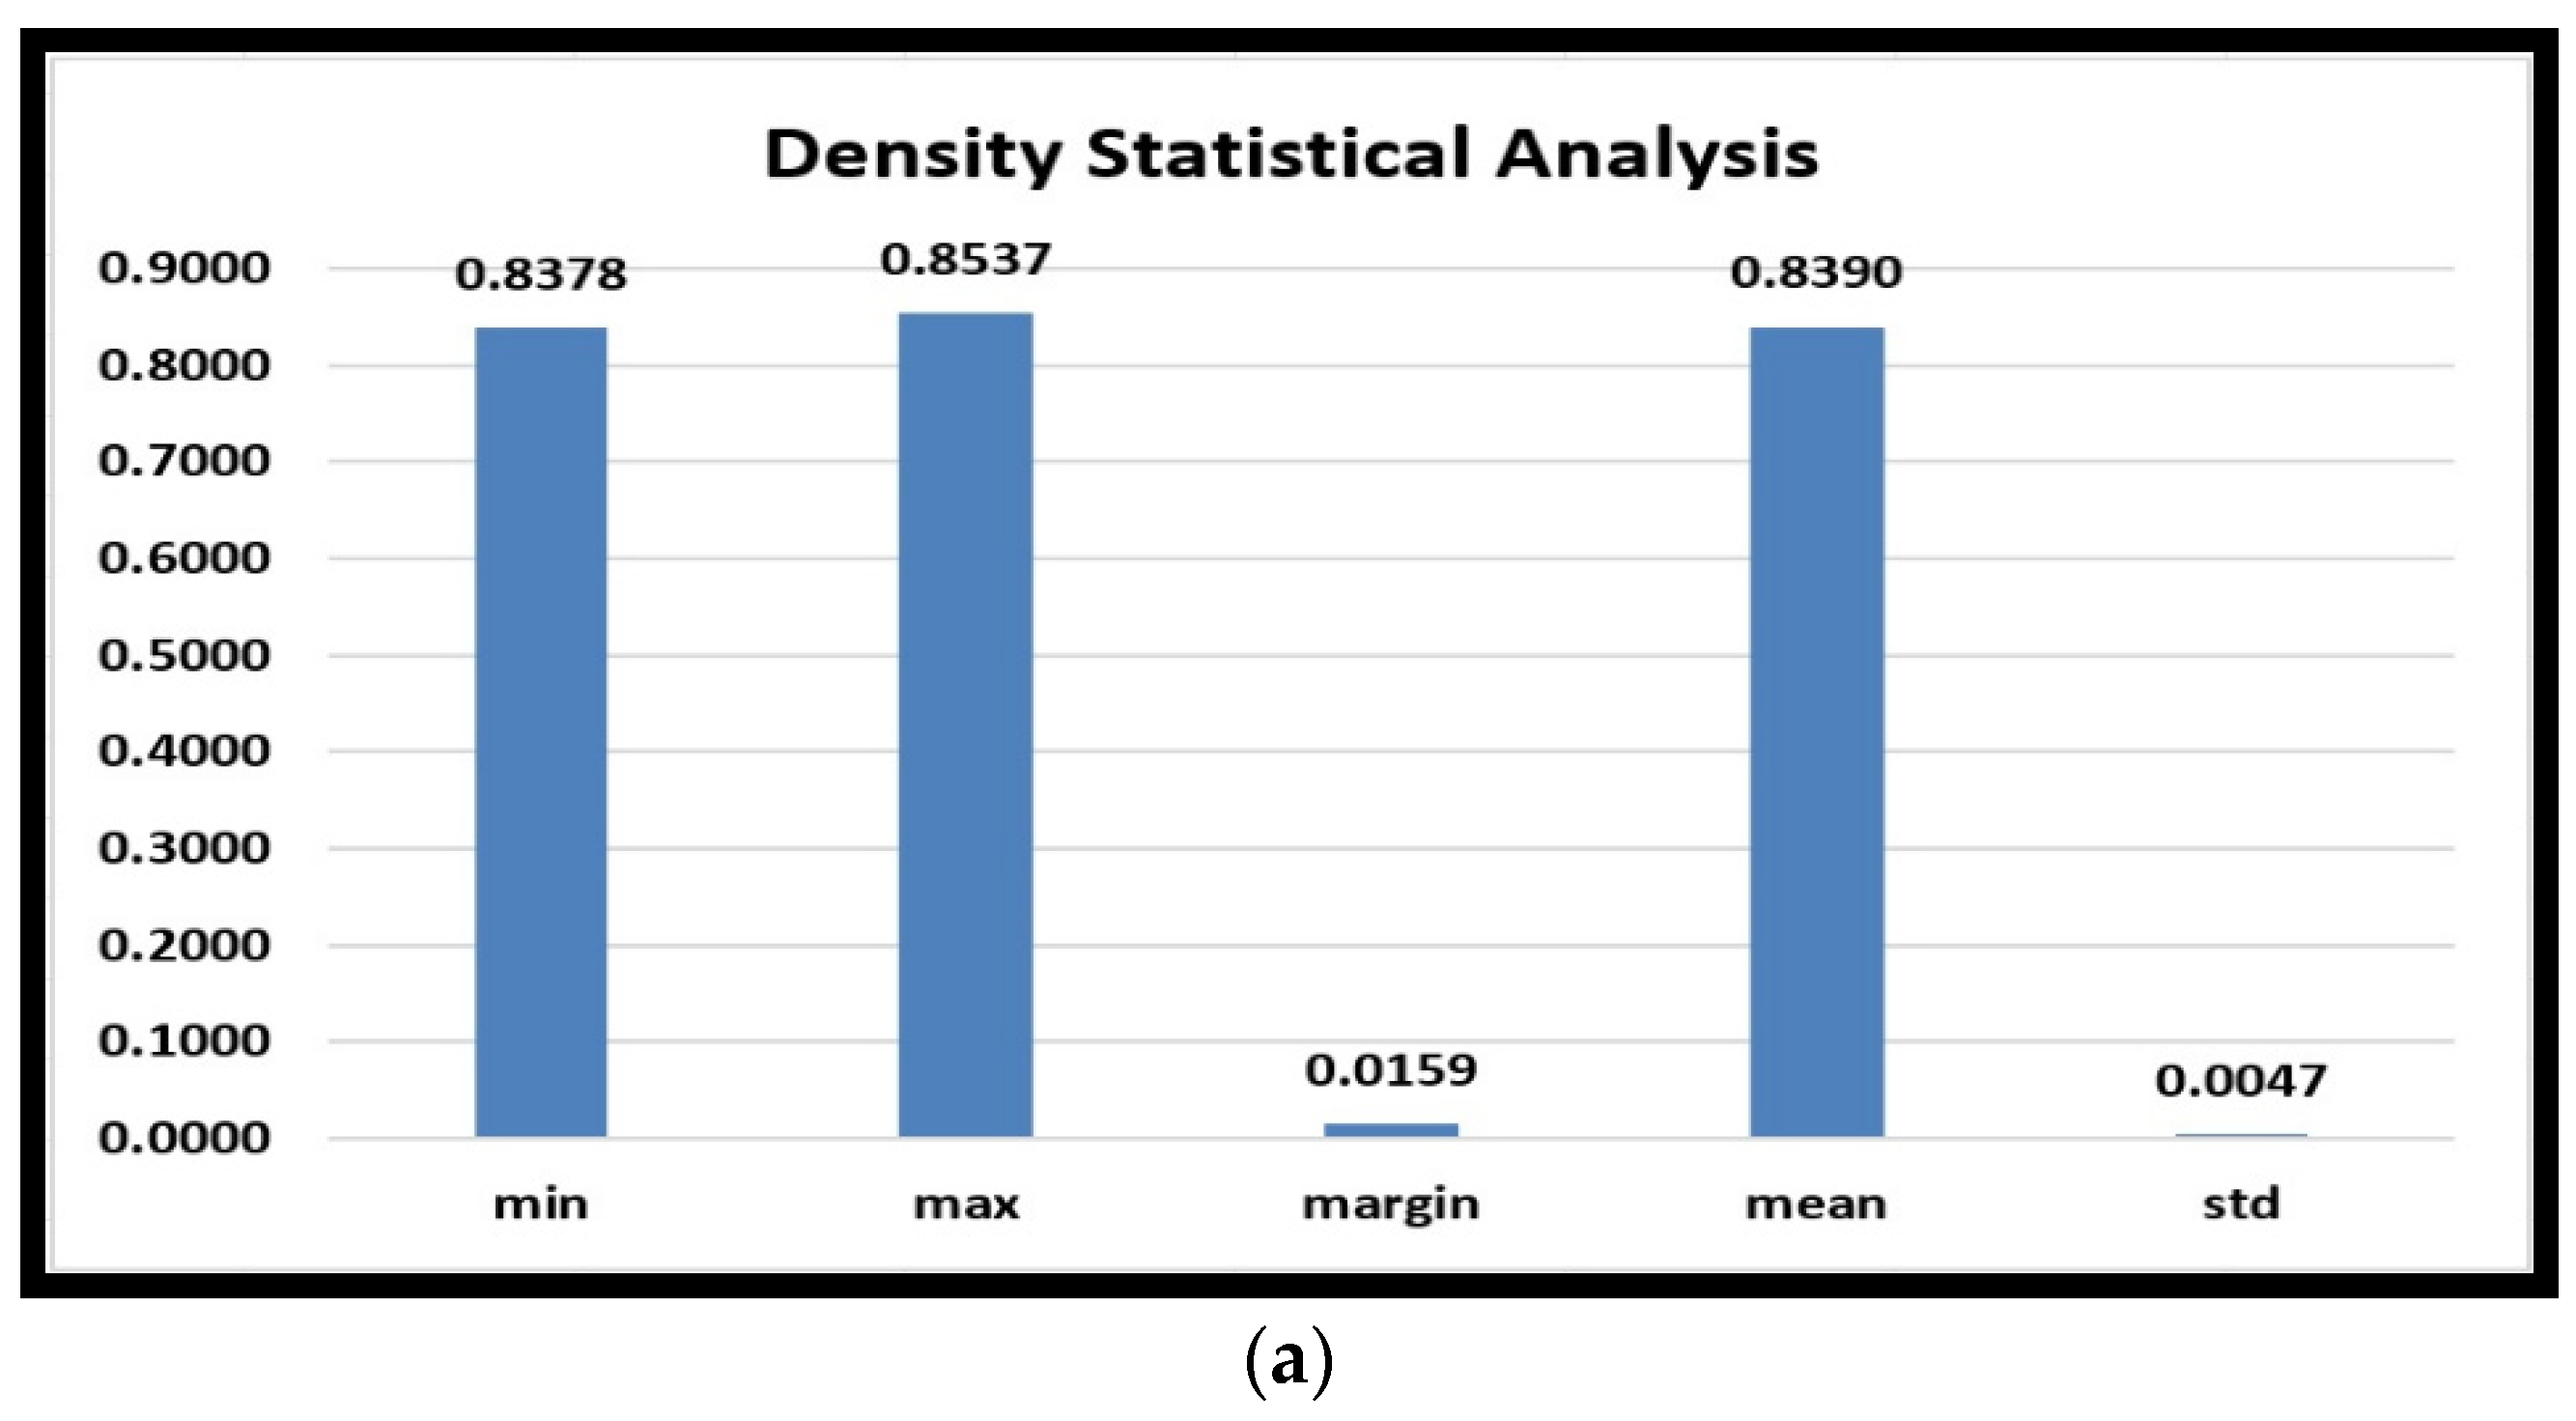
In terms of mixtures’ density, a series of 1000 independent experiments indicate a minimum mixture density of 0.8378 g/mL and a maximum mixture density of 0.8537 g/mL. The difference between the minimum and maximum densities is 0.0159. The average mixture density across all experiments is 0.8390 g/mL, with a standard deviation of 0.0047 (as shown in Figure 5a).
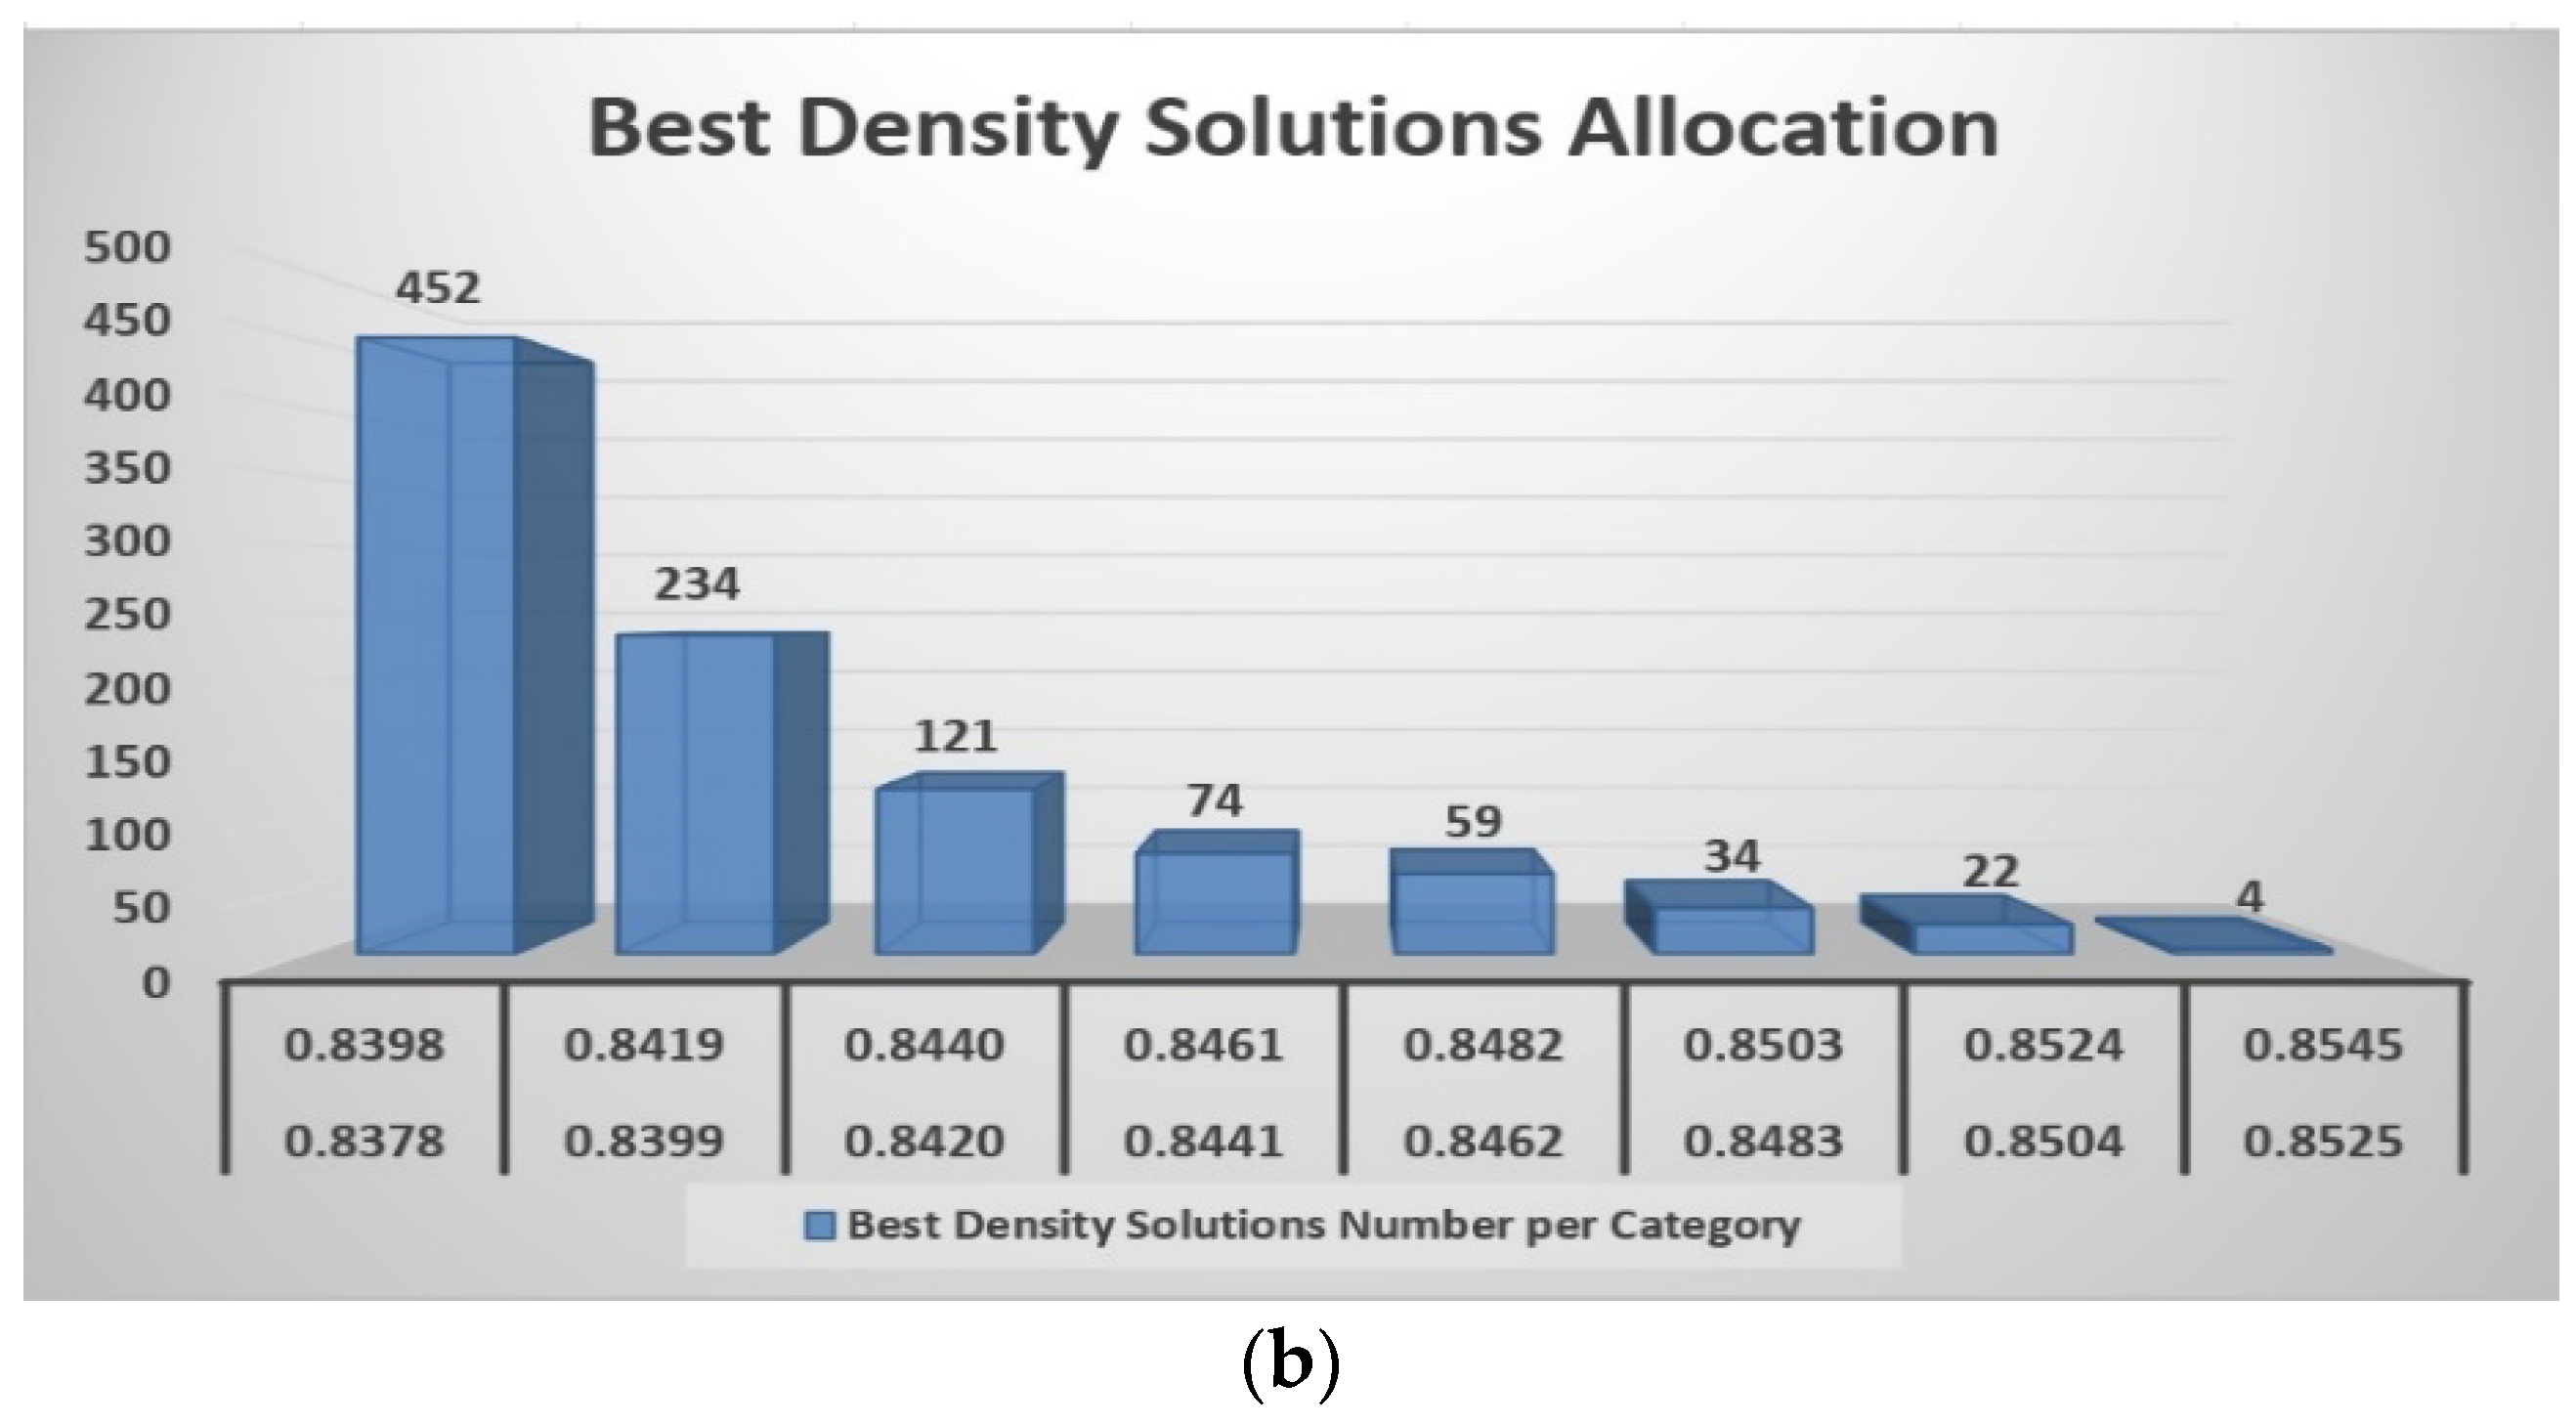
The allocation of Best Density solutions is presented in Figure 5b. Most best solutions, 881 mixtures (881 = 452 + 234 + 121 + 74) or 88.1% is between 0.8378 g/mL and 0.8461 g/mL (minimum mixture density 0.8378 EUR/L), compared to the total 119 (344 = 59 + 34 + 22 + 4) mixtures or 11.9%, which were between 0.8462 g/mL and 0.8545 g/mL (maximum mixture density 0.8537 g/mL).
Subsequently, Set 2 underwent testing to assess the effectiveness of the proposed GA, involving 25,000 independent simulations per temperature (ranging from 5 °C to 25 °C) and various combinations of weights (w1 and w2). This testing phase lasted for a duration of 3645.34 s (approximately 60.76 min or approximately 1 h). Table 5 presents these experimental results from temperatures 5 °C to 25 °C, with columns information: w1 and w2 weights combination, diesel ingredient (%) in the mixture, biodiesel ingredient percentage in the mixture, evaluation function value of mixture, mixture cost, and mixture density.
Weights w1 and w2 always sum up to 100% and w2 ≥ 50% due to the Emphasis on Density criterion. Diesel ingredient percentage ranges between 74.89% and 75.02%, while biodiesel ingredient percentage amounts to 24.88–25.12%. Evaluation Function values range from −0.8852 to −0.0681.
The negative evaluation function value emphasizes the density criterion rather than the cost criterion.
The Evaluation Function values in all groups are negative but close to 0 value (w1 = 50% and w2 = 50%), which results in a neutral criterion assessment. All the other groups offer clear priority to the density criterion.
As regards cost criterion values, the new fuel mixtures cost between 1.6979 EUR/L and 1.7386 EUR/L. The last information concerns density criterion values range 0.8340 g/mL–0.8397 g/mL, satisfying the ASTM D1298-99 limits: 0.8200 g/mL–0.8450 g/mL.
Each row in Table 5 provides details regarding the best mixture identified from 1000 independent simulations (resulting in a total of 25 optimal mixtures). The evaluation is centered around the minimum Total Mixture Function Value (TMFV). As the value of w2 rises, the TMFV value also increases, indicating a greater emphasis on the density criterion over the cost criterion. There are slight variations in the percentages of ingredients, optimal mixture cost, and density among the optimal mixtures, as previously discussed.
A statistical analysis of the optimal solution in Set 2 follows.
Optimal Mixture in Set 2 (temperature 20 °C, w1 = 10%, w2 = 90%):
  • Diesel percentage: 74.88%
  • Biodiesel percentage: 25.12%
  • TMFV: −0.8852
  • Mixture Cost: 1.7112 EUR/L
  • Mixture Density: 0.8397 g/mL
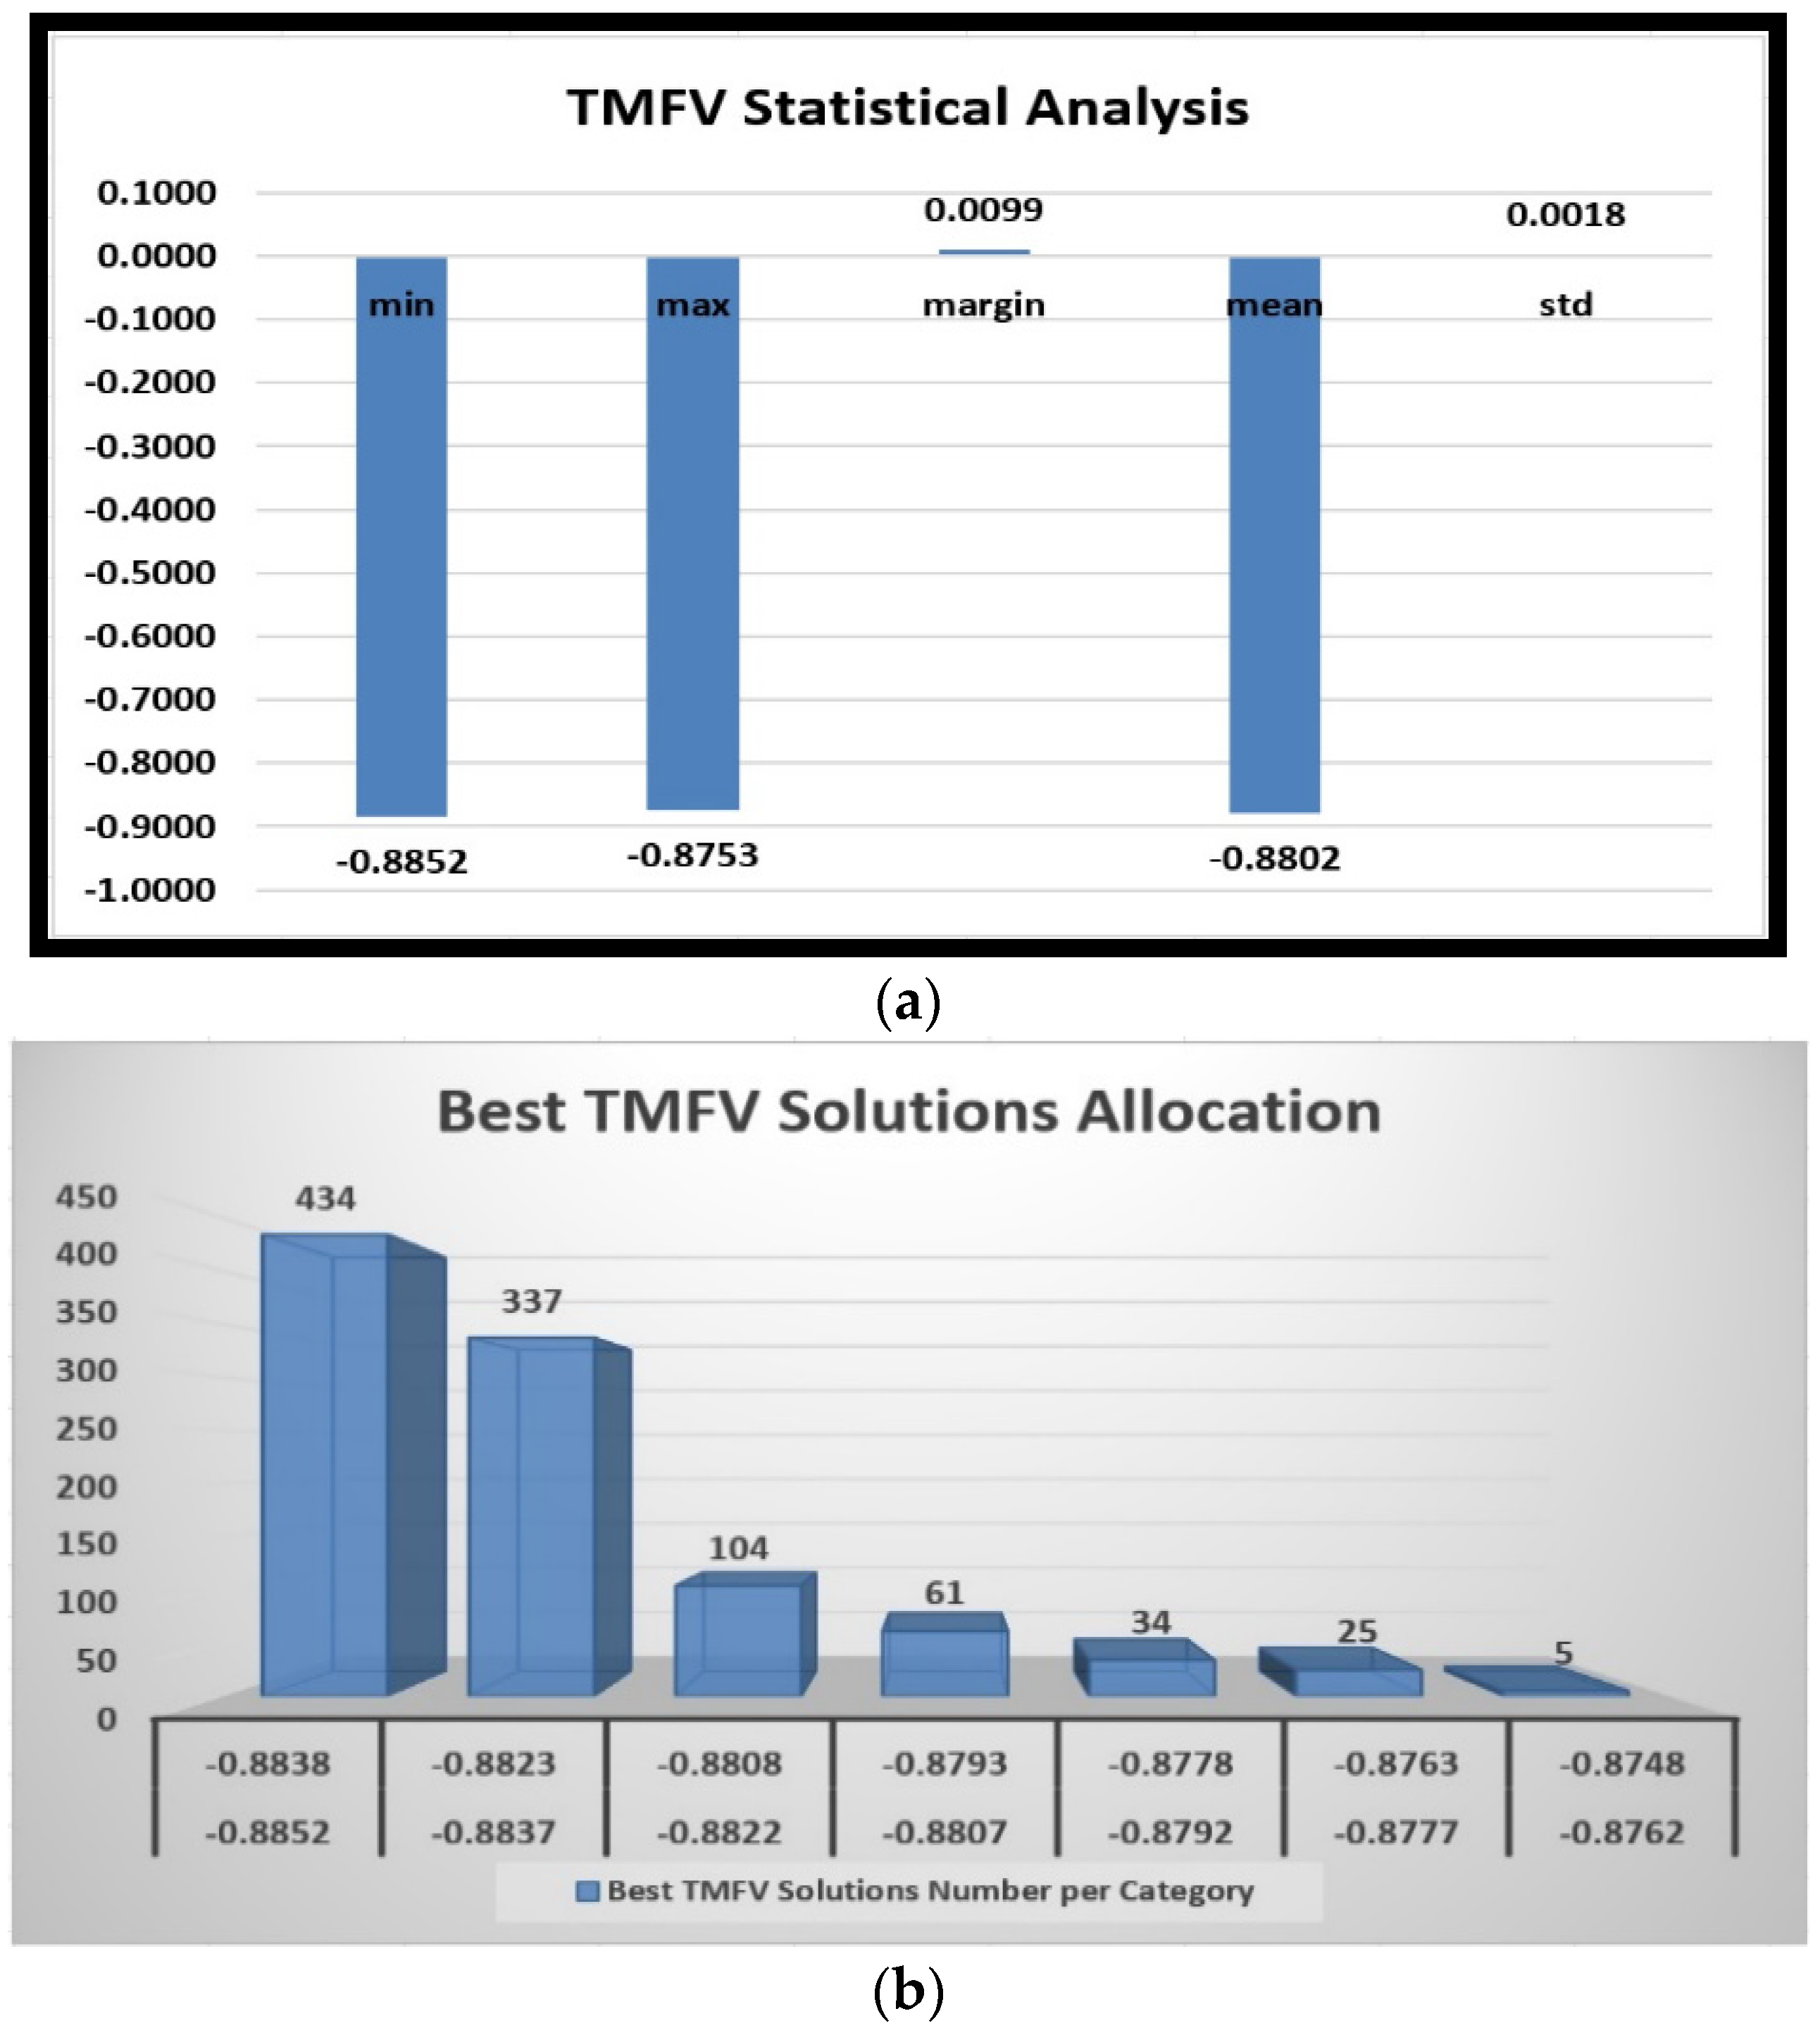
In a series of 1000 independent trials, the lowest Total Mixture Function Value (TMFV) recforded was −0.8852, while the highest TMFV reached was −0.8753. The difference between the minimum and maximum TMFV values is 0.0099. Meanwhile, the average TMFV across all trials stands at −0.8802, with a standard deviation of 0.0018 (as illustrated in Figure 6a).
The effectiveness of the method is illustrated in Figure 6b, where the majority of optimal solutions, totaling 936 mixtures (comprising 93.6% of the total), fall within the range of −0.8852 to −0.8793 TMFV (with −0.8852 being the minimum TMFV). This outcome validates the GA’s capability to generate solutions closely aligned with the minimum fitness function within a brief timeframe. Based on best solutions allocation, only 64 (64 = 34 + 25 + 5) mixtures (6.4%) were between −0.8792 and −0.8748 (maximum mixture TMFV −0.8753).
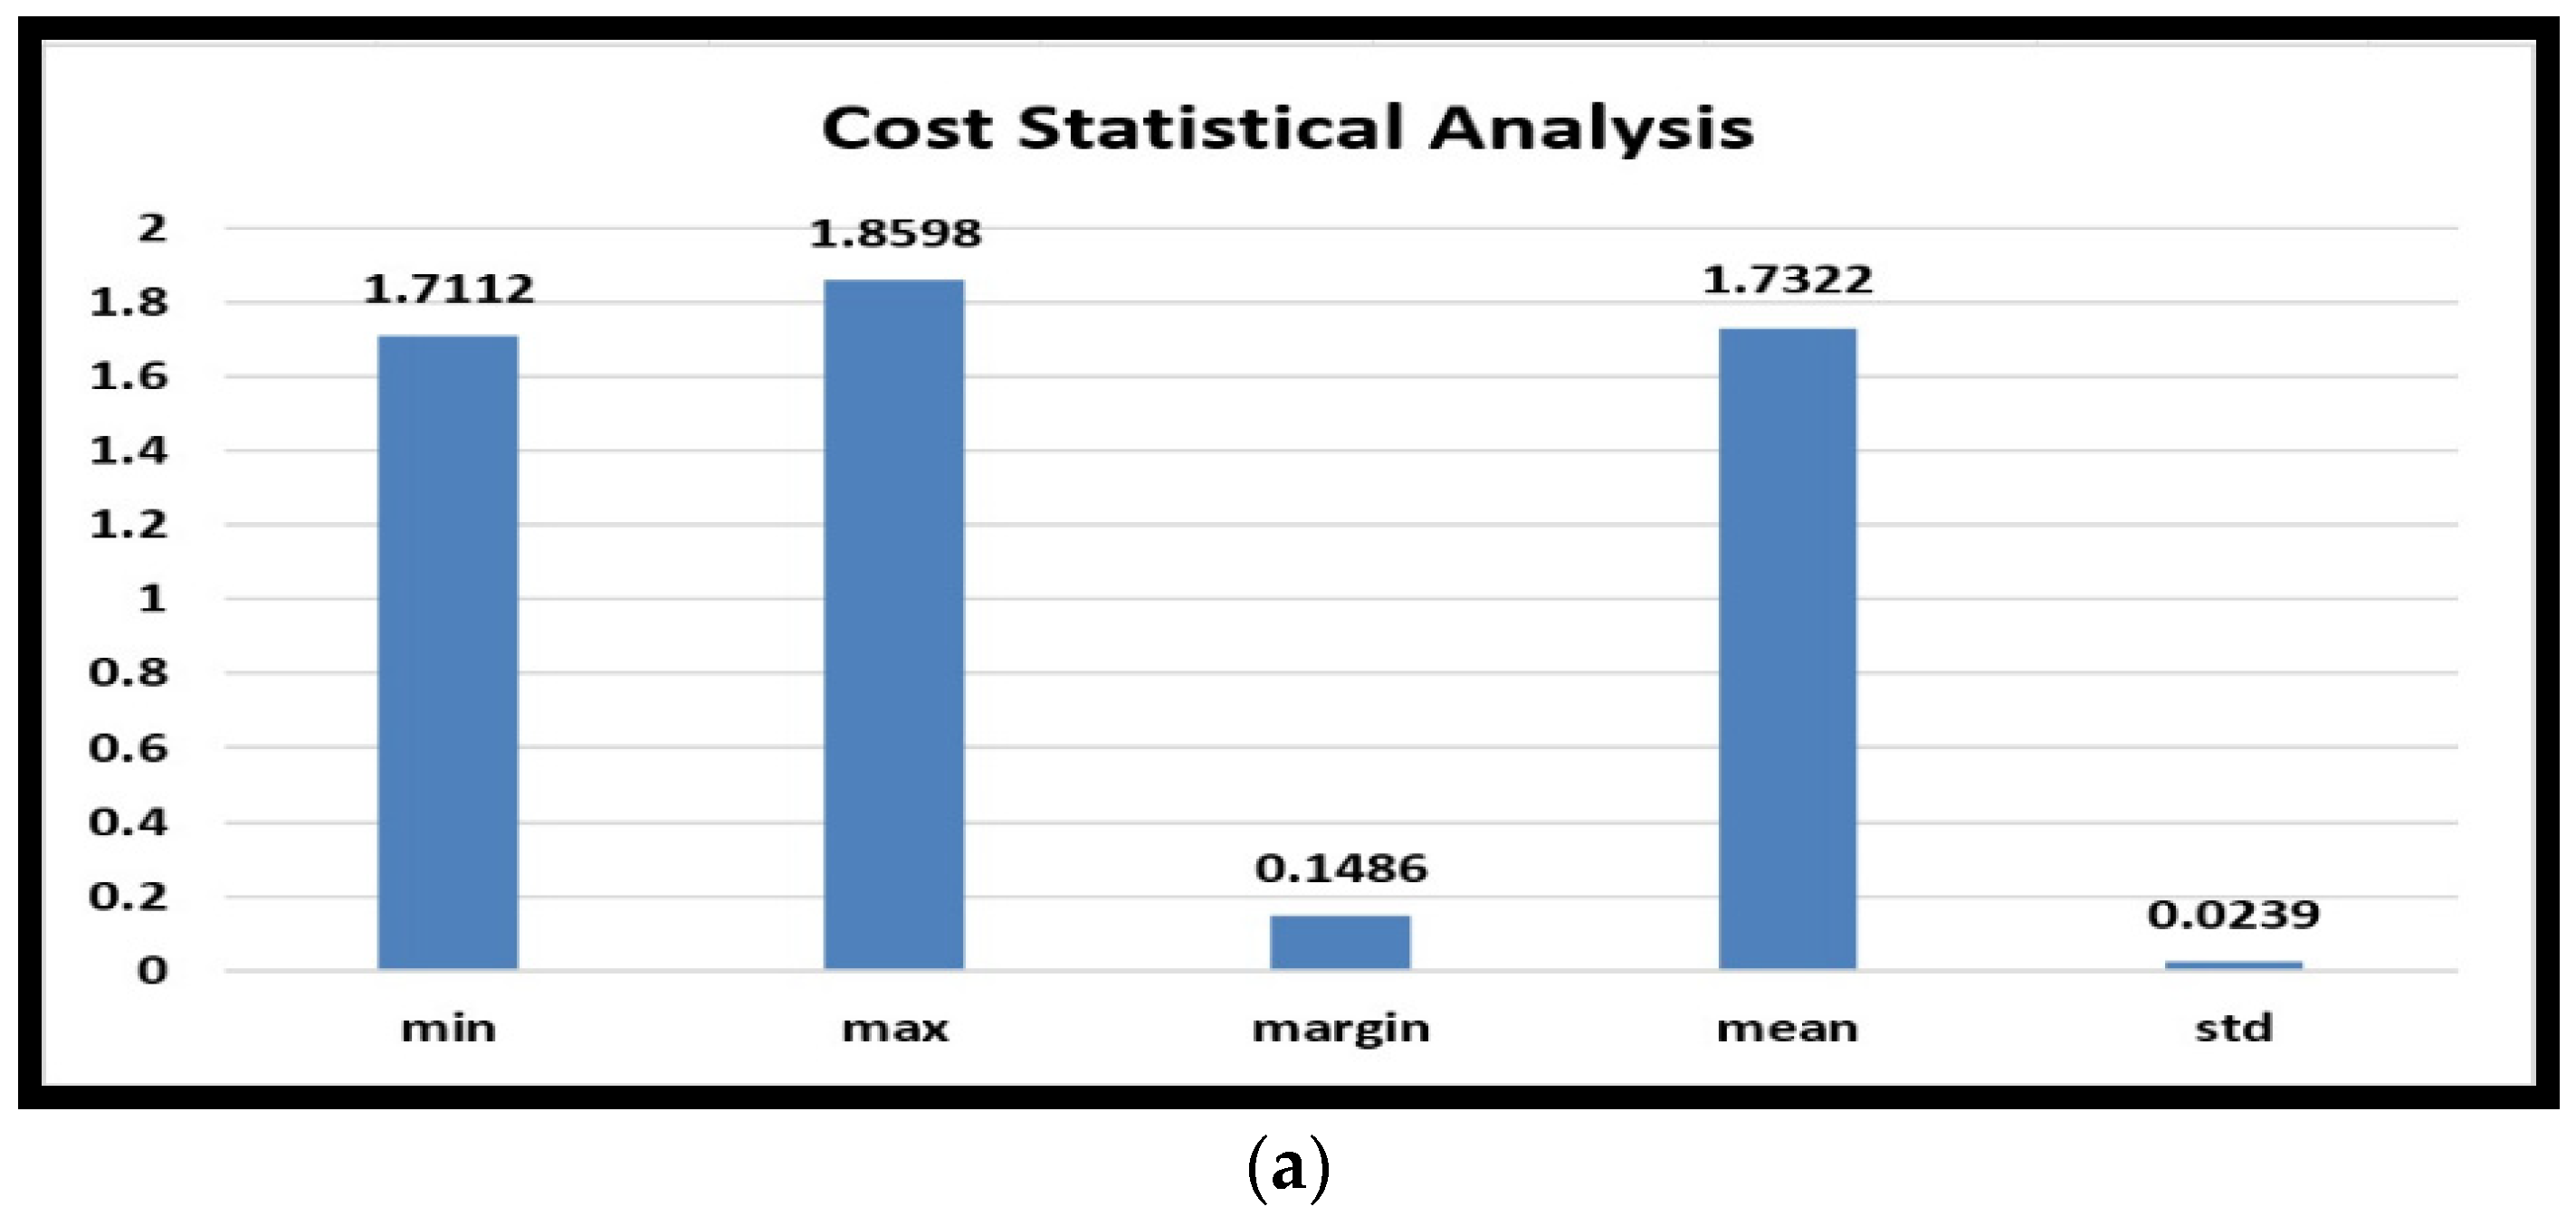
Regarding the cost of the mixtures, a set of 1000 independent experiments suggests a minimal mixture cost of 1.7112 EUR/L and a maximal mixture cost of 1.8598 EUR/L. The difference between the lowest and highest costs is 0.1486. Meanwhile, the average cost of the mixtures across all experiments stands at 1.7322 EUR/L, with a standard deviation of 0.0239 (as indicated in Figure 7a).
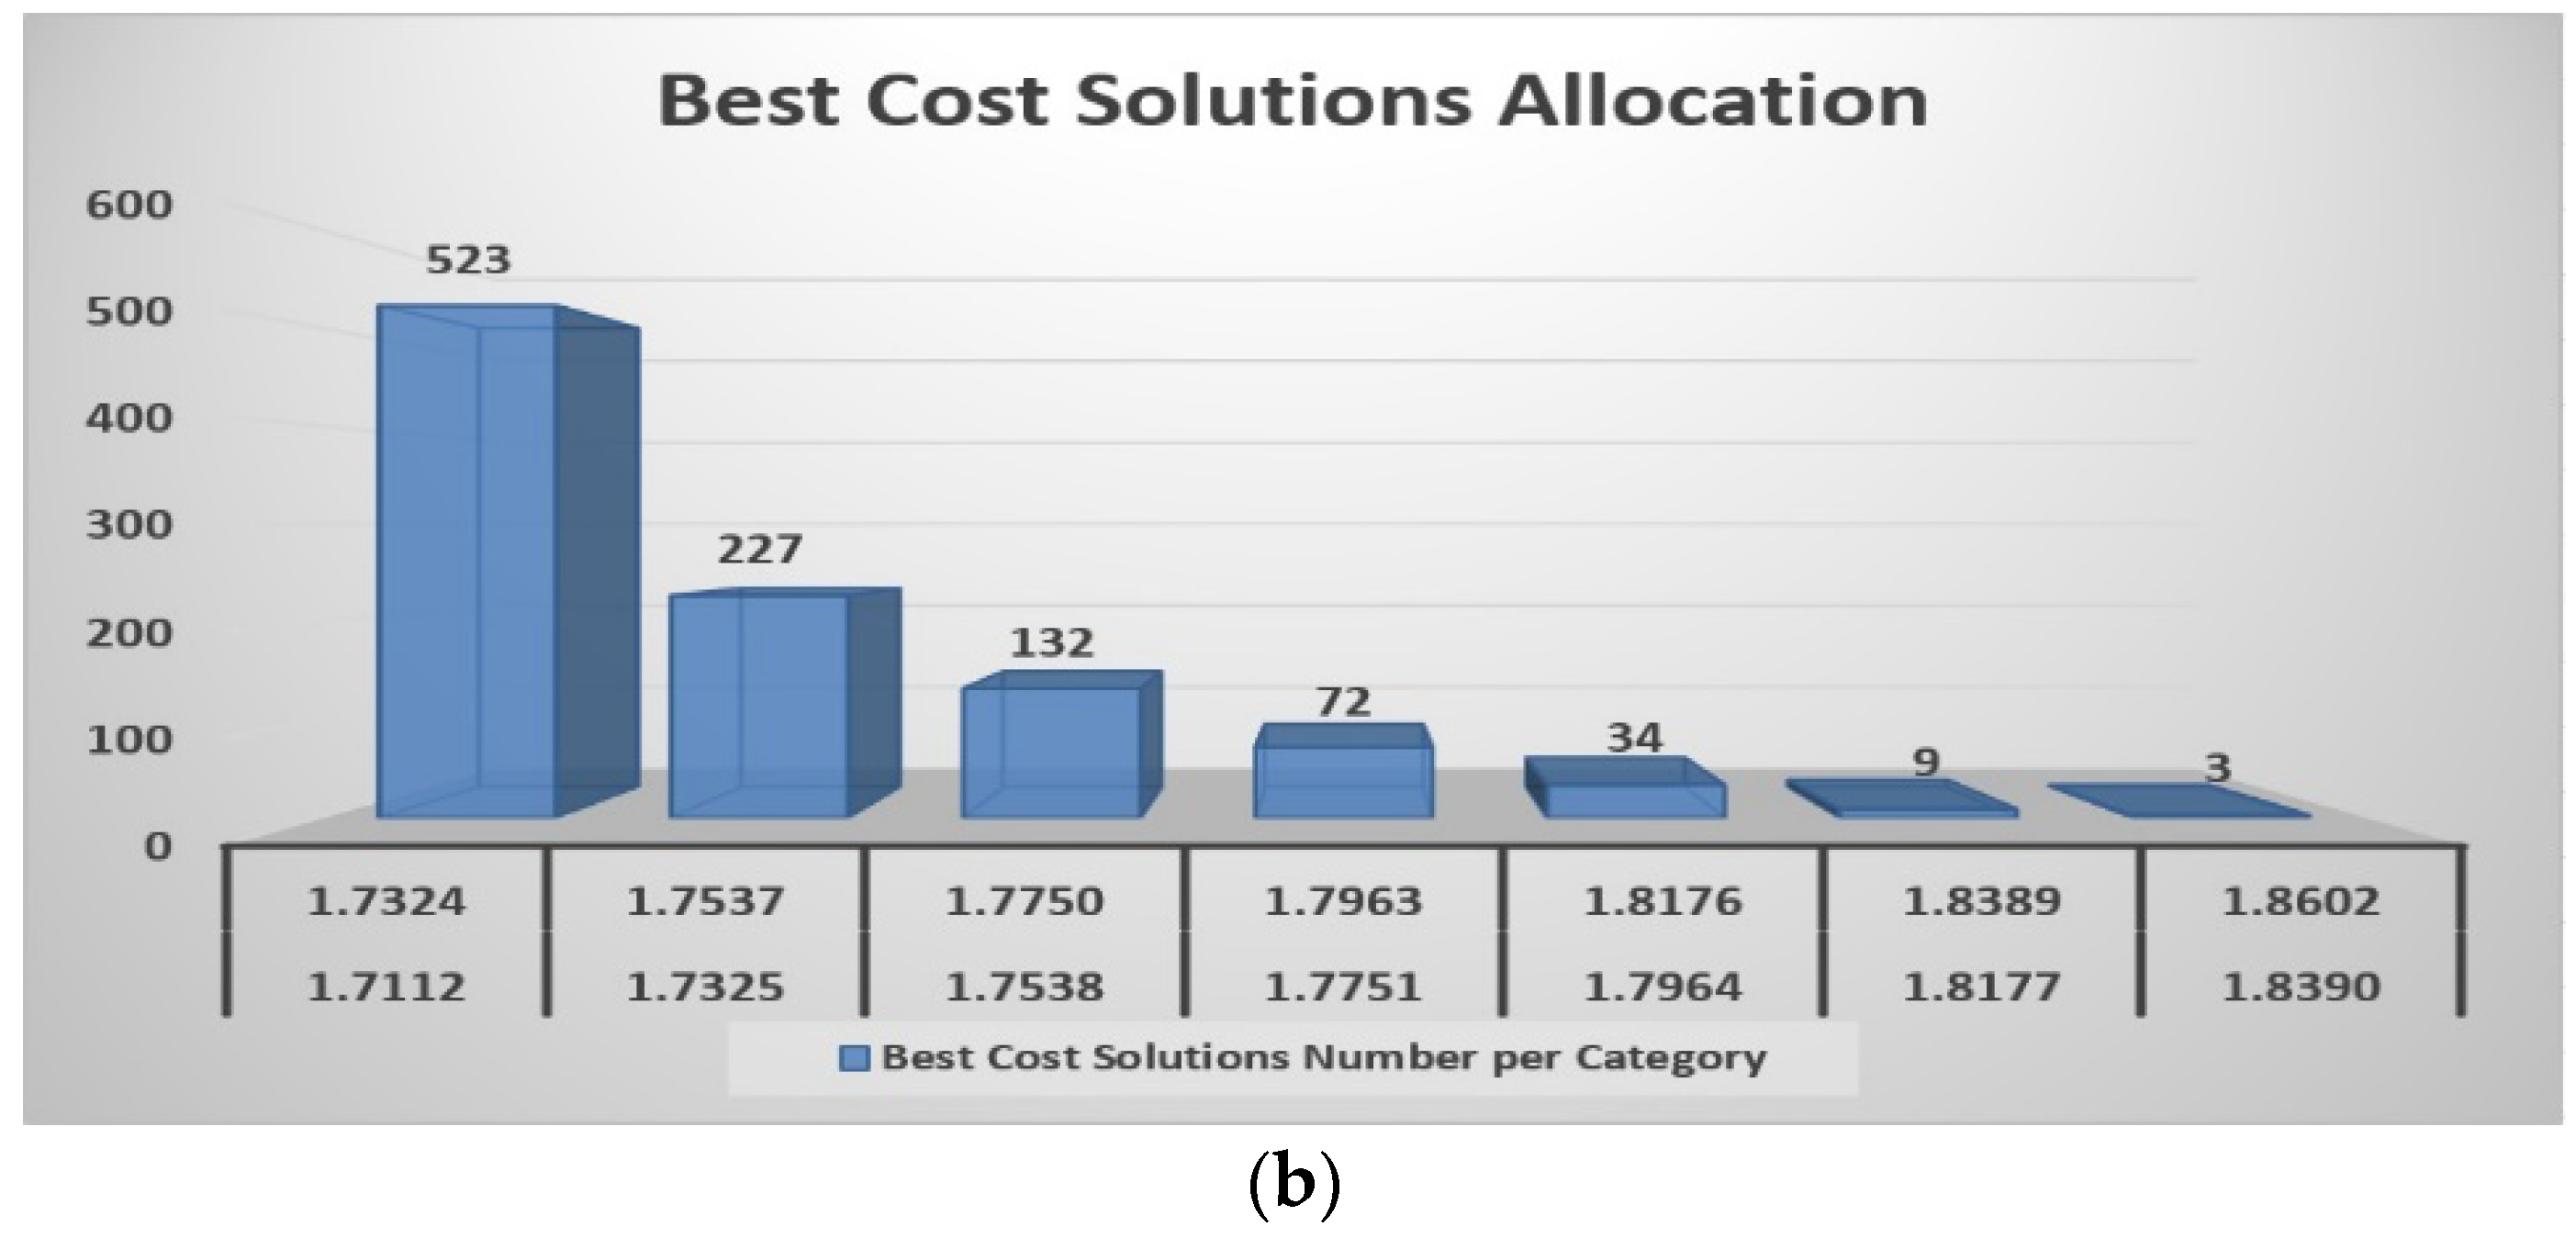
The allocation of Best Cost solutions is presented in Figure 7b. Most of the best solutions, 954 mixtures (954 = 523 + 227 + 132 + 72) or 95.4% are between 1.7112 EUR/L and 1.7963 EUR/L (minimum mixture cost 1.7112 EUR/L). The above results confirm the GA’s effectiveness in providing fuel costs close to the minimum value. Based on the best solutions’ allocation, only 46 (46 = 34 + 9 + 3) mixtures (4.6%) were between 1.7964 EUR/L and 1.8602 (maximum mixture cost 1.8598 EUR/L).
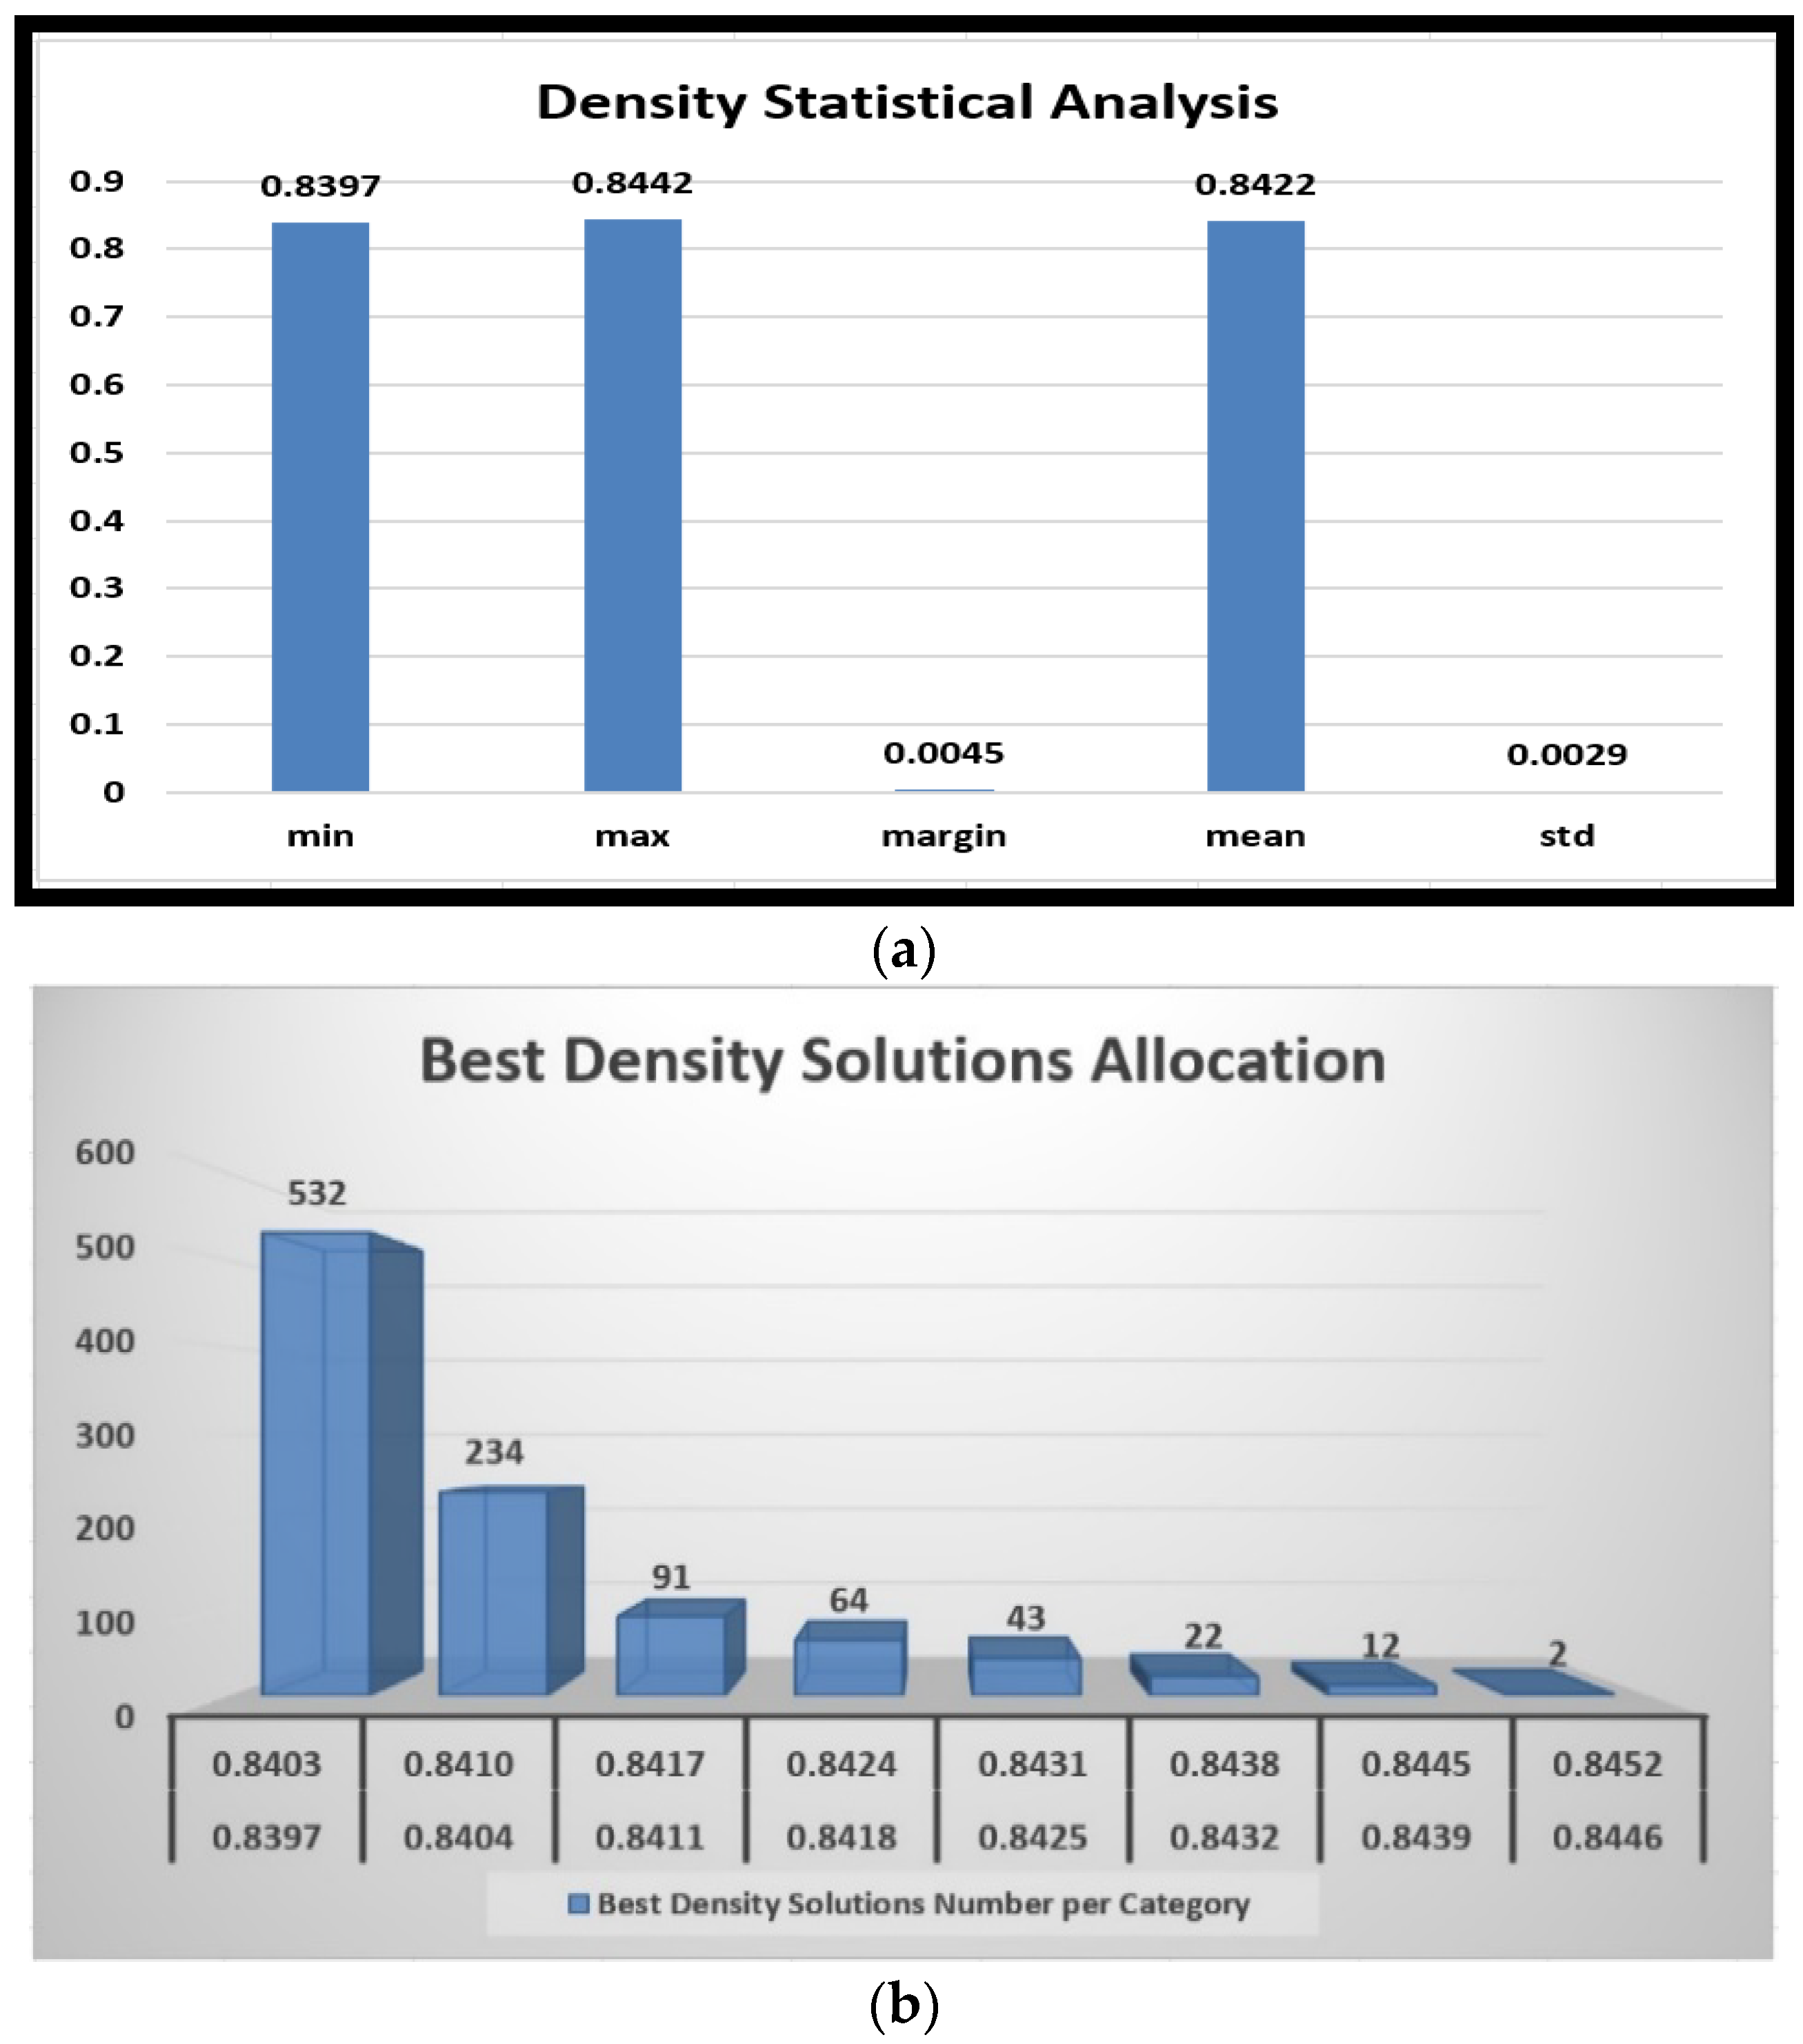
Regarding mixture density, a minimum mixture density of 0.8378 g/mL and a maximum mixture density of 0.8537 g/mL are suggested by 1000 separate trials. The mean mixture density is 0.8390 g/mL with a standard deviation of 0.0047, with a margin of 0.0159 between the minimum and maximum densities (Figure 8a).
Best Density solutions allocation are presented in Figure 8b. Most best solutions, 921 mixtures (921 = 532 + 234 + 91 + 64) or 92.1% is between 0.8397 g/mL and 0.8424 g/mL (minimum mixture density 0.8397 g/mL), compared to the total 79 (79 = 43 + 22 + 12 + 2) mixtures or 7.9%, which were between 0.8425 g/mL and 0.8452 g/mL (maximum mixture density 0.8537 g/mL).

4. Combustion of Mixtures

After studying the changes in a very important property, mixture density, we considered it to be useful to see how these mixtures behave during their combustion so as to have an overall picture of the effect of the addition of biodiesel on the production of exhaust gases that are finally released into the atmosphere. Our goal was to see if the addition of biodiesel would reduce the exhaust gases and to what extent so that, based on the density analysis of the mixtures, we could also make conclusions about the exhaust gases produced upon combustion. For this purpose, a series of experiments were carried out directly on the gaseous phase of the exhaust emissions using an Optima 7 portable flue gas analyzer (MRU GmbH, Neckarsulm, Germany), and are shown in Table 6.
Measurements:
Mixture Composition: Diesel—Biodiesel 50% vegetable—50% animal sources.
Mixture Temperature: 25 °C.
It can be seen in Table 6 that the addition of biodiesel does not deteriorate the produced percentage of exhaust gases. Therefore, it can be used in the combustion technology to create environmentally friendly fuels and, in this particular work, does not cause a problem in terms of mixture density changes.

5. Concluding Remarks

Global communities are increasingly moving away from fossil fuels and seeking environmentally friendly alternatives. In recent years, biodiesel has garnered attention due to its production from renewable and eco-friendly sources. This study introduces a novel method for biodiesel production utilizing two ingredients: diesel and biodiesel derived entirely from vegetable sources. The implementation leverages the advantages of Genetic Algorithms (GA) within Evolutionary Computation.
Two specialized operators, namely crossover and mutation, support the GA’s execution. The crossover operator explores a specific area near the optimal solution of the previous generation, while the mutation operator prevents premature convergence to suboptimal solutions or costlier fuels with lower density values.
Moreover, the Overall Mixture Performance Metric (OMPM) assesses the efficacy of novel biodiesel blends and the capability for the creation of competitive biofuel options in relation to ingredient availability. The OMPM underscores two key fuel attributes: expense and density, determined using factors w1 and w2, respectively, indicating the priority assigned to cost and density in the experimental fuel assessment process. The study entailed the exploration of optimal biodiesel blends through iterative experimentation (3 × 10⁹ blends), segmented into two groups distinguished by temperatures spanning from 5 °C to 25 °C: Group 1—“Cost Priority” and Group 2—“Density Priority”.
Table 4 and Table 5 showcase the top 25 blends per group, with the two pinnacle blends as follows:
  • Optimal Blend in Group 1 (5 °C, w1 = 90%, w2 = 10%): Diesel content: 74.95%, Biodiesel content: 25.05%, OMPM: 0.6322, Blend Cost: 1.6976 EUR/L, Blend Density: 0.8378 g/mL.
  • Optimal Blend in Group 2 (20 °C, w1 = 10%, w2 = 90%): Diesel content: 74.88%, Biodiesel content: 25.12%, OMPM: −0.8852, Blend Cost: 1.7112 EUR/L, Blend Density: 0.8397 g/mL.
The new biodiesel costs less than 15.12% (Set 1) and 14.44% (Set 2) compared to diesel (priced at 2.0000 EUR/L), offering antagonistic prices, minimizing lower sulfur content, and reducing pollutant emissions.
Apart from the two optimal biodiesel fuels, the remaining fuels, recognized as best mixtures within their respective groups, present viable solutions with competitive costs and densities always within the standard limits ranging from 0.8200 g/mL to 0.8450 g/mL (ASTM D1298-99).
Additionally, the experiments yield several significant outcomes, including cost minimization, duration minimization, use of the EFM for improvements in both cost and density and the production of environmentally friendly fuel, showcasing the utility of this new decision-making in the production of optimized biodiesel mixture compositions.
In conclusion, the evolutionary GA approach demonstrates its capability to adequately address complex fuel mixture problems and can be recommended as a suitable and efficient approach for addressing new biodiesel production challenges.
Future research directions call for further GA algorithm evolvement and enhancement. Research on other factors that potentially may improve the quality of biodiesel is also under consideration. Moreover, the suggested technology can be applied to other biodiesel blends based on different components.

Author Contributions

Conceptualization, V.V., V.K. and C.T.; Data curation, C.K.; Formal analysis, V.V. and C.K.; Investigation, V.V.; Methodology, V.V. and C.K.; Project administration, V.V.; Resources, C.T.; Software, C.K.; Supervision, V.K. and C.T.; Validation, C.T.; Visualization, V.K.; Writing—original draft, C.K.; Writing—review and editing, V.K. All authors have read and agreed to the published version of the manuscript.

Funding

This research received no external funding.

Data Availability Statement

Data are not publicly available due to academic regulations, but they can be available upon request to interested researchers.

Conflicts of Interest

The authors declare no conflicts of interest.

References

  1. Enerdata. Global Energy Trends—2022 Edition. In World Energy & Climate Statistics—Yearbook 2022; Enerdata: Paris, France, 2022. [Google Scholar]
  2. Papapolymerou, G.; Karayannis, V.; Besios, A.; Riga, A.; Gougoulias, N.; Spiliotis, X. Scaling-up sustainable chlorella vulgaris microalgal biomass cultivation from laboratory to pilot-plant photobioreactor, towards biofuel. Glob. Nest J. 2019, 21, 37–42. [Google Scholar]
  3. Pokushko, M.; Stupina, A.; Medina-Bulo, I.; Ezhemanskaya, S.; Kuzmich, R.; Pokushko, R. Algorithm for Application of a Basic Model for the Data Envelopment Analysis Method in Technical Systems. Algorithms 2023, 16, 460. [Google Scholar] [CrossRef]
  4. Kokkinos, K.; Karayannis, V.; Samaras, N.; Moustakas, K. Multi-scenario analysis on hydrogen production development using PESTEL and FCM models. J. Clean. Prod. 2023, 419, 138251. [Google Scholar] [CrossRef]
  5. Vasiliadou, I.A.; Semizoglou, Z.A.; Karayannis, V.G.; Tsanaktsidis, C.G. Extraction Study of Lignite Coalbed Methane as a Potential Supplement to Natural Gas for Enhancing Energy Security of Western Macedonia Region in Greece. Appl. Sci. 2024, 14, 174. [Google Scholar] [CrossRef]
  6. Semwal, S.; Arora, A.K.; Badoni, R.P.; Tuli, D.K. Biodiesel production using heterogeneous catalysts. Bioresour. Technol. 2011, 102, 2151–2161. [Google Scholar] [CrossRef] [PubMed]
  7. Roschat, W.; Kacha, M.; Yoosuk, B.; Sudyoadsuk, T.; Promarak, V. Biodiesel production based on heterogeneous process catalyzed by solid waste coral fragment. Fuel 2012, 98, 194–202. [Google Scholar] [CrossRef]
  8. Lee, S.; Posarac, D.; Ellis, N. An experimental investigation of biodiesel synthesis from waste canola oil using supercritical methanol. Fuel 2012, 91, 229–237. [Google Scholar] [CrossRef]
  9. Ma, F.; Hanna, M.A. Biodiesel production: A review. Bioresour. Technol. 1999, 70, 1–15. [Google Scholar] [CrossRef]
  10. Kamm, B.; Kamm, M. Principles of biorefineries. Appl. Microbiol. Biotechnol. 2004, 64, 37–45. [Google Scholar] [CrossRef]
  11. Tyson, K.S.; Bozell, J.; Wallace, R.; Petersen, E.; Moens, L. Biomass oil analysis: Research needs and recommendations. NREL/Tech. Rep. 2004. [Google Scholar] [CrossRef]
  12. Bezergianni, S.; Kalogeras, K.; Pilavachi, P.A. On maximizing biodiesel mixing ratio based on final product specifications. Comput. Chem. Eng. 2011, 35, 936–942. [Google Scholar] [CrossRef]
  13. Gerpen, J.V.; Shanks, B.; Pruszko, R.; Clements, D.; Knothe, G. Biodiesel Production Technology NREL/SR-510-36244; National Renewable Energy Laboratory: Golden, CO, USA, 2004.
  14. Balat, M.; Balat, H. Progress in biodiesel processing. Appl. Energy 2010, 87, 1815–1835. [Google Scholar] [CrossRef]
  15. Pérez-Cisnerosa, E.S.; Mena-Espinoa, X.; Rodríguez-Lópezc, V.; Sales-Cruzb, M.; Viveros-Garcíaa, T.; Lobo-Oehmichen, R. An integrated reactive distillation process for biodiesel production. Comput. Chem. Eng. 2016, 35, 936–942. [Google Scholar] [CrossRef]
  16. Burton, R. Biodiesel Standards and Testing Methods. In Alternative Fuels Consortium; Central Carolina Community College: Sanford, NC, USA, 2008. [Google Scholar]
  17. Gomez, L.D.; Steele-King, C.G.; McQueen-Mason, S.J. Sustainable liquid biofuels from biomass: The writing’s on the walls. New Phytol. 2008, 178, 473–485. [Google Scholar] [CrossRef] [PubMed]
  18. Ramos, M.; Dias, A.P.S.; Puna, J.F.; Gomes, J.; Bordado, J.C. Review on biodiesel production processes and sustainable raw materials. Energies 2019, 12, 4408. [Google Scholar] [CrossRef]
  19. Kavallari, A.; Smeets, E.; Tabeau, A. Land use changes from EU biofuel use: A sensitivity analysis. Oper. Res. 2014, 14, 261–281. [Google Scholar] [CrossRef]
  20. Alptekin, E.; Canakci, M. Determination of the density and the viscosities of biodiesel–diesel fuel blends. Renew. Energy 2008, 33, 2623–2630. [Google Scholar] [CrossRef]
  21. Tsanaktsidis, C.G.; Vasiliadis, V.; Itziou, A.; Petrakis, L.A.; Moisiadis, S.A. Application of factor analysis for the study of physicochemical properties in different blends of diesel fuel with biodiesel. Int. J. Soft Comput. Eng. 2013, 3, 42–46. [Google Scholar]
  22. Malik, S.; Darolia, P.J.; Garg, S.K.; Sharma, V.K. Densities and excess molar volumes of mixtures containing diesel, biodiesel and alkanols at temperatures from 288.15 to 313.15 K. Chin. J. Chem. Eng. 2021, 34, 198–207. [Google Scholar] [CrossRef]
  23. Tsanaktsidis, C.G.; Spinthiropoulos, K.G.; Guliyev, F.; Dimitriou, D.; Euthaltsidou, K.; Tzilantonis, G.T. Relation between quality and production cost for pure biodiesel bases on the mixes of raw materials. IOP Conf. Ser. Earth Environ. Sci. 2016, 40, 012048. [Google Scholar] [CrossRef]
  24. Deya, P.; Raya, S.; Newarb, A. Defining a waste vegetable oil-biodiesel based diesel substitute blend fuel by response surface optimization of density and calorific value. Fuel 2021, 283, 118978. [Google Scholar] [CrossRef]
  25. Valdez, F.; Castillo, O.; Melin, P. Bio-inspired algorithms and its applications for optimization in fuzzy clustering. Algorithms 2021, 14, 122. [Google Scholar] [CrossRef]
  26. Kyriklidis, C.; Dounias, G. Evolutionary computation for resource leveling optimization in project management. In Integrated Computer-Aided Engineering; IOS Press: Amsterdam, The Netherland, 2016; Volume 23, pp. 173–184. [Google Scholar]
  27. Samuel, A.L. Some studies in machine learning using the game of checkers. IBM J. Res. Dev. 1959, 3, 210–229. [Google Scholar] [CrossRef]
  28. Russell, S.; Norvig, P. Artificial Intelligence—A Modern Approach, 3rd ed.; Hirsch, M., Ed.; Pearson Education Inc.: Hoboken, NJ, USA, 2010. [Google Scholar]
  29. Xing, Y.; Zheng, Z.; Sun, Y.; Alikhani, M.A. A Review on Machine Learning Application in Biodiesel Production Studies. Int. J. Chem. Eng. 2021, 2021, 2154258. [Google Scholar] [CrossRef]
  30. Kalogirou, S.A. Artificial neural networks in renewable energy systems applications: A review. Renew. Sustain. Energy Rev. 2001, 5, 373–401. [Google Scholar] [CrossRef]
  31. Baños, R.; Manzano-Agugliaro, F.; Montoya, F.G.; Gil, C.; Alcayde, A.; Gómez, J. Optimization methods applied to renewable and sustainable energy: A review. Renew. Sustain. Energy Rev. 2011, 15, 1753–1766. [Google Scholar] [CrossRef]
  32. Liao, M.; Yao, Y. Applications of artificial intelligence-based modeling for bioenergy systems: A review. GCB Bioenergy 2021, 13, 774–802. [Google Scholar] [CrossRef]
  33. Kokkinos, K.; Karayannis, V. Supportiveness of low-carbon energy technology policy using fuzzy multicriteria decision-making methodologies. Mathematics 2020, 8, 1178. [Google Scholar] [CrossRef]
  34. Zhou, Y.; Zhang, J.; Yang, X.; Ling, Y. Optimal reactive power dispatch using water wave optimization algorithm. Oper. Res. 2020, 20, 2537–2553. [Google Scholar] [CrossRef]
  35. Mohd Ali, J.; Hussain, M.A.; Tade, M.O.; Zhang, J. Artificial Intelligence techniques applied as estimator in chemical process systems-a literature survey. Expert. Syst. Appl. 2015, 42, 5915–5931. [Google Scholar] [CrossRef]
  36. Liu, Z.; Baghban, A. Application of LSSVM for biodiesel production using supercritical ethanol solvent. Energy Sources Part A Recovery Util. Environ. Eff. 2017, 39, 1869–1874. [Google Scholar] [CrossRef]
  37. Mohadesi, M.; Rezaei, A. Biodiesel Conversion Modeling under Several Conditions Using Computational Intelligence Methods. Environ. Prog. Sustain. Energy 2018, 37, 562–568. [Google Scholar] [CrossRef]
  38. Kokkinos, K.; Karayannis, V.; Moustakas, K. Optimizing Microalgal Biomass Feedstock Selection for Nanocatalytic Conversion Into Biofuel Clean Energy, Using Fuzzy Multi-Criteria Decision Making Processes. Front. Energy Res. 2021, 8, 622210. [Google Scholar] [CrossRef]
  39. Holland, J.H. Genetic Algorithms. Sci. Am. 1992, 267, 66–72. [Google Scholar] [CrossRef]
  40. Fuladi, S.K.; Kim, C.-S. Dynamic Events in the Flexible Job-Shop Scheduling Problem: Rescheduling with a Hybrid Metaheuristic Algorithm. Algorithms 2024, 17, 142. [Google Scholar] [CrossRef]
  41. Kyriklidis, C.; Kyriklidis, M.-E.; Loizou, E.; Stimoniaris, A.; Tsanaktsidis, C.G. Optimal Bio Marine Fuel production evolutionary Computation: Genetic algorithm approach for raw materials mixtures. Fuel 2022, 323, 124232. [Google Scholar] [CrossRef]
  42. Food and Agriculture Organization of the United Nations (FAOSTAT). Available online: https://www.fao.org/faostat/en/#data/PP (accessed on 1 February 2024).
  43. Hellenic Statistical Authority, Greece (HSA). Available online: https://www.statistics.gr/ (accessed on 1 February 2024).
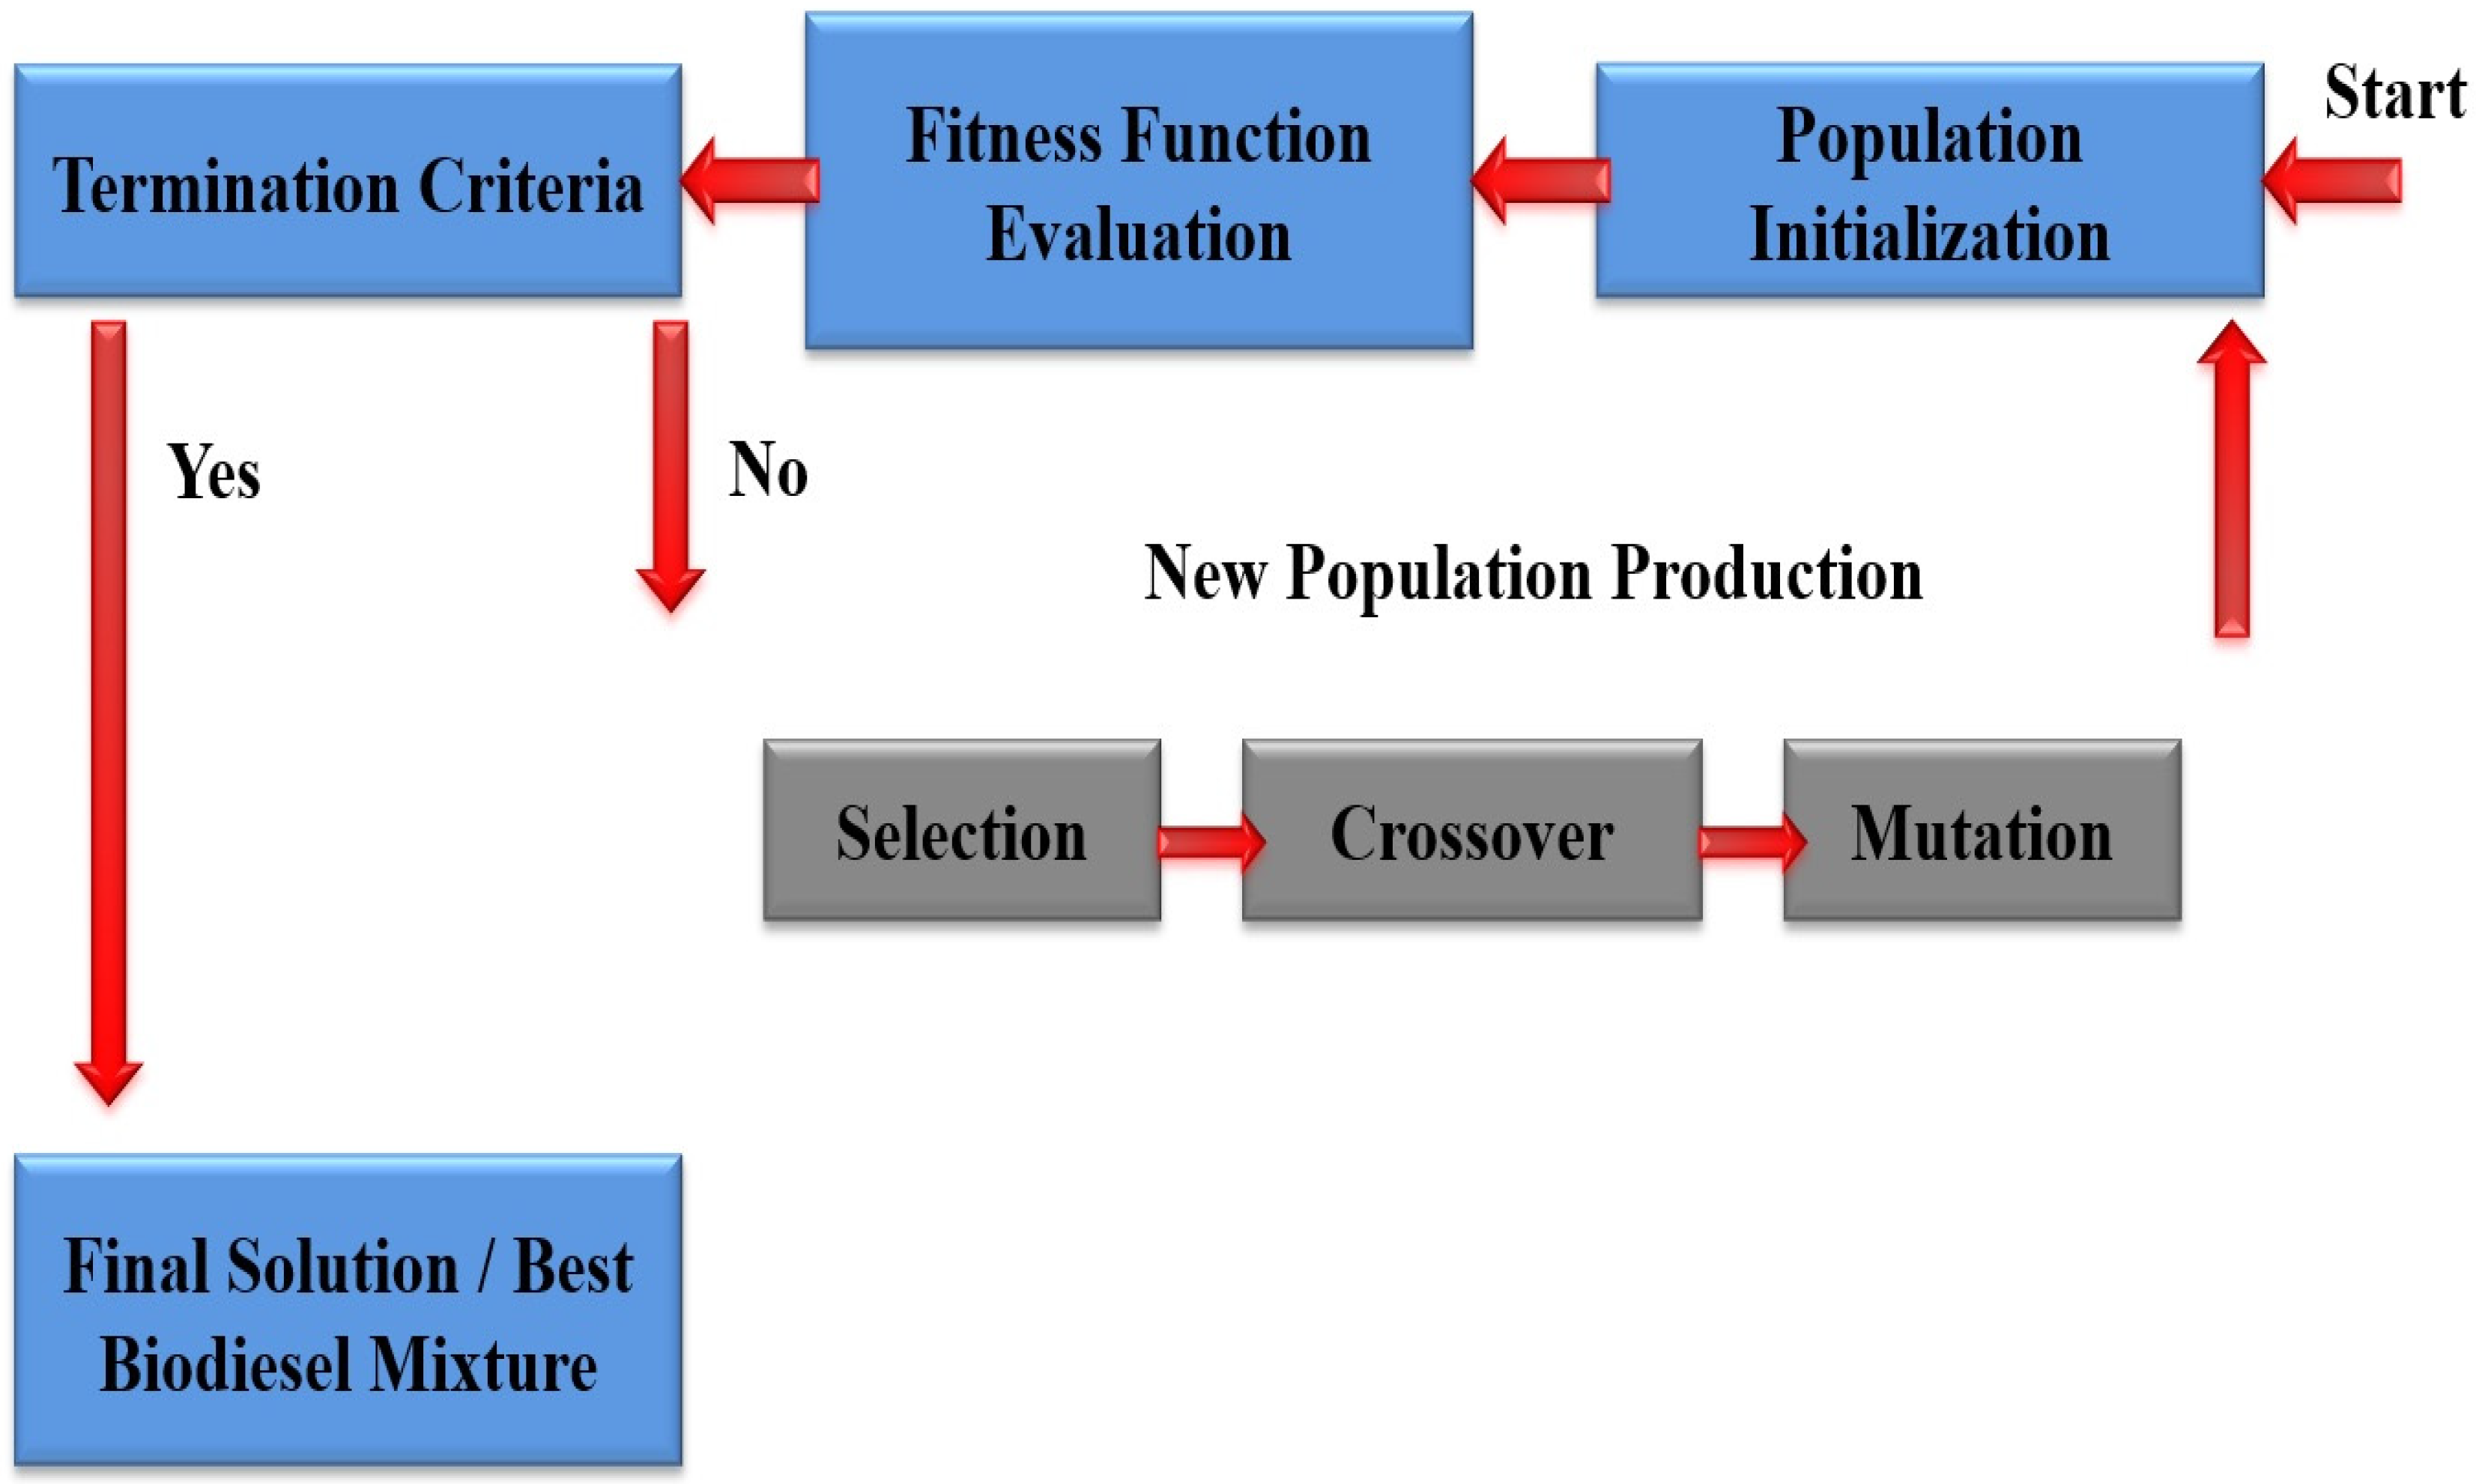
Figure 1. Genetic Algorithm Operation.
Algorithms 17 00181 g001
Figure 2. New generation mixtures production.
Algorithms 17 00181 g002
Figure 3. Set 1: (a) TMFV Statistical Analysis and (b) Best TMFV Solutions Allocation.
Algorithms 17 00181 g003
Figure 4. Set 1: (a) Cost Statistical Analysis and (b) Best Cost Solutions Allocation.
Algorithms 17 00181 g004
Figure 5. Set 1: (a) Density Statistical Analysis and (b) Best Density Solutions Allocation.
Algorithms 17 00181 g005aAlgorithms 17 00181 g005b
Figure 6. Set 2: (a) TMFV Statistical Analysis and (b) Best TMFV Solutions Allocation.
Algorithms 17 00181 g006
Figure 7. Set 2: (a) Cost Statistical Analysis and (b) Best Cost Solutions Allocation.
Algorithms 17 00181 g007aAlgorithms 17 00181 g007b
Figure 8. Set 2: (a) Density Statistical Analysis and (b) Best Density Solutions Allocation.
Algorithms 17 00181 g008
Table 1. Abbreviations /Definition of Main Concepts.
AbbreviationConcept Definition
Min (Max) Ingredient PercentageMinimum (Maximum) Ingredient Percentage value.
InPerIngredient Percentage.
IPLSIngredient Percentage Local Search (in%).
I1Ingredient Percentage Local Search Bound created by minimum ingredient percentage.
I2Ingredient percentage Local Search Bound created by maximum ingredient percentage.
Max IPLSMaximum IPLS value.
Min IPLSMinimum IPLS value.
Table 2. W1 and w2 for Set 1 and Set 2 per Temperature between 5 °C–25 °C.
Experiment Temperaturesw1/w2 (Set 1)w1/w2 (Set 2)
5 °C, 10 °C,
15 °C, 20 °C and 25 °C
50%/50%50%/50%
60%/40%40%/60%
70%/30%30%/70%
80%/20%20%/80%
90%/10%10%/90%
Table 3. Min and Max relative mixture composition (%), ingredient Cost and Density.
Fuel’s TemperatureMin%Max%Cost EUR/LDensity g/mL
Diesel 5 °C1992.00000.8191
Biodiesel 5 °C1300.80910.8915
Diesel 10 °C1992.00000.8206
Biodiesel 10 °C1300.80910.8848
Diesel 15 °C1992.00000.8220
Biodiesel 15 °C1300.80910.8823
Diesel 20 °C1992.00000.8234
Biodiesel 20 °C1300.80910.8819
Diesel 25 °C1992.00000.8249
Biodiesel 25 °C1300.80910.8808
Table 4. Set 1 experiments for temperatures 5 °C–25 °C, Emphasis on Mixtures Cost, w1 ≥ 50%.
Fuel’s Temp.w1/w2Diesel%Biodiesel%TMFVCostDensity
5 °Cw1: 50%, w2: 50%75.00%25.00%−0.07711.69880.8340
w1: 60%, w2: 40%75.00%25.00%0.11041.69850.8351
w1: 70%, w2: 30%74.98%25.02%0.28561.69780.8359
w1: 80%, w2: 20%74.97%25.03%0.48781.69780.8364
w1: 90%, w2: 10%74.95%25.05%0.63221.69760.8378
10 °Cw1: 50%, w2: 50%75.01%24.99%−0.07271.73770.8349
w1: 60%, w2: 40%74.99%25.01%0.11341.72110.8355
w1: 70%, w2: 30%74.97%25.03%0.29871.72000.8363
w1: 80%, w2: 20%74.95%25.05%0.48811.69930.8376
w1: 90%, w2: 10%74.93%25.07%0.67811.69870.8379
15 °Cw1: 50%, w2: 50%75.00%25.00%−0.07151.73790.8356
w1: 60%, w2: 40%74.98%25.02%0.11541.72160.8359
w1: 70%, w2: 30%74.96%25.04%0.29961.72220.8368
w1: 80%, w2: 20%74.95%25.05%0.48971.70770.8379
w1: 90%, w2: 10%74.93%25.07%0.67921.69910.8382
20 °Cw1: 50%, w2: 50%75.01%24.99%−0.07041.73820.8367
w1: 60%, w2: 40%74.98%25.02%0.11551.72450.8371
w1: 70%, w2: 30%74.97%25.03%0.30111.72330.8377
w1: 80%, w2: 20%74.92%25.08%0.49541.71880.8385
w1: 90%, w2: 10%74.91%25.09%0.68081.69950.8389
25 °Cw1: 50%, w2: 50%75.02%24.98%−0.06811.73860.8371
w1: 60%, w2: 40%75.01%24.99%0.11761.72480.8373
w1: 70%, w2: 30%74.95%25.05%0.32251.72540.8379
w1: 80%, w2: 20%74.91%25.09%0.52381.71950.8388
w1: 90%, w2: 10%74.89%25.11%0.70071.69990.8395
Table 5. Set 2 experiments for temperatures 5 °C–25 °C, Emphasis on Mixtures Density, w2 ≥ 50%.
Fuel’s Temp.w1/w2Diesel%Biodiesel%TMFVCostDensity
5 °Cw1: 50%, w2: 50%75.00%25.00%−0.07711.69880.8340
w1: 40%, w2: 60%74.99%25.01%−0.22671.69860.8355
w1: 30%, w2: 70%74.98%25.02%−0.41671.69840.8358
w1: 20%, w2: 80%74.96%25.04%−0.63781.69800.8366
w1: 10%, w2: 90%74.95%25.05%−0.84511.69790.8379
10 °Cw1: 50%, w2: 50%75.01%24.99%−0.07271.73790.8349
w1: 40%, w2: 60%74.99%25.01%−0.25881.72220.8357
w1: 30%, w2: 70%74.96%25.04%−0.45061.72340.8364
w1: 20%, w2: 80%74.96%25.04%−0.64281.70560.8378
w1: 10%, w2: 90%74.93%25.07%−0.83221.69930.8381
15 °Cw1: 50%, w2: 50%75.00%25.00%−0.07151.73790.8356
w1: 40%, w2: 60%74.98%25.02%−0.26841.72560.8361
w1: 30%, w2: 70%74.97%25.03%−0.47541.72370.8369
w1: 20%, w2: 80%74.94%25.06%−0.66821.70870.8380
w1: 10%, w2: 90%74.92%25.08%−0.84811.70230.8384
20 °Cw1: 50%, w2: 50%75.01%24.99%−0.07041.73840.8367
w1: 40%, w2: 60%74.99%25.01%−0.27911.72680.8373
w1: 30%, w2: 70%74.96%25.04%−0.49841.72450.8379
w1: 20%, w2: 80%74.93%25.07%−0.67091.71980.8386
w1: 10%, w2: 90%74.91%25.09%−0.86871.70670.8390
25 °Cw1: 50%, w2: 50%75.02%24.98%−0.06811.73860.8371
w1: 40%, w2: 60%75.00%25.00%−0.29811.72690.8375
w1: 30%, w2: 70%74.96%25.04%−0.56031.72580.8382
w1: 20%, w2: 80%74.92%25.08%−0.69911.72120.8389
w1: 10%, w2: 90%74.88%25.12%−0.88521.71120.8397
Table 6. Mixture Relative Composition—Gaseous Pollutants.
D–B (%)Gaseous Pollutants
O2CO2CONOXC.P.E.A.
1100–03.912.61306994.922.9
295–53.912.51326994.823.3
390–104.012.61336994.923.7
485–154.112.51357094.924.2
580–204.112.71377094.924.2
675–254.212.71397195.024.5
770–304.212.61427195.224.9
865–354.312.61477195.125.5
960–404.312.61527295.226.2
1055–454.512.71587295.326.8
1150–504.512.71627395.427.4
1245–554.512.71657395.327.4
1340–604.412.61687195.427.2
1435–654.412.61707095.427.0
1530–704.512.71726995.426.8
1625–754.512.61746895.026.6
1720–804.512.51796895.126.4
1815–854.512.51846995.226.0
1910–904.612.51946995.125.7
205–954.612.62046995.025.4
210–1004.612.62166895.225.1
O2 = Oxygen, CO2 = Carbon dioxide, CO = Carbon monoxide, NOX = Nitrogen oxides, C.P. = Combustion performance, E.A. = Excess air.
Disclaimer/Publisher’s Note: The statements, opinions and data contained in all publications are solely those of the individual author(s) and contributor(s) and not of MDPI and/or the editor(s). MDPI and/or the editor(s) disclaim responsibility for any injury to people or property resulting from any ideas, methods, instructions or products referred to in the content.