Article

A Modified Analytic Hierarchy Process Suitable for Online Survey Preference Elicitation

1
CSIRO Environment, Queensland Biosciences Precinct, 306 Carmody Road, St Lucia, Bribie Island, QLD 4067, Australia
2
Australian National Centre for Ocean Resources and Security (ANCORS), Faculty of Business and Law, University of Wollongong, Wollongong, NSW 2522, Australia
*
Author to whom correspondence should be addressed.
Algorithms 2024, 17(6), 245; https://doi.org/10.3390/a17060245
Submission received: 12 May 2024 / Revised: 1 June 2024 / Accepted: 3 June 2024 / Published: 6 June 2024

Abstract

:
A key component of multi-criteria decision analysis is the estimation of criteria weights, reflecting the preference strength of different stakeholder groups related to different objectives. One common method is the Analytic Hierarchy Process (AHP). A key challenge with the AHP is the potential for inconsistency in responses, resulting in potentially unreliable preference weights. In small groups, interactions between analysts and respondents can compensate for this through reassessment of inconsistent responses. In many cases, however, stakeholders may be geographically dispersed, with online surveys being a more cost-effective means to elicit these preferences, making renegotiating with inconsistent respondents impossible. Further, the potentially large number of bivariate comparisons required using the AHP may adversely affect response rates. In this study, we test a new “modified” AHP (MAHP). The MAHP was designed to retain the key desirable features of the AHP but be more amenable to online surveys, reduce the problem of inconsistencies, and require substantially fewer comparisons. The MAHP is tested using three groups of university students through an online survey platform, along with a “traditional” AHP approach. The results indicate that the MAHP can provide statistically equivalent outcomes to the AHP but without problems arising due to inconsistencies.

1. Introduction

The estimation of objective or criteria importance weights is an integral component of most multi-criteria decision analysis studies [1]. A range of methods has been applied in the literature to assess objective weights, each with advantages and disadvantages [2,3,4,5,6,7,8,9]. Comparative studies of these methods suggest in some cases that the objective weights may vary considerably between methods [10], although others have found higher correlations between the results of the different methods [11].
The Analytic Hierarchy Process (AHP) [12,13] is one commonly applied approach for deriving such weights. The AHP has been used in a number of applications covering business (e.g., [14]), manufacturing (e.g., [15]), transport (e.g., [16]), healthcare (e.g., [17]), and a wide range of applied environmental and natural resource management studies [18,19,20,21,22,23,24]. It has become one of the most common approaches used for preference elicitation for multi-criteria decision analysis [25]. The method estimates the relative importance of each criterion being assessed to different stakeholders or decision-makers through a series of pairwise comparisons. The derived weights subsequently help determine which set of outcomes, given a range of different options, may be overall most preferable to different stakeholder groups and/or decision-makers based on their preference sets.
A key challenge facing the use of the AHP is the issue of inconsistencies in the responses by those whose preferences are being elicited. Preference weightings are highly subjective, and inconsistency between responses to different combinations of comparisons is a common problem facing the AHP, particularly when decision-makers are confronted with many sets of comparisons [26]. Respondents do not necessarily cross-check their responses, and even if they do, ensuring a perfectly consistent set of responses when many sub-components are compared is difficult. The discrete nature of the 1–9 scale in the traditional AHP approach can also contribute to inconsistency, as a perfectly consistent response may require a fractional preference score [27]. Inconsistency can also arise through errors in entering judgments, lack of concentration, and inappropriate use of extremes [24,28,29].
The pairwise comparisons underpinning preference choice in the AHP are believed to make the process of assigning importance weights relatively easy for respondents, as only two sub-components are being compared at a time [1]. However, as more criteria are compared, the required number of pairwise comparisons increases at an exponential rate, requiring approximately (n2n)/2 comparisons, where n is the number of objectives or criteria to be compared. For example, comparing two criteria requires only one pairwise comparison, three criteria require three pairwise comparisons, four criteria require six pairwise comparisons, and so on. The propensity for respondents to be inconsistent in their responses also correspondingly increases when they are confronted with many sets of comparisons [26,30,31].
Such inconsistency in the comparison matrix may result in incorrect priority weighting being associated with each of the attributes being considered [28]. Inconsistency is generally considered to affect the reliability of the resultant set of preference weights derived from the AHP, with reliability inversely related to the level of inconsistency [32,33,34].
The increased development of online survey platforms provides both opportunities and challenges for preference elicitation using the AHP. Foremost, the number of stakeholders that can be captured in the analysis can be greatly increased, providing greater information to decision-makers around the distribution of preferences across different stakeholder groups. The ease of implementing online surveys, the larger number of potential respondents they can reach, and the relatively low cost per response has made online surveys widely attractive for gaining preference information from the general community, as well as from special interest groups where individuals may be hard to identify a priori. A key advantage of the use of online surveys is that it allows access to relevant stakeholders who may be geographically dispersed, spatially sparce, or otherwise hard to reach, even if not large in absolute numbers. For example, Thadsin, et al. [35] employed an online AHP survey to assess satisfaction with the working environment within a large real estate firm with offices spread across the UK.
The issue of inconsistencies and how they may be reduced, however, creates challenges for the use of online surveys to elicit preferences. The elicitation of preferences using the AHP has largely relied on interactions with stakeholders, either in small groups (e.g., workshops) or through the use of a survey instrument. In small group settings or where respondents are known, a common practice is to request respondents to re-consider inconsistent responses. This is less practical for online surveys. For example, the anonymity of respondents in online surveys makes following up with individual responses impossible. This lack of direct interaction with the respondents creates additional challenges for deriving preference weights through approaches such as the AHP.
The consequence of these factors is that high levels of inconsistency are relatively common in online AHP surveys. For example, Tozer and Stokes [36] and Hummel, et al. [37] respectively found 75% and 73% of respondents provided inconsistent responses. Excluding these observations substantially limits the benefits of the survey. Ideally, these inconsistencies would be identified, and respondents would be requested to reconsider their choices in the light of these identified inconsistencies. Some studies have built-in checks prompting respondents to reconsider their choices if inconsistency is observed [38,39]. Feedback from respondents about these prompts was largely skeptical, as some felt that the researchers were trying to get them to choose a particular “right” answer [38]. Other online AHP systems have only employed (n − 1) comparisons (e.g., A against B, B against C, but not A against C) to avoid the potential for inconsistencies (e.g., [31,40]). A wide variety of approaches has also been developed to ex post “adjust” the results to reduce inconsistencies and improve the reliability of the preference scores [41,42,43,44,45,46,47,48,49].
Given that a key factor contributing to these inconsistencies is the use of pairwise comparisons to elicit preferences, an alternative approach for preference data collection may be more beneficial for use in online surveys. Pascoe, et al. [50] developed an alternative approach to online data collection that is consistent with the AHP in terms of how the objectives are scored (i.e., 1–9 scale) and how the results are analyzed but does not rely on the use of pairwise comparisons. The method was developed to assess a large number (i.e., 22) of operational objectives identified by stakeholder representatives considering different fishery management options. The stakeholders to be consulted were geographically dispersed across over 3000 km of coastline, making an online survey the only practical option. The large number of objectives also made bivariate comparison approaches impractical, as the time required to complete the survey was expected to have resulted in low completion rates and the high cognitive burden likely to increase inconsistencies in responses.
The approach, which we term the modified AHP (MAHP) for the purposes of this study, was developed and applied by Pascoe, et al. [50] without validation due to time constraints. The purpose in the current study is to (retrospectively) validate the approach and present the approach to a broader practitioner audience. Both the MAHP and “traditional” bivariate comparison-based AHP are compared through an experimental trial, and the results are compared at the individual respondent level. The experiment involved university students from three different classes. The scenario presented was a hypothetical dinner invitation, where they were asked to identify their relative preference for type of drink, main meal, and dessert from a selection of two, three, and four options, respectively. The students were asked to complete both the MAHP and the traditional AHP (i.e., bivariate comparison) format in each case. The results of the preferences derived using both methods were then compared.
The structure of the paper is as follows. The next section presents the methods applied and describes the survey undertaken. The following section presents the results for the case of two, three, and four alternatives, respectively, as well as an assessment of the usability of each approach from the perspective of the respondent. Finally, the advantages and disadvantages of the new approach are discussed, along with a (qualitative) comparison to other preference elicitation approaches.

2. Materials and Methods
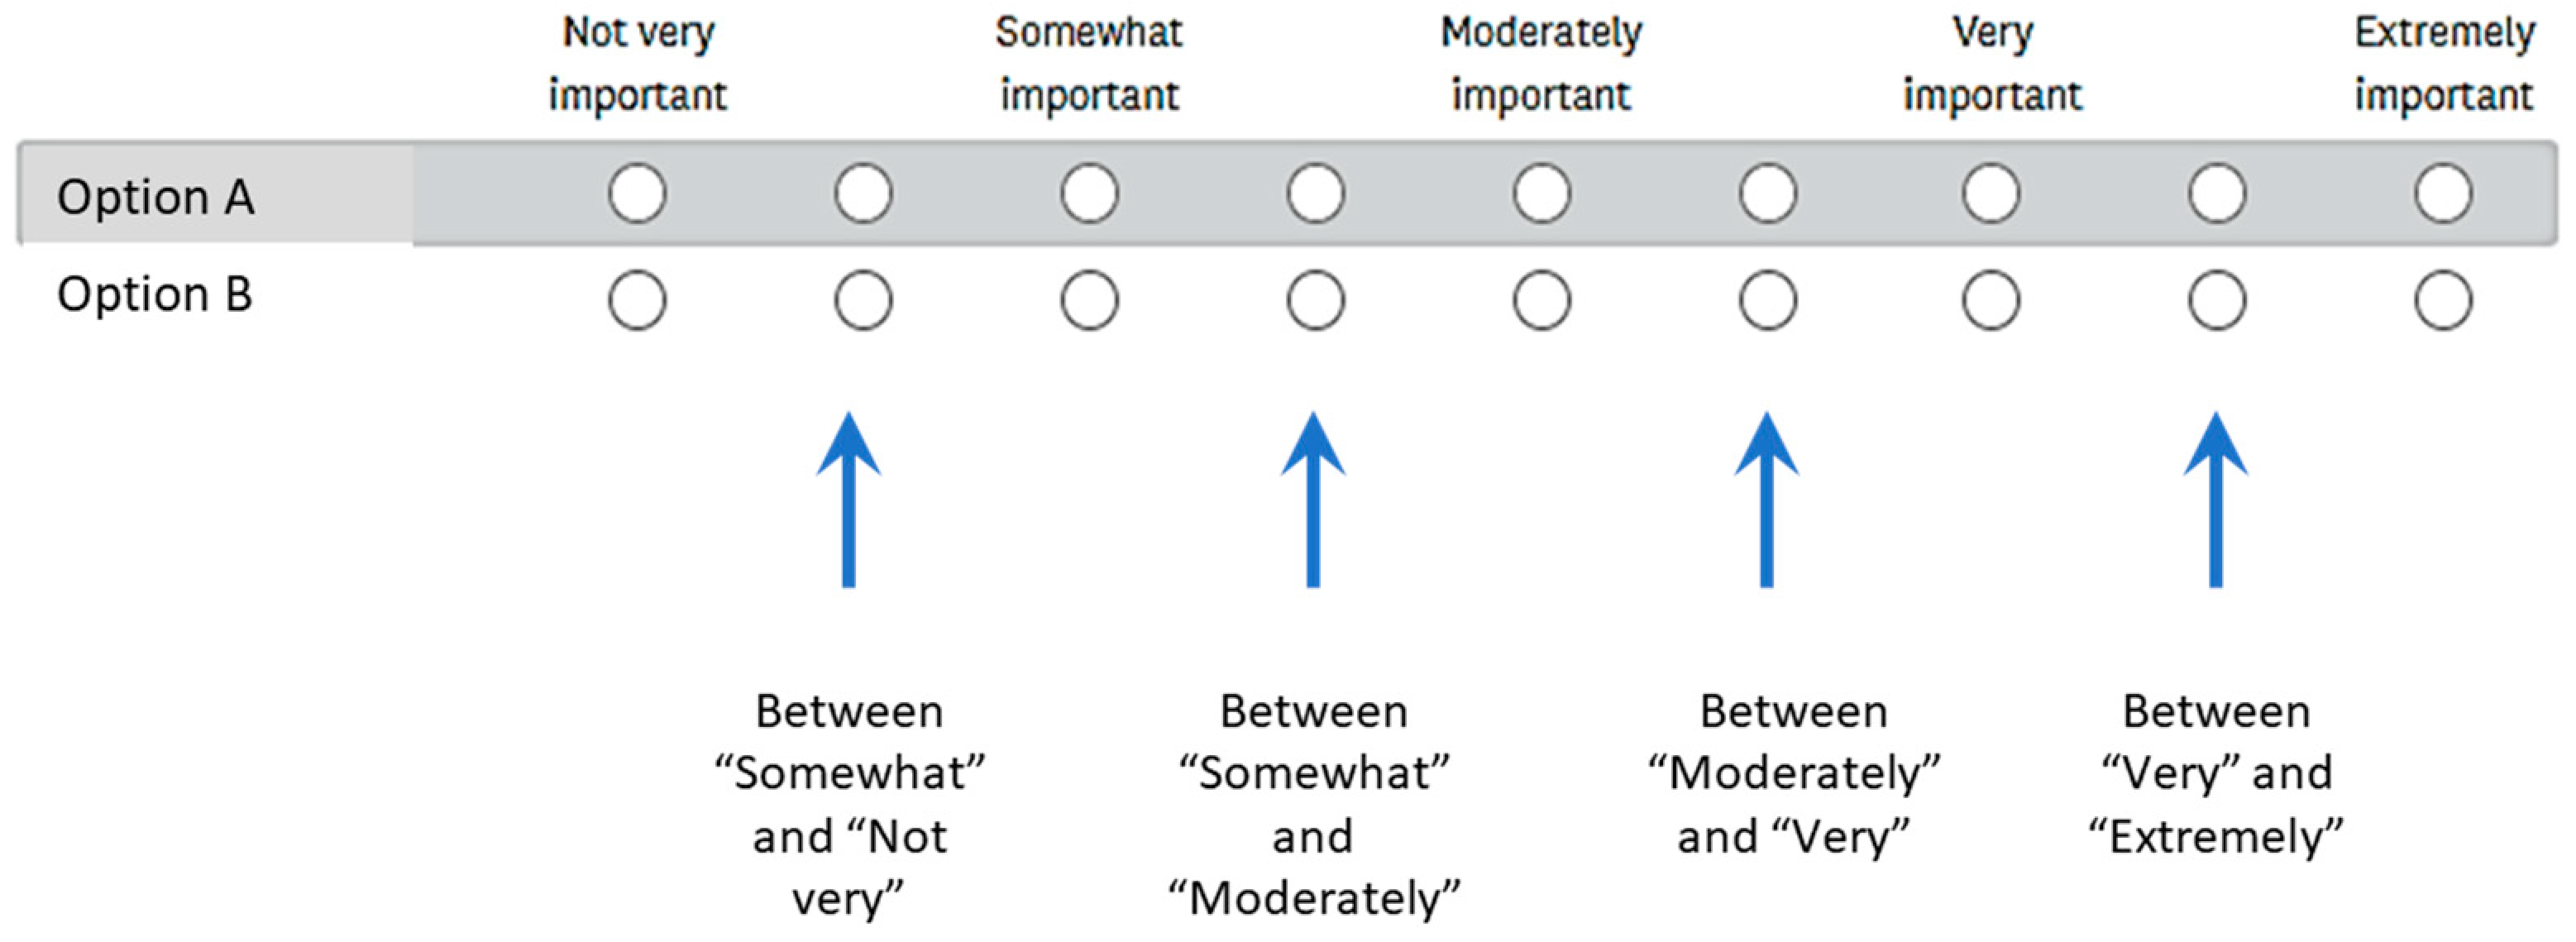
2.1. AHP vs. MAHP

The traditional AHP approach [12] is based on a series of bivariate comparisons. Preferences are expressed on a nine-point scale (Figure 1), with 1 indicating equal preference and 9 indicating an extreme preference for one of the sub-components. Preferences are assumed to be symmetrical, such that if A against B has a preference of a A B = 9 , then a B A = 1 / a A B = 1 / 9 .
With the MAHP, we avoid some of these pitfalls by modifying the way in which the data are collected and analyzed, taking into account the symmetry assumption underlying the AHP. In the online survey, respondents were presented with a nine-point importance scale against which they could assess the importance of each objective. A nine-point scale was selected (rather than an “out of 10”, as might occur with a Likert scale), as it allows five categories to be defined with mid-points between them, consistent with the traditional AHP approach. The options being assessed are presented together as a choice matrix, with the preference score of each being explicitly compared with the preference scores of the other options (Figure 2).
A separate value is derived for each objective row (e.g., a i = 1 to 9) given the importance level identified in Figure 2 and the relative score between any two objectives a i , j is derived from the difference between them, such that:
a i , j = a i a j + 1 i f a i a j > 0 1 a i a j 1 i f a i a j 0 a n d a j , i = 1 a i , j
As with the traditional AHP, preferences are assumed to be symmetrical. The use of the difference rather than the nominal value is to provide a relative preference similar to what is derived from the traditional AHP bivariate comparison. For example, a score of 9 for A and a score of 7 for B is equivalent to an element score of a A B = 3 and a B A = 1 / 3 in the traditional AHP bivariate comparison. If both are equal (irrespective of the value assigned to both), then the equivalent element score is a B A = 1 . The use of the difference also reduces the influence of the initial anchor score [51,52]. For example, a pair of scores (9, 7) and (5, 3) will provide the same element score.
Common to both approaches is a comparison matrix of scores (A), given by:
A = 1 a 12 a 1 n a 21 1 a 2 n a n 1 a n 2 1
In the case of the traditional AHP, the values of a i , j are determined directly from the bivariate comparison in Figure 1. For the MAHP, the values of a i , j are derived from Equation (1) and based on the responses to the comparisons illustrated in Figure 2.
Two general approaches used for determining the weights given the comparison matrix are the eigenvalue method (EM) developed by Saaty [12] and the geometric mean method (GMM) developed by Crawford and Williams [53]. While the former approach has been employed in a wider range of studies, the latter has been found to be less susceptible to the influence of extreme preferences, as well as having better performance around other aspects of theoretical consistency (e.g., less susceptible to rank reversibility if the preference set changes and greater transitivity properties) [54].
For this study, we used the Geometric Mean Method (GMM) [53,55] to derive the weights for each attribute ( ω i ), given by:
ω i = j = 1 n a i , j 1 / n / j j = 1 n a i , j 1 / n
where n is the number of comparisons, and j = 1 n a i , j = a i , 1 × a i , 2 × × a i , n (i.e., the product of the elements of row i). This approach is used for both the AHP and the MAHP analysis.
The level of inconsistency in the results of both approaches given by the Geometric Consistency Index (GCI) is given by:
G C I = 2 ( n 1 ) ( n 2 ) i < j log 2 a i , j w j / w i
where n is the number of attributes being compared within a level of the hierarchy [56]. This is compared to a randomly generated value for an n × n matrix to derive a consistency ratio (CR). Values of CR ≤ 0.1 are generally considered acceptable [56]. Given this, the critical values for the GCI giving a CR = 0.1 are GCI = 0.315 for n = 3, GCI = 0.353 when n = 4, and GCI = 0.370 for n > 4 [56].

2.2. Survey Design and Implementation

An online survey was developed based on a hypothetical scenario. The respondents were invited to a (hypothetical) dinner, and the host wished to accommodate dietary and taste preferences for their guests. As they could not guarantee all options would be available, the strength of preference for each was to be estimated. The development of the hypothetical scenario was to provide respondents with a set of alternatives for which they most likely had an established preference (e.g., meal type), and hence would be able to indicate these preferences using the two approaches to the best of their abilities.
The dinner was to consist of two courses, accompanied by a choice of sparkling or still water. The preference for water type formed two alternative scenarios. The main course consisted of a meat, vegetarian, and fish option (three alternatives), while dessert consisted of four options.
Students from the University of Wollongong were recruited from three classes to participate in the survey after class (with the promise of real cake as a reward for their participation). The students were asked to express their preferences using both the set of bivariate comparisons (i.e., the AHP, as in Figure 1) and the set of options presented as one table (i.e., the MAHP, as in Figure 2). The students were also asked to indicate which approach they found easier (again, using both the AHP and the MAHP). Information on the demographic characteristics of the respondents was also collected.
The survey was approved by both the CSIRO and the University of Wollongong Social Science Human Research Ethics Committees (approval number 216/23 and 2023/272, respectively).

3. Results

3.1. Demographics and Response Rates

A total of 31 students initially agreed to participate in the online survey, although only 25 completed the survey (the other six entered the survey, gave their consent, ate the cake, but did not record any other response). Of those who completed the survey, 11 were male and 14 were female. Ages ranged from 18 to 50, with a mean age of 29.
Dietary requirements were also asked, as this could have influenced the responses. The survey was designed ensuring that there was a vegetarian option at each meal, with the “main meal” also including a fish option. One respondent was vegetarian, three were pescatarian, and the remainder had no specific food-type preference.

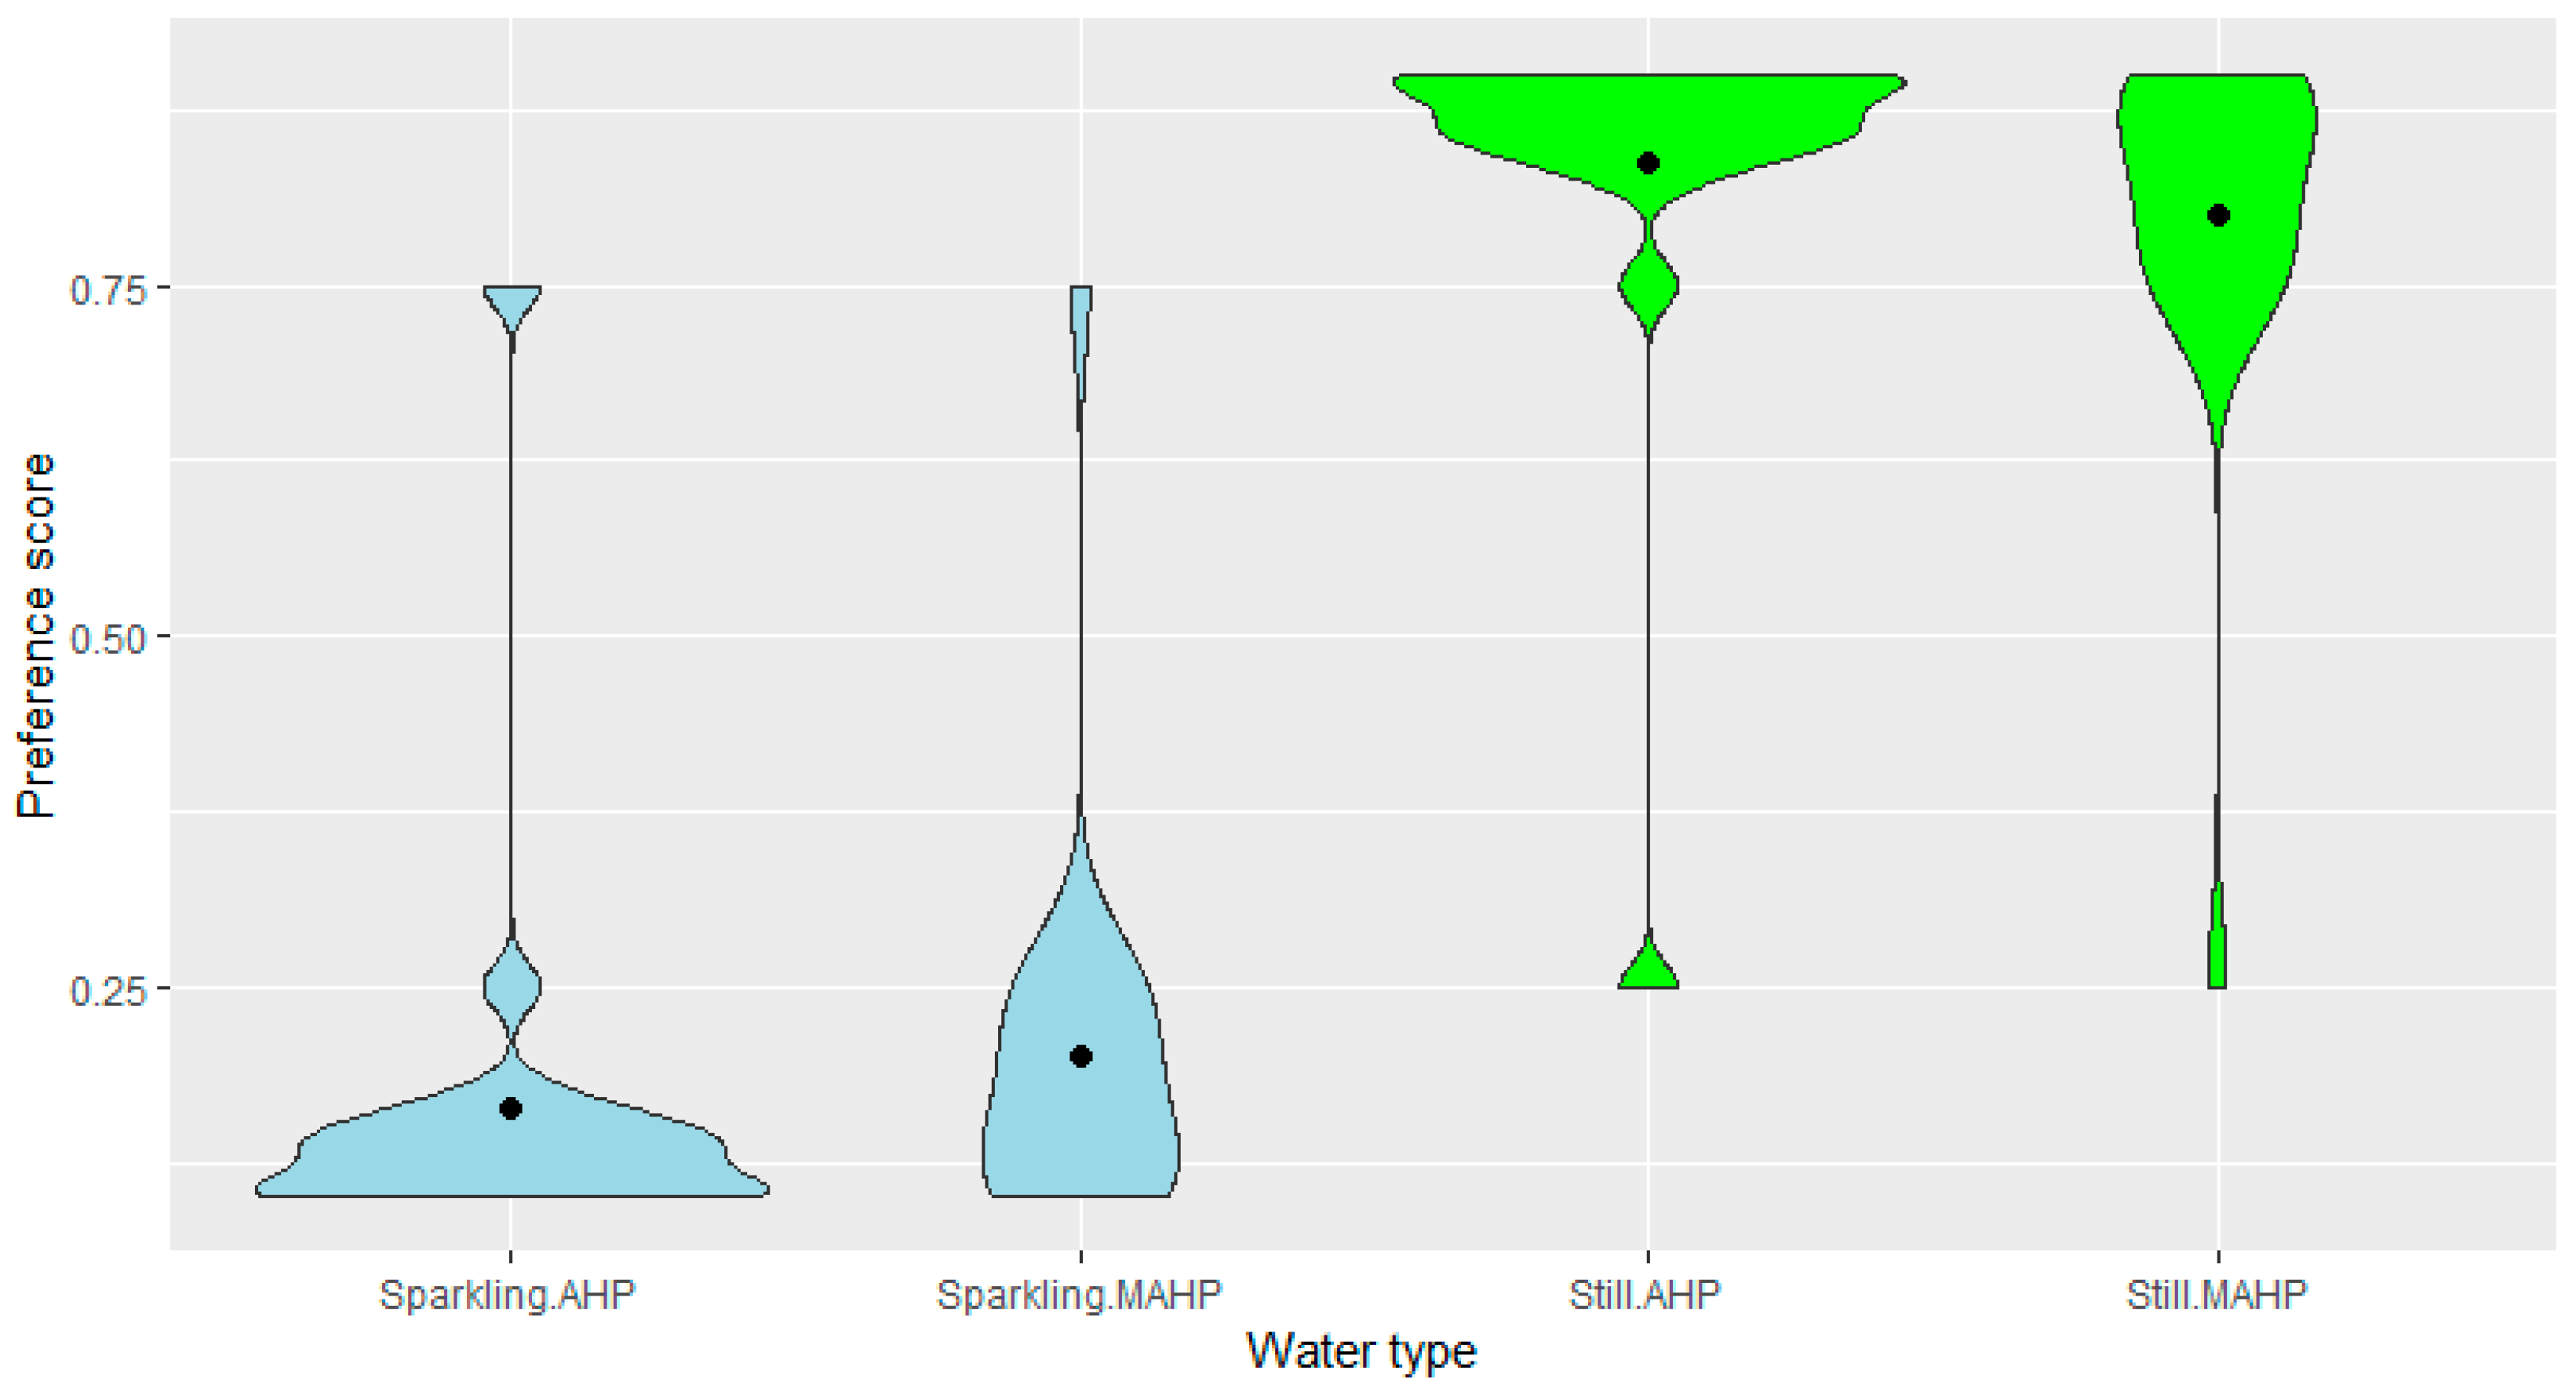
3.2. Two Alternatives: Sparkling or Still Water?

The first set of comparisons involved two alternatives—sparkling or still water. The distributions of responses were similar (Figure 3), with a clear preference for still water over sparkling using both the MAHP and the traditional pairwise approach. The mean values were also similar, and the preferences were not statistically significantly different based on a paired t-test of responses (Table 1).
The preference ranking differed between elicitation methods for only two individuals (i.e., the derived weight was higher than 0.5 for an alternative using one elicitation approach, but less than 0.5 using the other). For the other respondents, the ranking of the options was consistent across both approaches.
As there were only two options to compare (requiring just one bivariate comparison in the case of the AHP), inconsistency in choices was not possible.

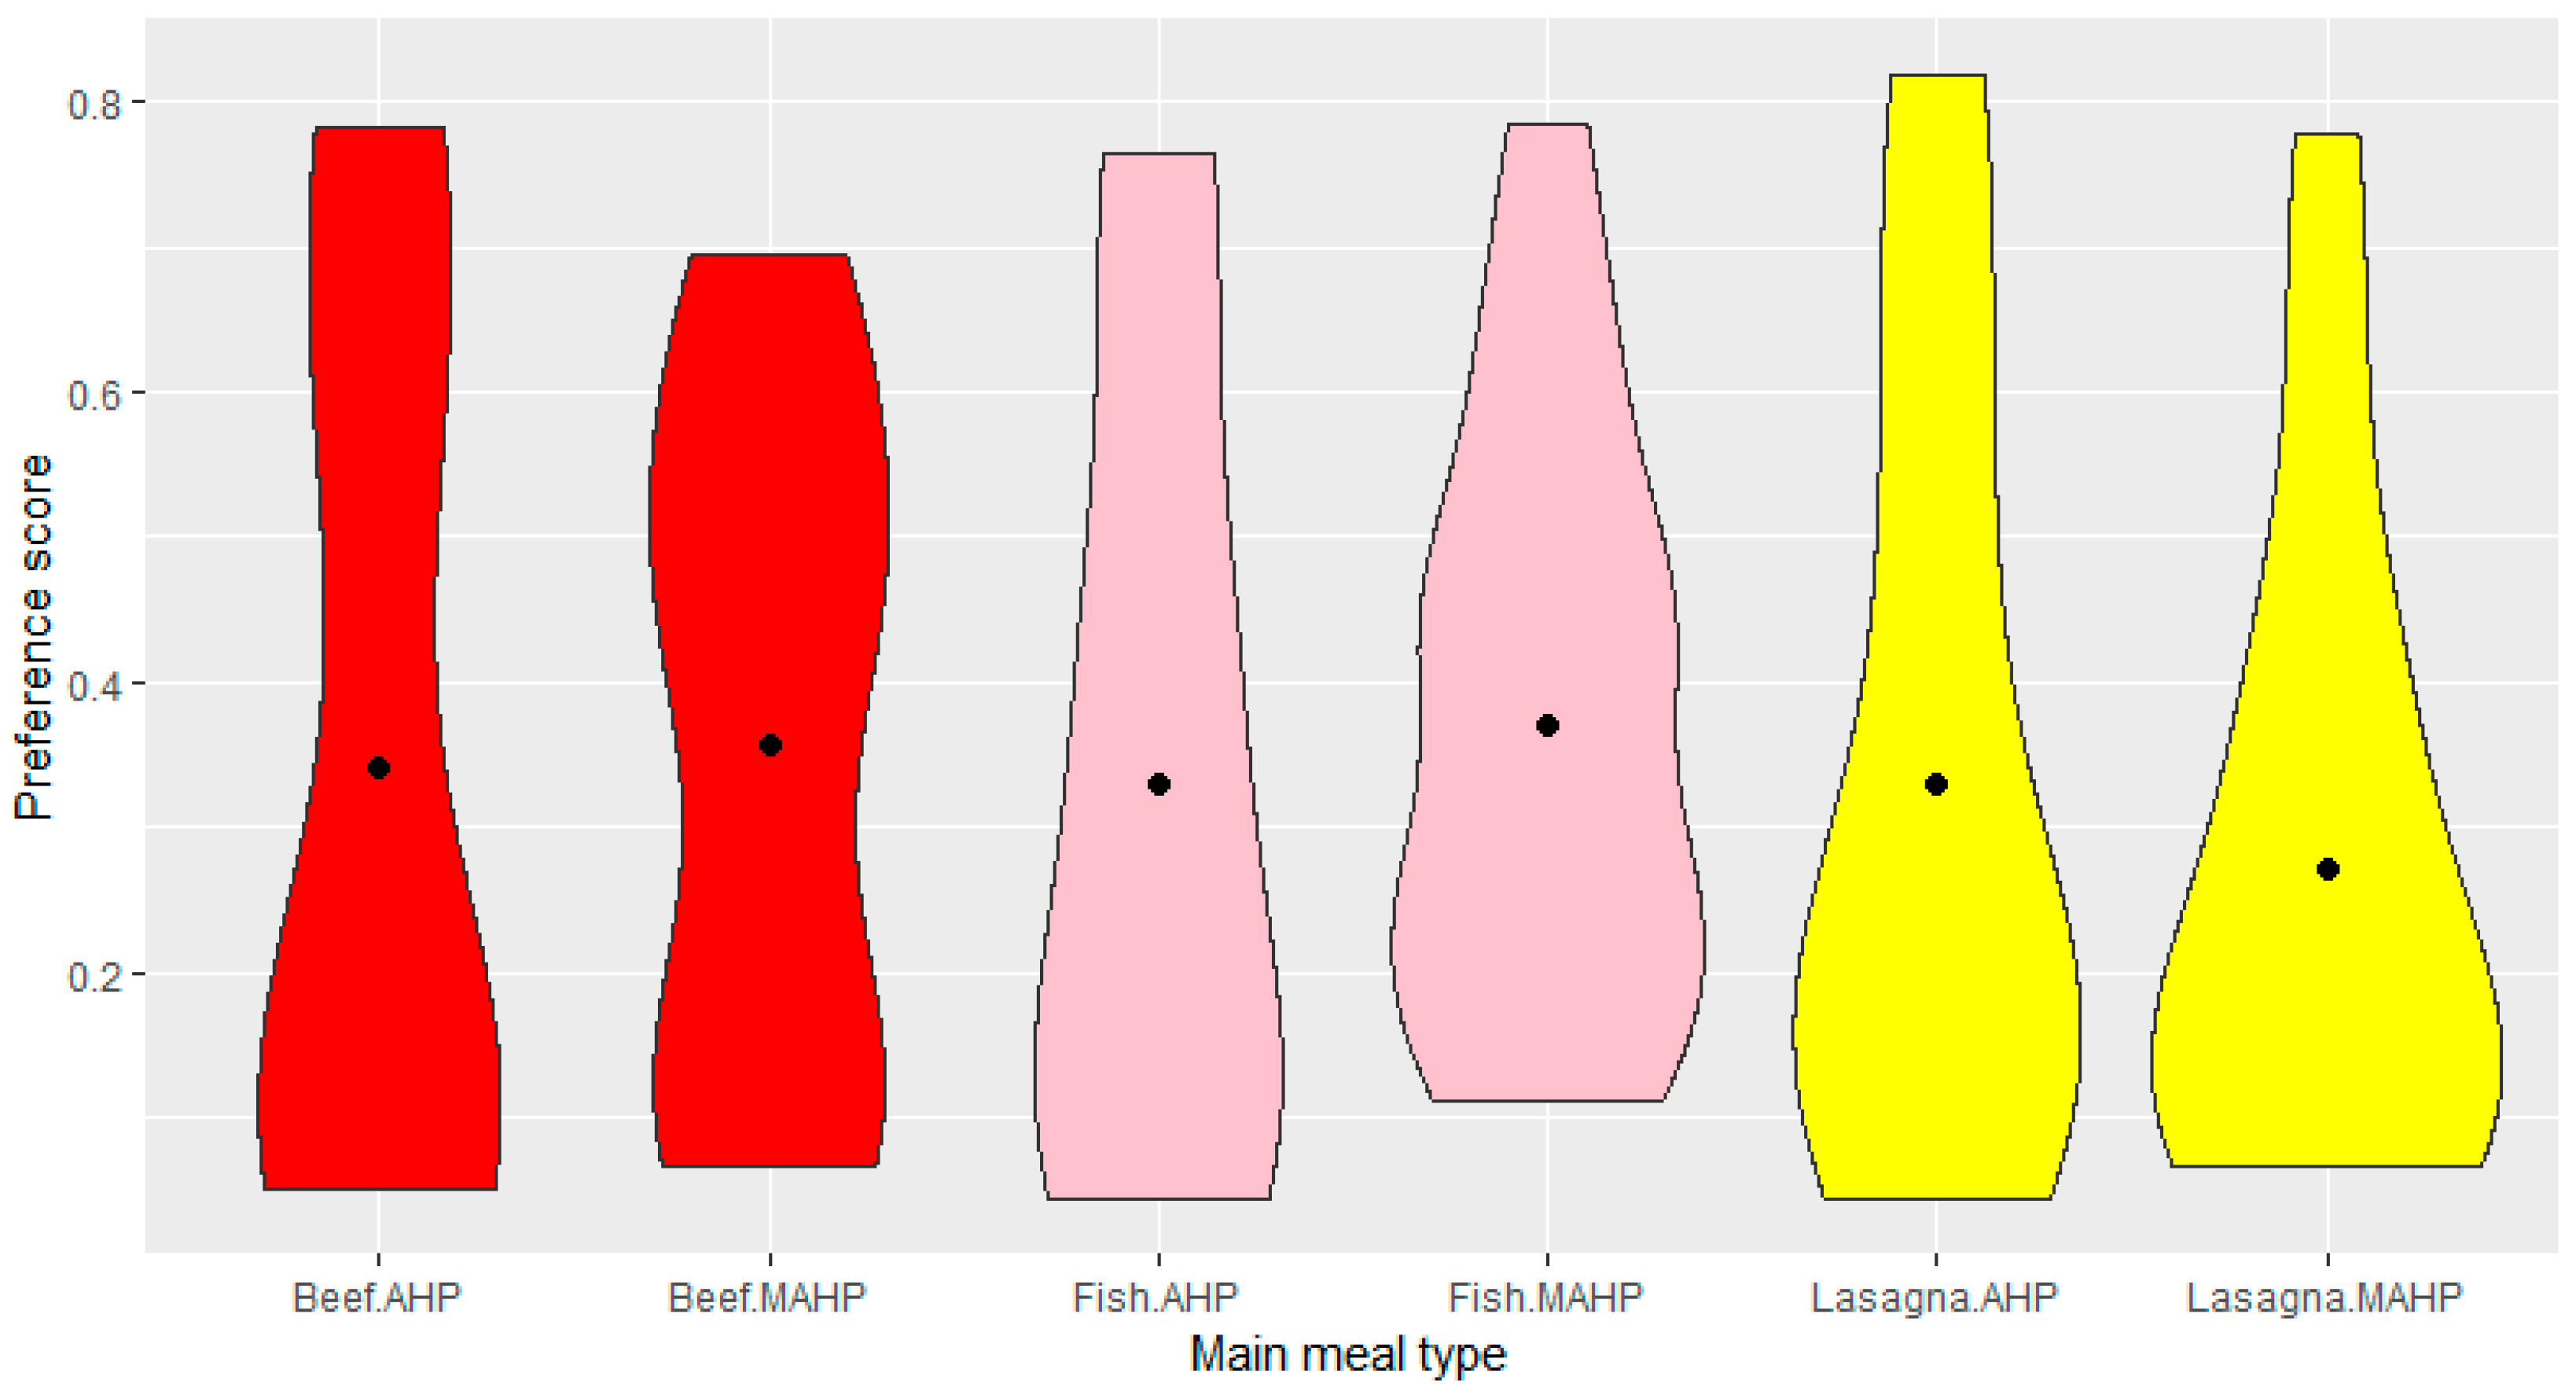
3.3. Three Alternatives: Beef, Fish, or Vegetable Lasagna?

With three alternatives, preferences for each were more variably distributed. All individuals generally exhibited a preference for one of the options over the other two, although which alternative was preferred varied by individual, as might be expected given different taste preferences (Figure 4).
While all completed the MAHP comparison, only 18 of the 25 respondents completed the AHP pairwise comparison. Of these, half were found to be inconsistent (Figure 5). The MAHP results were also tested for inconsistencies, which may arise as an artifact of the discrete nature of the preference options. However, as expected, the GCI was zero for most of the observations and well below the critical level (0.315) for all (Figure 5).
As above, the preferences scores for each individual derived using both approaches were compared using a paired t-test. The scores were tested using all data between individuals who were consistent in the AHP comparisons and those who were inconsistent in the AHP comparisons (Table 2). In all cases, the scores for each meal were not statistically significantly different between the two approaches, reflecting the wide variation in preferences in each of the options.
The rankings of the derived preference weights using each approach were also compared (Table 3). In most cases, when considering all observations, the ranks of the alternative were the same using both approaches, but for several individuals the ranks changed substantially between the two preference elicitation methods. For example, the derived preferences for five individuals resulted in one option being ranked first using the MAHP but third using the AHP (Table 3). Less extreme rank changes were observed when considering only those observations that were consistent (as defined by the GCI), although the number of rank changes was still a relatively high proportion, especially for the first two ranked options.

3.4. Four Alternatives: Dessert

The four-alternative comparison again resulted in similar distributions using both approaches, with similar mean preference scores for each (Figure 6). However, as might be expected given the number of pairwise comparisons for the AHP, nearly all individuals provided inconsistent responses (Figure 7). In contrast, none of the responses from the MAHP had higher GCI values greater than the critical value (i.e., 0.353). The AHP responses at the individual level were also statistically significantly different than the MAHP responses for three of the four alternatives considered (Table 4). As nearly all respondents provided inconsistent responses to the AHP comparisons, there were too few consistent responses to test the differences in the distributions by consistency level.
As with the three-alternative example, the rankings of the derived preferences weights using each approach for the four alternatives were also compared (Table 5). In most cases, the ranks of the alternative were the same using both approaches, but in some cases the ranks changed substantially. For example, 1 respondent ranked an option first using the MAHP but forth using the AHP pairwise comparison. These cases were limited, and in most cases where the ranks changed, these did so by only one level. As nearly all the observations were inconsistent (based on the GCI) for the AHP results, a consistent subset could not be considered separately (as in Table 3).

3.5. Respondents’ Preferences for Each Method (a User Perspective)

At the end of the survey, respondents were also asked to indicate which approach they thought was easiest. This was asked using both approaches. There was no apparent strong preference for one approach or another (Figure 8), with preferences distributed across the range for both. The first pair of distributions in Figure 8 (i.e., the blue distributions) represent the preference for the MAHP approach (“Modified”) derived from the pairwise (AHP) and grouped (MAHP) comparisons, respectively, while the second pair (i.e., the green distributions) represent the preference for the traditional AHP (“Pairwise”), again derived from the pairwise (AHP) and grouped (MAHP) comparisons, respectively. As there were only two alternatives, there are no inconsistencies, and the distributions are reciprocal.
The paired t-test suggested that there was no statistically significant difference between the preference scores of the individuals based on the method used (Table 6). However, comparing the samples as a whole, the mean of the preference for the MAHP approach was statistically significantly different (and slightly higher) than the mean of the preference for the pairwise (AHP) approach when using the MAHP (t = 2.146, DF = 48), but not statistically significantly different when using the pairwise AHP approach (t = −0.1345, DF = 36).
When comparing preference ranks, the preference ranking changed for 11 of the 18 individuals across the two methods (i.e., the derived weight was equal to or higher than 0.5 for one of the options using one approach, but less than 0.5 using the other). We define “rank consistency” in Figure 9 as observations that were consistently ranked first or second using both approaches (compared with the GCI measure of inconsistency). While potentially spurious, the respondents who were most consistent in terms of rank of the two alternatives were those who also had the greatest preference for the MAHP approach.
In all the cases above, the paired t-test and ranking comparisons were only applied to respondents who provided a response to both the AHP and the MAHP version of the questions in the survey. Several respondents systematically did not complete the pairwise (AHP) comparisons but completed the grouped (MAHP) comparisons (Figure 10), possibly suggesting that these individuals did not feel confident in completing the pairwise comparisons.

4. Discussion

4.1. Advantages of MAHP over Traditional AHP for Online Surveys

The increased availability of online survey providers and the decreasing costs of data collection through such providers offers opportunities for analysts to increase the range of stakeholders and their geographic distribution surveyed to support decision-making. The loss of direct interaction with survey respondents, however, also comes at a potential cost of increased inconsistency in the results (and with that, potentially biased weightings), as the ability to feed back to individuals is limited. This has also sparked an increase in the number of methods to try and retrospectively adjust AHP scores to reduce the influence of inconsistencies (e.g., [8,57,58]).
As noted in the introduction, inconsistencies can arise for a number of reasons, including as an artefact of the discrete nature of the responses when a fractional preference score may be required to totally eliminate inconsistencies [27,59]. The MAHP is still susceptible to this, although its effect on the results was relatively minor. For the four-comparison example (i.e., dessert), seven of the 25 MAHP responses had a GCI = 0, while a further seven had a GCI < 0.05. The largest inconsistency observed was GCI = 0.24, well below the threshold value of 0.353 for four variables. In contrast, only one of the 18 respondents who completed the bivariate AHP comparisons had a GCI = 0, with all others having a GCI greater than the critical value (i.e., GCI > 0.353), with a maximum value of GCI = 1.7. The substantial difference between the proportion of inconsistency between the two approaches suggests that the discrete nature of the responses has only a relatively small impact on the level of inconsistency, with the other causes of inconsistency identified in the literature having a substantially greater impact.
In our study, differences between the MAHP- and the AHP-derived scores increased with increasing complexity. With three or fewer options to compare, both approaches produced statistically similar results (i.e., not statistically different). With four comparisons, the proportion of inconsistent responses increased substantially for the AHP but not for the MAHP. The derived weights were also statistically significantly different for three of the four dessert options, reflecting the effects of inconsistencies on the derived preference weights.
The preference weight rankings were also found to change in some cases with the approach used. With the MAHP, the relative rankings of alternatives form an implicit key role of the elicitation process, as all alternatives are compared at the same time. As a result, the relative rankings of the alternatives are obvious to the respondent and will influence how they score each alternative. In contrast, the traditional pairwise AHP compares only two alternatives at a time, and the implicit set of ranking across all alternatives (if not preference weights) is obfuscated. With only one direct comparison in the “water” scenario, both approaches produced similar ranks (with only two exceptions). In contrast, with the four-alternative scenario, the ranking of each option was more varied between the two elicitation approaches. This does not explain, however, the contradictory outcomes in the final scenario where the two approaches themselves were compared for ease of use. In this case, both may have been influenced by some of the many other drivers of inconsistency in responses, particularly as the cake was waiting and respondents may have rushed the last question to ensure they got their fair share (a consequence of the tragedy of the commons).
The ease with which the respondents can complete the survey task is an indicator of the acceptability of the weighting approach (e.g., [47,60,61]). In our study, respondents were all able (and willing) to complete the comparisons when presented as a group (MAHP), but several were not willing (or able) to complete the pairwise (AHP) comparisons. This represents a revealed preference for the MAHP comparison approach over the pairwise comparison. Using the MAHP approach also suggested a significant preference for that approach, although no statistical difference was apparent when using the AHP to assess both approaches, at least not within the subset of those who completed the AHP comparison.

4.2. Advantages of MAHP over Other Weighting Methods

A range of methods other than the traditional AHP has been applied in the literature to assess preference weights. While these were not explicitly tested in this study, some general advantages of the MAHP can be inferred.
A commonly applied approach is to use ranking- or rating-based approaches [2,3,4,5,6,7]. These largely involve scoring each alternative usually from 0 to 100, with variants of the approach either awarding the most preferred a value of 100 and then scoring the other options relative to this, or awarding the least preferred a value of 10 and again scoring the other options relative to this [3]. In other approaches, points are allocated across alternatives such that they sum to a given value (e.g., 100) [4]. These approaches have the advantage that they avoid issues around inconsistency. However, comparative studies of these methods suggest in some cases that the objective weights may vary considerably between methods [7,10], although others have found higher correlations between the results of the different methods [11].
The MAHP approach has some benefits over these other rating-based approaches in that the resultant weights are not sensitive to the highest scores given. For example, a score of A = 9, B = 7 yields AB = 2, which is the same as if A = 5 and B = 3, and the same derived weight. In contrast, a rating-based approach would result in closer weights between the options in the first case (9, 7) than in the second case (5, 3).
Other approaches have also been developed to reduce the number of comparisons required using the AHP. For example, Abastante, et al. [62] developed a parsimonious AHP method that involved first rating each criterion (e.g., 0–100) and then using bivariate comparisons on a subset of alternatives using a set of reference criteria defined by the initial ratings with linear interpolation used to assess the weights for the excluded criteria. The approach was also applied by Duleba [63] to a transport development decision problem, who also validated the method against a traditional AHP approach, and by Jamal Mahdi and Esztergár-Kiss [64] to identify the importance of different criteria to the choice of tourism destinations. While the parsimonious AHP method helps reduce the number of pairwise comparisons required, it requires interaction with the decision-makers to first assess the initial rankings in order to determine the appropriate sets of pairwise comparisons. It is therefore less amenable to online surveys, where direct interactions are infeasible and potentially the set of respondents may be large.
Best–worst analysis has also been used in online surveys largely to rank alternatives or attributes (e.g., [65]). These generally require counts of responses over the survey sample and are less amenable to eliciting individual preferences. Rezaei [66], Rezaei [67], and Liu, et al. [68] developed variants of a best–worst multicriteria decision-making method where decision-makers first identified their best and worst alternatives, and pairwise comparisons were then developed based on comparing other alternatives to these best–worst alternatives. The decision-makers were then resurveyed to elicit their individual preferences. This additional step increases the complexity of the approach relative to the MAHP, which can be undertaken in a single step. Other best–worst scaling approaches have been developed in a form analogous to choice experiments for use in online surveys. While these have been successfully applied to elicit preferences (e.g., [69,70,71]), they are often limited to relatively few alternatives and require large samples to develop robust weightings.

4.3. Other Advantages of MAHP

The MAHP also has some additional advantages over the pairwise AHP approach. For example, the MAHP limits the potential range of the option scores to a maximum difference of 9. With the AHP, if AB = 9 and BC = 9, it would imply that AC should be substantially greater than 9, although the AHP is constrained to a maximum of AC = 9 (contributing to inconsistency in the results). In the MAHP, if respondents select extreme values (e.g., all “extremely important” with a value of 9) for all options, the outcome is an equal weight for each. This is also the case if all are considered less important.
A further advantage of the MAHP is that it is similar in appearance to a standard Likert scale, which is commonly applied in social science research [72]. As a result, its appearance will be familiar to many potential survey respondents. Kusmaryono, et al. [73] found that 90% of studies using a Likert scale employed odd choice category values (e.g., 5, 7, 9) and that the use of a rating scale with an odd number greater than five was the most effective in terms of reliability and validity coefficients [73]. While often considered ordinal, Wu and Leung [74] found that Likert scales with more than seven points were highly correlated with cardinal scales and hence could be considered appropriate for arithmetic operations. The use of a nine-point scale in the MAHP is thus consistent with best practice. This may also explain the higher response rate in the survey to the MAHP question than in the traditional AHP bivariate comparison, as the question format was more familiar to respondents.
While not considered in this study (which was aimed at comparing the “traditional” and modified approach to the initial comparisons), the MAHP approach allows for the potential for irrelevant alternatives to be effectively removed from the comparison set. This can be applied through the addition of an NA or zero option (i.e., not at all important), signaling that this option is irrelevant and can be removed from the set of comparisons (and assigned a weight of zero). In contrast, the traditional AHP and other systems produce a non-zero weight for all options in the set considered. Related to this, addition or subtraction of an alternative using the traditional AHP may result in a change in the relative weightings of the previous alternatives, and in some cases reverse the ranking of these alternatives [75]. In the MAHP, adding or removing an alternative does not affect the relative relationship of those retained and hence is not susceptible to rank reversal as a result of changes in the choice set.

4.4. Limitations of MAHP

The MAHP was developed for ease of application as an online survey, as the purpose for which it was originally developed involved surveying a wide range of interest groups that were geographically dispersed over a large region, making face-to-face interviews impractical [50]. The use of online surveys in general for preference elicitation, while becoming more common, still has a range of issues. Foremost of these is the issue of self-selection, as it is likely that those with strong views are more likely to respond. This issue is common to all online surveys irrespective of the method employed to elicit preferences.

5. Conclusions

The aim of this study was to formally present an alternative approach to preference elicitation that may be beneficial particularly when using online surveys.
The approach derives from the traditional AHP, and hence we have termed it the modified AHP (MAHP). Testing the two approaches through an experimental trial generally revealed that the MAHP produced statistically similar results to the AHP for relatively simple comparisons (i.e., two or three options) but potentially performed better (in terms of fewer inconsistent results) when a higher number of options was compared. Ease of use—a key perceived benefit of the AHP—was also considered similar between the two approaches by those who responded to this question (with the MAHP having a significantly higher preference in one of the comparisons). Higher non-response to the AHP questions also suggested a revealed preference for the MAHP.
The approach is not aimed at replacing other existing alternative approaches (such as best–worst analysis or the parsimonious AHP) but provides an additional tool in the decision analyst’s toolbox. The approach is conceptually simple and provides weight estimates consistent with (and in many cases more robust than) traditional AHP methods.

Author Contributions

Conceptualization, S.P. and A.F.; methodology, S.P.; software, S.P.; formal analysis, S.P.; investigation, S.P., A.F., R.N., S.L. and K.A.; resources, A.F.; data curation, S.P.; writing—original draft preparation, S.P.; writing—review and editing, S.P., A.F., R.N., S.L. and K.A.; visualization, S.P.; funding acquisition, A.F. All authors have read and agreed to the published version of the manuscript.

Funding

This work was partially supported by the Australian Research Council Discovery Early Career Researcher Award [grant number DE23010006].

Data Availability Statement

The survey data are available from the authors on request.

Acknowledgments

The authors would like to thank the students who participated in this study.

Conflicts of Interest

The authors declare no conflicts of interest. The funders had no role in the design of the study; in the collection, analyses, or interpretation of data; in the writing of the manuscript; or in the decision to publish the results.

References

  1. Gan, X.; Fernandez, I.C.; Guo, J.; Wilson, M.; Zhao, Y.; Zhou, B.; Wu, J. When to use what: Methods for weighting and aggregating sustainability indicators. Ecol. Indic. 2017, 81, 491–502. [Google Scholar] [CrossRef]
  2. Roberts, R.; Goodwin, P. Weight approximations in multi-attribute decision models. J. Multi-Criteria Decis. Anal. 2002, 11, 291–303. [Google Scholar] [CrossRef]
  3. Bottomley, P.A.; Doyle, J.R. A comparison of three weight elicitation methods: Good, better, and best. Omega 2001, 29, 553–560. [Google Scholar] [CrossRef]
  4. Bottomley, P.A.; Doyle, J.R.; Green, R.H. Testing the reliability of weight elicitation methods: Direct rating versus point allocation. J. Mark. Res. 2000, 37, 508–513. [Google Scholar] [CrossRef]
  5. Wang, J.-J.; Jing, Y.-Y.; Zhang, C.-F.; Zhao, J.-H. Review on multi-criteria decision analysis aid in sustainable energy decision-making. Renew. Sustain. Energy Rev. 2009, 13, 2263–2278. [Google Scholar] [CrossRef]
  6. Hayashi, K. Multicriteria analysis for agricultural resource management: A critical survey and future perspectives. Eur. J. Oper. Res. 2000, 122, 486–500. [Google Scholar] [CrossRef]
  7. Doyle, J.R.; Green, R.H.; Bottomley, P.A. Judging Relative Importance: Direct Rating and Point Allocation Are Not Equivalent. Organ. Behav. Hum. Decis. Process. 1997, 70, 65–72. [Google Scholar] [CrossRef] [PubMed]
  8. Aguarón, J.; Escobar, M.T.; Moreno-Jiménez, J.M. Reducing inconsistency measured by the geometric consistency index in the analytic hierarchy process. Eur. J. Oper. Res. 2021, 288, 576–583. [Google Scholar] [CrossRef]
  9. Cinelli, M.; Kadziński, M.; Gonzalez, M.; Słowiński, R. How to support the application of multiple criteria decision analysis? Let us start with a comprehensive taxonomy. Omega 2020, 96, 102261. [Google Scholar] [CrossRef]
  10. Pöyhönen, M.; Hämäläinen, R.P. On the convergence of multiattribute weighting methods. Eur. J. Oper. Res. 2001, 129, 569–585. [Google Scholar] [CrossRef]
  11. Van Ittersum, K.; Pennings, J.M.E.; Wansink, B.; van Trijp, H.C.M. The validity of attribute-importance measurement: A review. J. Bus. Res. 2007, 60, 1177–1190. [Google Scholar] [CrossRef]
  12. Saaty, T.L. The Analytic Hierarchy Process; McGraw-Hill: New York, NY, USA, 1980. [Google Scholar]
  13. Saaty, T.L. Decision-Making for Leaders; Wadsworth: Belmont, CA, USA, 1982. [Google Scholar]
  14. Canco, I.; Kruja, D.; Iancu, T. AHP, a reliable method for quality decision making: A case study in business. Sustainability 2021, 13, 13932. [Google Scholar] [CrossRef]
  15. Sequeira, M.; Hilletofth, P.; Adlemo, A. AHP-based support tools for initial screening of manufacturing reshoring decisions. J. Glob. Oper. Strateg. Sourc. 2021, 14, 502–527. [Google Scholar] [CrossRef]
  16. Rivero Gutiérrez, L.; De Vicente Oliva, M.A.; Romero-Ania, A. Managing Sustainable Urban Public Transport Systems: An AHP Multicriteria Decision Model. Sustainability 2021, 13, 4614. [Google Scholar] [CrossRef]
  17. Khan, I.; Pintelon, L.; Martin, H. The Application of Multicriteria Decision Analysis Methods in Health Care: A Literature Review. Med. Decis. Mak. 2022, 42, 262–274. [Google Scholar] [CrossRef]
  18. Deng, J.; King, B.; Bauer, T. Evaluating natural attractions for tourism. Ann. Tour. Res. 2002, 29, 422–438. [Google Scholar] [CrossRef]
  19. Hajkowicz, S.; Collins, K. A Review of Multiple Criteria Analysis for Water Resource Planning and Management. Water Resour. Manag. 2007, 21, 1553–1566. [Google Scholar] [CrossRef]
  20. Huang, I.B.; Keisler, J.; Linkov, I. Multi-criteria decision analysis in environmental sciences: Ten years of applications and trends. Sci. Total Environ. 2011, 409, 3578–3594. [Google Scholar] [CrossRef]
  21. Nielsen, J.R.; Mathiesen, C. Stakeholder preferences for Danish fisheries management of sand eel and Norway pout. Fish. Res. 2006, 77, 92–101. [Google Scholar] [CrossRef]
  22. Soma, K. How to involve stakeholders in fisheries management—A country case study in Trinidad and Tobago. Mar. Policy 2003, 27, 47–58. [Google Scholar] [CrossRef]
  23. Wattage, P.; Mardle, S. Stakeholder preferences towards conservation versus development for a wetland in Sri Lanka. J. Environ. Manag. 2005, 77, 122–132. [Google Scholar] [CrossRef]
  24. Baby, S. AHP Modeling for Multicriteria Decision-Making and to Optimise Strategies for Protecting Coastal Landscape Resources. Int. J. Innov. Manag. Technol. 2013, 4, 218–227. [Google Scholar] [CrossRef]
  25. Amor, S.B.; Belaid, F.; Benkraiem, R.; Ramdani, B.; Guesmi, K. Multi-criteria classification, sorting, and clustering: A bibliometric review and research agenda. Ann. Oper. Res. 2023, 325, 771–793. [Google Scholar] [CrossRef]
  26. Thadsin, K.; George, H.; Stanley, M. Introduction of AHP Satisfaction Index for workplace environments. J. Corp. Real Estate 2012, 14, 80–93. [Google Scholar]
  27. Bodin, L.; Gass, S.I. On teaching the analytic hierarchy process. Comput. Oper. Res. 2003, 30, 1487–1497. [Google Scholar] [CrossRef]
  28. Kwiesielewicz, M.; van Uden, E. Inconsistent and contradictory judgements in pairwise comparison method in the AHP. Comput. Oper. Res. 2004, 31, 713–719. [Google Scholar] [CrossRef]
  29. Lipovetsky, S.; Conklin, M.W. Robust estimation of priorities in the AHP. Eur. J. Oper. Res. 2002, 137, 110–122. [Google Scholar] [CrossRef]
  30. Danner, M.; Vennedey, V.; Hiligsmann, M.; Fauser, S.; Gross, C.; Stock, S. How Well Can Analytic Hierarchy Process be Used to Elicit Individual Preferences? Insights from a Survey in Patients Suffering from Age-Related Macular Degeneration. Patient-Patient-Cent. Outcomes Res. 2016, 9, 481–492. [Google Scholar] [CrossRef]
  31. Sato, Y.; Tan, K.H. Inconsistency indices in pairwise comparisons: An improvement of the Consistency Index. Ann. Oper. Res. 2023, 326, 809–830. [Google Scholar] [CrossRef]
  32. Bose, A. Improving consistency classification: An innovative benchmark-based approach for the AHP. J. Multi-Criteria Decis. Anal. 2024, 31, e1821. [Google Scholar] [CrossRef]
  33. Mufazzal, S.; Masood, S.; Khan, N.Z.; Muzakkir, S.M.; Khan, Z.A. Towards minimization of overall inconsistency involved in criteria weights for improved decision making. Appl. Soft Comput. 2021, 100, 106936. [Google Scholar] [CrossRef]
  34. Schmidt, F.L.; Hunter, J.E. Theory Testing and Measurement Error. Intelligence 1999, 27, 183–198. [Google Scholar] [CrossRef]
  35. Ishizaka, A.; Labib, A. Review of the main developments in the analytic hierarchy process. Expert Syst. Appl. 2011, 38, 14336–14345. [Google Scholar] [CrossRef]
  36. Tozer, P.R.; Stokes, J.R. Producer Breeding Objectives and Optimal Sire Selection. J. Dairy Sci. 2002, 85, 3518–3525. [Google Scholar] [CrossRef] [PubMed]
  37. Hummel, J.M.; Steuten, L.G.M.; Groothuis-Oudshoorn, C.J.M.; Mulder, N.; IJzerman, M.J. Preferences for Colorectal Cancer Screening Techniques and Intention to Attend: A Multi-Criteria Decision Analysis. Appl. Health Econ. Health Policy 2013, 11, 499–507. [Google Scholar] [CrossRef] [PubMed]
  38. Pascoe, S.; Dichmont, C.M.; Brooks, K.; Pears, R.; Jebreen, E. Management objectives of Queensland fisheries: Putting the horse before the cart. Mar. Policy 2013, 37, 115–122. [Google Scholar] [CrossRef]
  39. Ishizaka, A.; Lusti, M. An expert module to improve the consistency of AHP matrices. Int. Trans. Oper. Res. 2004, 11, 97–105. [Google Scholar] [CrossRef]
  40. Françozo, R.V.; Junior, L.S.V.U.; Carrapateira, E.S.; Pacheco, B.C.S.; Oliveira, M.T.; Torsoni, G.B.; Yari, J. A web-based software for group decision with analytic hierarchy process. MethodsX 2023, 11, 102277. [Google Scholar] [CrossRef] [PubMed]
  41. Yang, I.T.; Wang, W.-C.; Yang, T.-I. Automatic repair of inconsistent pairwise weighting matrices in analytic hierarchy process. Autom. Constr. 2012, 22 (Suppl. C), 290–297. [Google Scholar] [CrossRef]
  42. Lin, C.-C.; Wang, W.-C.; Yu, W.-D. Improving AHP for construction with an adaptive AHP approach (A3). Autom. Constr. 2008, 17, 180–187. [Google Scholar] [CrossRef]
  43. Karanik, M.; Wanderer, L.; Gomez-Ruiz, J.A.; Pelaez, J.I. Reconstruction methods for AHP pairwise matrices: How reliable are they? Appl. Math. Comput. 2016, 279 (Suppl. C), 103–124. [Google Scholar] [CrossRef]
  44. Benítez, J.; Delgado-Galván, X.; Izquierdo, J.; Pérez-García, R. Achieving matrix consistency in AHP through linearization. Appl. Math. Model. 2011, 35, 4449–4457. [Google Scholar] [CrossRef]
  45. Benítez, J.; Izquierdo, J.; Pérez-García, R.; Ramos-Martínez, E. A simple formula to find the closest consistent matrix to a reciprocal matrix. Appl. Math. Model. 2014, 38, 3968–3974. [Google Scholar] [CrossRef]
  46. Kou, G.; Ergu, D.; Shang, J. Enhancing data consistency in decision matrix: Adapting Hadamard model to mitigate judgment contradiction. Eur. J. Oper. Res. 2014, 236, 261–271. [Google Scholar] [CrossRef]
  47. Pascoe, S. A Simplified Algorithm for Dealing with Inconsistencies Using the Analytic Hierarchy Process. Algorithms 2022, 15, 442. [Google Scholar] [CrossRef]
  48. Pereira, V.; Costa, H.G. Nonlinear programming applied to the reduction of inconsistency in the AHP method. Ann. Oper. Res. 2015, 229, 635–655. [Google Scholar] [CrossRef]
  49. Cao, D.; Leung, L.C.; Law, J.S. Modifying inconsistent comparison matrix in analytic hierarchy process: A heuristic approach. Decis. Support Syst. 2008, 44, 944–953. [Google Scholar] [CrossRef]
  50. Pascoe, S.; Cannard, T.; Dowling, N.A.; Dichmont, C.M.; Breen, S.; Roberts, T.; Pears, R.J.; Leigh, G.M. Developing Harvest Strategies to Achieve Ecological, Economic and Social Sustainability in Multi-Sector Fisheries. Sustainability 2019, 11, 644. [Google Scholar] [CrossRef]
  51. Yang, Z.; Zhang, Z.-K.; Zhou, T. Anchoring bias in online voting. Europhys. Lett. 2012, 100, 68002. [Google Scholar] [CrossRef]
  52. Casper, W.C.; Edwards, B.D.; Wallace, J.C.; Landis, R.S.; Fife, D.A. Selecting response anchors with equal intervals for summated rating scales. J. Appl. Psychol. 2020, 105, 390–409. [Google Scholar] [CrossRef]
  53. Crawford, G.; Williams, C. A note on the analysis of subjective judgment matrices. J. Math. Psychol. 1985, 29, 387–405. [Google Scholar] [CrossRef]
  54. Aguarón, J.; Moreno-Jiménez, J.M. Local stability intervals in the analytic hierarchy process. Eur. J. Oper. Res. 2000, 125, 113–132. [Google Scholar] [CrossRef]
  55. Crawford, G.B. The geometric mean procedure for estimating the scale of a judgement matrix. Math. Model. 1987, 9, 327–334. [Google Scholar] [CrossRef]
  56. Aguarón, J.; Moreno-Jiménez, J.M. The geometric consistency index: Approximated thresholds. Eur. J. Oper. Res. 2003, 147, 137–145. [Google Scholar] [CrossRef]
  57. Zhang, R.; Gao, C.; Chen, X.; Li, F.; Yi, D.; Wu, Y. Genetic algorithm optimised Hadamard product method for inconsistency judgement matrix adjustment in AHP and automatic analysis system development. Expert Syst. Appl. 2023, 211, 118689. [Google Scholar] [CrossRef]
  58. Bose, A. Using genetic algorithm to improve consistency and retain authenticity in the analytic hierarchy process. Opsearch 2020, 57, 1070–1092. [Google Scholar] [CrossRef]
  59. Dhurkari, R.K. Remarks on the inconsistency measure of the Analytic Hierarchy Process. J. Intell. Fuzzy Syst. 2022, 43, 4669–4679. [Google Scholar] [CrossRef]
  60. Aloysius, J.A.; Davis, F.D.; Wilson, D.D.; Ross Taylor, A.; Kottemann, J.E. User acceptance of multi-criteria decision support systems: The impact of preference elicitation techniques. Eur. J. Oper. Res. 2006, 169, 273–285. [Google Scholar] [CrossRef]
  61. Hajkowicz, S.A.; McDonald, G.T.; Smith, P.N. An Evaluation of Multiple Objective Decision Support Weighting Techniques in Natural Resource Management. J. Environ. Plan. Manag. 2000, 43, 505–518. [Google Scholar] [CrossRef]
  62. Abastante, F.; Corrente, S.; Greco, S.; Ishizaka, A.; Lami, I.M. A new parsimonious AHP methodology: Assigning priorities to many objects by comparing pairwise few reference objects. Expert Syst. Appl. 2019, 127, 109–120. [Google Scholar] [CrossRef]
  63. Duleba, S. Introduction and comparative analysis of the multi-level parsimonious AHP methodology in a public transport development decision problem. J. Oper. Res. Soc. 2022, 73, 230–243. [Google Scholar] [CrossRef]
  64. Jamal Mahdi, A.; Esztergár-Kiss, D. Prioritizing Influential Factors on Tourist Decision-Making for Choosing Destinations Using Parsimonious Analytical Hierarchy Process (PAHP). Tour. Plan. Dev. 2024, 21, 330–353. [Google Scholar] [CrossRef]
  65. Stanco, M.; Lerro, M.; Marotta, G. Consumers’ Preferences for Wine Attributes: A Best-Worst Scaling Analysis. Sustainability 2020, 12, 2819. [Google Scholar] [CrossRef]
  66. Rezaei, J. Best-worst multi-criteria decision-making method. Omega 2015, 53, 49–57. [Google Scholar] [CrossRef]
  67. Rezaei, J. Best-worst multi-criteria decision-making method: Some properties and a linear model. Omega 2016, 64, 126–130. [Google Scholar] [CrossRef]
  68. Liu, P.; Zhu, B.; Wang, P. A weighting model based on best–worst method and its application for environmental performance evaluation. Appl. Soft Comput. 2021, 103, 107168. [Google Scholar] [CrossRef]
  69. Verzosa, N.; Greaves, S.; Ellison, R.; Ellison, A.; Davis, M. Eliciting preferences for ‘gamified’ travel surveys: A best-worst approach. Transp. Res. Procedia 2018, 32, 211–223. [Google Scholar] [CrossRef]
  70. Xu, R.H.; Zhou, L.-M.; Wong, E.L.-Y.; Wang, D. Investigating Medical Student’s Preferences for Internet-Based Healthcare Services: A Best-Worst Scaling Survey. Front. Public Health 2021, 9, 757310. [Google Scholar] [CrossRef]
  71. Schuster, A.L.R.; Crossnohere, N.L.; Campoamor, N.B.; Hollin, I.L.; Bridges, J.F.P. The rise of best-worst scaling for prioritization: A transdisciplinary literature review. J. Choice Model. 2024, 50, 100466. [Google Scholar] [CrossRef]
  72. Joshi, A.; Kale, S.; Chandel, S.; Pal, D.K. Likert Scale: Explored and Explained. Curr. J. Appl. Sci. Technol. 2015, 7, 396–403. [Google Scholar] [CrossRef]
  73. Kusmaryono, I.; Wijayanti, D.; Maharani, H.R. Number of Response Options, Reliability, Validity, and Potential Bias in the Use of the Likert Scale Education and Social Science Research: A Literature Review. Int. J. Educ. Methodol. 2022, 8, 625–637. [Google Scholar] [CrossRef]
  74. Wu, H.; Leung, S.-O. Can Likert Scales be Treated as Interval Scales?—A Simulation Study. J. Soc. Serv. Res. 2017, 43, 527–532. [Google Scholar] [CrossRef]
  75. Maleki, H.; Zahir, S. A Comprehensive Literature Review of the Rank Reversal Phenomenon in the Analytic Hierarchy Process. J. Multi-Criteria Decis. Anal. 2013, 20, 141–155. [Google Scholar] [CrossRef]
Figure 1. Example of a bivariate comparison used in the traditional AHP. A separate bivariate comparison is required for each set of alternatives.
Algorithms 17 00245 g001
Figure 2. Example of bivariate comparison in the MAHP. Additional alternatives are included as additional rows, and all alternatives are compared in the same question.
Algorithms 17 00245 g002
Figure 3. Two-alternative comparison preference distributions. The black dot represents the mean of the distribution. The light blue distributions represent the preferences for sparkling water estimated using both methods (AHP and MAHP respectively), and the green distributions represent the preferences for still water estimated using both methods.
Algorithms 17 00245 g003
Figure 4. Three-alternative comparison preference distributions. The black dot represents the mean of the distribution. The red distributions represent the preferences for Beef estimated using both methods (AHP and MAHP respectively), the pink distributions represent the preferences for fish estimated using both methods, and the yellow distributions represent the preferences for lasagna estimated using both methods.
Algorithms 17 00245 g004
Figure 5. Consistency indicator of responses for the three-alternative comparison: (a) MAHP and (b) AHP. Blue bars indicate consistent responses; red bars indicate inconsistent responses. The black vertical line indicates the GCI where CR = 0.1.
Algorithms 17 00245 g005
Figure 6. Four-alternative comparison preference distributions. The black dot represents the mean of the distribution. The brown distributions represent the preferences for fruit estimated using both methods (AHP and MAHP respectively), the red distributions represent the preferences for ice cream estimated using both methods, and the green distributions represent the preferences for jelly estimated using both methods, and the yellow distributions represent the preferences for pie estimated using both methods.
Algorithms 17 00245 g006
Figure 7. Consistency indicator of responses for the four-alternative comparison: (a) MAHP and (b) AHP. Blue bars indicate consistent responses; red bars indicate inconsistent responses. The black vertical line indicates the GCI where the CR = 0.1.
Algorithms 17 00245 g007
Figure 8. Perceptions of ease of use of each approach (derived using each approach). The black dot represents the mean of the distribution. The first part of the label represents the alternative considered, while the second part of the label represents the approach used to elicit the preference. For example, “Modified.AHP” represents the user preference for the use of the MAHP approach but derived using the traditional AHP. Conversely, “Pairwise.MAHP” represents the user preference for the use of the traditional AHP approach but derived using the MAHP. The light blue distributions represent the preferences for the use of MAHP estimated using both methods (AHP and MAHP respectively), and the green distributions represent the preferences for the pairwise AHP estimated using both methods.
Algorithms 17 00245 g008
Figure 9. Rank consistency when the scores are estimated using both approaches. The blue bars represent the preference weighting given to the MAHP by respondents who were rank-consistent in their relative ranking of each approach when estimated using each approach. The red bars represent the preference weighting given to the MAHP by respondents who were rank-inconsistent in their relative rankings across the two approaches. Those who were consistent in their responses tended to favor the MAHP (based on their preference weighting).
Algorithms 17 00245 g009
Figure 10. The number of responses to each question. The red indicates a non-response, which occurred only for bivariate (AHP)-related questions. All MAHP questions were answered by all respondents.
Algorithms 17 00245 g010
Table 1. Paired t-tests between the derived weights for the two-alternative question from each approach.
AlternativeMean ScoreMean
Difference
t-StatisticProbability
MAHPAHP
Still0.8000.836−0.036−0.7900.440
Sparkling0.1990.1640.0360.7900.440
Table 2. Paired t-tests between the derived weights for the three-alternative question from each approach. The t-test was undertaken for all observations, a subset of only those that were consistent in the traditional AHP, and the remainder of observations that were inconsistent in the traditional AHP.
AlternativeMean ScoreMean
Difference
t-StatisticProbability
MAHPAHP
All observations
Beef0.3570.3420.0160.3530.729
Fish0.3710.3290.0420.9730.349
Lasagna0.2720.329−0.058−1.0040.334
Consistent subset (AHP)
Beef0.3360.2710.0641.2050.262
Fish0.3860.3620.0250.4520.663
Lasagna0.2780.367−0.089−1.0190.338
Inconsistent subset (AHP)
Beef0.3960.469−0.072−1.0860.339
Fish0.3430.2700.0730.9600.392
Lasagna0.2610.261−0.001−0.0180.986
Table 3. Ranks of the three-alternative responses using each approach. The numbers in the table represent the number of observations where an alternative had the same relative rank (e.g., (1, 1), (2, 2), (3, 3)) or different ranks (e.g., (1, 2), (1, 3), etc.) based on the derived preference weights.
MAHP RankAHP Rank
123
All observations
11465
27153
34417
Consistent subset
1531
2450
3018
Table 4. Paired t-tests between the derived weights for the four-alternative question from each approach.
AlternativeMean ScoreMean
Difference
t-StatisticProbability
MAHPAHP
Ice cream0.2440.276−0.032−0.9430.359
Jelly0.1290.0940.0352.9540.009
Fruit0.4350.498−0.062−2.1970.042
Pie0.1910.1320.0593.5370.003
Table 5. Ranks of the four-alternative responses using each approach. The numbers in the table represent the number of observations where an alternative had the same relative rank (e.g., (1, 1), (2, 2), etc.)) or different ranks (e.g., (1, 2), (1, 3), etc.) based on the derived preference weights.
MAHP RankAHP Rank
1234
112321
231140
32484
410413
Table 6. Paired t-tests between the derived weights from each approach. In this case, the ease of use of each of the alternative methods was considered.
AlternativeMean ScoreMean
Difference
t-StatisticProbability
MAHPAHP
MAHP0.5570.4920.0650.7740.449
AHP0.4430.508−0.065−0.7740.449
Disclaimer/Publisher’s Note: The statements, opinions and data contained in all publications are solely those of the individual author(s) and contributor(s) and not of MDPI and/or the editor(s). MDPI and/or the editor(s) disclaim responsibility for any injury to people or property resulting from any ideas, methods, instructions or products referred to in the content.

