Article

Synthesis of Circular Antenna Arrays for Achieving Lower Side Lobe Level and Higher Directivity Using Hybrid Optimization Algorithm

1
Department of Electronics and Communication Engineering, Chandigarh University, Mohali 140413, Punjab, India
2
Department of Computer Engineering and Application, GLA University, Mathura 281406, Uttar Pradesh, India
3
Department of Computer Science Engineering, School of Engineering and Technology, JAIN University, Bangalore 560069, Karnataka, India
4
Department of Mathematics, Raghu Engineering College, Dakamarri 531162, Andhra Pradesh, India
5
Hourani Center for Applied Scientific Research, Al-Ahliyya Amman University, Amman 19328, Jordan
6
Faculty of Physics and Applied Computer Science, AGH University of Science and Technology, 30-059 Kraków, Poland
7
Faculty of Information Technology, Middle East University, Amman 11813, Jordan
8
Data Science Institute, University of Technology Sydney, Ultimo, NSW 2007, Australia
*
Author to whom correspondence should be addressed.
Algorithms 2024, 17(6), 256; https://doi.org/10.3390/a17060256
Submission received: 18 April 2024 / Revised: 28 May 2024 / Accepted: 5 June 2024 / Published: 11 June 2024
(This article belongs to the Collection Feature Paper in Algorithms and Complexity Theory)

Abstract

:
Circular antenna arrays (CAAs) find extensive utility in a range of cutting-edge communication applications such as 5G networks, the Internet of Things (IoT), and advanced beamforming technologies. In the realm of antenna design, the side lobes levels (SLL) in the radiation pattern hold significant importance within communication systems. This is primarily due to its role in mitigating signal interference across the entire radiation pattern’s side lobes. In order to suppress the subsidiary lobe, achieve the required primary lobe orientation, and improve directivity, an optimization problem is used in this work. This paper introduces a method aimed at enhancing the radiation pattern of CAA by minimizing its SLL using a Hybrid Sooty Tern Naked Mole-Rat Algorithm (STNMRA). The simulation results show that the hybrid optimization method significantly reduces side lobes while maintaining reasonable directivity compared to the uniform array and other competitive metaheuristics.

1. Introduction

Designing antennas with significant directional attributes is crucial in meeting the demands of long-range communication. To attain enhanced directional characteristics like expanded electrical size and higher gains, radiating elements are structured in a configuration that promotes constructive and destructive field patterns in desired and undesired directions, respectively [1,2]. This configuration boasts various advantages, including reduced Side Lobe Levels (SLL) and exceptionally high directive patterns. It also facilitates effective control over the array radiation pattern’s steering direction toward the optimal signal path. This control is achieved by manipulating factors like element count, excitation coefficients, inter-element spacing, relative phases, and the overall geometrical arrangement of the array (e.g., rectangular, linear, elliptical, circular, and others) [2].
Linear arrays, valued for their design simplicity and high main lobe directivity in a specific direction [2], come with the limitation of inefficient radiation across the full 360° azimuthal span. In contrast, circular arrays offer the advantage of electronic rotation without distorting the radiation pattern, allowing the main lobe to be directed and focused in any direction throughout 360° [3].
Circular antenna arrays (CAAs) are widely employed in modern communication systems due to their advantages over linear and rectangular arrays. Their optimal design, often involving the minimization of SLL, is crucial for mitigating undesirable radiation beams in electromagnetic transmission [4]. Parameters of significant interest during antenna array design encompass low SLL and a narrow First Null Beamwidth (FNBW). Many synthesis techniques primarily aim to suppress unwanted signals by minimizing SLL [5,6,7,8]. The application of evolutionary optimization algorithms to address complex engineering problems [9,10], particularly in array synthesis, is extensively explored in the existing literature. Prominent examples of these algorithms include Particle Swarm Optimization (PSO), Genetic Algorithm (GA), Gravitational Search Algorithm (GSA), and simulated annealing (SA), among others. These algorithms offer effective strategies for optimizing the design of circular antenna arrays, contributing to enhanced performance and reduced undesired radiation.
Singh et al. present an innovative approach to enhance the performance of non-uniform CAAs through the integration of optimization methodologies [11]. They proposed a hybridization of the integrated harmony search (IHS) algorithm with the Differential Evolution (DE) based Naked Mole-Rat Algorithm (NMRA) to address the optimization challenges associated with non-uniform CAAs (NUCAAs). The non-uniform spacing in circular arrays offers potential improvements in radiation pattern characteristics. Leveraging the harmonic search capabilities of IHS and the adaptive learning nature of DE-NMRA, the proposed approach optimizes the arrangement and attributes of the antennas within the circular array. The performance of the non-uniform CAA configurations is evaluated using a fitness function that assesses radiation pattern features and other desired criteria. Through iterative refinement, the hybrid algorithm converges towards solutions that exhibit superior performance. Our experiments demonstrate the efficacy of the integrated approach in achieving enhanced performance outcomes for non-uniform CAAs, making it particularly valuable for applications demanding precision in directional radiation patterns.
The Hybrid Sooty Tern NMRA (STNMRA), a recently introduced meta-heuristics, appears to be an enhancement of the standard Naked Mole-Rat Algorithm (NMRA) that addresses some of its limitations [12]. NMRA is a metaheuristic optimization algorithm inspired by the mating behavior of mole-rats, and it is used for solving various engineering problems [13]. STNMRA integrates the exploration capabilities of the Sooty Tern Optimization Algorithm (STOA) [14] into NMRA. By incorporating STOA, STNMRA aims to improve its ability to explore the solution space effectively. By combining the strengths of NMRA with the exploration capabilities of STOA, STNMRA aims to be a more robust and effective optimization algorithm. It can efficiently explore diverse solutions, escape local optima, and search for better solutions in complex optimization problems.
In this work, STNMRA is utilized to design CAA. STNMRA has solved the major problems of both STOA and NMRA, including premature stagnation because of poor exploitation in STOA and poor exploration in NMRA [15]. Hybridizing the algorithms forces the individual algorithms to work in tandem to deliver consistent solutions and provide a better chance of balanced exploration and exploitation. STNMRA has also proved its worth in solving many real-world optimization problems [12].
The paper outlines several key contributions related to optimizing CAAs to achieve specific performance objectives. The main contributions of this work are as follows:
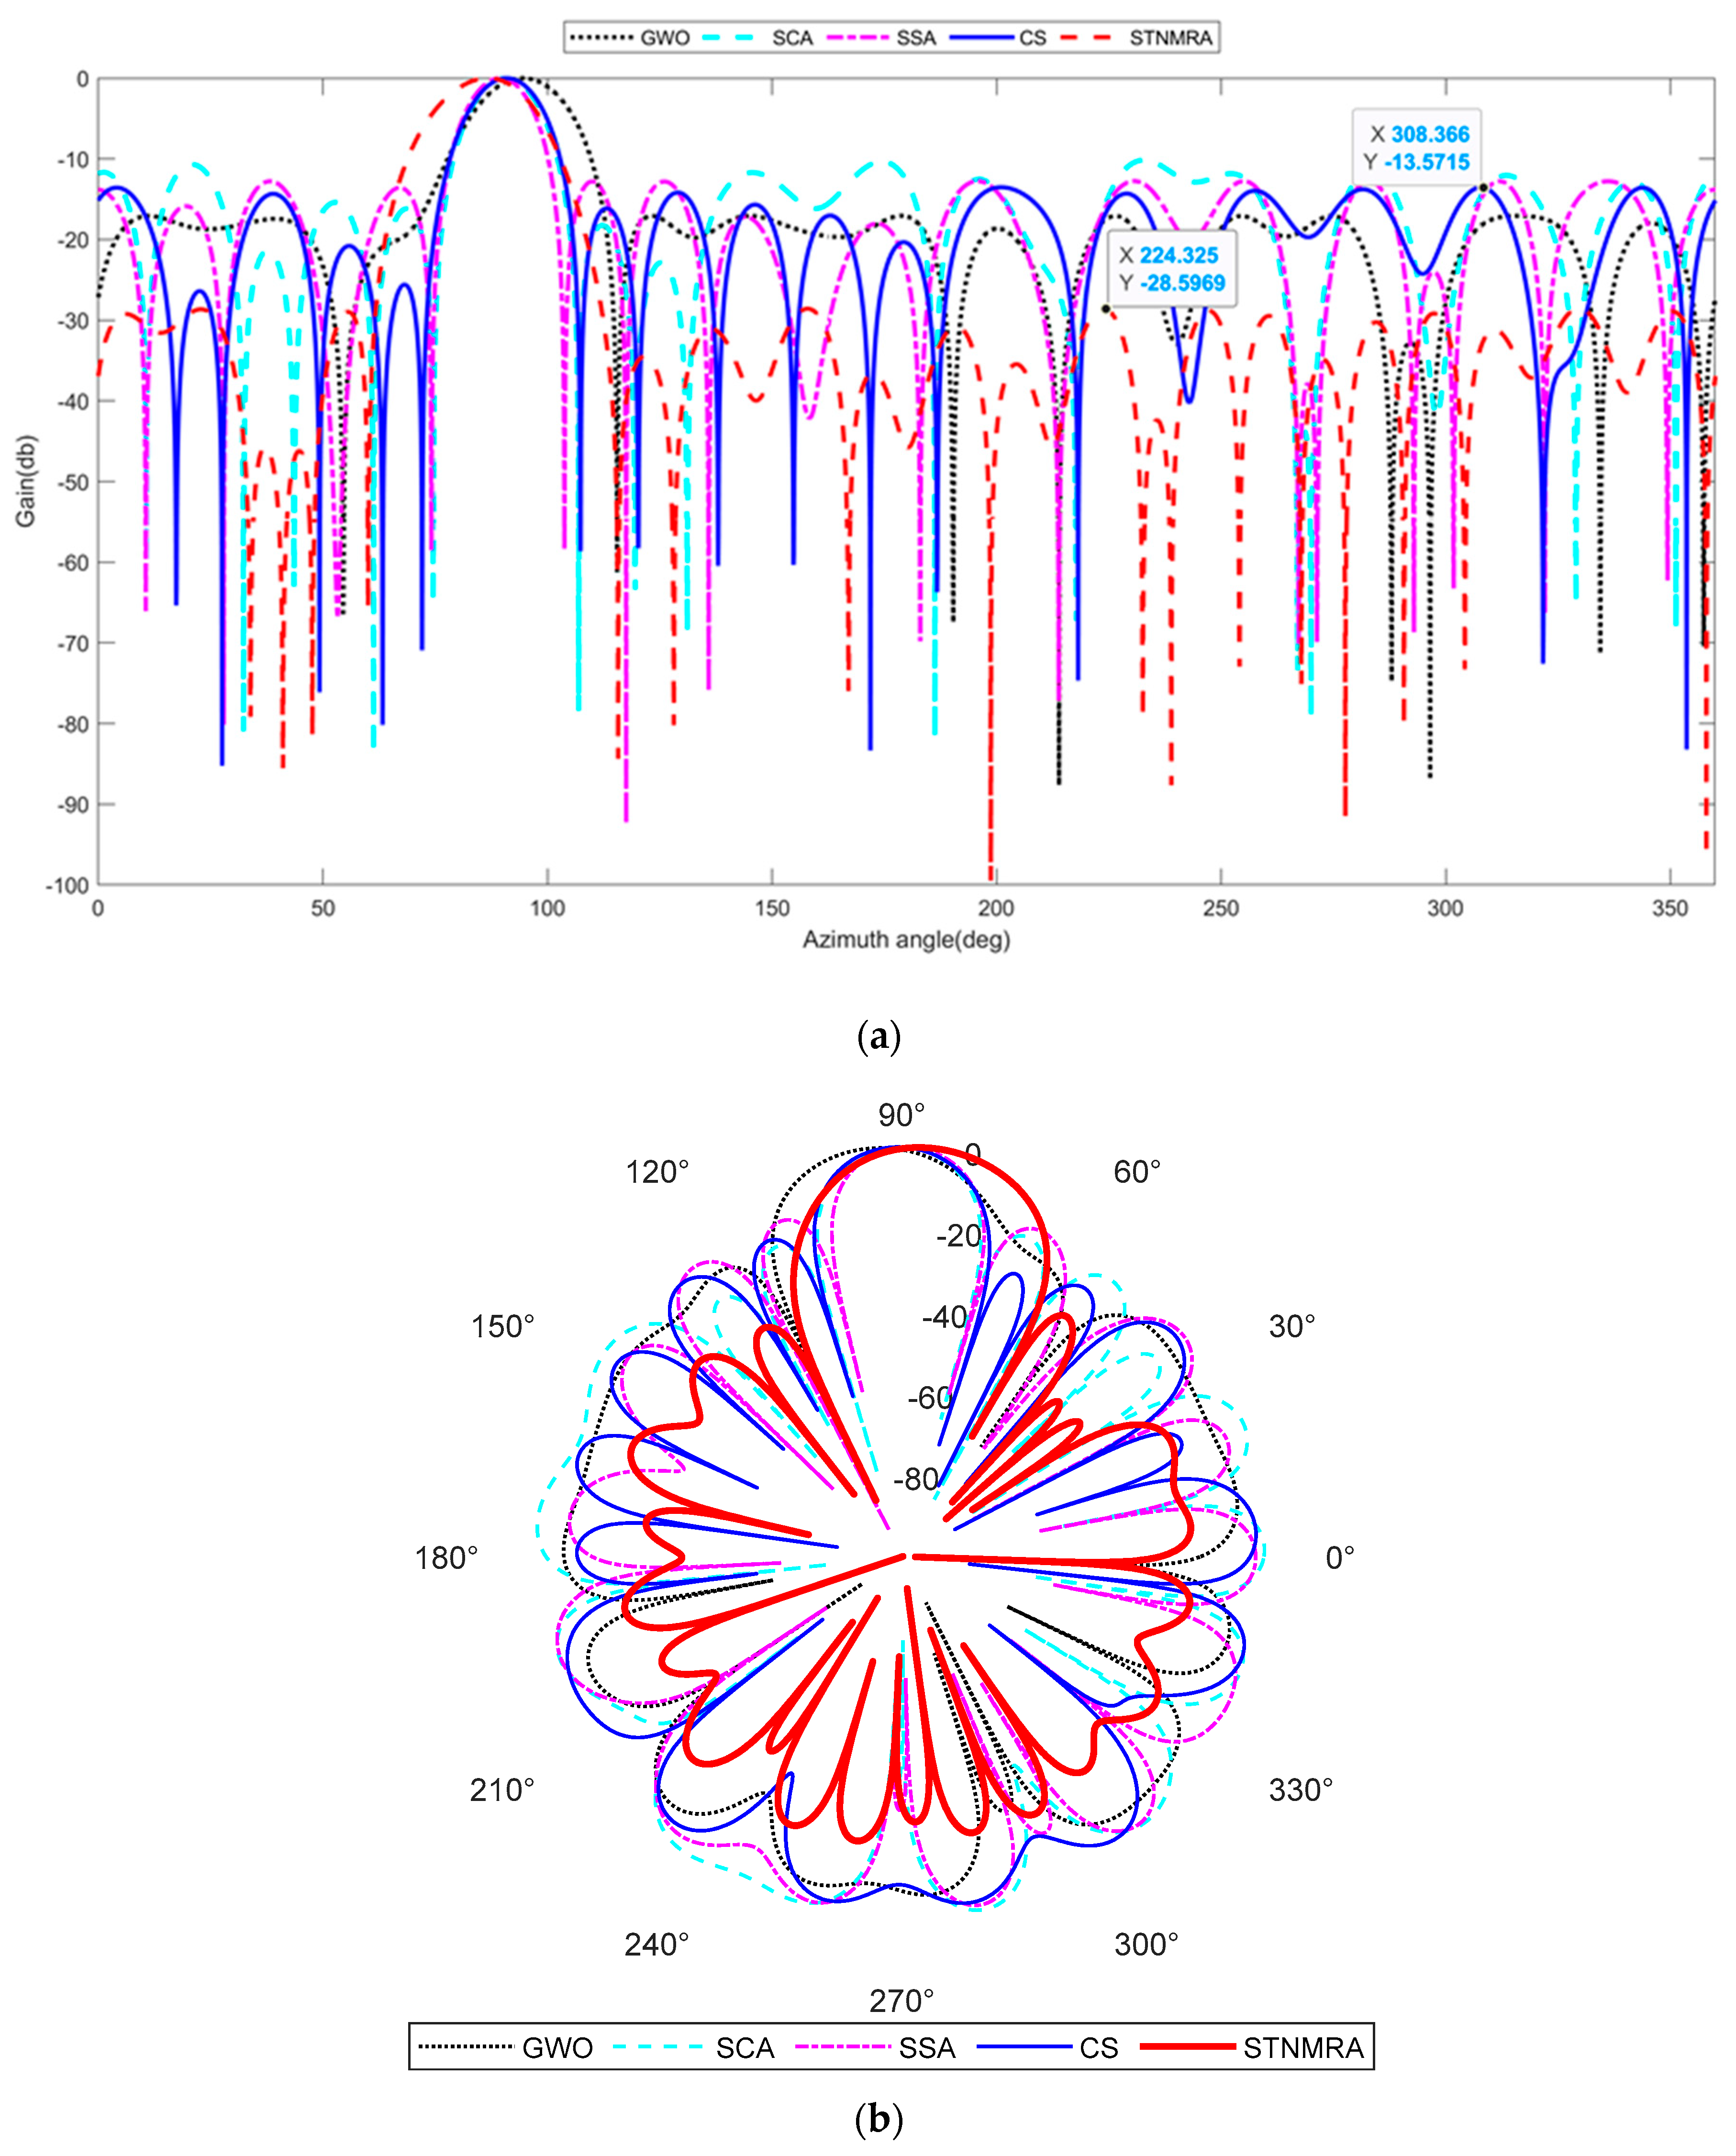
  • This CAA optimization problem is formulated to achieve three primary objectives: directing the main lobe to a desired direction, minimizing the SLLs, and maximizing the directivity of the antenna array for achieving desired radiation patterns and minimizing interference.
  • A hybrid STNMRA, a nature-inspired optimization algorithm, is used to find optimal solutions to the CAA optimization problem at a low computational cost and with robustness to different problem instances.
  • Antenna design and optimization often require assessing the 3D radiation patterns. In this work, the results are tested in 3D to validate the desired figure of merit (typically considers parameters such as the directivity, SLLs, and beamwidth).
  • The STNMRA algorithm achieves the best figure of merit, indicating that it successfully optimizes CAAs to meet the specified objectives. The optimized antenna arrays exhibit good directivity and extremely low SLLs. Additionally, the study suggests that even with a low number of antenna elements, it is possible to achieve excellent directivity while minimizing SLLs.
The paper’s structure is organized as follows. In Section 2, the formulation of the array factor for the CAA is detailed, along with an explanation of the objective function used in CAA synthesis. Section 3 offers a concise overview of the STNMRA. The performance analysis of STNMRA and a comparison with various existing optimization algorithms for CAA synthesis are presented in Section 4. The paper concludes with Section 5, summarizing the findings and conclusions drawn from the study and possible future work.

2. Circular Antenna Array

The configuration of the CAA is depicted in Figure 1. It comprises N E isotropic antenna elements that are systematically distributed with uniform angular spacing ( d ) along a circular arrangement [15]. In the x-y plane, the circle with a radius of r is taken into consideration. Here, ϕ signifies the azimuth angle, and θ represents the elevation angle. It is worth noting that all components of this array showcase consistent radiation characteristics. This quality renders the entire structure an isotropic source, which is characterized by uniform radiation in all directions.
The array factor (AF) is generally used to define the array pattern of CAA. Equations (1)–(3) are utilized to describe the AF of the CAA.
A F ϕ = n = 1 N E I n e j β r cos ϕ ϕ n + α n
where α n and I n indicate the excitation phase and amplitude of the nth antenna element, respectively. The nth element’s angular position on the x–y plane is expressed as
ϕ n = 2 π ( n 1 ) N E
The wave number β r is a function of angular spacing and the antenna elements count and is expressed as:
β r = 2 π r λ = n = 1 N E d n = N E d
The main lobe direction ( ϕ 0 ) is decided by the maxima of the AF, which is controlled by soft controlling parameter α n expressed as:
α n = β r cos ϕ 0 ϕ n
AF can be formulated as a function of the main lobe in the desired direction, given by
A F ϕ = n = 1 N E I n e j β r cos ϕ ϕ n cos ϕ 0 ϕ n + ψ
where I n is the controlled amplitude (normalized to the maximum value), and ψ represents the phase that is being estimated to regulate the figure of merit (FOM) for the CAA (such as higher directivity, low SLL, and the main lobe in the desired direction) and range from [0, 1] and [−180°, 180°], respectively.
The goal of the aforementioned design problem is to optimize the key parameters, such as maximizing directivity and suppressing SLL and the main lobe in the desired direction.
To minimize the SLL, the objective function O F S L L is expressed as
O F S L L = A F ϕ S L L , I , β , ϕ 0 A F ϕ m a x , I , β , ϕ 0
Here ϕ S L L represents the maximum side lobe angle.
In the main lobe direction ( ϕ 0 ), the goal is to maximize the directivity. For the minimization problem, the same can be achieved as
O F D = 1 D I R ( ϕ 0 , I , β )
Another critical parameter involves aligning the main lobe in the desired direction, denoted as ( ϕ d e s ) , which is expressed as
O F M L = ϕ 0 ϕ d e s
Hence, the minimization of the objective function ( O F C A A ) guarantees the attainment of the above-mentioned FOMs and is mathematically expressed as
O F C A A = O F S L L + O F D + O F M L

3. Hybrid Sooty Tern Naked Mole-Rat Algorithm (STNMRA)

In this section, an introductory overview of recently nature-inspired algorithms, namely STOA and NMRA, is provided. Subsequently, we introduce the recently proposed hybrid algorithm that combines elements from these two techniques.

3.1. Sooty Tern Optimization Algorithm (STOA)

STOA is a swarm intelligence optimization technique designed to address real-world optimization problems [14]. This algorithm draws inspiration from the migration and attacking behaviors exhibited by sooty terns in their natural environment. Sooty terns, which are known to live in varying colony sizes, possess the remarkable ability to locate and prey upon their food sources effectively.
The STOA algorithm emulates the migration and attacking behaviors of these sooty terns through a mathematical framework. The algorithm is divided into distinct phases, namely migration action and attacking action, to replicate the natural behaviors of these birds. These phases facilitate the optimization process, allowing it to efficiently explore and exploit the search space in pursuit of optimal solutions to complex problems.

3.1.1. Migration Action

In the migration process of sooty terns, three key conditions are considered and described as follows:
Collision Avoidance: To emulate the migration behavior of sooty terns, the first condition considered is the avoidance of collision among the search candidates. This involves assessing the new position of a candidate using a parameter denoted as Sc. This parameter plays a crucial role in ensuring that candidates do not collide during their migration, mimicking the birds’ natural tendency to avoid collisions during their movements.
C p c = S c × P p c t
Here, C p c represents the position of a sooty tern that has successfully avoided colliding with other search candidates, P p c represents the current position of the candidate sooty tern, t denotes the current iteration value, and S c defines the movement of the search agent (sooty tern) within the entire search area. This equation represents the process of determining the updated position of a candidate sooty tern while taking precautions to prevent collisions with other search candidates during the migration phase. This behavior mimics the natural tendency of sooty terns to avoid collisions during their movements in search of food sources.
S c = c v t × C v t m a x ; t = 0 , 1 , 2 , t m a x
The parameter S c is defined as a function that exhibits linearly decreasing behavior within a specified range between c v and 0. Here, c v is a controlling parameter, and its value is set to 2. This characteristic of S c is designed to influence the movement of search agents (sooty terns) during their migration behavior, specifically by controlling the rate of decrease in their movement as they approach the best-fitted positions. The parameter c v plays a crucial role in shaping this behavior and determining the range over which the linear decrease occurs.
Converging to Best Position: After avoiding collisions, the next step involves converging each sooty tern towards the position of the best-fitted search agent P b e s t . This is expressed as
M p c = C r × P b e s t t P p c t
where M p c represents the new positions of sooty terns, P p c is the current position of the search candidate, P b e s t t is the position of the best-fitted search agent at iteration t , and C r is a random parameter calculated as
C r = 0.5 × r a n d 0,1
where rand(0,1) is a uniformly distributed random number between 0 and 1.
Position Updating: In the final phase of migration behavior, each search candidate updates its position in relation to the best-fitted search agent. This is calculated as
D p c = C p c + M p c
where D p c represents the updated position, C p c is the position after avoiding collisions, and M p c is the result of the convergence step described above.
These steps collectively depict the intricate migration behavior of the sooty terns, incorporating collision avoidance, convergence towards better positions, and position updates in response to the best-fitted search agent’s position. This modeling approach allows for effective exploration and optimization in the algorithm.

3.1.2. Attacking Action

In the exploitation phase, which emulates the attacking action of sooty terns during migration, several behaviors are considered. These birds have the ability to adjust their speed and attack angle, and they also change their altitude by flapping their wings. Additionally, they exhibit spiral activity in the air while attacking their prey, as observed in their natural behavior [16]. This spiral activity is incorporated into the optimization algorithm to enhance its exploitation capabilities for finding optimal solutions in complex optimization problems. In this context, several parameters and equations are used to model the spiral activity exhibited by sooty terns during the exploitation phase:
x 1 = S r × s i n q
x 2 = S r × c o s q
x 3 = S r × q
S r = p × e m y
Here the parameter S r corresponds to the radius of each spiral turn, q is a variable defined within the range 0 m 2 π . Two constants, denoted as p and y (values set to 1), are responsible for shaping the spiral, and e is the parameter that represents the base of the natural logarithm [14].
During this phase, the search candidates (sooty terns) update their locations using Equations (15)–(18), which are employed to emulate the spiral activity. This modeling approach allows the algorithm to mimic the natural behavior of sooty terns during their prey attack, contributing to effective exploration and exploitation in optimization processes, expressed as:
P p c t = D p c × x 1 + x 2 + x 3 × P b e s t t
In this equation, P p c t represents the position updating of the sooty terns with respect to the iterations t . This position-updating process aims to select the global optimum solution within the optimization algorithm. It reflects how the search candidates’ positions evolve over time as they explore and exploit the search space, ultimately converging toward an optimal solution.

3.2. Naked Mole-Rat Algorithm (NMRA)

The nature-inspired optimization algorithm, known as NMRA, is derived from the swarm intelligent behavior observed in naked mole-rats (NMRs) and was introduced by Salgotra and Singh in 2019. NMRA is a relatively recent addition to the family of meta-heuristic algorithms and draws inspiration from the mating patterns observed in mole-rats in their natural habitat [13].
NMRs are eusocial animals typically found in colonies of sizes ranging from 70 to 80 individuals. These colonies are organized into two main categories: worker and breeder rats. The colony is led by a single female, known as the queen, who is responsible for breeding. The breeder rats are chosen to mate with the queen, while the worker rats perform various essential tasks within the colony. Breeder rats are considered the productive members of the mole-rat community and play a crucial role in reproduction.
The mathematical model of NMRA encompasses three distinct phases:
Initialization: In this phase, the algorithm initializes a population of mole-rats, mimicking the composition of a natural mole-rat colony.
Exploration Phase: During this phase, the behavior of worker rats is emulated. These worker rats engage in exploration activities within the algorithm, seeking out potential solutions in the search space.
Exploitation Phase: In this phase, the algorithm models the behavior of breeder rats. These breeder rats are responsible for exploiting the search space, with a focus on refining and improving the solutions discovered during the exploration phase.
NMRA leverages these three phases to guide its search for optimal solutions in complex optimization problems, drawing inspiration from the natural behaviors observed in mole-rat colonies.

3.2.1. Initialization of Mole-Rats Population

In the NMRA, the optimization process involves the initialization of a population of mole-rats, which are represented as vectors in a multidimensional search space. These mole-rats are randomly distributed within the problem space, and each mole-rat is identified by its position in the search space.
The initial population of NMRs is randomly generated, and it is represented as a vector in a space with dimensions ( d i m ), where d i m represents the problem parameters to be optimized. Each mole-rat’s position ( M u , v ) is determined as follows:
M u , v = M m i n , v + r a n d × M m i n , v M m a x , v
Here, u ranges from 1 to M , representing the u t h mole-rat; v ranges from 1 to d i m , representing the v t h dimension of the search space; M u , v is expressed using a random number ( r a n d ) in the range [0, 1]; and the lower and upper boundaries of the problem space are represented by M m i n , v and M m a x , v , respectively.
After initializing the population of mole-rats (search candidates) and computing their fitness values, the members of two pools are identified: the worker and the breeder pool. This partitioning is based on the fitness values of the mole-rats. Those with higher fitness values are selected as potential breeders, while the rest become workers.
The initial fittest solution, denoted as M b e s t , is then evaluated from the pool of potential breeders. M b e s t represents the current best-known solution among the population of search candidates at the beginning of the algorithm. The partitioning of individuals into worker and breeder pools, along with the selection of M b e s t , are crucial steps in preparing the algorithm for its exploration and exploitation phases, where the search for better solutions and optimization occurs.

3.2.2. Worker Phase

During this phase, worker rats aim to enhance their fitness to have the opportunity to become members of the breeder group.
Each worker rat generates a new solution based on its own knowledge and available information. This new solution is computed as follows:
W R u t + 1 = W R u t + λ W R x t W R y t
Here W R u t represents the u t h worker rat’s solution at iteration t , W R u t + 1 is the new solution generated in the next iteration, λ is a randomly distributed parameter between 0 and 1. W R x t and W R y t are the randomly selected solutions from the pool of workers.
After generating a new solution, the fitness value of this new solution is computed. This fitness value represents how well this new solution performs with respect to the optimization problem.
The worker mole-rats compare the fitness of the new solution with that of their previous solution. If the fitness of the new solution is better (i.e., lower in a minimization problem), they accept it as their current solution and keep it. If it is worse, they stick with their previous solution.
This mechanism allows the worker mole-rats to explore the solution space by occasionally accepting solutions that are better than their current ones and potentially rejecting solutions that are worse. Over time, this exploration process can lead to improved solutions within the worker pool.
The exploration phase, carried out by the worker mole-rats, is essential for the overall optimization process, as it allows for the discovery of better solutions and the continuous improvement of the population’s fitness.

3.2.3. Breeder Phase

During this phase, breeders seek to improve their solutions and may be chosen as breeding partners for the queen. The breeder rats’ solutions are updated with respect to the overall best solution ( M b e s t ) based on the breeding probability b p with initial value of 0.5. If a breeder rat is unable to improve its fitness, it may be downgraded to the workers group.
The new solution for breeders is updated using the following formula:
B R u t + 1 = 1 λ B R u t + λ M b e s t B R u t
Here, B R u t represents the u t h breeder rat’s solution at iteration t , λ controls the mating frequency of breeders and helps identify the new breeder solution B R u t + 1 in the next iteration.
The optimization process continues through a number of iterations until a termination condition is met. The best NMR from the entire population is selected as the potential solution to the problem being analyzed.

3.3. Sooty Tern NMRA (STNMRA)

The STNMRA aims to benefit from the migration and attacking actions of sooty terns and the eusocial behavior of naked mole-rats, combining them in a way that improves optimization capabilities. This hybridization allows the algorithm to explore and exploit the solution space effectively. STNMRA combines the strengths of STOA and NMRA to create a hybrid optimization algorithm. It introduces elements from STOA into the worker phase of NMRA while retaining the core structure of both algorithms. The algorithm incorporates the parameter λ from NMRA, which controls the breeding frequency of breeder NMRs, with a self-adaptive mechanism using the simulated annealing mutation operator s a [17]. This self-adaptive approach eliminates the need for manual parameter tuning by users.
The algorithm starts with the random initialization of search candidates within a predefined range, and this is achieved using Equation (20).

3.3.1. Worker Phase

In this phase of the STNMRA, known as the worker phase or exploration phase, the algorithm aims to find a solution near the optimal value. The worker phase of NMRA was found to be less reliable. To enhance its performance, the STNMRA incorporates features from STOA into the NMRA worker phase. To enhance exploration during the first half of the iterations, the position updating equation (Equation (19)) from STOA is introduced. This equation from STOA is used to update the positions of search candidates.
During the first half of the iterations, the algorithm uses the position updating equation from STOA. This is performed to take advantage of the exploration capabilities of STOA. In the second half of the iterations, the algorithm switches back to using the original NMRA worker phase equation (Equation (21)). Parameters for both STOA and NMRA remain consistent with their basic algorithms. No new parameters are introduced, ensuring that the original characteristics of each algorithm are retained.
The hybridization of the worker phase is designed to combine the exploration abilities of both STOA and NMRA, potentially improving the algorithm’s ability to find solutions near the optimal value. This dynamic approach, where different optimization strategies are used during different phases of the iterations, can lead to better convergence and solution quality.

3.3.2. Breeder Phase

In the hybrid STNMRA, the third phase is referred to as the breeder phase, which closely resembles the breeder phase in the classical NMRA. This phase is responsible for exploiting potential solutions close to the current best solution, ultimately aiming to produce a global solution by mating breeder rats with the queen.
The exploitation phase in the breeder phase is essential for performing a global search. It targets the solutions that are close to the current best solution (queen), aims to refine them further, and uses the same Equation (22) of NMRA. No changes to this equation have been made, ensuring that the essential breeding and solution update process remains consistent with the classical NMRA.
Overall, the breeder phase of the STNMRA retains the core principles of the NMRA algorithm. It focuses on exploiting promising solutions while maintaining a balance between breeder and worker rats. This hybrid approach combines elements of both STOA and NMRA to improve the algorithm’s ability to explore and exploit the search space effectively, ultimately aiming for high-quality solutions.

3.3.3. Parameter Adaptation

In the hybrid STNMRA, the parameter λ , which is crucial for controlling the mating frequency of breeder rats, has been modified to enhance the algorithm’s performance. Instead of using a random value for λ , the algorithm incorporates a simulated annealing-based mutation strategy (Al-Hassan et al., 2006) to adaptively adjust this parameter during the optimization process [17], expressed as
λ t = λ m i n + λ m a x λ m i n × α t 1
Here, λ t represents the value of the parameter λ at iteration t ;
λ m i n and λ m a x are user-defined boundaries that constrain the range of λ ;
α is a constant value set to 0.95 [17]; t represents the current iteration.
This equation ensures that λ gradually adapts from λ m i n to λ m a x as the iterations progress. Initially, λ is set close to λ m i n , and as the iterations continue, it moves toward λ m a x . This dynamic adjustment of λ allows the algorithm to explore the search space more effectively, finding a balance between exploration and exploitation.
The use of simulated annealing in λ adaptation enhances the STNMRA’s ability to fine-tune its behavior during optimization, improving its chances of finding high-quality solutions. This self-adaptive approach eliminates the need for manual tuning of parameters, making the algorithm more robust and efficient.

3.3.4. Greedy Selection

In the final or selection phase of the hybrid STNMRA, a greedy selection technique is applied to determine the best solution among the search candidates. This phase helps identify the current local best solution based on the fitness value of the newly obtained solution compared to the previously obtained solution. The selection technique is defined (for minimization) by the following equation:
S n e w = S n e w i f f S n e w < f S u t S u t o t h e r w i s e
Here S n e w represents the newly obtained solution, f S u t represents the fitness value of the solution S u t at the current iteration.
In this equation, if the fitness of the newly generated solution S n e w is better (i.e., lower in the case of minimization problems) than the fitness of the previously selected solution S u t , then S n e w is chosen as the current local best solution. Otherwise, the previous solution S u t is retained.
This greedy selection strategy ensures that the algorithm continuously tracks the best solution found during the optimization process and updates it whenever a superior solution is discovered. Over the course of the iterations, this approach helps the algorithm converge toward an optimal or near-optimal solution.
The combination of these phases, including the exploration phase (inspired by STOA), the exploitation phase (similar to NMRA), parameter adaptation, and the final greedy selection, constitute the hybrid STNMRA algorithm. This combination leverages the strengths of both STOA and NMRA to enhance the algorithm’s performance in optimization tasks.
The flowchart of STNMRA is shown in Figure 2.

4. Simulation Results

In order to attain high directivity, low SLL, and desired major lobe direction, the STNMRA optimization technique is employed to construct and explore the CAA with element count N E . In the context of the problem under study, a total of 2 N E parameters need to be optimized, which comprises N E parameters for the excitation amplitudes and an additional N E parameters for the phases. The count of search agents is directly related to the population size, and each individual search agent is composed of 2 N E elements ( N E amplitudes and N E phases). This is mathematically expressed as:
N = ( I 1 , I 2 , I 3 , I 4 , I N E 1 , I N E , ψ 1 , ψ 2 , ψ 3 , ψ 4 , ψ N E 1 , ψ N E )
STNMRA has been extensively employed to determine the optimal excitation amplitude and phase for the array elements within the CAA design. The simulations have been carried out using MATLAB version 2022b, utilizing a system with 16 GB RAM and a CORE i7 CPU. For the implemented algorithms, specific parameters have been set: a population size of 60, 30 number of runs, and a maximum iteration count of 500 for each algorithm. The outcomes achieved through STNMRA are compared with those obtained using other metaheuristic algorithms, namely Grey Wolf Optimizer (GWO), Sine Cosine Algorithm (SCA), Salp Swarm Optimizer (SSA), and Cuckoo Search (CS) Algorithm. The respective control parameters for these algorithms are detailed in Table 1.
The convergence graph in Figure 3 displays the optimal dB score for the objective function ( O F C A A ) that was achieved. The STNMRA algorithm’s fitness function has the lowest value and can be further enhanced by varying the termination criteria for increased directivity. Higher iterations will lengthen the computation process, which may not be desirable in real-time applications. As a result, rather than using iterations, the algorithm may be examined for an increased number of antenna elements to improve the directivity.
With the required main lobe direction at 90°, the controlling parameters are optimized for 12-element CAA. Figure 4a shows the beam pattern that was achieved for the problem under study. All of the simulated meta-heuristic algorithms have main lobe directions that point in the desired direction of 90°. However, compared to CS’s maximum SLL of −13.572 dB, STNMRA’s maximum SLL is lower at −28.597 dB. However, compared to −7.87 dB SLL for uniform excitation, all algorithms display better SLL results. A polar plot provides better visualization for lobe orientation, as well as for the rear and side lobes. The similar interference of least minor lobe levels in STNMRA as compared to other optimization strategies can be drawn from the polar plot shown in Figure 4b. In comparison to other competitive optimization techniques, STNMRA yields a bit wider beam width and produces less directivity.
The directivity attained for STNMRA is 12.38 dB compared to the 13.18 dB for CS and is significantly higher than the necessary standard for real-world applications. The 3D radiation pattern makes the concept of the beam scanning area easier to understand. Figure 5 shows the 3D beam patterns for all the approaches that have been described. The SLL is maximal in uniform excitation and is nearly nonexistent in STNMRA with a slightly wider beam width, as shown from the 3D pattern. The average computational time of the STNMRA algorithm is 1.18 s for 12-element CAA, which is higher than other competitive optimization algorithms because of its complexity and its hybrid structure. Table 2 shows the amplitude ( I n ), phase (ψ), maximum SLL [dB], directivity [dB], and total computational time obtained by different optimization algorithms for the synthesis of 12-element CAA.
With the same conditions, the controlling parameters are again optimized for 24-element CAA. Figure 6 and Figure 7a show the convergence characteristics and beam pattern achieved for the 24-element CAA, respectively. All of the algorithms in this scenario have main lobe directions that point in the intended direction of 90°. The highest side lobe level in the 24-element scenario, like the 12-element situation, is lowest in the STNMRA approach, reaching a −16.372 dB maximum value as opposed to −12.918 dB for CS. Compared to the −7.77 dB level without optimization, all optimization algorithms show better SLL results. Figure 7b shows the polar plot for the beam pattern in the azimuth plane. In this figure, STNMRA is seen to have the least minor lobe levels compared to other methods. STNMRA’s directivity measurement for 24-antenna elements is 15.61 dB as opposed to 12 elements’ 12.38 dB. Additionally, all of the algorithms’ directivity measurements ranged from 14.57 to 15.61 dB, which is better than the scenario with 12 elements. The 3D radiation pattern of Figure 8 illustrates the beam scan area and beam width achieved. The SLL is greatest in uniform excitation and is also minimal in STNMRA with good directivity and small beam width, as shown from the 3D pattern. The average computational time of the STNMRA algorithm is 2.08 s for 24-element CAA. Table 3 provides a summary of the results attained for the 24-element CAA.
While comparing the results for the CAA for 12 and 24 antenna elements, it has been found that 12-element CAAs with sufficient directivity provide better SLL. On the other hand, 24 elements of CCA with sufficient SLL yield superior directivity. However, a larger CAA is required to achieve the increased directivity value. The directivity is more than 12 dB in all circumstances and is enough for usage in practical applications. The SLL, another figure of merit, is superior to the CAA for 12 elements. In uniform excitation, the SLL is almost unaffected because no controlling parameter has been used. In addition, the STNMRA algorithm has the best maximum SLL when compared to the other optimization methods. It has been observed that the computational time for STNMRA is increased to almost double when there is an increase in the number of elements from 12-element to 24-element CAA. In addition, by increasing the number of iterations, the results can be improved to an enhanced level at the expense of more computational time.

5. Conclusions and Future Work

This research offers a comprehensive analysis and evaluation of CAA with a focus on aligning the main lobe, achieving higher directivity, and minimizing SLL. While the elements count and angular distance were kept fixed as hard controlling parameters, the optimization process primarily revolved around the soft controlling parameters, namely amplitude and phase adjustments. These adjustments were aimed at optimizing the array’s performance in terms of FOM. To estimate the optimal values for these soft regulating parameters, the STNMRA was utilized. The outcomes obtained through the STNMRA were compared against those generated by other prominent algorithms, namely GWO, SCA, SSA, and CS. This comparison provided a comprehensive assessment of the effectiveness and efficiency of the STNMRA approach in optimizing CAA performance, particularly in terms of main lobe alignment, directivity enhancement, and SLL reduction. The results of simulations show that the optimum FOM is obtained for STNMRA with strong directivity and nearly nonexistent SLL. According to the investigation, good side lobe minimizations and low element numbers can both yield good directivity values. The STNMRA may also be helpful not only for passive but also for dynamic real-world applications, such as smart antennas, beam scanning, and radar.
Antenna array design often involves optimizing multiple conflicting objectives, such as maximizing gain, minimizing sidelobe levels, and ensuring impedance matching. Balancing these objectives requires sophisticated optimization techniques capable of exploring the trade-off space effectively. The proposed approach struggles to handle such multi-objective optimization problems efficiently. Future work may involve developing algorithms with enhanced handling of multi-objective optimization and better adaptability to complex array geometries and performance requirements.

Author Contributions

V.M.: Conceptualization, Methodology, Writing—original draft; K.P.S.: Investigation, Writing—review and editing; N.T.: Validation, Writing—review and editing, Software, Supervision; U.S.: Writing—review and editing, Project Management; A.O.H.: Writing—review and editing; R.S.: Conceptualization, Methodology, Writing—review and editing, Supervision, Project Administration. All authors have read and agreed to the published version of the manuscript.

Funding

This research received no external funding.

Data Availability Statement

Data are available from the authors upon reasonable request from the corresponding author.

Conflicts of Interest

The authors affirm that they have no known financial or interpersonal conflicts that would have appeared to have an impact on the research presented in this study.

References

  1. Balanis, C.A. Antenna Theroy: Analysis and Design; John Wiley & Sons: Hoboken, NJ, USA, 2012. [Google Scholar]
  2. Bera, R.; Kundu, K.; Pathak, N.N. Optimal pattern synthesis of thinned and non-uniformly excited concentric circular array antennas using hybrid GSA-PSO technique. Radioengineering 2019, 28, 369–385. [Google Scholar] [CrossRef]
  3. Amaireh, A.A.; Al-Zoubi, A.S.; Dib, N.I. Sidelobe-level suppression for circular antenna array via new hybrid optimization algorithm based on antlion and grass-hopper optimization algorithms. Prog. Electromagn. Res. C 2019, 93, 49–63. [Google Scholar] [CrossRef]
  4. Durmus, A.; Kurban, R. Optimal synthesis of concentric circular antenna arrays using political optimizer. IETE J. Res. 2022, 68, 768–777. [Google Scholar] [CrossRef]
  5. Wang, T.; Xia, K.-W.; Tang, H.-L.; Zhang, S.-W.; Sandrine, M. A modified wolf pack algorithm for multi-constrained sparse linear array synthesis. Int. J. Antennas Propag. 2020, 2020, 1–12. [Google Scholar] [CrossRef]
  6. Liu, J.; Zhao, Z.; Yang, K.; Liu, Q.H. A hybrid optimization for pattern synthesis of large antenna arrays. Prog. Electromagn. Res. 2014, 145, 81–91. [Google Scholar] [CrossRef]
  7. Owoola, E.O.; Xia, K.; Wang, T.; Umar, A.; Akindele, R.G. Pattern synthesis of uniform and sparse linear antenna array using may y algorithm. IEEE Access 2021, 9, 77954–77975. [Google Scholar] [CrossRef]
  8. Owoola, E.O.; Xia, K.; Ogunjo, S.; Mukase, S.; Mohamed, A. Advanced marine predator algorithm for circular antenna array pattern synthesis. Sensors 2022, 22, 5779. [Google Scholar] [CrossRef] [PubMed]
  9. Rathore, P.S.; Chatterjee, J.M.; Kumar, A.; Sujatha, R. Energy-efficient cluster head selection through relay approach for WSN. J. Supercomput. 2021, 77, 7649–7675. [Google Scholar] [CrossRef]
  10. Kumar, G.; Kumar, R. A survey on planar ultra-wideband antennas with band notch characteristics: Principle, design, and applications. AEU—Int. J. Electron. Commun. 2019, 109, 76–98. [Google Scholar] [CrossRef]
  11. Singh, H.; Abouhawwash, M.; Mittal, N.; Salgotra, R.; Mahajan, S.; Pandit, A.K. Performance evaluation of Non-Uniform circular antenna array using integrated harmony search with Differential Evolution based Naked Mole Rat algorithm. Expert Syst. Appl. 2022, 189, 116146. [Google Scholar] [CrossRef]
  12. Mittal, N.; Singh, S.; Nayyar, A.; Singh, U. Hybrid sooty tern naked mole-rat algorithm and Fuzzy Type-2 logic-based trust and energy-aware stable clustering protocol. Expert Syst. Appl. 2023, 219, 119706. [Google Scholar] [CrossRef]
  13. Salgotra, R.; Singh, U. The naked mole-rat algorithm. Neural Comput. Appl. 2019, 31, 8837–8885. [Google Scholar] [CrossRef]
  14. Dhiman, G.; Kaur, A. STOA: A bio-inspired based optimization algorithm for industrial engineering problems. Eng. Appl. Artif. Intell. 2019, 82, 148–174. [Google Scholar] [CrossRef]
  15. Singh, H.; Singh, S.; Gupta, A.; Singh, H.; Gehlot, A.; Kaur, J. Design and synthesis of circular antenna array using artificial hummingbird optimization algorithm. J. Comput. Electron. 2022, 21, 1293–1305. [Google Scholar] [CrossRef]
  16. Tamura, K.; Yasuda, K. The spiral optimization algorithm: Convergence conditions and settings. IEEE Trans. Syst. Man Cybern. Syst. 2017, 50, 360–375. [Google Scholar] [CrossRef]
  17. Al-Hassan, W.; Fayek, M.B.; Shaheen, S.I. PSOSA: An Optimized Particle Swarm Technique for Solving the Urban Planning Problem. In Proceedings of the 2006 International Conference on Computer Engineering and Systems, Cairo, Egypt, 5–7 November 2006; pp. 401–405. [Google Scholar]
Figure 1. Configuration of CAA.
Algorithms 17 00256 g001
Figure 2. Flowchart of STNMRA.
Algorithms 17 00256 g002
Figure 3. Convergence characteristics for 12-element CAA.
Algorithms 17 00256 g003
Figure 4. Twelve-element CAA: (a) 2D beam patterns; (b) polar plots.
Algorithms 17 00256 g004
Figure 5. Three-dimensional beam pattern: (a) uniform; (b) GWO; (c) SCA; (d) SSA; (e) CS; (f) STNMRA for 12-element CAA.
Algorithms 17 00256 g005
Figure 6. Convergence characteristics for 24-element CAA.
Algorithms 17 00256 g006
Figure 7. Twenty-four-element CAA: (a) 2D beam patterns; (b) polar plots.
Algorithms 17 00256 g007
Figure 8. Three-dimensional beam pattern: (a) uniform; (b) GWO; (c) SCA; (d) SSA; (e) CS; (f) STNMRA for 24-element CAA.
Algorithms 17 00256 g008
Table 1. Parameter settings for 12-element CAA.
AlgorithmParameters
GWONP = 60; D = 12; Gmax = 500; a = 2   t o   0 ;   C = [ 0   t o   2 ]
SSANP = 60; D = 12; Gmax = 500; c 1 = 2   t o   0
CSNP = 60; D = 12; Gmax = 500; p a = 0.25
SCANP = 60; D = 12; Gmax = 500; r 1 = 2   t o   0
STNMRANP = 60; D = 12; Gmax = 500; b p = adaptive; λ = adaptive
Here, Gmax is number of iterations, D is dimension of population, NP is number of populations.
Table 2. Comparison of results attained for 12-element CAA.
Main   Beam   Direction   ( ϕ d e s ) Hard Controlling ParametersAlgorithm Amplitude   ( I n ) Phase   ( ψ ) Maximum SLL
[dB]
Directivity
[dB]
Computational Time (s)
90°N = 12
d = λ 2
Uniform[1, 1, 1, 1, 1, 1, 1, 1, 1, 1, 1, 1][0, 0, 0, 0, 0, 0, 0, 0, 0, 0, 0, 0]−7.8712.540.00
GWO[1, 0.8878, 0.2037, 0.5398, 0.2, 0.3249, 0.2, 0.5745, 0.2057, 0.7740, 0.2017, 0.8430][1.39, 3.75, 113.33, −57.36, −11.63, 69.67, −180, −31.4, −157.88, 11.94, 0.14, −14.23]−15.7112.880.79
SCA[1, 0.7402, 0.2, 0.9541, 0.2, 0.3412, 0.2, 0.6847, 0.4559, 0.8231, 0.7688, 1][−180, 180, −180, −180, −106.37, −88.08, 135.81, 178.76, −180, 180, −141.04, −180]−11.3713.040.74
SSA[1, 0.8708, 0.3265, 0.6346, 0.2053, 0.2770, 0.2231, 0.3991, 0.2073, 0.9062, 0.2733, 0.8611][180, −179.75, 152.03, 157.34, −121, 180, −140.18, 93.69, 29.08, −156.55, 116.9, 179.68]−13.5512.780.82
CS[0.9397, 0.8231, 0.2797, 0.7587, 0.2136, 0.2118, 0.2039, 0.4659, 0.2231, 0.8539, 0.4372, 0.9871][180, 178.51, 172.55, 140.88, −180, −116.7, −158.22, 113.17, 121.3, −159.43, 144.71, 173.48]−13.5713.180.85
STNMRA[0.9753, 0.3763, 0.3210, 0.3652, 0.2001, 0.2188, 0.2406, 0.2494, 0.2260, 0.4257, 0.2467, 0.8262][8.74, 22.96, 158.51, −95.27, −97.04, 119.1, 26.33, −71.94, −35.55, 91.91, −102.4, −29.84]−28.5912.381.18
Table 3. Comparison of results attained for 24-element CAA.
Main   Beam   Direction   ( ϕ d e s ) Hard Controlling ParametersAlgorithm Amplitude   ( I n ) Phase   ( ψ ) Maximum SLL
[dB]
Directivity
[dB]
Computational Time (s)
90°N = 24
d = λ 2
Uniform[1, 1, 1, 1, 1, 1, 1, 1, 1, 1, 1, 1, 1, 1, 1, 1, 1, 1, 1, 1, 1, 1, 1, 1][0, 0, 0, 0, 0, 0, 0, 0, 0, 0, 0, 0, 0, 0, 0, 0, 0, 0, 0, 0, 0, 0, 0, 0]−7.7714.300.00
GWO[0.7915, 0.7354, 0.7203, 0.7527, 0.7069, 0.3326, 0.6418, 0.2048, 0.4255, 0.2534, 0.2492, 0.3253, 0.4332, 0.2541, 0.2263, 0.2052, 0.2004, 0.9505, 0.5179, 0.2007, 0.9727, 1, 0.6929, 0.3677][179.99, −180, −180, 129.48, 179.95, 108.24, 121.81, −9.4, 179.89, −179.99, 42.52, 56.67, −160.05, 10.27, 109.46, −120.25, −0.13, 144.98, −178.56, −167.71, 138.71, 164.91, 179.01, 178.22]−14.3015.071.39
SCA[1, 0.2, 0.8541, 1, 0.2, 0.2, 0.2344, 0.2559, 0.3729, 0.5079, 0.2, 0.2, 0.2550, 0.2118, 1, 0.2,0.5616, 0.2, 0.6227, 0.2029, 1, 1, 1, 1][−154.97, 180, −180, −180, 180, −180, 180, 180, 11.09, −180, 52.22, −71.3, −180, 180, 100.03, −37.04, −180, 173.97, −180, 106.01, 180, 180, −180, 166.49]−9.5214.571.48
SSA[0.7665, 0.5135, 0.8262, 0.9027, 0.9123, 0.8047, 0.2, 0.2008, 0.4671, 0.9620, 0.2862, 0.5007, 0.3917, 0.3374, 0.4158, 0.5321, 0.9590, 0.2619, 0.3310, 0.3480, 1, 0.9777, 0.9999, 0.3545][−164.53, 132.73, 150.41, −179.25, −156.26, −151.3, 36.66, −130.32, −169.11, 135.68, −37.6, −175.33, 121.51, −71.42, 149.44, −54.12, −176.55, 175.3, −125.65, −171.41, −174.49, 173.61, −164.68, 162.06]−14.0115.391.52
CS[0.7300, 0.6604, 0.9657, 0.9724, 0.7399, 0.5077, 0.9144, 0.3571, 0.3890, 0.2, 0.2070, 0.3632, 0.3101, 0.6556, 0.2003, 0.4653, 0.7108, 0.2499, 0.3996, 0.9408, 0.6948, 0.5643, 0.9990, 0.8898][172.42, 154.56, 155.62, −176.1, −171.8, 158.59, 180, 179.91, −178.07, 158.54, −56.55, −87.54, 58.72, 172.63, 96.69, −147.2, −176.27, −109.73, 169.72, −177.32, 180, 173.55, −165.89, −127.67]−12.9215.571.63
STNMRA[0.8038, 0.5463, 0.7782, 0.9988, 0.8199, 0.5903, 0.5693, 0.2004, 0.5394, 0.3730, 0.5418, 0.7236, 0.2024, 0.6437, 0.2615, 0.4811, 0.7154, 0.2946, 0.6476, 0.5123, 0.9839, 0.9980, 0.9618, 0.8926][4.04, −8.58, −24.08, −24.15, 3.43, −48.97, −2.98, −16.77, 43.18, −67.01, −171.4, 39.96, −169.25, −76.64, 119.89, 85.65, −41.59, 119.26, 5.59, 133.35, −48.01, 20.81, 46.93, 36.95]−16.3715.612.08
Disclaimer/Publisher’s Note: The statements, opinions and data contained in all publications are solely those of the individual author(s) and contributor(s) and not of MDPI and/or the editor(s). MDPI and/or the editor(s) disclaim responsibility for any injury to people or property resulting from any ideas, methods, instructions or products referred to in the content.

