Abstract
Genomic selection (GS) is a groundbreaking statistical machine learning method for advancing plant and animal breeding. Nonetheless, its practical implementation remains challenging due to numerous factors affecting its predictive performance. This research explores the potential of data augmentation to enhance prediction accuracy across entire datasets and specifically within the top 20% of the testing set. Our findings indicate that, overall, the data augmentation method (method A), when compared to the conventional model (method C) and assessed using Mean Arctangent Absolute Prediction Error (MAAPE) and normalized root mean square error (NRMSE), did not improve the prediction accuracy for the unobserved cultivars. However, significant improvements in prediction accuracy (evidenced by reduced prediction error) were observed when data augmentation was applied exclusively to the top 20% of the testing set. Specifically, reductions in MAAPE_20 and NRMSE_20 by 52.86% and 41.05%, respectively, were noted across various datasets. Further investigation is needed to refine data augmentation techniques for effective use in genomic prediction.
1. Introduction
Plant breeding is essential for maintaining a stable food supply to meet the increasing global food demand. To address this challenge, it is vital to adopt innovative methods that promote rapid genetic improvements and enhance agricultural productivity, particularly in the face of climate change. Traditional breeding methods, which rely on labor-intensive hybridization and selection processes, have limitations that have generated significant interest in genomic selection (GS) for crop breeding [1,2]. GS enhances genetic gains by reducing breeding cycles and optimizing resource use. Its successful application in livestock breeding has encouraged plant breeders to implement GS for predicting inbred performance, aiding parental selection, and forecasting hybrid performance [3,4]. For these reasons, GS is revolutionizing plant breeding programs by offering significant advantages in terms of accuracy, efficiency, and enabling more precise and effective breeding strategies. This transformative approach enhances yield, improves quality, and boosts resilience to environmental challenges [4,5]. Countries adopting GS are poised to enhance their food sovereignty by improving productivity, sustainability, and resilience in food production systems while autonomously managing and conserving genetic resources [4,5].
GS aims to merge comprehensive genotypic and phenotypic data from a training population to develop predictive models [5]. These models are used to estimate genetic values and select individuals within a breeding population based on their genotype data. This method circumvents extensive testing, thereby avoiding biases in marker effect estimates and speeding up the breeding process.
The similarity between training and breeding populations is crucial for accurate predictions [5]. Higher accuracies are achieved when the training population closely resembles the breeding population. In contrast, greater genetic distances between the two populations result in rapid decreases in accuracy [3,6]. The optimal size of a training population depends on relatedness, trait heritability, and population structure. Smaller training populations are ideal for closely related groups, while larger ones are necessary for more distantly related populations [7].
Accurate prediction is key to the successful implementation of GS, as it enables breeders to select individuals with desirable traits for future breeding cycles, thereby increasing genetic gain per cycle compared to marker-assisted selection [8]. Predictability, representing prediction accuracy, has been assessed in crops like maize, wheat, and barley through cross-validation [9,10]. These studies have shown that predictability is influenced by heritability, relatedness, sample size, marker density, and genetic architecture. Generally, predictability increases with higher marker density and larger sample sizes until it plateaus. The relatedness between training and breeding populations also significantly impacts predictability.
Given the complexities of genetics, environmental variations, and data limitations, new methods are needed to improve prediction accuracy in GS. Accurate phenotyping and marker data are essential to minimize prediction errors. Optimizing GS methodology is challenging, as some factors require increased resources while others do not benefit from such increases. However, statistical machine learning models offer a promising area for optimization [11]. Studies comparing various GS models have shown that no single model is best for all traits, with prediction accuracy depending on the number of genes controlling the trait, allele effect distribution, presence of epistasis, and heritability [12]. Bayesian methods are popular in genomic prediction because they can incorporate prior knowledge, handle high-dimensional and correlated data, and provide a probabilistic interpretation of predictions. This flexibility allows for more accurate and robust predictions, accommodating the complex genetic architecture and uncertainty inherent in genomic data. Among the numerous Bayesian methods available, such as BayesA, BayesB, BayesC, and Bayesian Lasso, Bayesian GBLUP is widely used for its robustness and computational flexibility, but in recent years, we have seen the emergence of deep learning models in genomic prediction.
Deep learning models can sometimes achieve higher prediction accuracy by learning directly from raw data, such as text, sound, and images. These models use large, labeled datasets to automatically extract features, eliminating the need for manual feature extraction typical of traditional machine learning. However, substantial and effective data are needed to prevent overfitting, especially when data are limited. Developing effective deep learning models requires minimizing errors within the training set, which impacts the validation set. Data augmentation (DA) is a powerful technique used to reduce training set errors and combat model overfitting [13,14]. DA involves artificially increasing the size of the training dataset through techniques like data warping or oversampling, thereby enhancing the generalizability and overall performance of training models.
Data augmentation techniques such as flipping, rotating, and cropping have proven to be successful in image classification, speech recognition, and natural language processing. The average gain in prediction performance from DA depends on the specific dataset and augmentation techniques used. In genomic selection for plant breeding, especially with limited large-scale training and genomic data, DA can maximize the utility of existing data. For example, Enkvetchakul and Surinta [15] developed a plant disease recognition system using deep convolutional neural networks, achieving higher accuracy by combining offline training with data augmentation techniques. Chergui [16] evaluated five regression models using three datasets (primary, with additional features, and augmented), finding that cross-validation showed an overall performance increase with augmented data.
The challenges in implementing GS due to insufficiently accurate predictions make data augmentation a promising solution to enhance predictive performance. This research aims to leverage data augmentation algorithms to improve prediction accuracy, which is essential for the successful adoption of GS methodologies in plant breeding.
2. Materials and Methods
2.1. Datasets
We used six datasets (see Table 1) to assess the methods proposed in this study. An overview of all six datasets is included in the analysis.

Table 1.
Dataset descriptions. Gen denotes genotypes; Env denotes environments.
2.2. Statistical Machine Learning Models
2.2.1. GBLUP Model (Conventional Model C)
To assess the predictive accuracy of the traits of interest, the Bayesian Genomic Best Linear Unbiased Prediction (GBLUP) model with the following predictor is used:
where denotes the continuous dependent variable quantified in the ith line, is a general mean, indicates the stochastic influences of genotypes distributed precisely as , where represents the genomic relationship matrix (Linear kernel), computed as proposed by Vanraden (2008) [9], and denotes the random error components in the model presumed to be independent normal random variables with a mean of 0 and variance of . The implementation of this model was conducted with R statistical software [17], using the BGLR library of Pérez and de los Campos [18].
2.2.2. Data Augmentation (Augmented Algorithms A)
Various data augmentation algorthms exist, though our focus will center on the mixup method, as introduced in the paper titled “mixup: Beyond Empirical Risk Minimization” by Zhang et al. [19], which provides a domain-agnostic approach to the improvement in machine learning models. Using this algorithm, synthetic data are generated through the application of the following mathematical formulae:
where and are rows (vectors) of lines and with their corresponding marker information; each vector is of length .
where and are scalars of the phenotypic (BLUEs) response variable of lines and . , ) and (, ) represent two randomly selected lines from our training dataset, with λ ∈ [0, 1] denoting a mixing coefficient. In this research, we used . Essentially, mixup enriches the training distribution by incorporating the inherent principle that linear interpolations of feature vectors should correspond to linear interpolations of each one’s target values. Notably, the implementation of mixup is highly efficient, requiring only a minimal amount of code and incurring in minimal computational overhead. It is essential to note that in our methodology, synthetic data were exclusively generated from the top 20% of lines in the training set, and models using augmented data were trained using solely the top 20% of lines in the training set, along with the resultant synthetic data generated from the top 20% of those lines. By the top 20% of lines, we mean those lines in the training set with phenotypic values (response variable) larger than the quantile 80% of the response variable. When training the GBLUP model specified in Equation (1) using augmented data, the results were labeled as “A = Augmented,” whereas using the original training set for training was denoted as “C = Conventional.” The G required in the GBLUP model (Equation (1)) was computed with the augmented inputs for the augmented approach and with the original markers (inputs) for the conventional approach.
It is important to point out that this data augmentation method (mixup) has had a significant impact on the machine learning community. By providing a simple yet effective data augmentation technique, mixup has improved model generalization, robustness, and performance across various applications and domains. Its adaptability and effectiveness have led to widespread adoption and numerous extensions, cementing its place as a fundamental tool in the machine learning practitioner’s toolkit [20,21,22,23]. Due to its simplicity, the mixup method (see Equations (2) and (3)) can be applied with conventional machine learning methods and even deep learning methods with complex architectures.
2.3. Evaluation of Prediction Performance
This research used a cross-validation methodology referred to as “random-partition-line.” In this approach, elucidated by Montesinos-López et al. [24], each fold designated 20% of the lines as the test set, while the remaining 80% collectively formed the training set. The evaluation used 10 folds, with the average performance across these folds reported as the prediction outcome.
To assess the genomic performance of the models, two metrics were used: the normalized root mean square error (NRMSE) and the Mean Arctangent Absolute Prediction Error (MAAPE; Sungil & Heeyoung [25]). The mean square error is computed as MSE = ), where denotes the observed th value, while represents the th predicted value and the normalized root mean square error (), where was used as a metric to evaluate the prediction accuracy.
The Mean Arctangent Absolute Prediction Error (MAAPE) offers a metric to assess prediction accuracy by evaluating the arctangent of the absolute errors between the predicted and actual value, and it is computed as MAAPE =, where and represent the observed and predicted values of the ith cultivar, respectively.
3. Results
The results are presented in seven sections. Section 3.1, Section 3.2, Section 3.3, Section 3.4, Section 3.5 and Section 3.6 correspond to the datasets Maize_1, Maize_2, Maize_3, Maize_4, Soybean_1, and Soybean_2, respectively, whereas Section 3.7 serves as a summary of all the datasets.
3.1. Maize_1
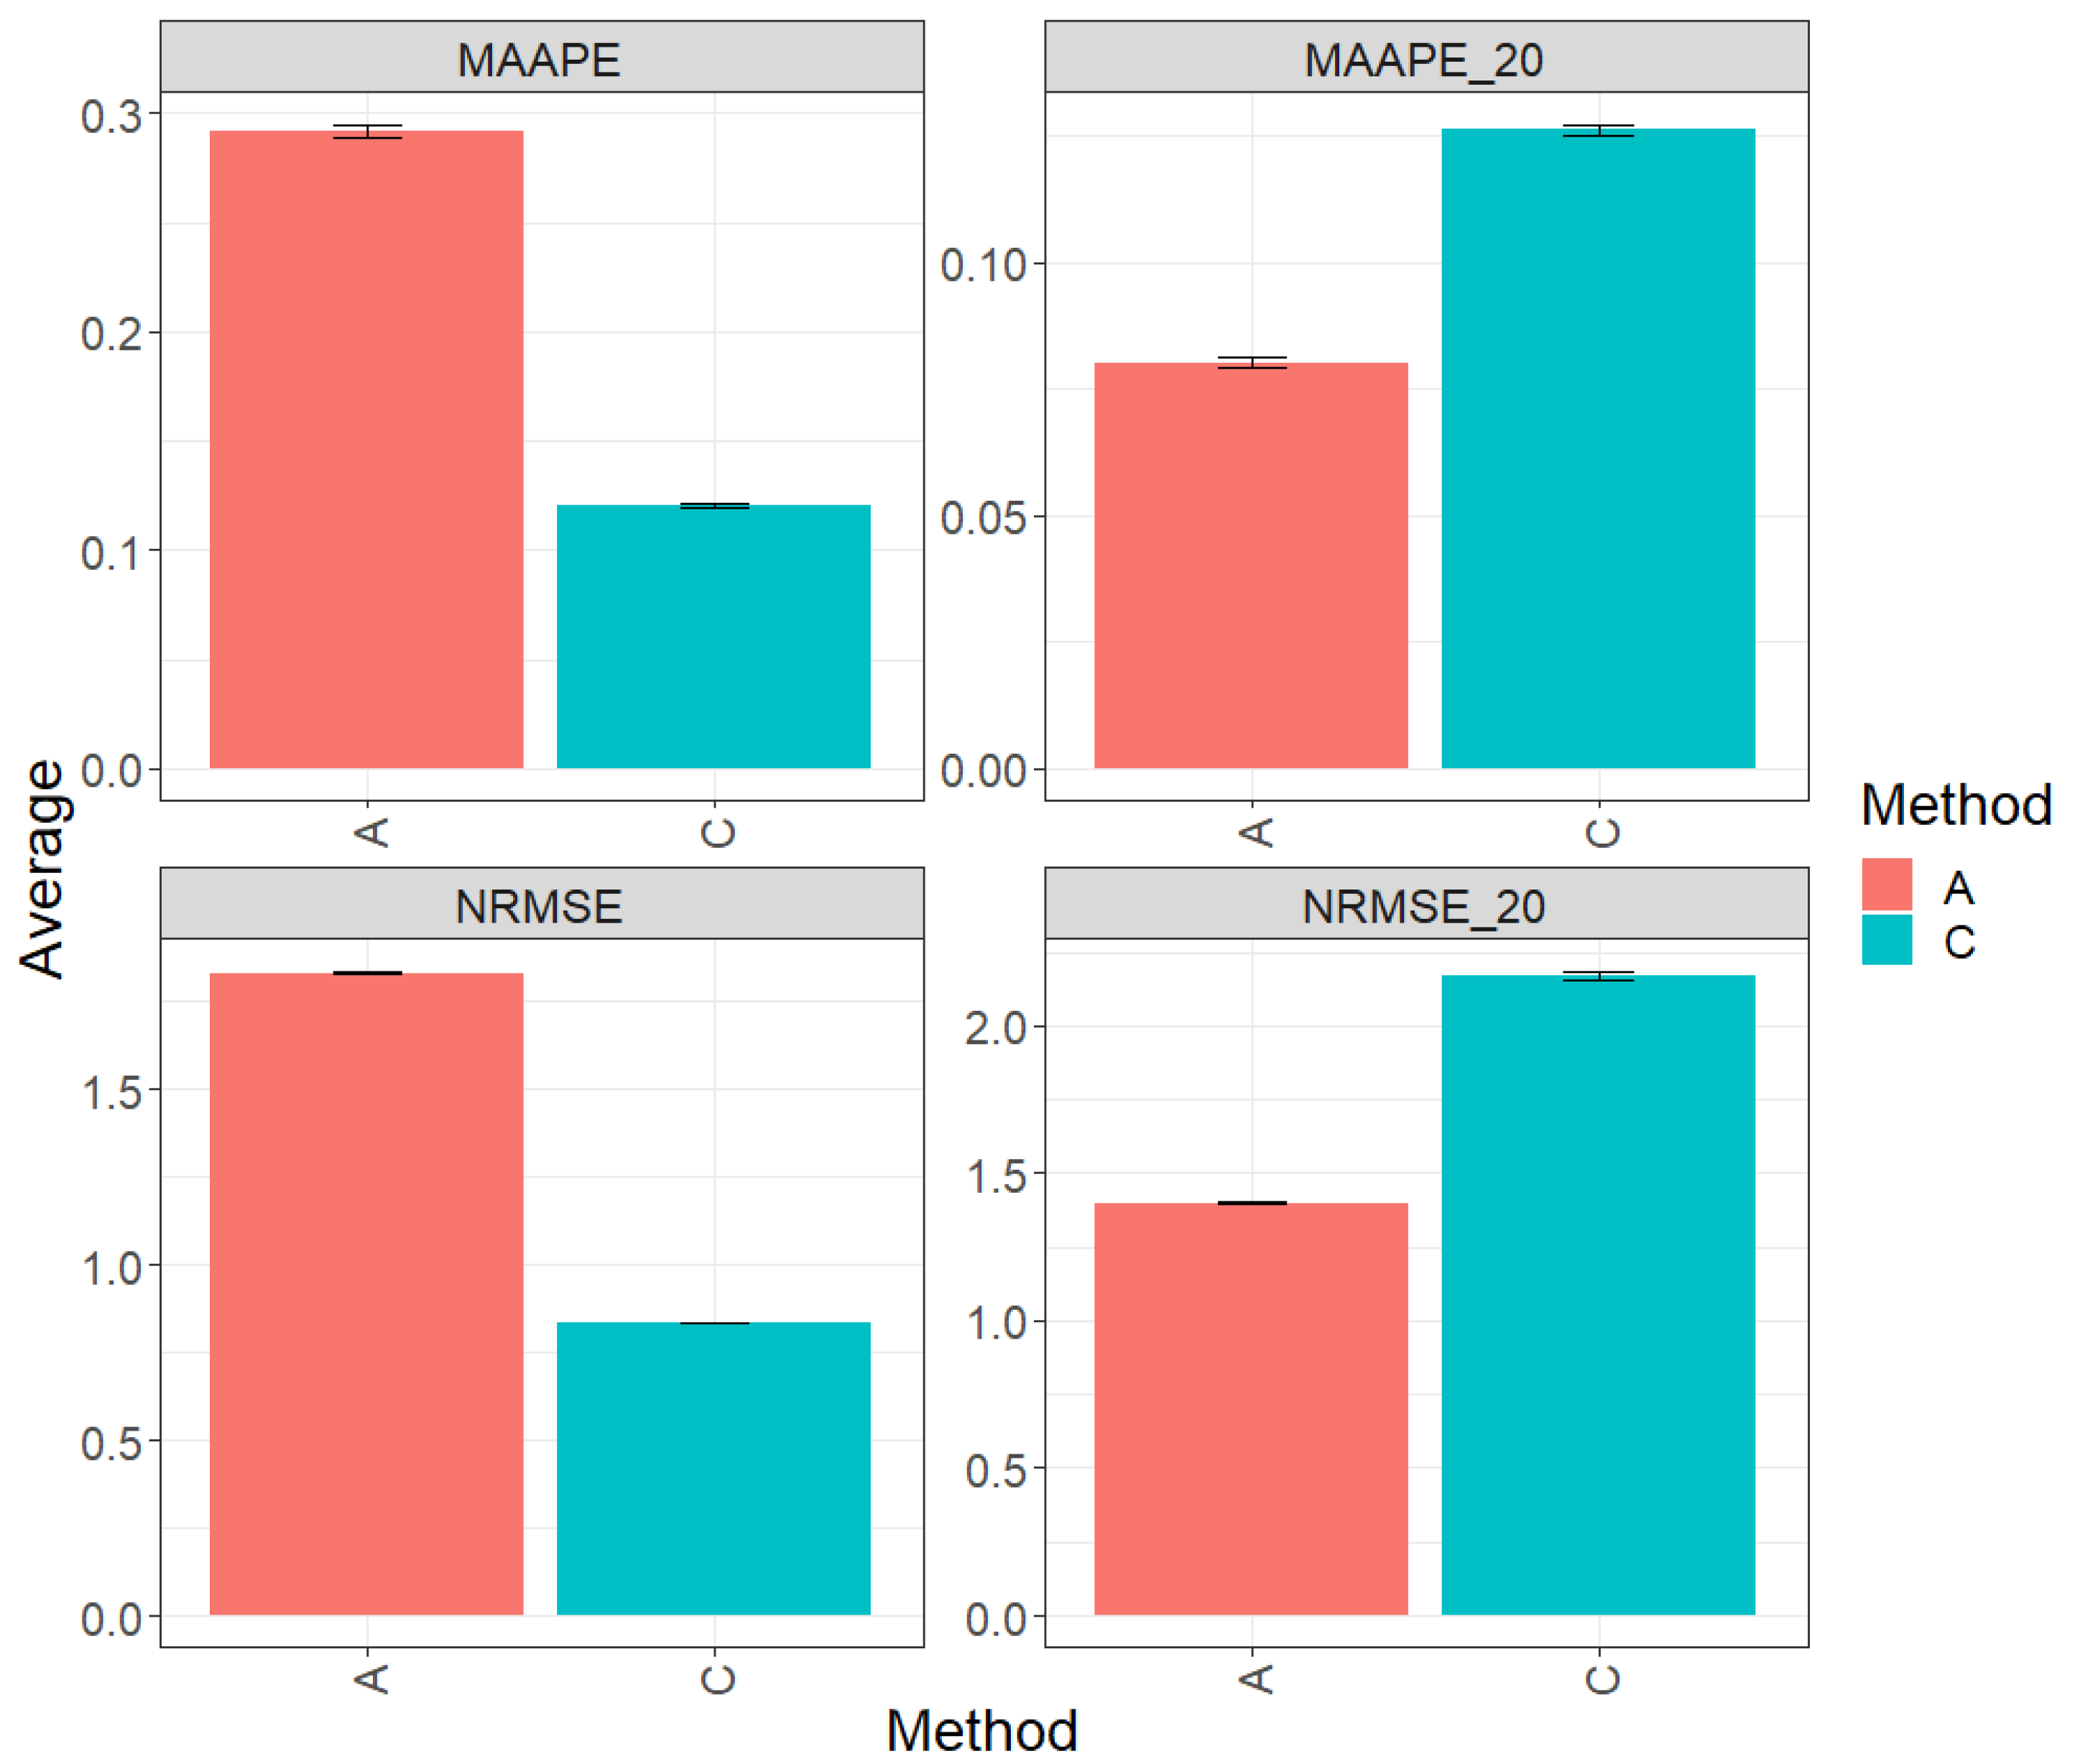
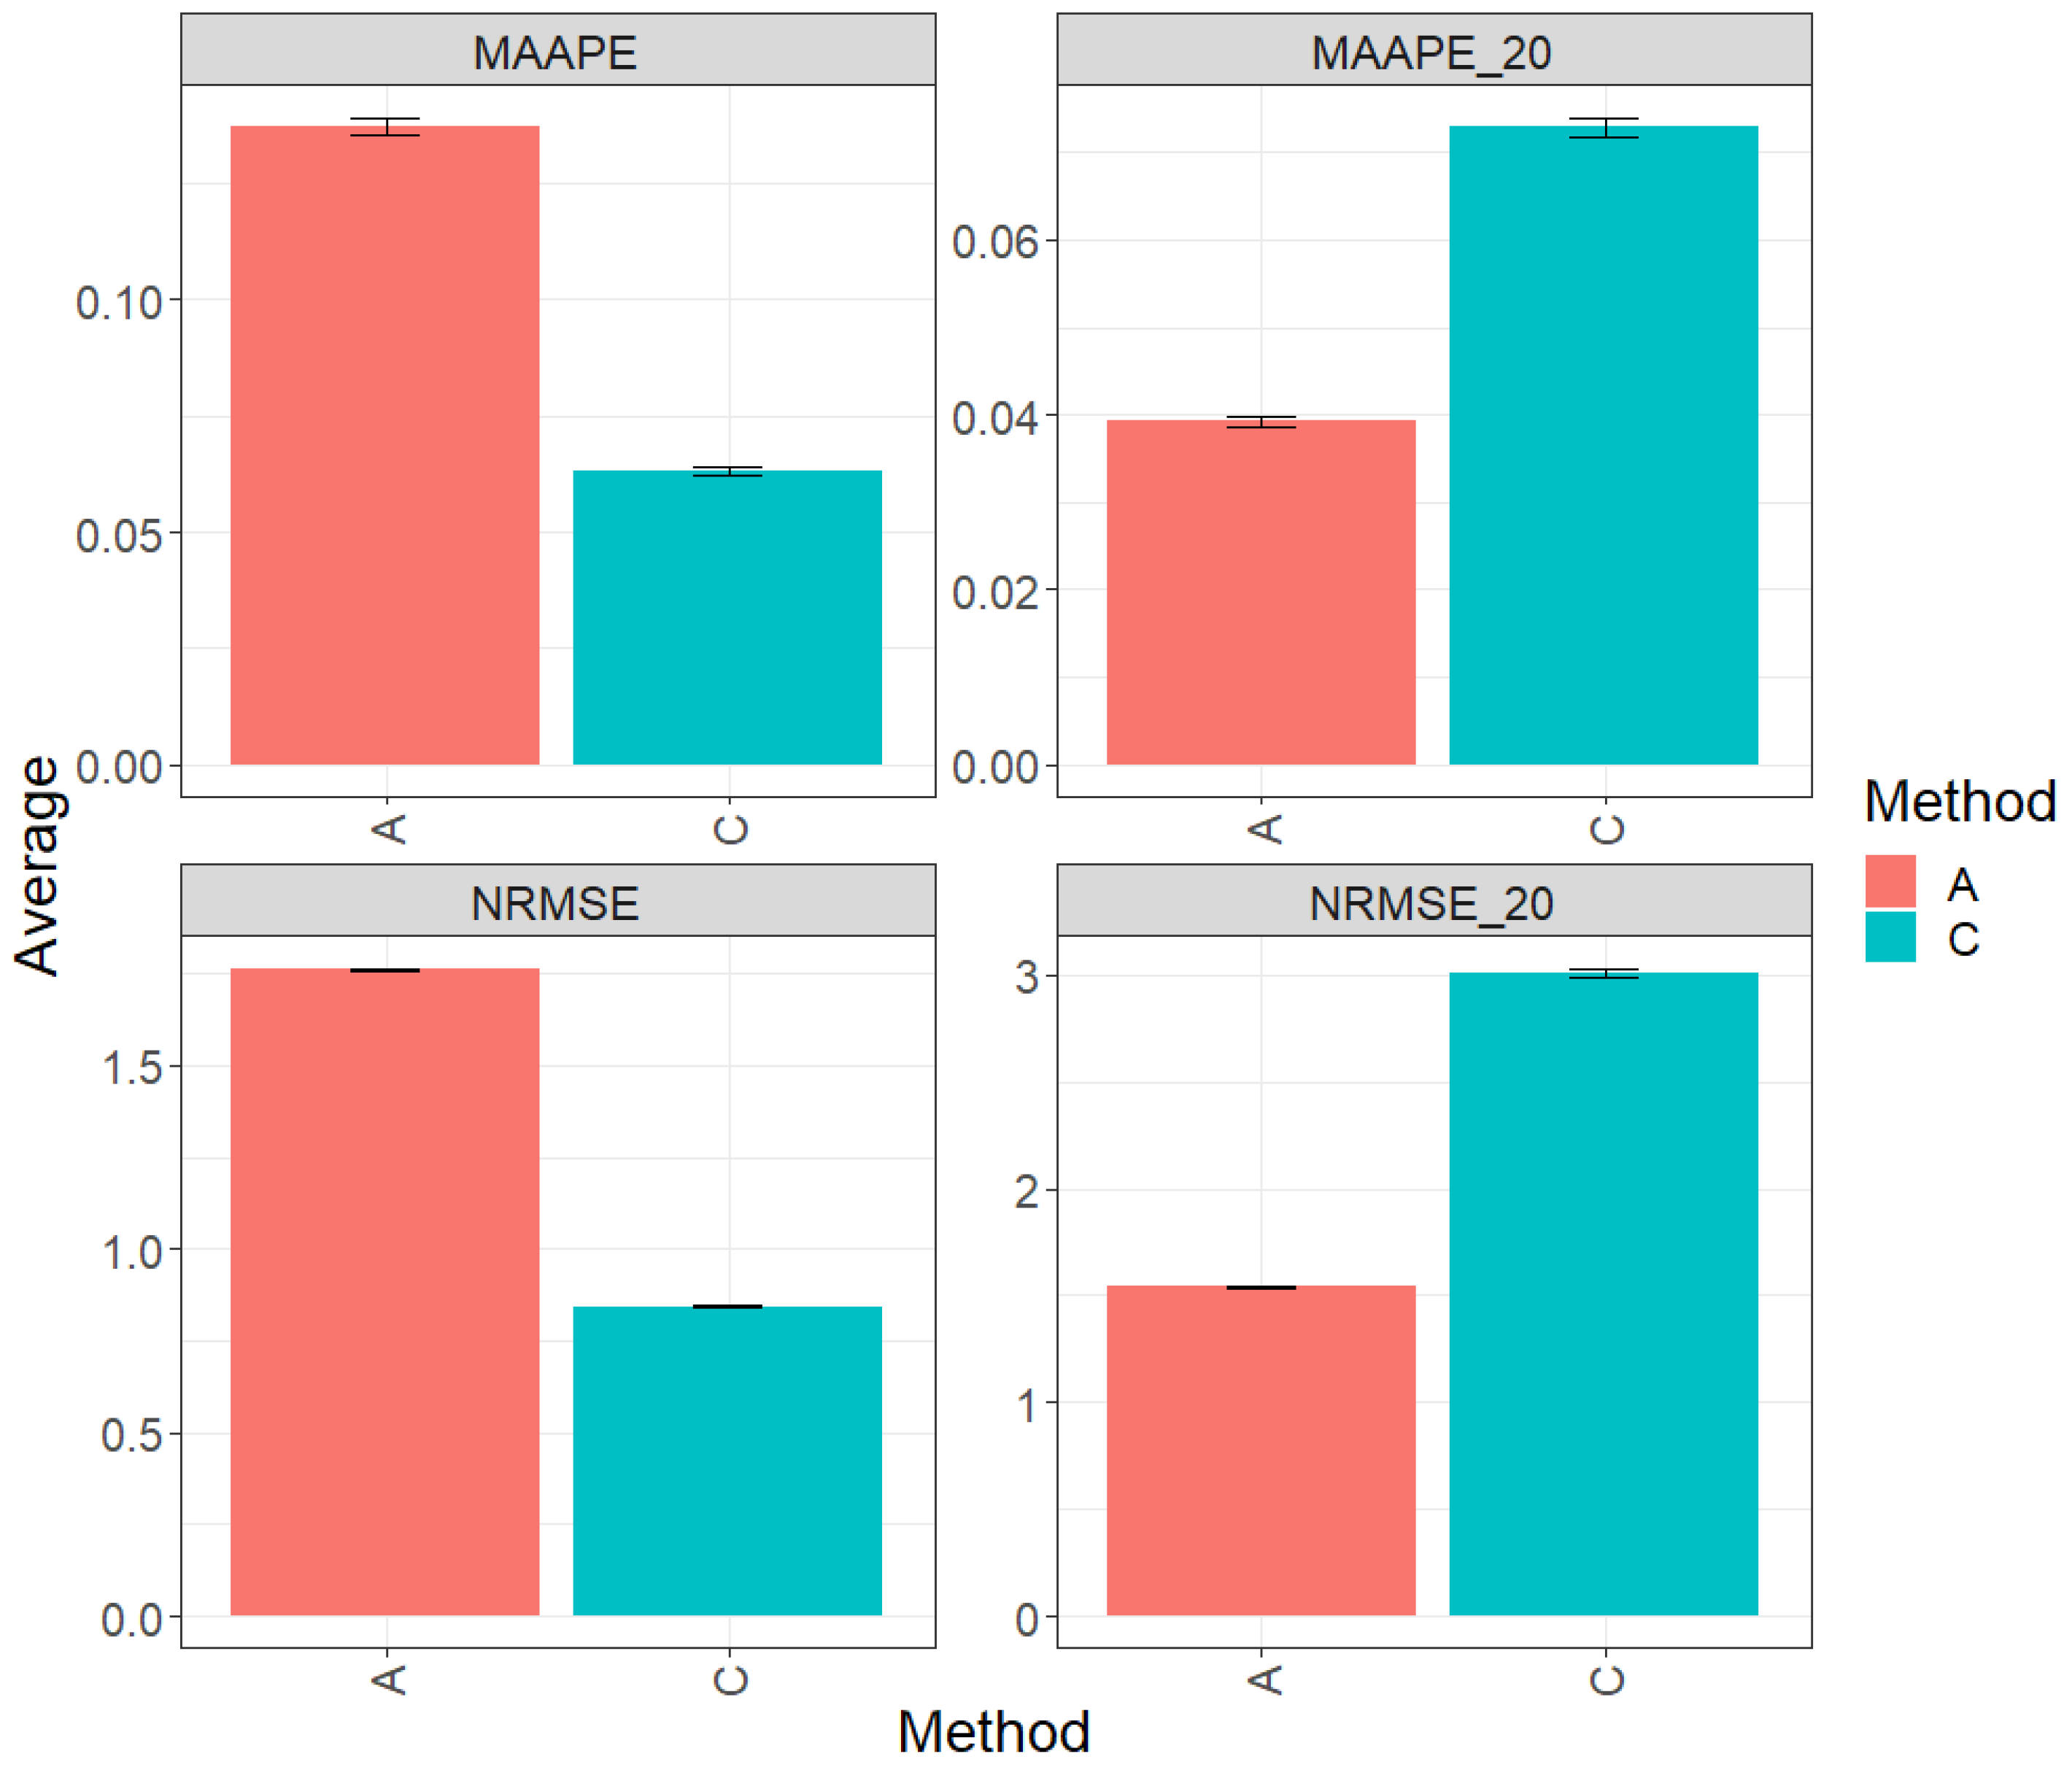
Figure 1 displays the results obtained through the evaluation of the entire test set using the metrics MAAPE and NRMSE. Based on the observed prediction performance, it is evident that model C (conventional) outperformed algorithm A (augmented) by 55.11% in terms of MAAPE and 51.11% in terms of NRMSE. However, when restricting the analysis to the top 20% of the test dataset (MAAPE_20 and NRMS_20), it was observed that algorithm A (augmented) exhibited a greater performance compared to model C, showing a reduction of 45.16% in MAAPE_20 compared with MAAPE and 43.21% in NRMSE_20 versus NRMS. For more detailed information, refer to the results presented in Table 2.

Figure 1.
Prediction accuracy performance results for the Maize_1 dataset using conventional (C) and augmented (A) methods, in terms of mean arctangent absolute percentage error (MAAPE), mean arctangent absolute percentage error for the best 20% cultivars (MAAPE_20), normalizing the mean square error (NRMSE), and normalizing the mean square error for the best 20% cultivars (NRMSE_20).
Table 2.
Prediction accuracy results for dataset Maize_1 using conventional (C) and augmented (A) methods, with metrics MAAPE and NRMSE for the total testing and MAAPE_20 and NRMSE-20 for the best 20% testing.
3.2. Maize_2
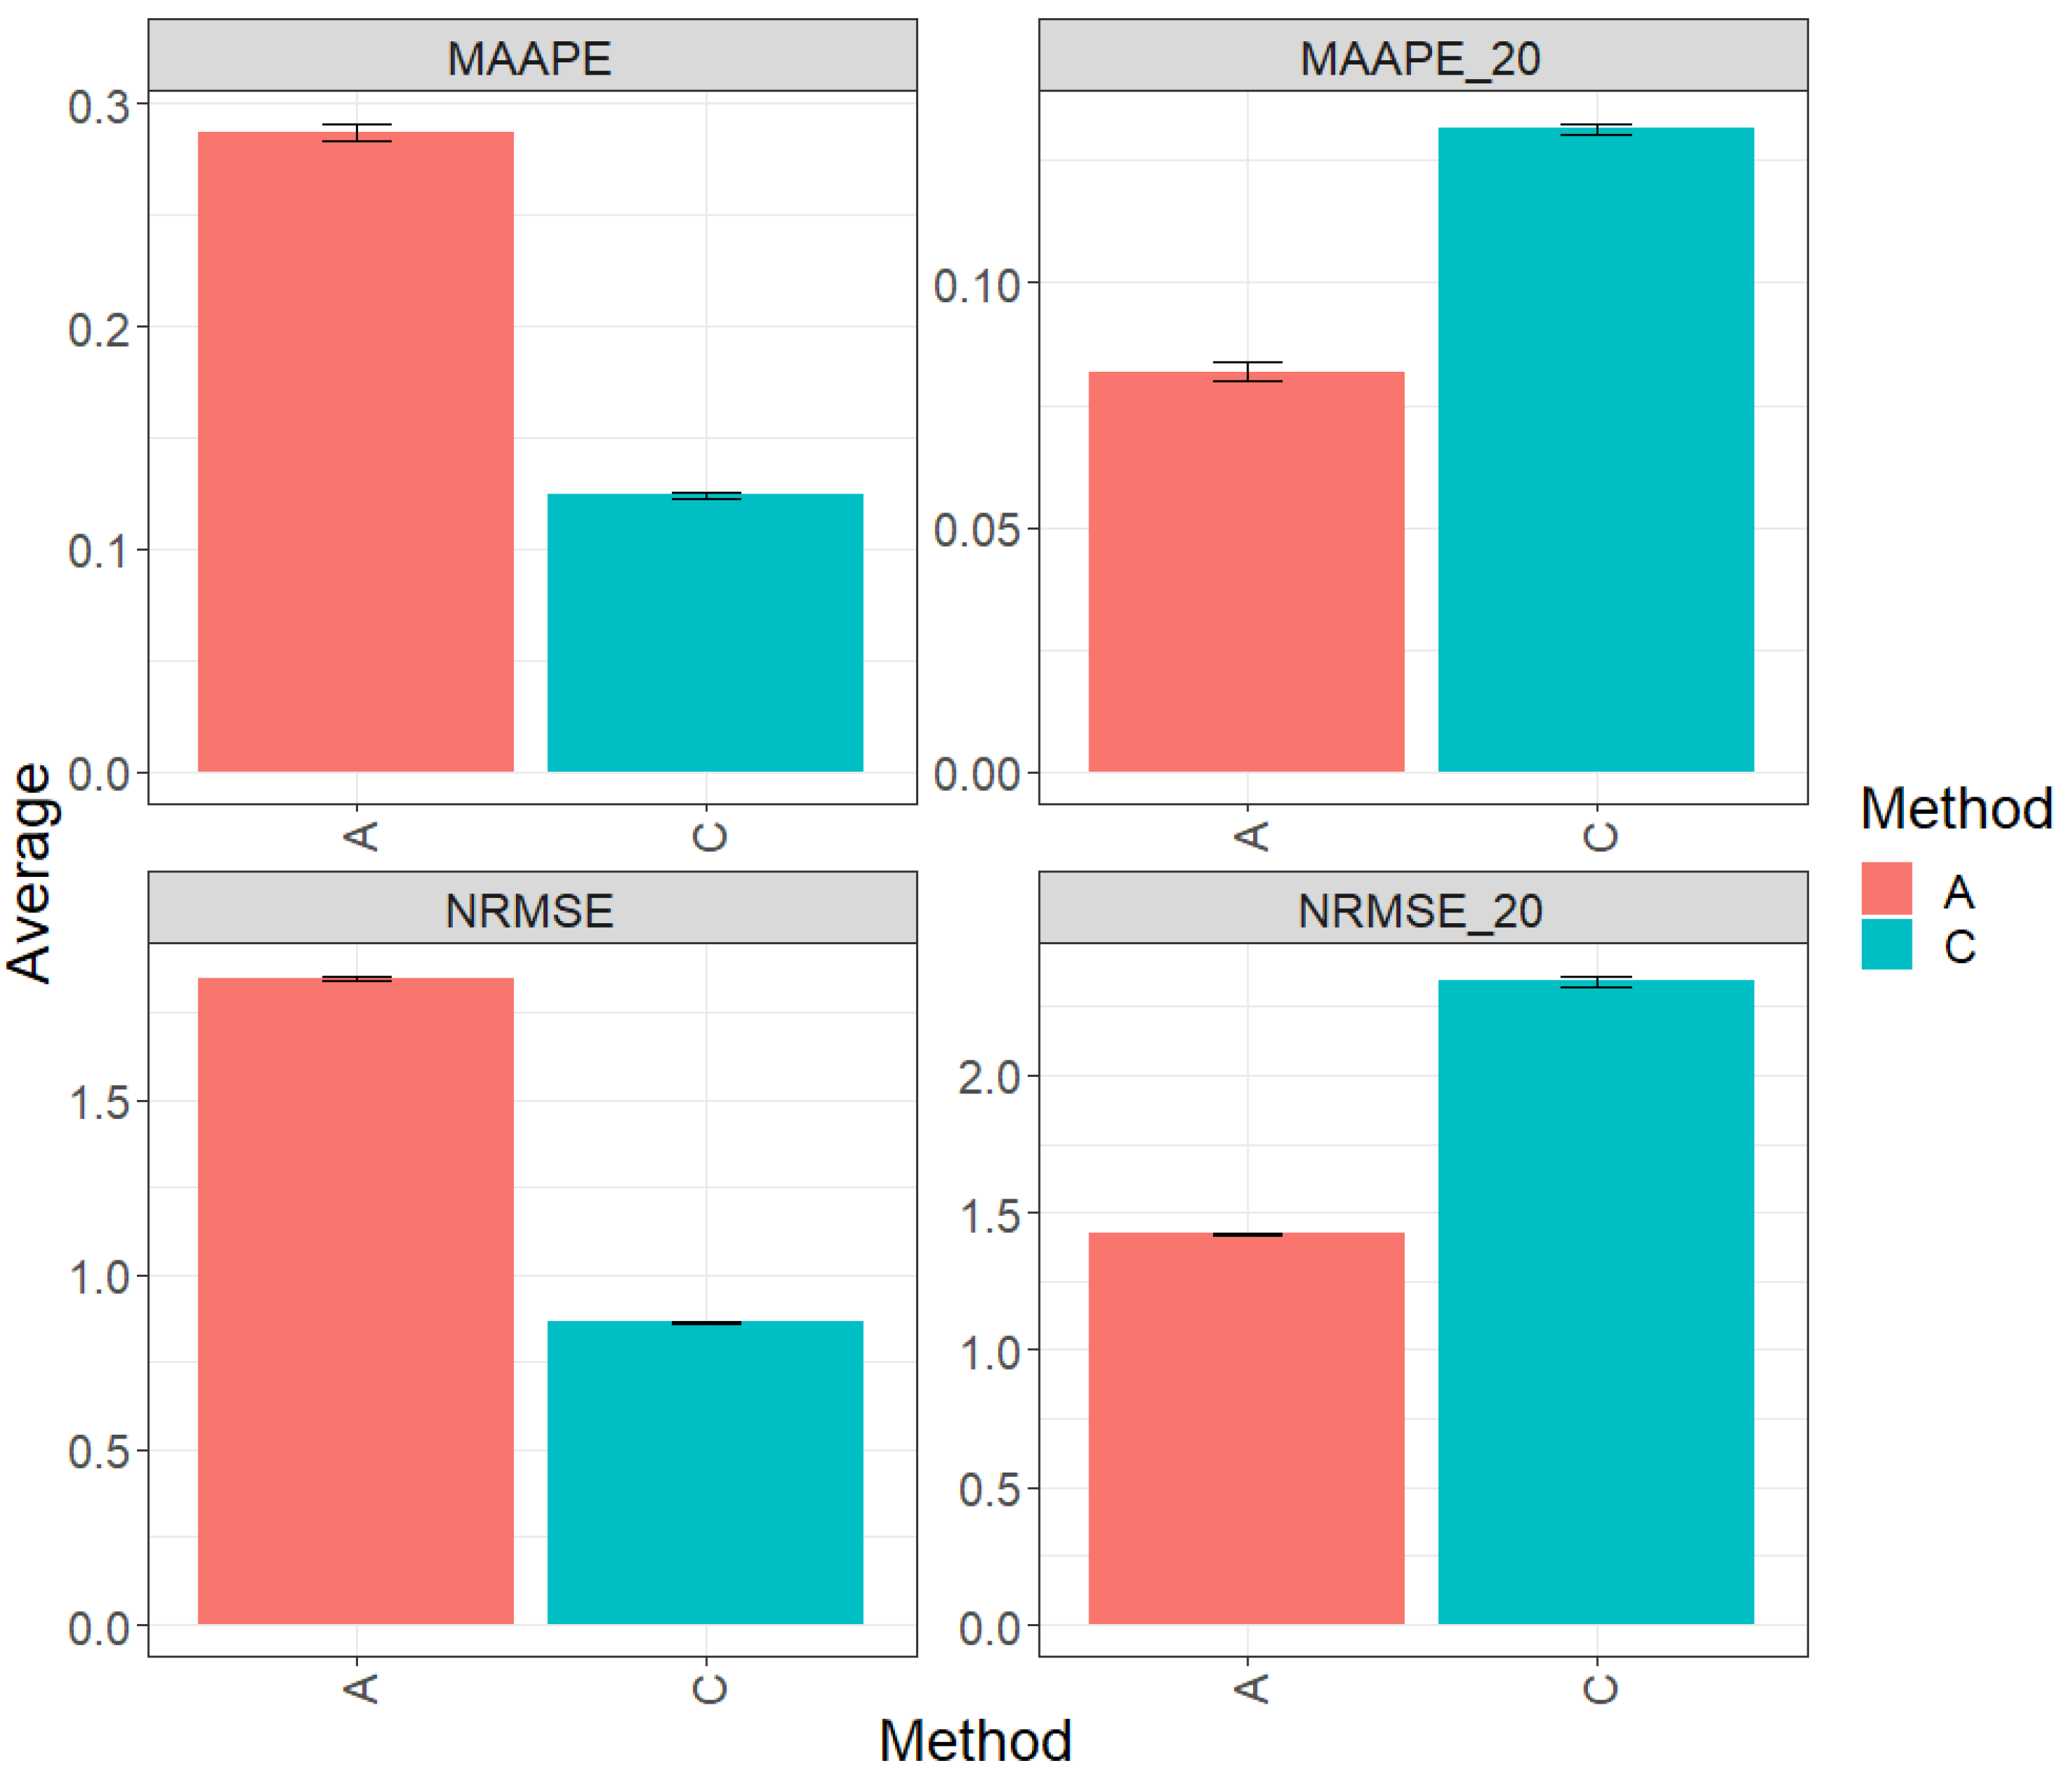
Figure 2 presents the results obtained by evaluating the entire test set using two metrics (MAAPE and NRMSE). Method C (conventional) exhibited a greater prediction performance over method A (augmented), with improvements of 58.71% in MAAPE and 54.47% in NRMSE. In summary, method C outperformed method A in both metrics. However, when focusing exclusively on the top 20% of the complete test set, the analysis of the metrics revealed that method A showed an advantage in performance over method C, with a reduction of 36.52% in MAAPE_20 vs. MAAPE and 35.52% in NRMSE_20 vs. NRMSE. These results indicate a significant improvement in the performance of method A compared to method C in this specific context. For more details, refer to Table 3.

Figure 2.
Prediction accuracy performance results for the Maize_2 dataset using conventional (C) and augmented (A) methods in terms of mean arctangent absolute percentage error (MAAPE), mean arctangent absolute percentage error for the best 20% cultivars (MAAPE_20), normalizing the mean square error (NRMSE), and normalizing the mean square error for the best 20% cultivars (NRMSE_20).
Table 3.
Prediction accuracy results for dataset Maize_2 using conventional (C) and augmented (A) methods, with metrics MAAPE and NRMSE for the total testing and MAAPE_20 and NRMSE_20 for the best 20% testing.
3.3. Maize_3
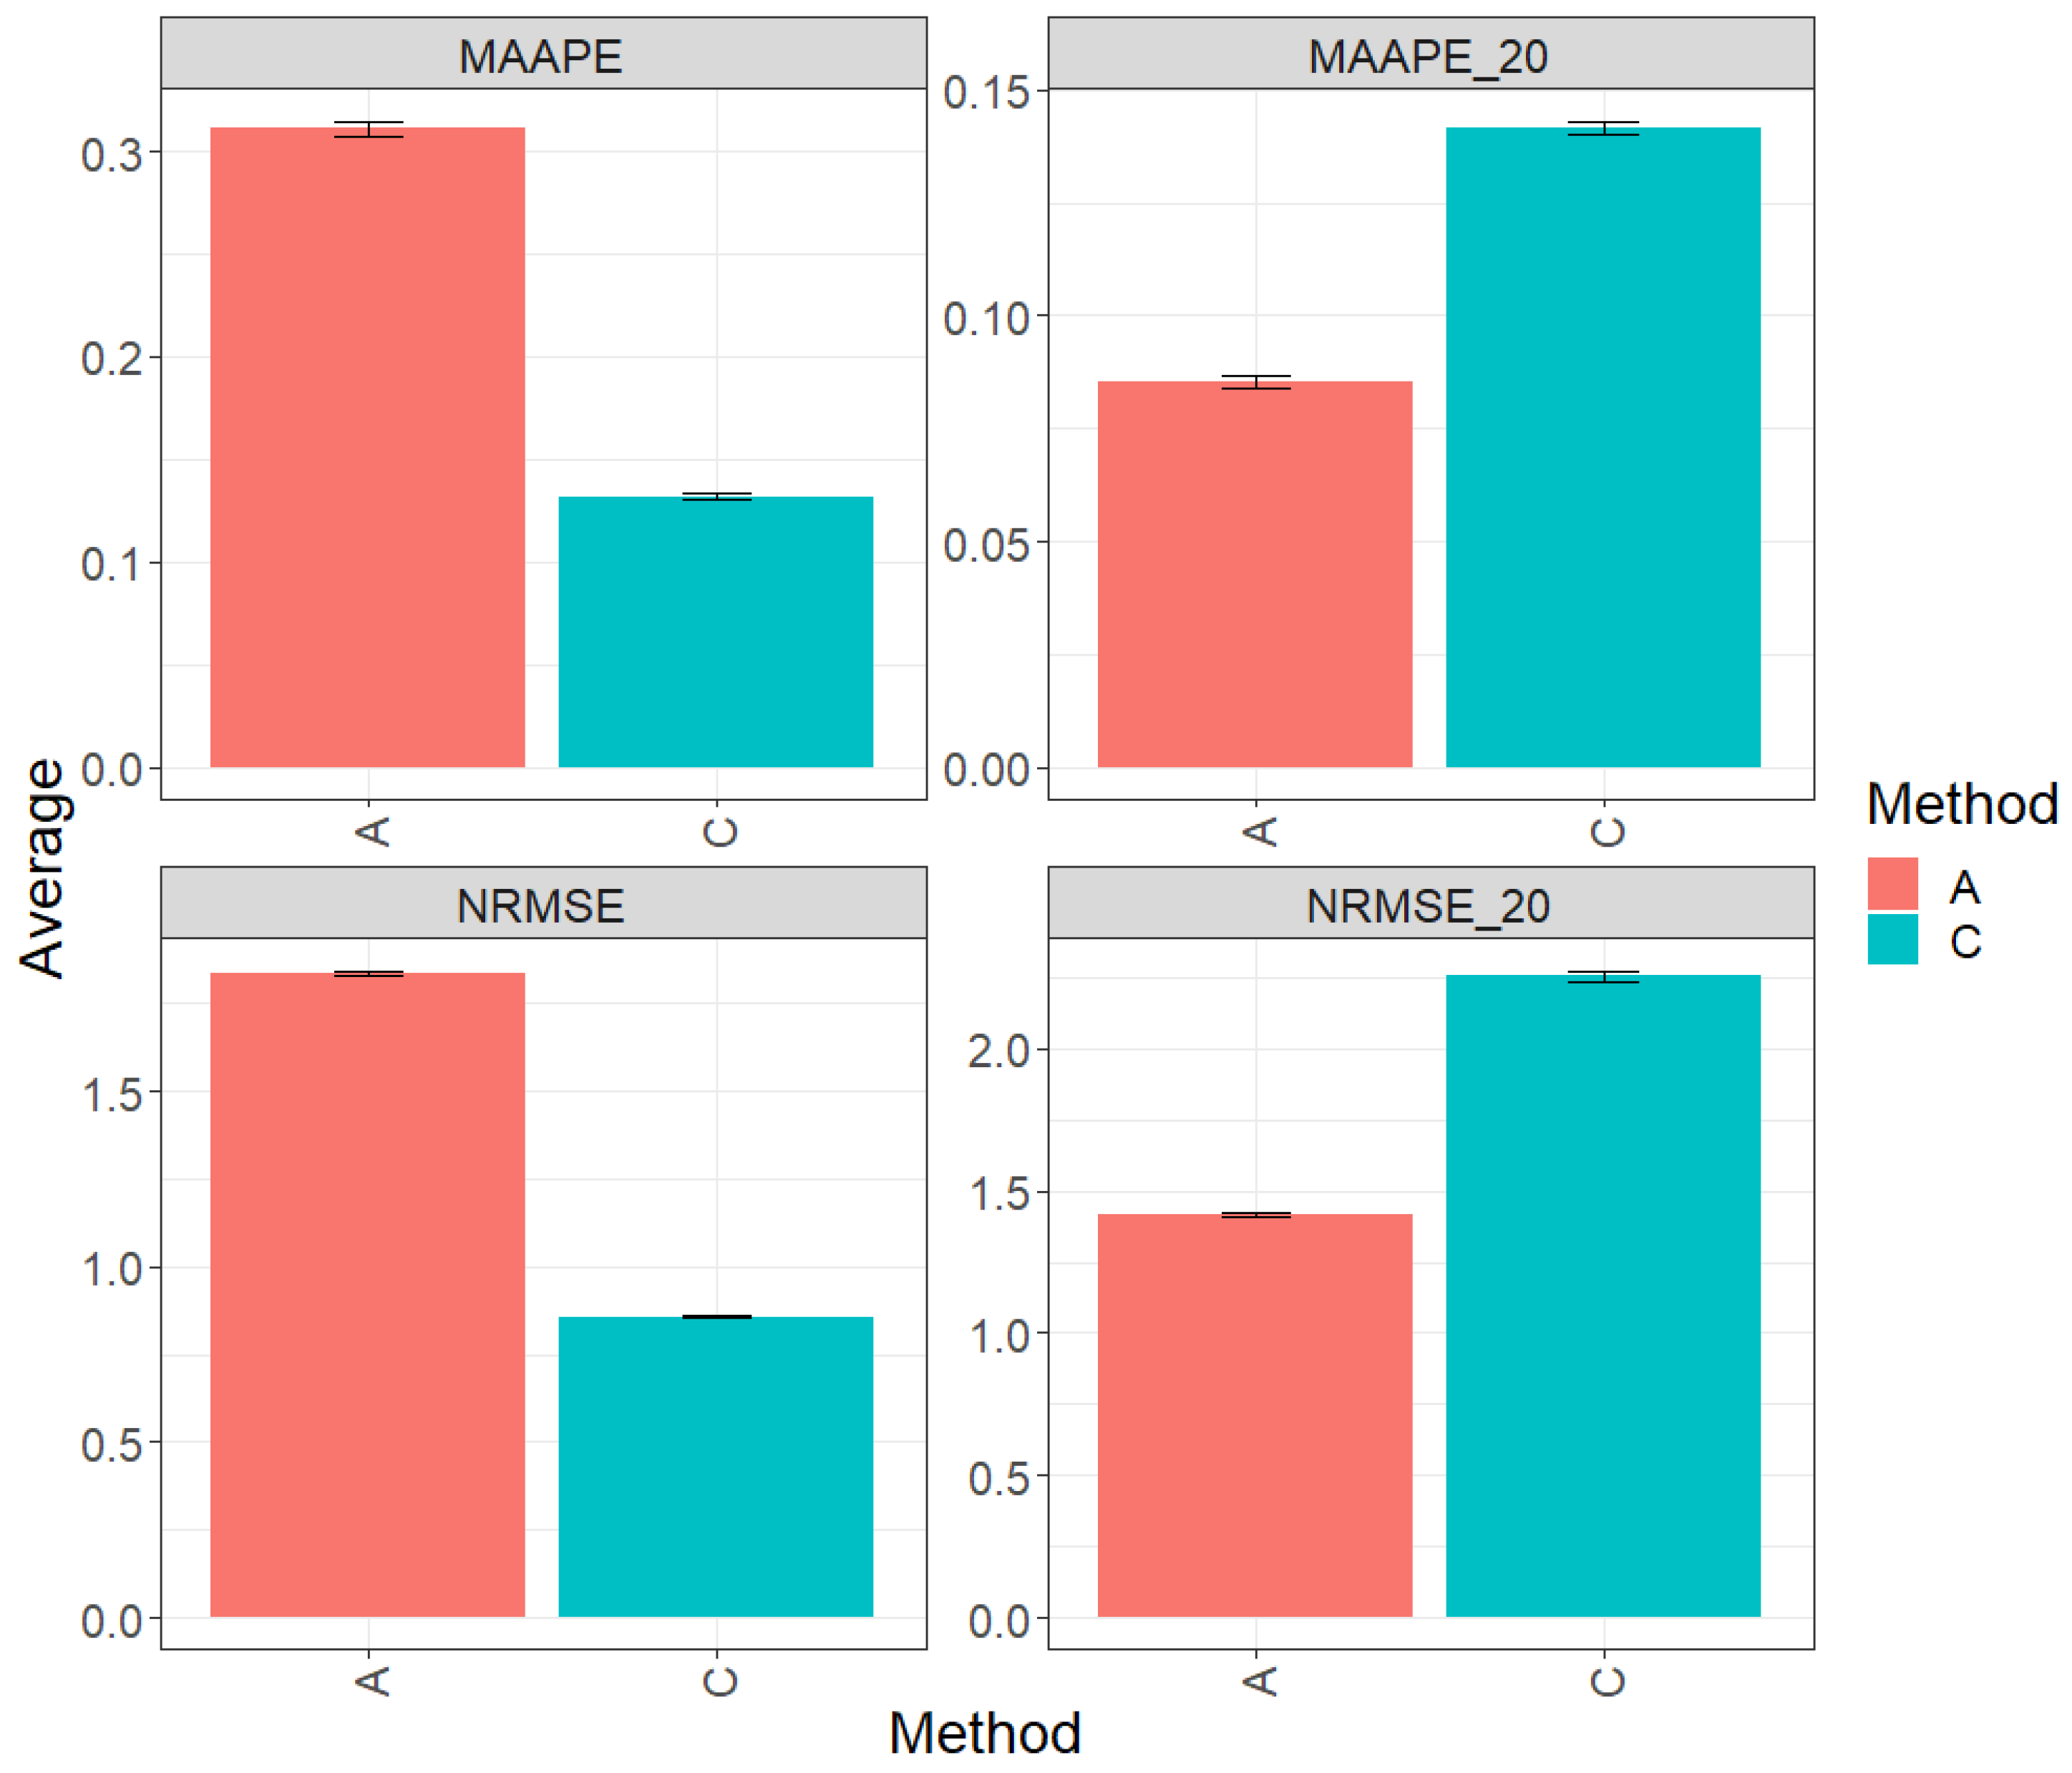
Figure 3 displays the results of evaluating the complete test set using two key metrics, MAAPE and NRMSE. In this context, method C (conventional) stands out by displaying greater prediction performance over method A (augmented) by 56.80% in terms of MAAPE and an equally noteworthy 53.22% in terms of NRMSE. In summary, method C significantly outperforms method A in both evaluated metrics. Figures MAAPE_20 and NRMS_20 are specifically for the top 20% of the test dataset. In this context, method A exhibits an advantage over the performance of method C, with a reduction of 37.76% in MAAPE_20 compared with eMAAPE when all data are used and a decrease of 39.22% in NRMSE_20 compared with NRMSE. These results clearly underline the significant improvement in the performance of method A in this scenario. For a more detailed exploration, refer to Table 4.

Figure 3.
Prediction accuracy performance results for the Maize_3 dataset using conventional (C) and augmented (A) methods in terms of mean arctangent absolute percentage error (MAAPE), mean arctangent absolute percentage error for the best 20% cultivars (MAAPE_20), normalizing the mean square error (NRMSE), and normalizing the mean square error for the best 20% cultivars (NRMSE_20).
Table 4.
Prediction accuracy results for dataset Maize_3 using conventional (C) and augmented (A) methods, with metrics MAAPE and NRMSE for the total testing and MAAPE_20 and NRMSE_20 for the best 20% testing.
3.4. Maize_4
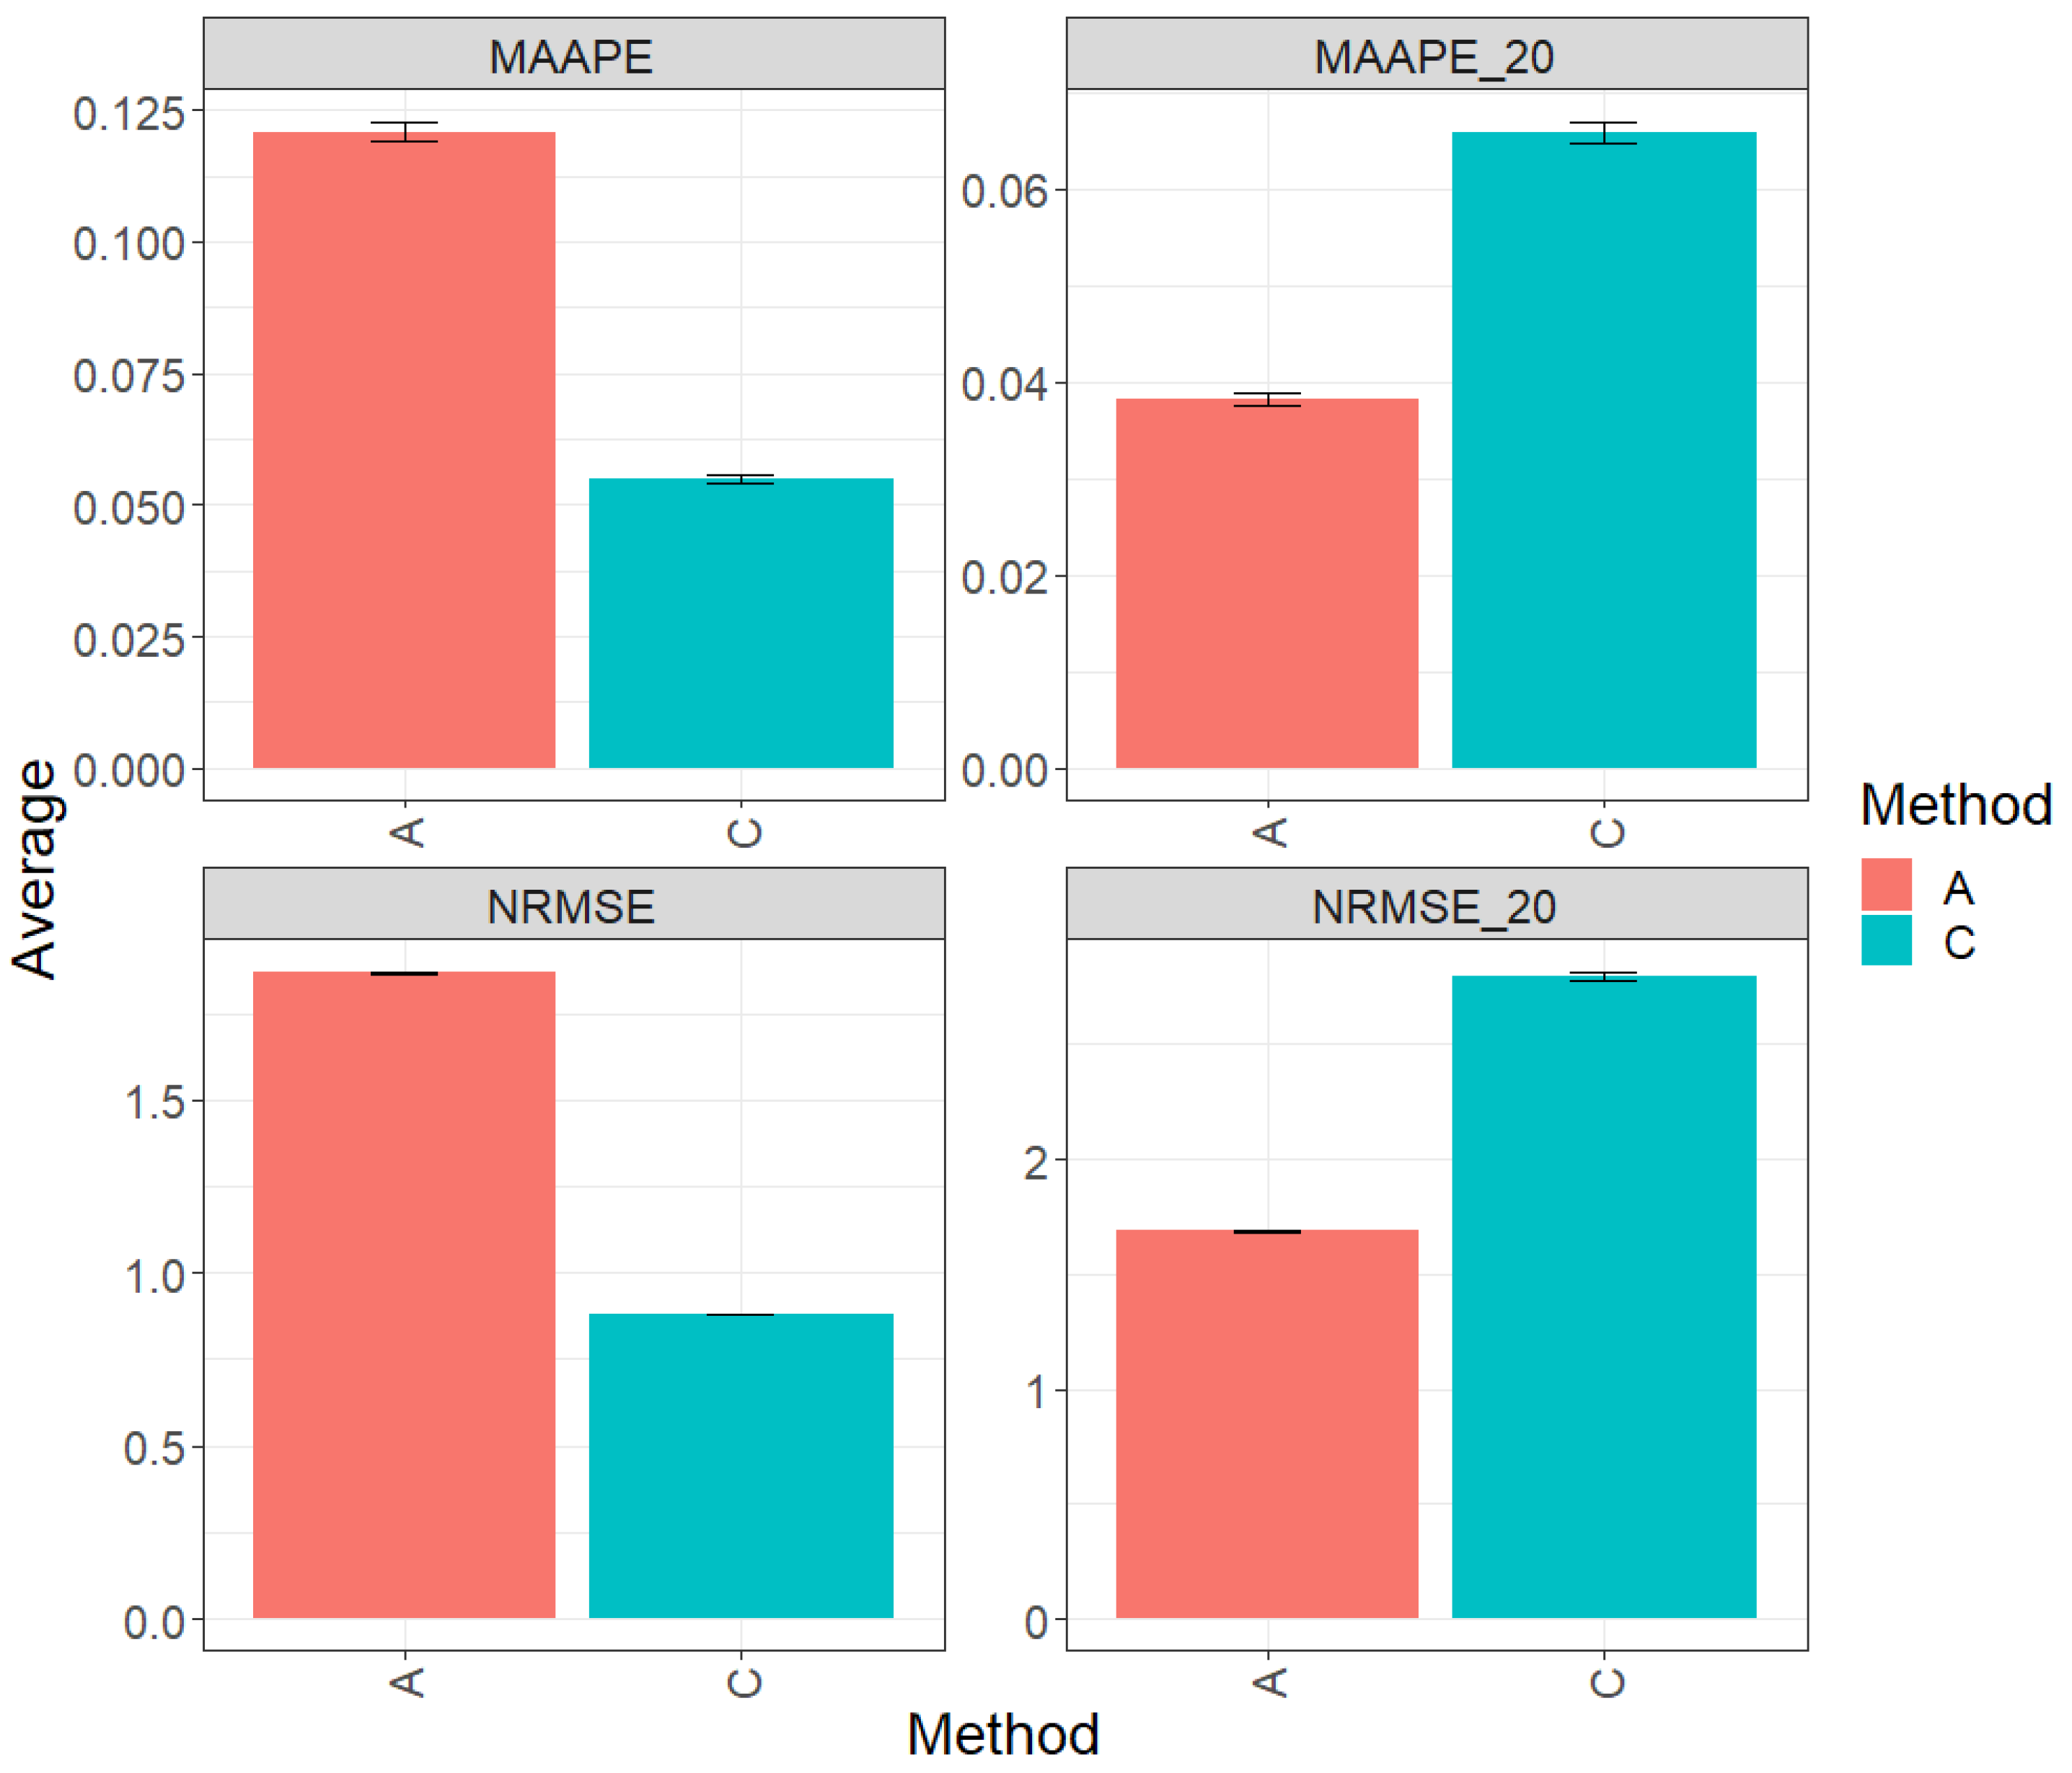
Figure 4 presents the results of the evaluation of the entire test dataset using the metrics MAAPE and NRMSE. Regarding the observed prediction performance, method C (conventional) clearly outperforms method A (augmented) by 57.65% in terms of MAAPE and 53.41% in terms of NRMSE. However, when focusing the analysis on the top 20% of the test dataset (Figures MAAPE_20 and NRMS_20), it becomes apparent that method A exhibits a greater performance in comparison to method C, showing a reduction of 39.65% in MAAPE_20 and 37.24% in NRMSE-20 when compared with MAAPE and NRMSE, respectively. For additional details, refer to Table 5.

Figure 4.
Prediction accuracy performance results for the Maize_4 dataset using conventional (C) and augmented (A) methods in terms of mean arctangent absolute percentage error (MAAPE), mean arctangent absolute percentage error for the best 20% cultivars (MAAPE_20), normalizing the mean square error (NRMSE), and normalizing the mean square error for the best 20% cultivars (NRMSE_20).
Table 5.
Prediction accuracy results for dataset Maize_4 using conventional (C) and augmented (A) methods, with metrics MAAPE and NRMSE for the total testing and MAAPE-20 and NRMSE-20 for the best 20% testing.
3.5. Soybean_1
The Figure 5 contain the results of the comprehensive evaluation of the entire test dataset using two fundamental metrics, namely MAAPE and NRMSE. Method C (conventional) displays a greater prediction performance over method A (augmented) by 54.54% in terms of MAAPE and 52.83% in terms of NRMSE. In summary, method C outperforms method A in terms of both metrics. However, when focusing exclusively on the top 20% of the complete test set (Figures MAAPE_20 and NRMS_20), the metric analysis reveals that method A exhibits a performance advantage over method C, with a reduction of 42.07% in MAAPE_20 and 39.72% in NRMSE_20 compared with MAAPE and NRMSE, respectively. These results reflect a substantial improvement in the performance of method A when using the top 20% of the data. For a more detailed exploration, refer to Table 6.
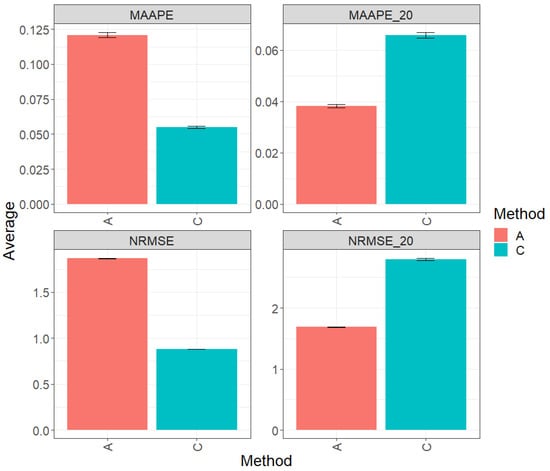
Figure 5.
Prediction accuracy performance results for the Soybean_1 dataset using conventional (C) and augmented (A) methods in terms of mean arctangent absolute percentage error (MAAPE), mean arctangent absolute percentage error for the best 20% cultivars (MAAPE_20), normalizing the mean square error (NRMSE), and normalizing the mean square error for the best 20% cultivars (NRMSE_20).
Table 6.
Prediction accuracy results for dataset Soybean_1 using conventional (C) and augmented (A) methods, with metrics MAAPE and NRMSE for the total testing and MAAPE_20 and NRMSE_20 for the best 20% testing.
3.6. Soybean_2
Figure 6 presents the results derived from the comprehensive evaluation of the entire test dataset using the key metrics MAAPE and NRMSE. In this context, method C (conventional) excels by displaying a greater prediction performance over method A (augmented), exceeding it by 53.95% in terms of MAAPE and an equally remarkable 52.10% in terms of NRMSE. Method C significantly outperforms method A in both evaluated metrics when using the entire dataset. Figures MAAPE_20 and NRMS_20 house the metric analysis specifically for the top 20% of the test dataset. In this context, method A shows greater performance than method C, with a reduction of 46.14% in MAAPE_20 vs. MAAPE and a decrease of 48.80% in NRMSE_20 vs. NrMSE. These results clearly emphasize the substantial improvement in the performance of method A in this specific scenario. For a more detailed analysis, refer to Table 7.
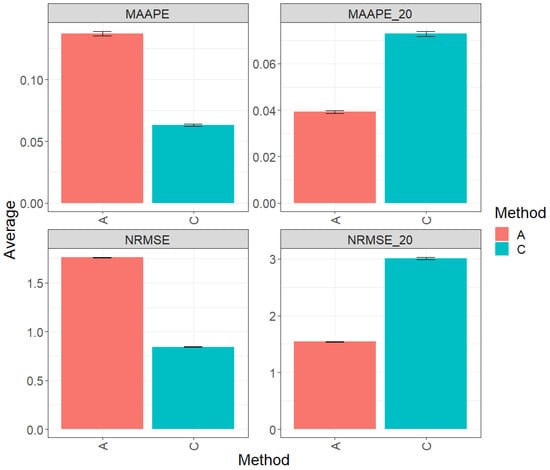
Figure 6.
Prediction accuracy performance results for the Soybean_2 dataset using conventional (C) and augmented (A) methods in terms of mean arctangent absolute percentage error (MAAPE), mean arctangent absolute percentage error for the best 20% cultivars (MAAPE_20), normalizing the mean square error (NRMSE), and normalizing the mean square error for the best 20% cultivars (NRMSE_20).
Table 7.
Prediction accuracy results for dataset Soybean_2 using conventional (C) and augmented (A) methods, with metrics MAAPE and NRMSE for the total testing and MAAPE-20 and NRMSE_20 for the best 20% testing.
3.7. Across Data
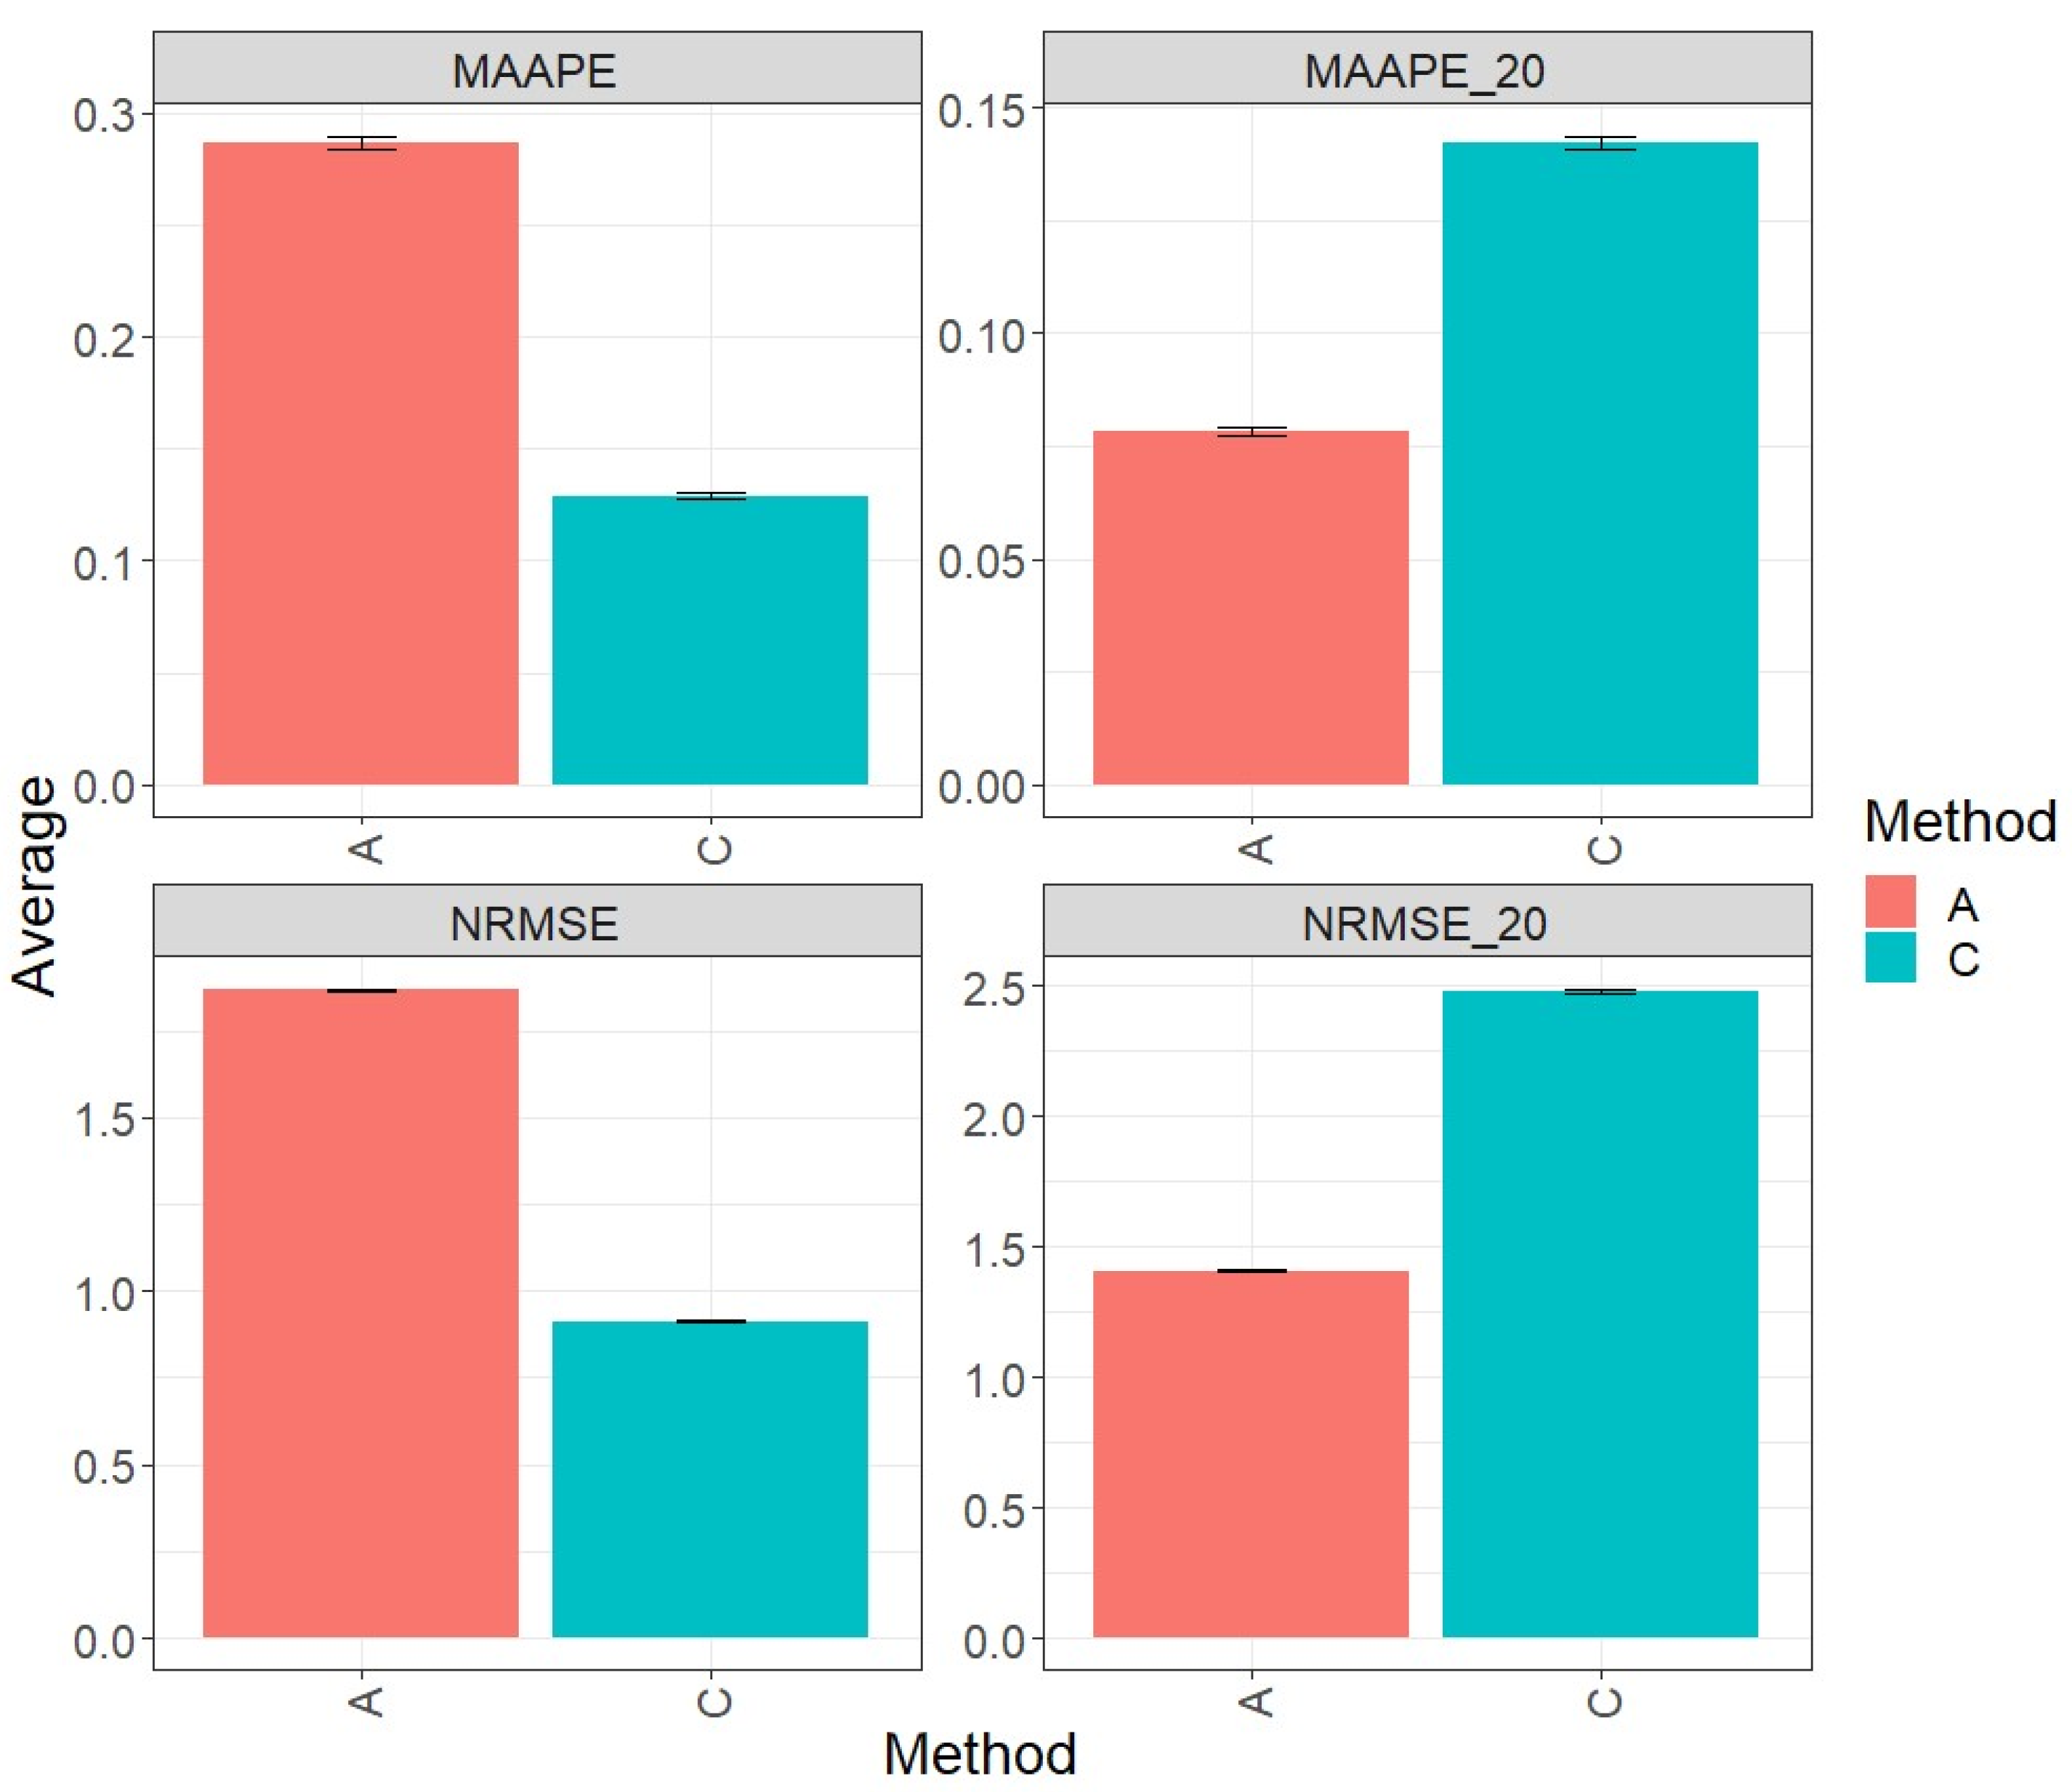
Figure 7 with MAAPE and NRMS presents the results of evaluating across the complete test sets (Maize_1, Maize_2, Maize_3, Maize_4, Soybean_1, and Soybean_2). In this context, the best prediction performance is achieved through the conventional method (C), which outperforms method A by 56.57% and 42.86% in terms of MAAPE and NRMSE, respectively. Overall, method C significantly surpasses method A in both of the evaluated metrics. Figures MAAP_20 and NRMS_20 contain the metric analysis conducted specifically on the top 20% of all test datasets defined as a single set. In this context, the trend of each individual dataset is followed, where method A displays an advantage in performance over method C, with a reduction of 52.86% in MAAPE_20 when compared with MAAPE and a decrease of 41.05% in NRMSE_20 when compared with NRMSE. These results clearly underline the significant improvement in the performance of method A in this scenario. For a more detailed exploration, refer to Table 8.
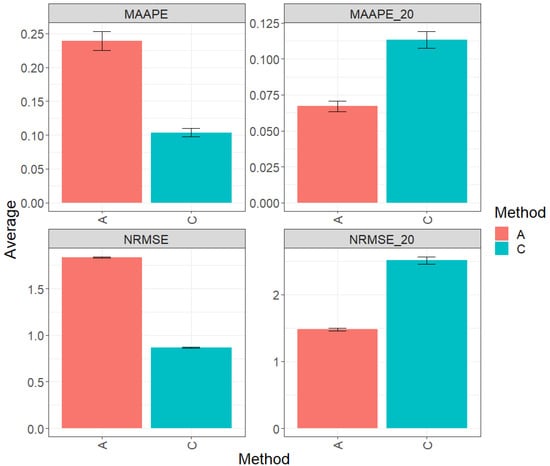
Figure 7.
Prediction accuracy performance results for the across dataset using conventional (C) and augmented methods (A) in terms of mean arctangent absolute percentage error (MAAPE), mean arctangent absolute percentage error for the top 20% cultivars (MAAPE_20), normalizing the mean square error (NRMSE), and normalizing the mean square error for the top 20% cultivars (NRMSE_20).
Table 8.
Prediction accuracy results for across dataset using conventional (C) and augmented (A) methods, with metrics MAAPE and NRMSE for the total testing and MAAPE_20 and NRMSE_20 for the best 20% testing.
4. Discussion
Data augmentation techniques serve as foundational tools for improving prediction accuracy within genomic selection (GS) for plant breeding. The essence of data augmentation lies in its ability to artificially expand the training dataset by generating additional samples through various transformations or perturbations. These augmented data samples introduce diversity into the training process, thereby enriching the learning experience for predictive models. By addressing the inherent limitations associated with relatively small or constrained datasets in practical GS applications, data augmentation plays a crucial role in enhancing the robustness and effectiveness of predictive models. Its significance extends beyond plant breeding to various domains of machine learning, where the augmentation of training data has proven to be instrumental in improving model generalizability and performance.
4.1. Application of Mixup Method
Our study focuses on the application of the mixup method [18], which stands out for its effectiveness in stabilizing model predictions and improving generalization capabilities. Mixup operates by blending pairs of training samples and their corresponding labels in a linear interpolation manner, thereby generating synthetic data points lying along the line segment connecting the original samples. Applied across diverse maize and soybean datasets, the mixup method demonstrates promising results in enhancing prediction performance. Specifically, our analysis reveals significant improvements, particularly evident in the top-performing lines across all the datasets examined. This underscores the potential of mixup as a valuable augmentation technique for enhancing predictive capabilities within genomic prediction frameworks. It is important to point out that we augmented only a portion of the training data since augmenting the whole training set produced worst results in terms of prediction performance.
4.2. Emphasis on Top Lines and Restricted Augmentation
A distinctive aspect of our approach involves the deliberate emphasis on augmenting the top-performing lines during the training phase. This strategic decision stems from the recognition of the disproportionate impact that these lines often have on overall model performance, particularly in the context of plant breeding programs where the focus is often on elite or high-yielding genotypes [26]. By targeting augmentation efforts towards these top lines, our aim is to mitigate prediction errors specific to this subset, thereby potentially improving the overall predictive performance of the model. While our findings indeed demonstrate a notable reduction in errors within this targeted subset, it is essential to acknowledge the inherent limitations of this approach. Despite its effectiveness in optimizing performance for select lines, its impact on the overall model performance across the entire testing set may be somewhat constrained [22]. Therefore, further refinement and optimization are warranted to comprehensively address this discrepancy and maximize the utility of data augmentation strategies within genomic prediction frameworks.
4.3. Importance of Variability in Data Augmentation Strategies
The introduction of variability through data augmentation is a fundamental aspect that underpins its efficacy in genomic prediction. Genetic variation is a hallmark of biological systems, and capturing this variability is essential for developing predictive models that can effectively generalize across diverse genetic backgrounds. Synthetic data generated through augmentation techniques facilitate the representation of a broader spectrum of genetic variations, thereby enhancing the model’s ability to adapt to novel or unseen genotypes. By mitigating the risk of overfitting and expanding the representation of genetic diversity within the training dataset, variability emerges as a pivotal element in augmenting predictive capabilities within genomic selection frameworks. Therefore, careful consideration and integration of variability into the design and implementation of data augmentation strategies are essential to ensure optimal performance and generalizability of predictive models.
4.4. Cautionary Note on Data Augmentation Strategies
While data augmentation techniques offer significant benefits in enhancing prediction accuracy, it is crucial to exercise caution in their implementation. The effectiveness of data augmentation is contingent upon various factors, including the selection of appropriate augmentation techniques, the tuning of hyperparameters, and the characteristics of the dataset itself. The improper selection or application of augmentation techniques can lead to unintended consequences, such as model overfitting or degradation in predictive performance. Therefore, a thorough understanding of the underlying principles of data augmentation, coupled with careful experimentation and validation, is necessary to ensure the robustness and reliability of predictive models in real-world applications. Additionally, ongoing research and exploration are needed to further refine and optimize data augmentation methodologies, thereby maximizing their potential benefits while mitigating potential risks and challenges. Also, DA should be of interest in the context of genomic prediction for classification, but here it was not explored.
5. Conclusions
The application of data augmentation, particularly utilizing the mixup method, significantly enhanced prediction accuracies, particularly for top-performing lines, across diverse maize and soybean datasets. However, its effectiveness varied depending on the subset of data under consideration. While it notably improved prediction performance for the top lines within the testing set, there was a discernible decrease in performance for the entire testing set overall. This limitation stemmed from the augmentation technique’s primary focus on enhancing prediction accuracy exclusively for the top lines. Notably, employing augmented data exclusively from the top 20% of lines in the training set consistently bolstered the predictive performance for these top lines in the testing set, maintaining the same subset size. This targeted approach effectively aimed at enhancing model generalization and performance within a specific segment of the data. Therefore, while data augmentation proves to be a valuable tool for augmenting predictive capabilities, a comprehensive understanding of its impact on different data subsets and evaluation metrics is essential for its effective implementation in the genomic-assisted plant breeding process. It is crucial to recognize that augmentation may not uniformly enhance prediction performance across all data subsets.
Author Contributions
Conceptualization, O.A.M.-L., A.M.-L. and J.C.; formal analysis, O.A.M.-L., A.M.-L., A.S., G.I.H.P., J.S.-R. and A.E.O.R.; investigation, O.A.M.-L., A.M.-L., J.C., A.S., G.I.H.P., J.S.-R. and A.E.O.R.; resources, K.A.; data curation, O.A.M.-L. and A.M.-L.; writing—original draft preparation, O.A.M.-L., A.M.-L. and J.C.; writing—review and editing, A.A. and R.O. All authors have read and agreed to the published version of the manuscript.
Funding
Open Access fees were received from the Bill & Melinda Gates Foundation. We acknowledge the financial support provided by the Bill & Melinda Gates Foundation (INV-003439 BMGF/FCDO Accelerating Genetic Gains in Maize and Wheat for Improved Livelihoods (AGG)) as well as the USAID projects (Amend. No. 9 MTO 069033, USAID-CIMMYT Wheat/AGGMW, Genes 2023, 14, 927 14 of 18 AGG-Maize Supplementary Project, AGG (Stress Tolerant Maize for Africa)) which generated the CIMMYT data analyzed in this study.
Data Availability Statement
The datasets used and/or analyzed during the current study are available from the first author on reasonable request.
Conflicts of Interest
The authors declare no conflicts of interest. The funders had no role in the design of the study; in the collection, analyses, or interpretation of the data; in the writing of the manuscript; or in the decision to publish the results.
References
- Bernardo, R.; Yu, J. Prospects for genome-wide selection for quantitative traits in maize. Crop Sci. 2007, 47, 1082–1090. [Google Scholar] [CrossRef]
- Desta, Z.A.; Ortiz, R. Genomic selection: Genome-wide prediction in plant improvement. Trends Plant Sci. 2014, 19, 592–601. [Google Scholar] [CrossRef] [PubMed]
- Riedelsheimer, C.; Czedik-Eysenberg, A.; Grieder, C.; Lisec, J.; Technow, F.; Sulpice, R.; Altmann, T.; Stitt, M.; Willmitzer, L.; Melchinger, A.E. Genomic and metabolic prediction of complex heterotic traits in hybrid maize. Nat. Genet. 2012, 44, 217–220. [Google Scholar] [CrossRef] [PubMed]
- Millet, E.J.; Kruijer, W.; Coupel-Ledru, A.; Alvarez-Prado, S.; Cabrera-Bosquet, L.; Lacube, S.; Charcosset, A.; Welcker, C.; Van-Eeuwijk, F.; Tardieu, F. Genomic prediction of maize yield across European environmental conditions. Nat. Genet. 2019, 51, 952–956. [Google Scholar] [CrossRef]
- Jannink, J.L.; Lorenz, A.J.; Iwata, H. Genomic selection in plant breeding: From theory to practice. Brief. Funct. Genom. 2010, 9, 166–177. [Google Scholar] [CrossRef]
- Zhang, X.; Pérez-Rodríguez, P.; Semagn, K.; Beyene, Y.; Babu, R.; López-Cruz, M.A.; San Vicente, F.; Olsen, M.; Buckler, E.; Jannink, J.L.; et al. Genomic prediction in biparental tropical maize populations in water-stressed and well-watered environments using low-density and GBS SNPs. Heredity 2015, 114, 291–299. [Google Scholar] [CrossRef] [PubMed]
- Spindel, J.; Iwata, H. Genomic selection in rice breeding. In Rice Genomics, Genetics and Breeding; Springer: Singapore, 2018; pp. 473–496. [Google Scholar]
- Heffner, E.L.; Sorrells, M.E.; Jannink, J.L. Genomic selection for crop improvement. Crop Sci. 2009, 49, 1–12. [Google Scholar] [CrossRef]
- VanRaden, P.M. Efficient methods to compute genomic predictions. J. Dairy Sci. 2008, 91, 4414–4423. [Google Scholar] [CrossRef] [PubMed]
- Crossa, J.; Pérez-Rodríguez, P.; Cuevas, J.; Montesinos-López, O.; Jarquín, D.; de los Campos, G.; Burgueño, J.; González-Camacho, J.M.; Pérez-Elizalde, S.; Beyene, Y.; et al. Genomic selection in plant breeding: Methods, models, and perspectives. Trends Plant Sci. 2017, 22, 961–975. [Google Scholar] [CrossRef] [PubMed]
- Montesinos-López, O.A.; Herr, A.W.; Crossa, J.; Carter, A.H. Genomics combined with UAS data enhances prediction of grain yield in winter wheat. Front. Genet. 2023, 14, 1124218. [Google Scholar] [CrossRef] [PubMed]
- Onogi, A.; Ideta, O.; Inoshita, Y.; Ebana, K.; Yoshioka, T.; Yamasaki, M.; Iwata, H. Exploring the areas of applicability of whole-genome prediction methods for Asian rice (Oryza sativa L.). Theor. Appl. Genet. 2015, 128, 41–53. [Google Scholar] [CrossRef] [PubMed]
- Taylor, L.; Nitschke, G. Improving deep learning with generic data augmentation. In IEEE Symposium Series on Computational Intelligence (SSCI); IEEE: New York, NY, USA, 2018; pp. 1542–1547. [Google Scholar]
- Shorten, C.; Khoshgoftaar, T.M. A survey on image data augmentation for deep learning. J. Big Data 2019, 6, 60. [Google Scholar] [CrossRef]
- Enkvetchakul, P.; Surinta, O. Effective data augmentation and training techniques for improving deep learning in plant leaf disease recognition. Appl. Sci. Eng. Prog. 2022, 15, 3810. [Google Scholar] [CrossRef]
- Chergui, N. Durum wheat yield forecasting using machine learning. Artif. Intell. Agric. 2022, 6, 156–166. [Google Scholar] [CrossRef]
- R Core Team. R: A Language and Environment for Statistical Computing; R Foundation for Statistical Computing: Vienna, Austria, 2023. [Google Scholar]
- Pérez, P.; de los Campos, G. Genome-Wide Regression and Prediction with the BGLR Statistical Package. Genetics 2014, 198, 483–495. [Google Scholar] [CrossRef] [PubMed]
- Zhang, H.; Cisse, M.; Dauphin, Y.N.; Lopez-Paz, D. Mixup: Beyond Empirical Risk Minimization. In Proceedings of the International Conference on Learning Representations, Vancouver, BC, Canada, 30 April–3 May 2018; pp. 1–13. [Google Scholar]
- Liang, W.; Tadesse, G.A.; Ho, D.; Fei-Fei, L.; Zaharia, M.; Zhang, C.; Zou, J. Advances, challenges and opportunities in creating data for trustworthy AI. Nat. Mach. Intell. 2022, 4, 669–677. [Google Scholar] [CrossRef]
- Woo, S.; Debnath, S.; Hu, R.; Chen, X.; Liu, Z.; Kweon, I.S.; Xie, S. Convnext v2: Co-designing and scaling convnets with masked autoencoders. In Proceedings of the IEEE/CVF Conference on Computer Vision and Pattern Recognition, Vancouver, BC, Canada, 17–24 June 2023; pp. 16133–16142. [Google Scholar]
- Zhu, L.; Wang, X.; Ke, Z.; Zhang, W.; Lau, R.W. Biformer: Vision transformer with bi-level routing attention. In Proceedings of the IEEE/CVF Conference on Computer Vision and Pattern Recognition, Vancouver, BC, Canada, 17–24 June 2023; pp. 10323–10333. [Google Scholar]
- Li, Y.; Fan, H.; Hu, R.; Feichtenhofer, C.; He, K. Scaling language-image pre-training via masking. In Proceedings of the IEEE/CVF Conference on Computer Vision and Pattern Recognition, Vancouver, BC, Canada, 17–24 June 2023; pp. 23390–23400. [Google Scholar]
- Montesinos-López, O.A.; Montesinos-López, A.; Crossa, J. Multivariate Statistical Machine Learning Methods for Genomic Prediction; Springer International Publishing: Cham, Switzerland, 2022; ISBN 978-3-030-89010-0. [Google Scholar]
- Sungil, K.; Kim, H. A new metric of absolute percentage error for intermittent demand forecasts. Int. J. Forecast. 2016, 32, 669–679. [Google Scholar]
- Zimmermann, S.; Klusmann, D.; Hampe, W. Correcting the predictive validity of a selection test for the effect of indirect range restriction. BMC Med. Educ. 2017, 17, 246. [Google Scholar] [CrossRef] [PubMed]

Disclaimer/Publisher’s Note: The statements, opinions and data contained in all publications are solely those of the individual author(s) and contributor(s) and not of MDPI and/or the editor(s). MDPI and/or the editor(s) disclaim responsibility for any injury to people or property resulting from any ideas, methods, instructions or products referred to in the content. |
© 2024 by the authors. Licensee MDPI, Basel, Switzerland. This article is an open access article distributed under the terms and conditions of the Creative Commons Attribution (CC BY) license (https://creativecommons.org/licenses/by/4.0/).