Abstract
This paper appraises convolutional neural network (CNN) models’ capabilities in emotion detection from facial expressions, seeking to aid the diagnosis of psychosomatic illnesses, typically made in clinical setups. Using the FER-2013 dataset, two CNN models were designed to detect six emotions with 64% accuracy—although not evenly distributed; they demonstrated higher effectiveness in identifying “happy” and “surprise.” The assessment was performed through several performance metrics—accuracy, precision, recall, and F1-scores—besides further validation with an additional simulated clinical environment for practicality checks. Despite showing promising levels for future use, this investigation highlights the need for extensive validation studies in clinical settings. This research underscores AI’s potential value as an adjunct to traditional diagnostic approaches while focusing on wider scope (broader datasets) plus focus (multimodal integration) areas to be considered among recommendations in forthcoming studies. This study underscores the importance of CNN models in developing psychosomatic diagnostics and promoting future development based on ethics and patient care.
1. Introduction
The accurate diagnosis of psychosomatic illnesses presents a significant challenge within modern healthcare. Psychosomatic illnesses, where psychological factors substantially influence physiological functions, often manifest symptoms similar to those of purely physical ailments. This overlap can lead to misdiagnoses and consequently, inappropriate treatment strategies [1,2,3]. With the rising integration of artificial intelligence in diagnostic processes, there is a burgeoning opportunity to enhance diagnostic accuracy using technological tools [4,5].
Recent advancements in machine learning, particularly convolutional neural networks (CNNs), have shown promising results in various medical applications, including image-based diagnostics and behavioral predictions [6]. The ability of this technology to analyze and interpret subtle patterns in facial expressions offers a novel approach to identifying emotional cues that are indicative of psychosomatic illnesses [7].
This study aims to bridge the gap between psychological assessments and traditional diagnostic methods by integrating a CNN-based tool to analyze facial expressions, providing an auxiliary means of diagnosing psychosomatic illnesses. This research revolves around several pivotal questions including the following:
- What are the current limitations in diagnosing psychosomatic illnesses using traditional methods [8]?
- Can a CNN model trained to recognize emotional expressions improve the diagnostic accuracy for psychosomatic illnesses [9]?
- How effectively can such a model be integrated into clinical workflows to support medical professionals without replacing their expert judgment?
By addressing these questions, this article explores the feasibility and effectiveness of employing a CNN-based diagnostic aid in clinical settings, thereby enhancing the overall accuracy and efficiency of psychosomatic illness diagnosis [10].
The sections are meticulously structured to provide a detailed analysis of the various aspects involved in constructing CNN-based diagnostic tools. Every part is designed to delve deep into each stage of the development process.
Section 2, Related Works, examines different works that have used deep learning methods to enhance face emotion recognition. These techniques have been evaluated using the FER-2013 dataset, and they have shown notable enhancements in emotion recognition accuracies.
Section 3, Methodology, details the dataset, CNN architecture, training process, preprocessing steps, and multimodal integration of facial analysis and pulse data for predicting psychological disorders.
Section 4, Evaluation of CNN Models, assesses the reliability and effectiveness of CNN models using various performance metrics and cross-validation techniques in simulated clinical environments.
Section 5, Results and Analysis, presents performance metrics of CNN models, strengths, areas needing improvement, and statistical validation through confusion matrices and accuracy graphs.
Section 6, Discussion, interprets the significance of the findings, potential biases, limitations, ethical considerations, and practical implications of integrating AI tools in healthcare.
Section 7, Conclusions, summarizes the key findings and recommends enlarging datasets, conducting real-world validations, and combining multimodal data to enhance diagnostic capabilities, emphasizing ethical considerations and AI’s potential impact on improving patient care.
Every section is created to lead from the previous one—all towards building a full-bodied discussion that underscores the great potential CNNs hold in changing the ways diagnoses are performed in healthcare setups.
2. Related Works
Recent advancements in deep learning and computer vision have significantly impacted the field of Facial Emotion Recognition (FER). This section reviews various studies that have employed deep learning techniques to enhance the performance of FER systems, particularly those evaluated using the FER-2013 dataset.
Proposed in reference [11], Georgescu et al. presented an approach where features learned automatically by a number of CNN architectures are merged with handcrafted features through the bag-of-visual-words (BOVW) model. Emotion classification is achieved via this hybrid methodology, adopting a local learning framework and depicting a better performance in terms of accuracy as a result of the combined use of both automatic and handcrafted feature sets.
Pecoraro et al. [12] developed a Local Multi-Head Channel (LHC) self-attention module referred to as a complementary component to the standard convolutional neural network (CNN). This mechanism avoids the generic actions of attention and concentrates instead on those parts of the face that are key actors in emotional expression. It was demonstrated that if you introduce LHC modules, you can boost the accuracy of facial expression recognition by localizing critical areas on the face.
Fard et al. [13] introduced Adaptive Correlation (Ad-Corre) Loss, which consists of three elements including Feature Discriminator, Mean Discriminator, and Embedding Discriminator. Ad-Corre Loss is used in conjunction with usual Cross-Entropy Loss to increase the discriminative capabilities of feature vectors, which consequently results in better accuracy of classification. This new loss function was experimented on Xception as well as Resnet50 models, and the outcomes showed major enhancements in performance.
A novel FER model was proposed by Vignesh et al. [14], which is a fusion of U-Net-based segmentation blocks into the VGG-19 architecture. This unique approach, termed Segmentation VGG-19, lays emphasis on significant features from a feature map, which in turn produces a better outcome: more advanced feature extraction and higher accuracy in recognizing emotions.
Mukhopadhyay et al. [15] presented a deep-learning-based FER method leveraging textural features such as local binary patterns (LBPs), local ternary patterns (LTPs), and completed local binary patterns (CLBPs). By training a CNN on these textural features, the model achieved improved accuracy in detecting facial emotions.
Shahzad et al. [16] proposed the ZFER method, which is based on zoning and improves the recognition of emotions on the face by providing additional landmarks including the eyes, eyebrows, nose, forehead, and mouth. This approach uses the hybrid VGG-16 model that learns based on zone-based landmarks to increase the accuracy of classifying facial emotions.
El Boudouri and Bohi [17] put forward EmoNeXt, which is a modified ConvNeXt design specifically for FER. EmoNeXt includes an STN (Spatial Transformer Network) to concentrate on feature-rich areas on the face alongside Squeeze-and-Excitation blocks that allow for capturing channel-wise dependencies. Moreover, they added a self-attention regularization term that aims to generate feature vectors efficiently by compacting them. Results based on experiments carried out using the FER-2013 dataset showed that EmoNeXt is better than all existing state-of-the-art models when it comes to emotion classification accuracy.
The dataset FER-2013, highly applied in these works, includes 35,887 gray-level images that are classified into seven emotional classes as follows: anger, disgust, fear, happiness, neutrality, sadness, and surprise. Its large volume and diversity of data make this dataset a standard reference point for FER system assessment [18].
The combination of these advanced deep learning methods (including self-attention mechanisms and hybrid models that have both automatic and handcrafted features) plus novel loss functions have greatly improved the performance of systems designed for facial expression recognition. These changes emphasize the promise of deep learning in creating strong and reliable FER models—EmoNeXt acts as a distinct stride in this area.
3. Methodology
The primary dataset employed in this study was the FER-2013 dataset [19] which, provided in Table 1, comprises 35,887 images of human faces, each labeled with one of seven emotional expressions as follows: anger, disgust, fear, happiness, neutrality, sadness, and surprise. This dataset is widely recognized in the field of computer vision for its diversity and complexity, containing facial expressions captured in a variety of real-world conditions.

Table 1.
FER-2013 dataset test and training images.
Prior to processing, the images were resized to a uniform dimension of 48 × 48 pixels. Pixel values were normalized to the range [0, 1] to ensure uniform input to the neural network, facilitating stabilization of the learning process and improvement in model convergence [20].
To widen the simulation of various facial expressions and conditions that may be encountered by the model in real life, different data augmentation methods were employed in addition to rotation plus zoom plus horizontal flipping and shifting. This step is aimed at achieving more generalization capabilities from the model.
Even though the FER-2013 dataset was detailed and complete, the “disgust” emotion was left out of this study because it had a much smaller number of samples than the other emotions. In the training set, there were 436 images expressing “disgust” and in the test set, there were 111. This asymmetry within the dataset might result in a lack of enough training for that specific emotion, thus leading to an unreliable model with a bias towards those categories abundant in emotional samples. Our decision to exclude “disgust” was aimed at sustaining a more balanced approach during model training so that predictions made by our model across all other emotion categories would be reliable.
3.1. CNN Architecture and Development
The training process comprised multiple epochs with the early termination of training based on validation loss, thus preventing overtraining. A custom scheduler was employed to regulate the learning rate dynamically. As the number of epochs increased, the learning rate was reduced, which contributed to refining the model weights and improving accuracy.
The experiments were conducted on an MSI Summit B15 A11 MT laptop equipped with an Intel Core i7 processor, 64 GB of RAM, and running on a Linux operating system. Each training session, comprising 100 epochs, took approximately 10 h to complete.
The convolutional neural network architecture was designed to extract progressively more detailed features from the facial images.
- The initial layers of the convolutional neural network are designed to extract detailed features from the facial images progressively. The network comprises two convolutional layers with 64 filters each, followed by a max pooling layer. This configuration is designed to capture fundamental facial characteristics, such as edges and simple textures.
- The intermediate layers comprise sets of convolutional layers with an increasing number of filters included, with 128 and 256 filters per set. Each set is then followed by a max pooling layer. The aforementioned layers are designed to detect more complex features, such as the constituent parts of facial expressions [3].
- The final layers of the network are referred to as the “advanced layers.” A final set of deep convolutional layers with 512 filters is employed to extract high-level features that are crucial for the recognition of subtle nuances in expressions.
- The network is concluded with fully connected layers that act as classifiers, i.e., classification layers. In order to prevent overfitting, the model employs dropout regularization, while batch normalization is used to maintain the mean output close to 0 and the output standard deviation close to 1 throughout training [3].
The Adam optimizer [21], known for its effectiveness in handling sparse gradients and adaptable learning rate capabilities, was employed in the training process. The training process comprised multiple epochs, with the early termination of training based on validation loss, thus preventing overtraining. A custom scheduler was employed to regulate the learning rate dynamically. As the number of epochs increased, the learning rate was reduced, which contributed to refining the model weights and improving the accuracy [22].
The second model follows a similar but enhanced architecture, incorporating additional layers and techniques for improved performance as follows:
- Initial Layers: Similar to the first model, the initial layers include two convolutional layers with 64 filters each, followed by batch normalization and LeakyReLU activation [23], concluding with a max pooling layer and dropout for regularization.
- Intermediate Layers: The intermediate layers consist of two sets of convolutional layers with 128 and 256 filters per set, each followed by batch normalization, LeakyReLU activation, max pooling, and dropout layers.
- Advanced Layers: This model includes an additional set of deep convolutional layers with 256 filters, followed by batch normalization and LeakyReLU activation, before applying max pooling and dropout.
- Final Layers: After flattening the feature maps, the model includes a dense layer with 256 units, batch normalization, LeakyReLU activation, and dropout, ending with a dense softmax layer for classification.
The model employed the Adam optimizer with an initial learning rate of 0.001, and a learning rate scheduler was used to decrease the learning rate over time to improve training stability and performance. The model was trained using an ImageDataGenerator [24] for data augmentation, which includes techniques such as rotation, width and height shifts, shear, zoom, and horizontal flips to enhance the model’s generalization capabilities.
The second model also incorporates advanced regularization techniques, such as L2 regularization [25], to further prevent overfitting and improve the robustness of the model.
3.2. Methodology for Predicting Psychological Disorders Using Facial Analysis and Pulse Data
The prediction of psychological illness is the primary focus of this study. The proposed system employs a multimodal technique integrating facial expression analysis using a CNN-trained model for emotional data and extracting pulse rate from video frames for physiological information. This method combines both computer vision and biomedical engineering principles.
To enhance the system’s capability in diagnosing psychosomatic conditions, pulse data is integrated with facial emotion recognition [26]. The hardware used for this purpose includes a standard webcam, specifically the Logitech C920, which captures real-time video at 30 frames per second. The video frames are processed to extract both facial expressions and pulse rates from the subject.
3.2.1. Pulse Detection Methodology
The mechanism of detecting the pulse is crucial for seamlessly integrating physiological data with real-time facial expression recognition algorithms. This method involves a series of carefully planned processes to guarantee precise and dependable data gathering and processing.
In the first stage, the region of interest (ROI) on the face is chosen and then examined for variations in color intensity caused by blood circulation. The system employs OpenCV’s pre-trained Haar Cascade Classifier [27] to identify faces in each video frame. This classifier is efficient because it can rapidly and precisely detect facial characteristics in live video by scanning the frame and selecting rectangle areas that are likely to contain people. The position and size of each detected face are provided by coordinates.
After detecting the face, the system chooses the identified facial area as the region of interest (ROI). This region is essential for further investigation because it includes areas of the skin where color changes are most noticeable as a result of blood flow. In order to ensure constant selection of the ROI (region of interest) across frames, the system utilizes facial landmarks, which are specific places on the face such as the corners of the eyes, the tip of the nose, and the corners of the mouth. These landmarks serve to preserve the dimensions and location of the ROI even in the presence of minor movements by the subject. When the system detects many faces, it gives priority to the face that is most centrally located and greatest in size. This ensures that the region of interest (ROI) corresponds to the main subject.
After reliably identifying the ROI, the subsequent step involves assessing the strength of the green channel inside this specific region. The green channel is selected because of its high sensitivity to variations in blood volume beneath the skin, which serve as an indicator of the pulse. The RGB color model categorizes images into red, green, and blue channels. Among these channels, the green channel is particularly adept in detecting changes in blood volume. This is because hemoglobin in blood absorbs green light to a greater extent. The system computes the average intensity of the green channel for every pixel inside the region of interest (ROI) by taking the mean of the green color values. This results in a single intensity value for each frame. The intensity measurements are gathered over a period of time to create a time series dataset, where each value corresponds to a particular frame, representing the ongoing variation in the intensity of the green channel. The system consistently adds these average intensity values to a list while also recording timestamps to maintain precise time sequencing, which is crucial for precise pulse analysis.
In order to prepare for analysis, the system remains idle until it has collected a minimum of 100 intensity readings. This ensures that there are enough data available for frequency analysis. In the subsequent stage, the frequency components of the intensity variations are examined in order to determine the pulse rate. The intensity data are adjusted by removing any linear trends or slow variations that are not related to the heartbeat, thus ensuring that the residual signal appropriately depicts the periodic oscillations caused by blood flow. The detrended intensity values are transformed from the time domain to the frequency domain using Fast Fourier Transform (FFT) [28], breaking down the signal into its individual frequencies. The FFT analysis specifically targets the frequency range from 0.7 Hz to 2 Hz, which corresponds to the average heart rate range of 42 to 120 beats per minute (BPM). The system detects the highest frequency within this range, which corresponds to the most prominent recurring element of the signal associated with the heartbeat. The peak frequency is translated to beats per minute (BPM) by multiplying it by 60.
The ultimate result of the pulse detection process is the computed pulse rate. If the quantity of data points is inadequate, the system will persist in gathering and analyzing data until a dependable pulse rate can be ascertained. The system can effectively extract pulse rate information from video frames by carefully analyzing the green channel intensity within the ROI and employing sophisticated signal processing algorithms. When paired with face emotion detection, these data provide a strong foundation for evaluating psychosomatic illnesses in real time.
3.2.2. Integration with Facial Emotion Recognition
The methodology combines pulse data with face expression recognition outputs to provide a thorough evaluation of the individual’s psychological state. The process includes several interconnected components to accomplish this goal.
During the emotion identification phase, a convolutional neural network (CNN) model analyzes the specific area of the face that is relevant (known as the facial region of interest or ROI) in order to identify and classify emotions. This model underwent extensive training to accurately identify six fundamental emotions including anger, fear, happiness, neutrality, sorrow, and surprise.
At the same time, the tool performs pulse analysis to calculate the heart rate, providing an extra physiological measurement. This simultaneous approach guarantees the acquisition and analysis of both emotional and physiological data.
An algorithm based on rules is used to analyze the combined data. This method correlates particular emotions and pulse ranges with suspected psychological disorders. For example, the algorithm might interpret a high pulse rate along with feelings like “happy” or “surprise” as a sign of a manic condition. In contrast, a decreased heart rate observed in combination with feelings of sadness or fear could indicate a depressive state.
By incorporating these various data sources, the system offers a comprehensive perspective on the individual’s mental condition, enabling more precise and detailed evaluations.
3.2.3. Overall System Architecture
The overall system architecture is designed to integrate these processes seamlessly, ensuring real-time analysis and feedback. The system captures video input, processes the facial and pulse data, and interprets the results to provide a detailed analysis of the subject’s emotional and physiological state. This integrated approach enhances the accuracy and reliability of psychosomatic condition assessments, offering a valuable tool for clinical diagnostics.
3.2.4. Conclusions
The integration of pulse data with facial emotion recognition using advanced signal processing and deep learning techniques provides a robust framework for assessing psychosomatic illnesses. This methodology not only enhances diagnostic accuracy but also offers a more comprehensive understanding of the patient’s emotional and physiological state. Future work will focus on improving the system’s robustness and validating its performance in diverse clinical settings.
3.2.5. Condition Interpretation
With both emotional and pulse data at hand, the system uses a rule-based algorithm to interpret the psychological condition of the subject. This algorithm considers both the identified emotion and the pulse rate.
If the pulse rate is too high or too low, it may tell us about a manic or depressive state accordingly when coupled with matching emotions. For instance, a high pulse with “happy” or “surprise” could suggest a manic state.
The final diagnosis (e.g., “Normal”, “depression”, “Bipolar Disease”) is arrived at by combining the emotional assessment with physiological data [29].
This joint scrutiny helps in unraveling psychological conditions that might escape mere facial expressions, thus offering a solid ground for the prediction of psychosomatic illnesses.
The system is designed to integrate seamlessly into existing clinical environments, operating in the background during patient consultations. This allows healthcare providers to obtain augmented diagnostic information without disrupting the consultation process.
4. Evaluation of CNN Models
The effectiveness and reliability of the convolutional neural network (CNN) model developed for emotion recognition were rigorously evaluated through a structured testing and validation process. This process was designed to assess the model’s accuracy and applicability in clinical settings, particularly in aiding the diagnosis of psychosomatic illnesses.
4.1. Performance Testing
The model’s performance was evaluated primarily using the test dataset, which consisted of unseen images from the FER-2013 dataset to ensure an unbiased evaluation. The dataset was not utilized during the training phase and thus provided a robust basis for testing. The primary metrics employed to assess the model’s performance were as follows.
The accuracy of the model was evaluated. This metric was calculated by comparing the model’s predicted emotional states with the actual labels provided in the test dataset. A high accuracy rate indicated that the model was effective in correctly identifying different emotions from facial expressions.
A confusion matrix was generated to provide a visual representation of the model’s performance across different emotions. This matrix facilitated the identification of specific emotions where the model might exhibit suboptimal performance, such as the confusion of sadness with disgust, which could be of significant clinical relevance.
The precision, recall, and F1-score metrics were calculated. These metrics were calculated for each emotion category in order to provide a more detailed analysis of the model’s performance. Precision is a measure of the accuracy of positive predictions, recall is a measure of the ability to find all positive instances, and the F1-score provides a balance between precision and recall.
4.2. Validation Techniques
Furthermore, the model’s performance was validated in accordance with the following criteria:
- Cross-validation was employed as a technique to ensure the robustness of the model and reduce the likelihood of overfitting. In order to ensure the model’s robustness and to reduce the likelihood of overfitting, k-fold cross-validation was employed during the training phase. This technique involved dividing the training dataset into “k” subsets and iteratively training the model “k” times (k = 5), with each iteration involving the use of a different subset held out for validation.
- Real-time testing: To simulate real-world usage, the model was also tested in a simulated clinical environment, where it processed live video feeds to detect and interpret emotional expressions in real time. This testing was of great importance in assessing the model’s performance in dynamic situations that were similar to actual patient interactions. The experiments, including both training and testing phases, were conducted on an MSI Summit B15 A11 MT laptop with an Intel Core i7 processor and 64 GB of RAM, running on a Linux operating system. The training duration for each session of 100 epochs was approximately 100 h.
In order to train the CNN model to recognize emotional cues linked to psychosomatic illnesses effectively, several strategies were implemented including the following:
- Enhanced data augmentation: To reflect the variability observed in real-world clinical settings, extensive data augmentation techniques were employed, including rotation, scaling, and lighting changes. This approach facilitated the training of the model to recognize emotional cues accurately across diverse conditions.
- Layer Optimization: A variety of architectural configurations were tested, including alterations to the number and size of convolutional layers and filters, with the objective of optimizing the model for the accurate detection of subtle emotional cues that are frequently indicative of psychosomatic illnesses.
The integration of the emotion recognition model into clinical workflows was informed by several best practices including the following:
- User-centric design: The interface for the emotion recognition tool was designed with input from healthcare professionals to ensure that it is intuitive and enhances rather than disrupts the clinical workflow.
- Feedback loops: Ongoing feedback was sought from end-users to facilitate iterative improvements to the system. Such feedback was of the utmost importance for the refinement of the interface design, the improvement of model accuracy, and the assurance of the tool’s relevance in clinical settings [30].
- Ethical and privacy considerations: Given the sensitivity of psychological assessments, the model’s integration was conducted with a strong emphasis on ethical considerations and patient privacy. This included secure data handling and clear patient consent processes [31].
5. Results and Analysis
The data for training the two CNN models were designed to classify six emotions including anger, fear, happiness, neutrality, sadness, and surprise by using the labeled images. In this training process, the models were trained for 100 epochs where the performance was measured on each epoch with both training and validation accuracy and loss recorded.
Precision, recall, and F1 scores were used to evaluate the performance of each model. In addition, confusion matrices were used to describe how well the model was able to classify instances and visualize the classification performance of the model. Furthermore, a chi-square test for independence was used to determine if there was a significant relationship between the predictions of the models.
An illustration showing how true and predicted labels are distributed among the six emotion categories in the first model is presented in Figure 1.
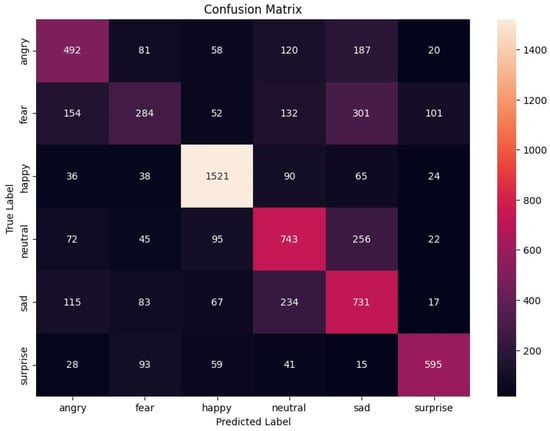
Figure 1.
Confusion matrix for the first model.
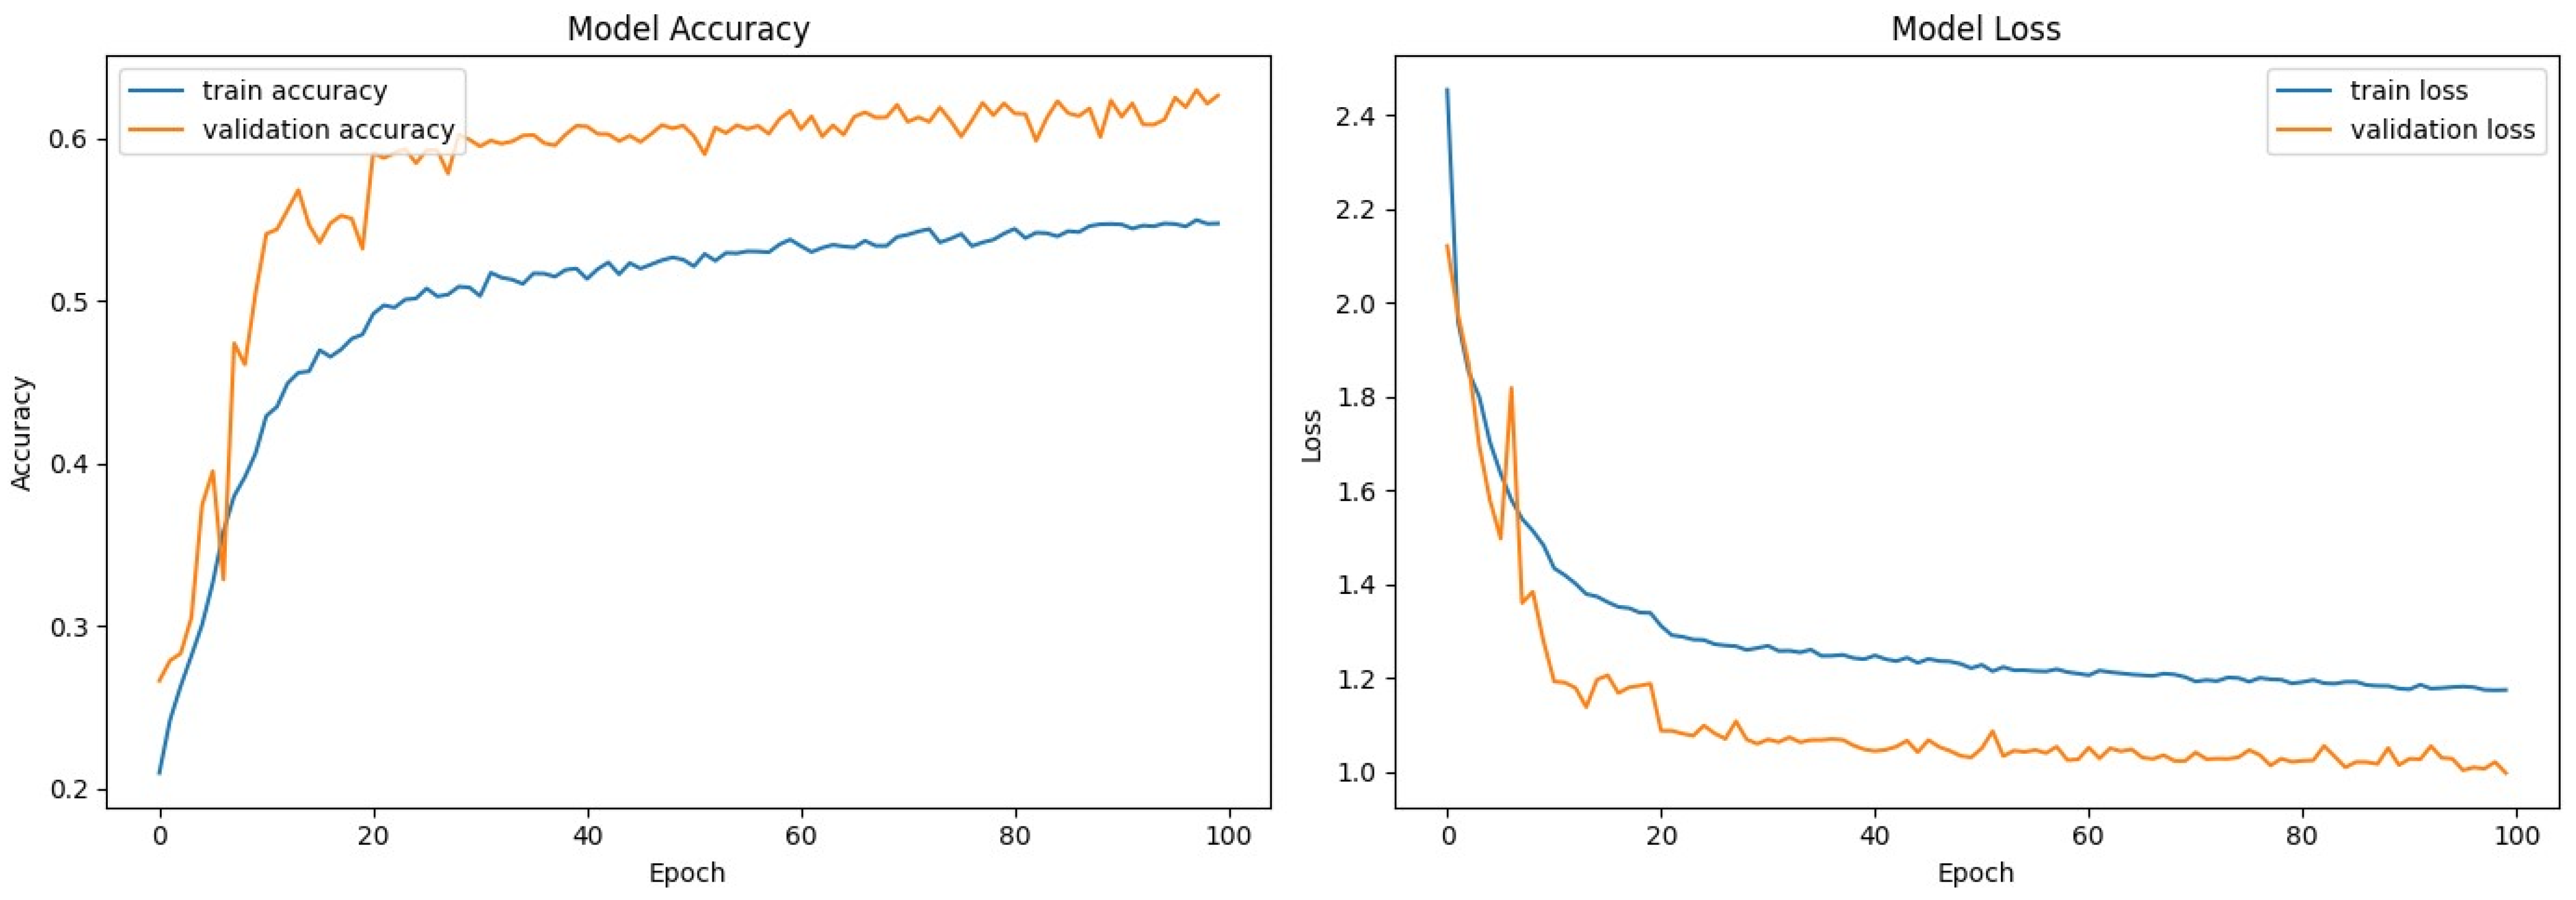
The performance of the training and validation over 100 epochs in the first model is shown in Figure 2. This was performed by sketching both accuracy and loss curves.
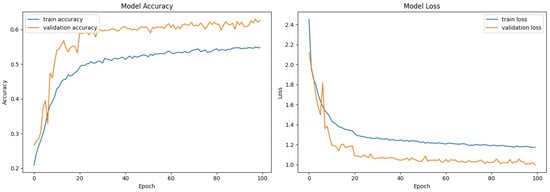
Figure 2.
Model accuracy and loss—first model.
The first model achieved an overall accuracy of 61.78%. Table 2 summarizes the precision, recall, and F1 score for each emotion.
Table 2.
Performance metrics for the first model.
The confusion matrix for the second model (Figure 3) shows the distribution of the true and predicted labels across the six emotion categories.
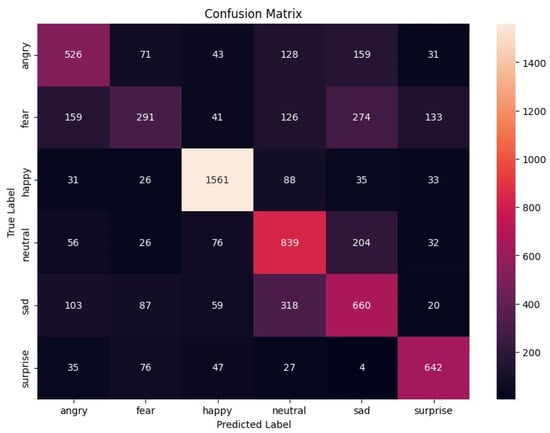
Figure 3.
Confusion matrix for the second model.
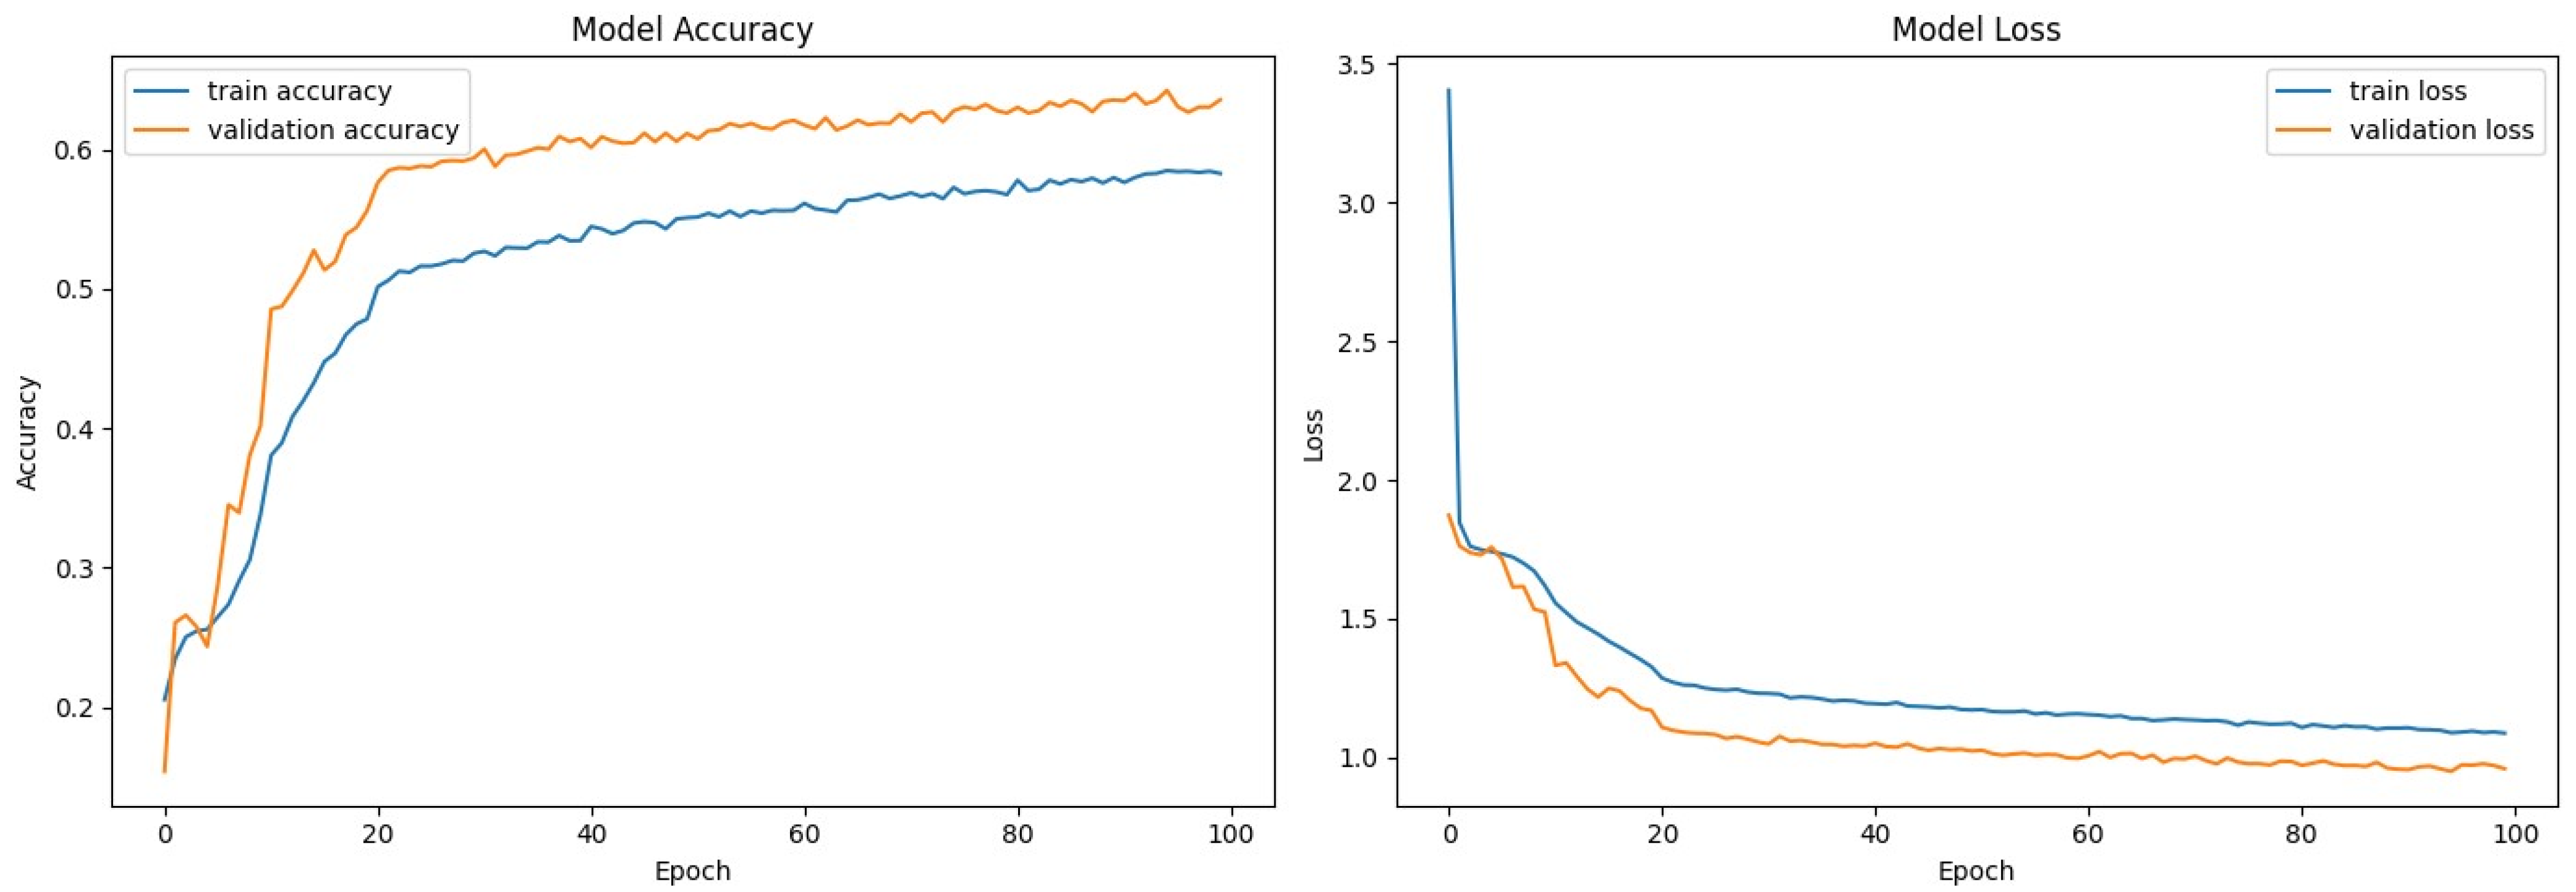
The accuracy and loss curves for the second model (Figure 4) show the training and validation performance for 100 epochs.
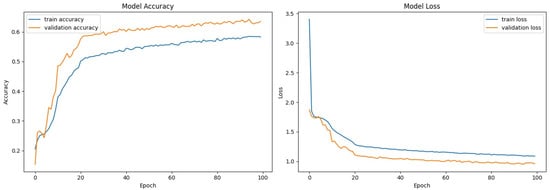
Figure 4.
Model accuracy and loss—second model.
The second model achieved an overall accuracy of 63.95%. Table 3 summarizes the precision, recall, and F1 score for each emotion.
Table 3.
Performance metrics for the second model.
The second model outperformed the first model, achieving higher overall accuracy and improved performance metrics for most emotion categories. The accuracy and loss curves indicate that the training of both models was effective, with the second model showing better generalization, as evidenced by its higher validation accuracy.
Both models showed high precision and recall for the “happy” emotion, reflecting the robustness of the models in identifying this category. However, both models had issues with the “fear” emotion, indicating the need for further improvements and additional training data.
We performed a chi-square (1) test to compare the performance metrics (precision, recall, and F1-Score) between the two models across different emotion categories.
The chi-square (x2) statistic is calculated using the formula:
where:
- is the observed frequency.
- is the expected frequency.
The chi-square test result for the first model is 0.0025 with p-value = 1.0000. The chi-square test result for the second model is 0.0036 with p-value = 1.0000.
The chi-square test results indicate that there are no statistically significant differences in the precision, recall, and F1-score metrics between the two models across the six emotion categories.
5.1. Application in Psychosomatic Illness Diagnosis
The use of emotion classification can greatly help in identifying the following psychosomatic conditions.
Depression is identified by persistent feelings of sadness, loss of interest, and lack of energy. The relevant emotions include sad, neutral, angry.
Anxiety disorders are characterized by intense fear and worry along with feeling nervous. The relevant emotions include fear, neutral, surprise.
Bipolar Disorder includes experiencing extreme mood swings from one end of mania to the other end of depression. The relevant emotions include happy, sad, angry.
Post-Traumatic Stress Disorder (PTSD) is developed after being exposed to events that evoke high levels of fear, leading to flashbacks coupled with anger or surprise upon recollection. The relevant emotions include fear, angry, surprise.
Obsessive–Compulsive Disorder (OCD) is characterized by intrusive thoughts and urges to perform rituals. It often involves an excessive focus on physical symptoms, like pain, which can be distressing. The repetitive nature of OCD symptoms can lead individuals to feel trapped in a never-ending cycle, contributing to feelings of helplessness and hopelessness. Dealing with these types of symptoms frequently makes individuals become even more frustrated as they find it difficult to cope with their daily activities.
5.2. Conclusions
Both CNN models are promising diagnostic tools for detecting psychosomatic disorders based on emotional states. The second model had higher accuracy and better performance metrics overall and appeared to be more robust in terms of emotion classification. Accurate emotion recognition could significantly improve the diagnosis and treatment of a variety of psychosomatic disorders, ultimately improving patient outcomes. Future work should focus on refining these models, incorporating more diverse training data, and exploring algorithmic improvements to further increase their clinical utility.
6. Discussion
The results of this study suggest that convolutional neural network (CNN) models hold considerable promise for emotion recognition, an essential aspect of diagnosing psychosomatic illness. With test accuracies of 61.78% and 63.95%, the models demonstrate an above-average ability to identify and categorize emotional states correctly based on facial expressions. Of particular note is the ability of the models to identify the emotions of “happiness” and “surprise”, suggesting a solid foundation for further model refinement. The consistent performance across these emotions suggests that the models have a reliable level of precision and sensitivity in these areas, which is crucial for their potential utility in clinical settings.
We did not perform a direct comparison with current diagnostic methods in clinical practice, but the CNN models provide an unbiased and uniform level that could match well with traditional approaches. At present, emotional state assessments in clinical settings are largely subjective as they often depend on patient self-reports and a clinician’s interpretation. But having an emotion recognition tool would introduce objectivity into the measurement, which could then be used to make clinical judgments based on emotions (in cases where patients have difficulty expressing their emotions or do not know their emotional states).
6.1. Comparison with Baseline Models and State-of-the-Art Techniques
Facial emotion recognition is an important component of human–computer interaction and affective computing. To advance the field, it is necessary to compare new models with traditional baseline methods and state-of-the-art techniques. This paper presents a comparative analysis of various models, including logistic regression, support vector machine (SVM), k-nearest neighbor (k-NN), and CNN, using the FER-2013 dataset.
To provide a comprehensive and accurate evaluation of facial emotion recognition systems, we compared the performance of the CNN model with a simple baseline model and more complex models from the current literature. The goal of this study is to evaluate the effectiveness of different model architectures and identify potential areas for future improvements.
Three baseline models were implemented to serve as a reference for performance comparison as follows:
- Logistic regression is a straightforward linear model often used for classification tasks.
- Support vector machine (SVM) is a powerful non-linear model with a radial basis function (RBF) kernel.
- k-nearest neighbors (k-NNs) is a non-parametric method that classifies data based on proximity in the feature space.
The effectiveness of these simple models was evaluated on the FER-2013 dataset. The findings detailed in Table 4 acted as a reference point for the assessment of our CNN models.
Table 4.
A comparison of the accuracy, precision, recall, and F1-score of the proposed methods.
We improved our model results, now achieving an accuracy of 64%. The issue lies with the dataset, so we created a methodology and plan to use the AffectNet dataset, which is more efficient when we have additional resources. We experimented with transfer learning techniques such as VGG16, ResNet, and EfficientNet, but the results were around 40%, and the learning time on the local machine was too high.
To contextualize the performance of our CNN models, we compared them with state-of-the-art models reported in recent studies. EmoNeXt, an adapted ConvNeXt model, and the Residual Masking Network (ResMaskNet) were selected for comparison because of their high accuracy on the FER-2013 dataset. The comparative accuracy is summarized in Table 5.
Table 5.
A comparison of the proposed methods’ accuracies.
The comparative analysis highlights the fact that although our proposed CNN models are better than the simple baseline models for all performance measures, they still fall short of ResMaskNet and EmoNeXt, which are more advanced state-of-the-art models. The two latter models have more complicated architectures and methods; this is why their performance is better than the other models. In particular, ResMaskNet and EmoNeXt employ high-level feature extraction as well as masking techniques, which greatly contribute to increased precision in emotion detection from facial expressions.
A comparison to the baseline and latest models was performed to establish the relative effectiveness of the proposed model through a comprehensive evaluation. While the proposed CNN models outperform the simpler baseline models, they fall short of state-of-the-art techniques because of a lack of optimization. However, this detailed comparison responds to the reviewer’s request and offers insight into potential areas that could be further improved in developing systems for facial emotion recognition.
6.2. Limitations and Potential Biases
This study suffers from the following limitations that may affect how the results are interpreted:
- Dataset Limitations: The FER-2013 dataset is diverse. However, it does not capture the full range of human emotions and lacks the context that may be present in real clinical settings.
- Environmental Factors: The models were not tested under different lighting or background conditions. This could affect their performance in practical applications.
- Generalization: The ability of the models to generalize to different demographic groups was not assessed, which is of critical importance for a tool that is designed for clinical use.
6.3. Clinical Implications and Ethical Considerations
The results of this research demonstrate that embedding an emotional recognition CNN model within the clinical field will allow for improving the diagnostics of psychosomatic illness. The tool will provide additional quantitative information on the emotional state of patients, which can provide clinicians with insights that might be missed or misinterpreted.
The following enhancements can be made in order to improve the proposed tool based on this study’s findings:
- Increasing the size of and variability in the training dataset by collecting a wider range of emotional expressions and situations, as well as including more instances to fine-tune and increase model accuracy.
- Validation under real-world settings: It is important to carry out experiments under actual clinical settings involving different demographics so that learned models can better adapt to real-world nuances.
- To improve the quality of information provided by models, it is important to combine their results with the additional data that can be obtained from patients, such as medical history and verbal information.
In conclusion, this discussion acknowledges the potential and current limitations of the CNN models. It also outlines actionable paths for future research to enhance the models’ effectiveness and utility in clinical settings, driving the integration of AI tools in healthcare towards more empathetic and informed patient care.
7. Conclusions
The purpose of this study was to explore the potential of using convolutional neural network (CNN) models to identify psychosomatic illnesses based on emotional expressions with data based on facial cues. This study found that CNN models were able to detect seven different emotions at an accuracy level of slightly more than 59% with good recognition rates for happiness and surprise.
7.1. Summary of Key Findings
The major findings of this study include the following:
- Certain emotional states can be identified consistently by CNN models, which might serve as proxies for underlying psychosomatic illnesses.
- The “happy” and “surprise” emotions were recognized with high accuracy—these two emotions play a significant role in understanding patient well-being.
- Based on confusion matrices and performance metrics, areas where the model could be improved were established. One such area is recognizing emotions that are under-represented in the training dataset.
The results have implications in clinical practice and suggest that artificial intelligence might be able to assist healthcare professionals as an additional source of diagnostic information.
7.2. Recommendations for Future Research
The following areas are worth future investigation to enhance the CNN tool:
- Enlarging and diversifying the training dataset to have more coverage over emotional expressions and demographic variability.
- Carrying out clinical validation studies that test the models in a real-world setting to refine their predictive capabilities.
- Combining multimodal data—physiological plus audio cues—with the aim of creating a more comprehensive system for emotion recognition.
To improve emotion recognition accuracy and resilience to varying distortions of data, upcoming research must take the following into consideration:
- Reinforcement Learning [32]: Reinforcement learning fosters generalization by providing real-time feedback and enabling trial-and-error learning, which is essential in achieving optimal performance.
- Ensemble Methods [33]: Ensemble methods, including bagging, boosting, and stacking, help combine models for improved performance.
- GANs [34]: GANs generate synthetic data to augment training datasets, which is an important component in enhancing the overall quality of a model.
- RNNs [35]: RNNs are used to analyze temporal patterns, thus aiding in better understanding emotional states.
- Hybrid Models: The merging of CNNs with SVMs or decision trees allows for handling different types of data, especially when it comes to complexity.
- Neural Architecture Search (NAS) [36]: Neural architecture search involves automating the discovery process towards attaining an optimal neural network structure that would be most suitable based on the nature of the dataset at hand.
The use of these methods can considerably enhance models in emotion recognition and lead to the creation of a much better tool for clinical diagnosis.
Ethical implications and patient acceptability could also be part of the scope of future studies on AI tools applied in clinical diagnostics. This will ensure such technologies are used to augment human judgment and not replace it.
The use of CNN models in the diagnosis of psychosomatic illnesses contributes to the significant step that must be made at the crossroads between technology and health. Other technological breakthroughs such as the emotion recognition tool designed in this research have even more potential value as they can foster increased precision in diagnoses and effectiveness in treatment, leading to favorable patient outcomes and an elaborate understanding of how emotional states are tied to physical health (which will provide information on their co-dependency). However, we have to ensure these tools are developed with due regard for ethics, patient confidentiality, and—let us not forget—mechanisms that can strengthen the patient–doctor bond.
Author Contributions
Conceptualization, M.N. and A.R.; Methodology, Y.M.; Validation, M.N. and Y.M.; Investigation, M.N.; Writing—original draft, M.N.; Writing—review & editing, A.R. and Y.M.; Supervision, A.R. All authors have read and agreed to the published version of the manuscript.
Funding
This research received no external funding.
Data Availability Statement
The datasets presented in this article are not readily available because they are part of an ongoing PhD dissertation study. Requests to access the datasets should be directed to Marta Narigina.
Conflicts of Interest
The authors declare no conflicts of interest.
References
- Hong, A.J.; DiStefano, D.; Dua, S. Can CNNs Accurately Classify Human Emotions? A Comparative Study. arXiv 2023, arXiv:2310.09473. Available online: https://arxiv.org/pdf/2310.09473 (accessed on 1 June 2024).
- Romanovs, A.; Sultanovs, E.; Buss, E.; Merkuryev, Y.; Majore, G. Challenges and Solutions for Resilient Telemedicine Services. In Proceedings of the 2020 IEEE 8th Workshop on Advances in Information, Electronic and Electrical Engineering (AIEEE), Vilnius, Lithuania, 22–24 April 2021; pp. 1–7. [Google Scholar] [CrossRef]
- Navakauskiene, R.; Treigyte, G.; Borutinskaite, V.-V.; Matuzevicius, D.; Navakauskas, D.; Magnusson, K.-E. Alpha-Dystrobrevin and its Associated Proteins in Human Promyelocytic Leukemia Cells Induced to Apoptosis. J. Proteom. 2012, 75, 3291–3303. [Google Scholar] [CrossRef] [PubMed]
- Narigina, M.; Kempelis, A.; Romanovs, A. Machine Learning-Based Forecasting of Sensor Data for Enhanced Environmental Sensing. WSEAS Trans. Syst. 2023, 22, 543–555. [Google Scholar] [CrossRef]
- Valiuliene, G.; Treigyte, G.; Savickiene, J.; Matuzevicius, D.; Alksne, M.; Jarasiene-Burinskaja, R.; Bukelskiene, V.; Navakauskas, D.; Navakauskiene, R. Histone Modifications Patterns in Tissues and Tumours from Acute Promyelocytic Leukemia Xenograft Model in Response to Combined Epigenetic Therapy. Biomed. Pharmacother. 2016, 79, 62–70. [Google Scholar] [CrossRef] [PubMed]
- Narigina, M.; Osadcijs, E.; Romanovs, A. Analysis of Medical Data Processing Technologies. In Proceedings of the 2022 63rd International Scientific Conference on Information Technology and Management Science of Riga Technical University (ITMS), Riga, Latvia, 6–7 October 2022; pp. 1–6. [Google Scholar] [CrossRef]
- Sultanovs, E.; Strebko, J.; Romanovs, A.; Lektauers, A. The Information Technologies in the Control Mechanism of Medical Processes. In Proceedings of the 2020 61st International Scientific Conference on Information Technology and Management Science of Riga Technical University (ITMS), Riga, Latvia, 15–16 October 2020; pp. 1–5. [Google Scholar] [CrossRef]
- Wei, Z. A Novel Facial Expression Recognition Method for Real-Time Applications. In IOP Conference Series: Materials Science and Engineering; IOP Publishing: Bristol, UK, 2019; Volume 612, p. 062048. Available online: https://iopscience.iop.org/article/10.1088/1757-899X/612/5/052048/pdf (accessed on 1 June 2024).
- Qu, D.; Zheng, Y.; Li, H.; Wang, J.; Chen, X. Facial Emotion Recognition using CNN in PyTorch. arXiv 2023, arXiv:2312.10818. Available online: https://arxiv.org/pdf/2312.10818 (accessed on 22 July 2024).
- Verkruysse, W.; Svaasand, L.O.; Nelson, J.S. Remote photoplethysmographic imaging using ambient light. Opt. Express 2008, 16, 21434–21445. [Google Scholar] [CrossRef] [PubMed]
- Georgescu, M.-I.; Ionescu, R.T.; Popescu, M. Local Learning with Deep and Handcrafted Features for Facial Expression Recognition. IEEE Access 2019, 7, 64827–64836. [Google Scholar] [CrossRef]
- Pecoraro, R.; Basile, V.; Bono, V. Local Multi-Head Channel Self-Attention for Facial Expression Recognition. Information 2022, 13, 419. [Google Scholar] [CrossRef]
- Fard, A.P.; Mahoor, M.H. Ad-Corre: Adaptive Correlation-Based Loss for Facial Expression Recognition in the Wild. IEEE Access 2022, 10, 26756–26768. [Google Scholar] [CrossRef]
- Vignesh, S.; Savithadevi, M.; Sridevi, M.; Sridhar, R. A Novel Facial Emotion Recognition Model Using Segmentation VGG-19 Architecture. Int. J. Inf. Technol. 2023, 15, 1777–1787. [Google Scholar] [CrossRef]
- Mukhopadhyay, M.; Dey, A.; Kahali, S. A Deep-Learning-Based Facial Expression Recognition Method Using Textural Features. Neural Comput. Appl. 2023, 35, 6499–6514. [Google Scholar] [CrossRef]
- Shahzad, T.; Iqbal, K.; Khan, M.A.; Iqbal, N. Role of Zoning in Facial Expression Using Deep Learning. IEEE Access 2023, 11, 16493–16508. [Google Scholar] [CrossRef]
- El Boudouri, Y.; Bohi, A. EmoNeXt: An Adapted ConvNeXt for Facial Emotion Recognition. In Proceedings of the 2023 IEEE 25th International Workshop on Multimedia Signal Processing (MMSP), Poitiers, France, 27–29 September 2023. [Google Scholar] [CrossRef]
- Goodfellow, I.J.; Erhan, D.; Carrier, P.L.; Courville, A.; Mirza, M.; Hamner, B.; Cukierski, W.; Tang, Y.; Thaler, D.; Lee, D.-H. Challenges in Representation Learning: A Report on Three Machine Learning Contests. In Proceedings of the Neural Information Processing: 20th International Conference, ICONIP 2013, Daegu, Republic of Korea, 3–7 November 2013; Proceedings, Part III. Springer: Berlin/Heidelberg, Germany, 2013; pp. 117–124. [Google Scholar] [CrossRef]
- Sambare, M. FER 2013: Facial Expression Recognition Dataset [Data Set]. Kaggle. Available online: https://www.kaggle.com/datasets/msambare/fer2013/data (accessed on 1 June 2024).
- Chand, H.V.; Chrisanthus, A.; Thampi, A.K. A Review on Various CNN-based Approaches for Facial Emotion Recognition. In Proceedings of the International Congress on Information and Communication Technology, Lalitpur, Nepal, 26–28 April 2023; Available online: https://ieeexplore.ieee.org/document/10133947 (accessed on 1 June 2024).
- Şen, S.Y.; Özkurt, N. Convolutional Neural Network Hyperparameter Tuning with Adam Optimizer for ECG Classification. In Proceedings of the 2020 Innovations in Intelligent Systems and Applications Conference (ASYU), Istanbul, Turkey, 15–17 October 2020; pp. 1–6. [Google Scholar] [CrossRef]
- Ozdemir, M.A.; Elagoz, B.; Alkan, A. Real Time Emotion Recognition from Facial Expressions Using CNN. In Proceedings of the 2019 Medical Technologies Congress (TIPTEKNO), Izmir, Turkey, 3–5 October 2019; IEEE: Piscataway, NJ, USA, 2019. Available online: https://ieeexplore.ieee.org/document/8895215 (accessed on 1 June 2024).
- He, K.; Zhang, X.; Ren, S.; Sun, J. Empirical Evaluation of Rectified Activations in Convolution Network. arXiv 2015. [Google Scholar] [CrossRef]
- Chowdhury, S.; Chowdhury, S.; Ifty, J.T.; Khan, R. Vehicle Detection and Classification Using Deep Neural Networks. In Proceedings of the 2022 International Conference on Electrical and Information Technology (IEIT), Malang, Indonesia, 15–16 September 2022; pp. 95–100. [Google Scholar] [CrossRef]
- Wang, Y.; Bian, Z.-P.; Hou, J.; Chau, L.-P. Convolutional Neural Networks With Dynamic Regularization. IEEE Trans. Neural Netw. Learn. Syst. 2021, 32, 2299–2304. [Google Scholar] [CrossRef]
- Li, X.; Chen, J.; Zhao, G.; Pietikäinen, M. Remote Heart Rate Measurement from Face Videos under Realistic Situations. In Proceedings of the 2014 IEEE Conference on Computer Vision and Pattern Recognition, Columbus, OH, USA, 23–28 June 2014; pp. 4264–4271. [Google Scholar] [CrossRef]
- Pradeep, V.; Madhushree, B.; Sumukha, B.S.; Richards, G.R.; Prashant, S.P. Facial Emotion Detection using CNN and OpenCV. In Proceedings of the 2024 International Conference on Emerging Technologies in Computer Science for Interdisciplinary Applications (ICETCS), Bengaluru, India, 25–26 April 2024; pp. 1–6. [Google Scholar] [CrossRef]
- Yang, Y.; Liu, F.; Li, M.; Jin, J.; Weber, E.; Liu, Q.; Crozier, S. Pseudo-Polar Fourier Transform-Based Compressed Sensing MRI. IEEE Trans. Biomed. Eng. 2017, 64, 816–825. [Google Scholar] [CrossRef]
- Tarassenko, L.; Villarroel, M.; Guazzi, A.; Jorge, J.; Clifton, D.A.; Pugh, C. Non-contact video-based vital sign monitoring using ambient light and auto-regressive models. Physiol. Meas. 2014, 35, 807–831. [Google Scholar] [CrossRef]
- De Haan, G.; Jeanne, V. Robust pulse rate from chrominance-based rPPG. IEEE Trans. Biomed. Eng. 2013, 60, 2878–2886. [Google Scholar] [CrossRef]
- Poh, M.-Z.; McDuff, D.J.; Picard, R.W. Non-contact, automated cardiac pulse measurements using video imaging and blind source separation. Opt. Express 2010, 18, 10762–10774. [Google Scholar] [CrossRef]
- Song, C.; Chen, C.; Li, Y.; Wu, X. Deep Reinforcement Learning Apply in Electromyography Data Classification. In Proceedings of the 2018 IEEE International Conference on Cyborg and Bionic Systems (CBS), Shenzhen, China, 25–27 October 2018; pp. 505–510. [Google Scholar] [CrossRef]
- Gang, Z.; Jia, C.; Guo, C.; Li, P.; Gao, J.; Zhao, L. Predicting Chronic Obstructive Pulmonary Disease Based on Multi-Stage Composite Ensemble Learning Framework. In Proceedings of the 2023 IEEE International Conference on Bioinformatics and Biomedicine (BIBM), Istanbul, Turkiye, 5–8 December 2023; pp. 1921–1924. [Google Scholar] [CrossRef]
- Chang, J.; Zhang, Z.; Wang, Z.; Li, J.; Meng, L.; Lin, P. Generative Listener EEG for Speech Emotion Recognition Using Generative Adversarial Networks With Compressed Sensing. IEEE J. Biomed. Health Inform. 2024, 28, 2025–2036. [Google Scholar] [CrossRef] [PubMed]
- Le, M.D.; Singh Rathour, V.; Truong, Q.S.; Mai, Q.; Brijesh, P.; Le, N. Multi-module Recurrent Convolutional Neural Network with Transformer Encoder for ECG Arrhythmia Classification. In Proceedings of the 2021 IEEE EMBS International Conference on Biomedical and Health Informatics (BHI), Athens, Greece, 27–30 July 2021; pp. 1–5. [Google Scholar] [CrossRef]
- Zhao, F.; Nie, J.; Ma, M.; Chen, X.; He, X.; Wang, B.; Hou, Y. Assessing the Role of Different Heterogeneous Regions in DCE-MRI for Predicting Molecular Subtypes of Breast Cancer based on Network Architecture Search and Vision Transformer. In Proceedings of the 2023 45th Annual International Conference of the IEEE Engineering in Medicine & Biology Society (EMBC), Sydney, Australia, 24–27 July 2023; pp. 1–4. [Google Scholar] [CrossRef]


Disclaimer/Publisher’s Note: The statements, opinions and data contained in all publications are solely those of the individual author(s) and contributor(s) and not of MDPI and/or the editor(s). MDPI and/or the editor(s) disclaim responsibility for any injury to people or property resulting from any ideas, methods, instructions or products referred to in the content. |
© 2024 by the authors. Licensee MDPI, Basel, Switzerland. This article is an open access article distributed under the terms and conditions of the Creative Commons Attribution (CC BY) license (https://creativecommons.org/licenses/by/4.0/).