Article

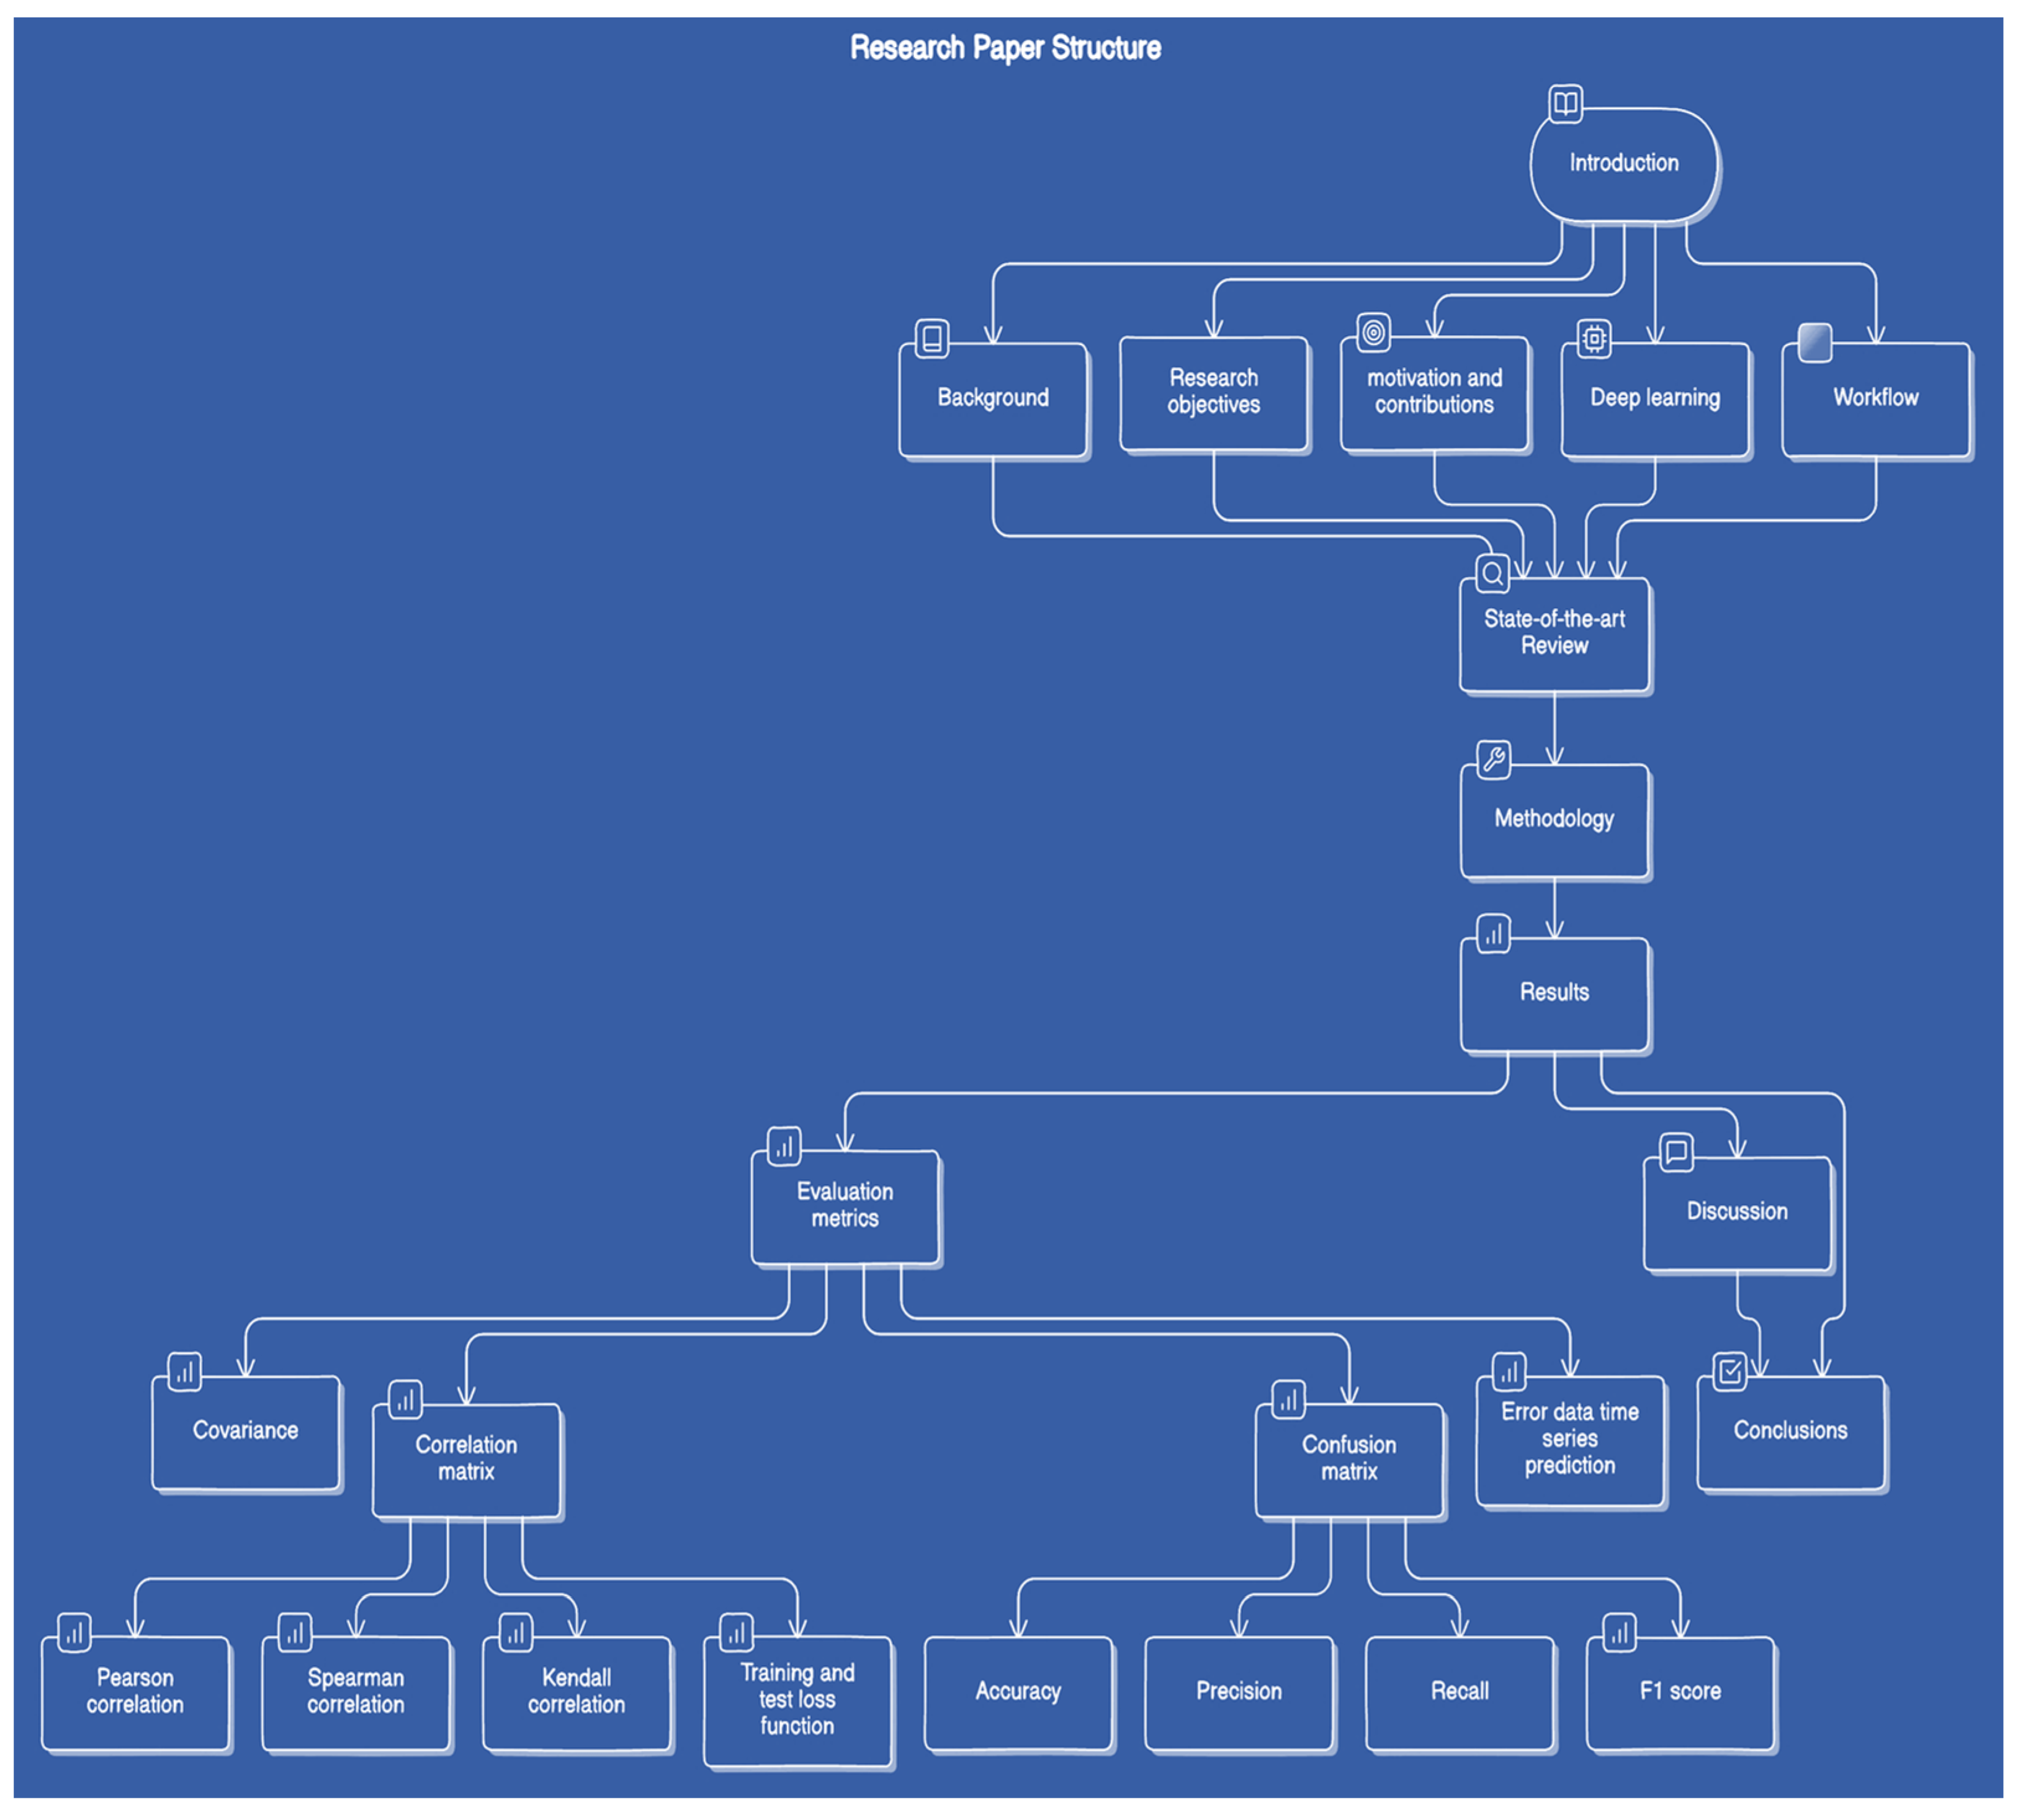
Deep Learning-Based Boolean, Time Series, Error Detection, and Predictive Analysis in Container Crane Operations

School of Science, Technology, Engineering and Mathematics (STEM), Munster Technological University (MTU), Kerry Campus, V92 HD4V Kerry, Ireland
*
Author to whom correspondence should be addressed.
Algorithms 2024, 17(8), 333; https://doi.org/10.3390/a17080333
Submission received: 16 June 2024 / Revised: 20 July 2024 / Accepted: 24 July 2024 / Published: 1 August 2024

Abstract

:
Deep learning is crucial in marine logistics and container crane error detection, diagnosis, and prediction. A novel deep learning technique using Long Short-Term Memory (LSTM) detected and anticipated errors in a system with imbalanced data. The LSTM model was trained on real operational error data from container cranes. The custom algorithm employs the Synthetic Minority Oversampling TEchnique (SMOTE) to balance the imbalanced data for operational data errors (i.e., too few minority class samples). Python was used to program. Pearson, Spearman, and Kendall correlation matrices and covariance matrices are presented. The model’s training and validation loss is shown, and the remaining data are predicted. The test set (30% of actual data) and forecasted data had RMSEs of 0.065. A heatmap of a confusion matrix was created using Matplotlib and Seaborn. Additionally, the error outputs for the time series for the next n seconds were projected, with the n seconds input by the user. Accuracy was 0.996, precision was 1.00, recall was 0.500, and f1 score was 0.667, according to the evaluation criteria that were produced. Experiments demonstrated that the technique is capable of identifying critical elements. Thus, future attempts will improve the model’s structure to forecast industrial big data errors. However, the advantage is that it can handle imbalanced data, which is usually what most industries have. With additional data, the model can be further improved.

1. Introduction

1.1. Background

The container shipping market is a USD 116.04 billion market in 2024 and is expected to grow to a size of USD 134.03 Billion by 2029 [1]. As the global trade volume escalates, the imperatives for heightened productivity and operational efficacy within port facilities intensify concomitantly. Alongside these demands, ensuring the safety and reliability of container crane operations remain paramount [2]. Container cranes play a pivotal role in modern maritime logistics, facilitating the efficient movement of goods between ships and shores in container terminals worldwide [3]. The towering gantry cranes are indispensable in loading and unloading containers from ships and moving them within the terminal yard.
Container cranes, which operate along the quayside, use complex technology such as spreader beams to transfer containers between ships and terminals, contributing to overall port efficiency. This operation entails precisely arranging the crane to match with various bays on the ship, allowing access to containers located along the vessel’s length. Furthermore, in addition to vessel operations, container cranes may be used to stack containers within the terminal yard, allowing for interim storage or onward transportation [4]. The cranes generate enormous amounts of data that can be analysed, and valuable insights can be obtained for efficient, better, and faster decision-making by industries.
Recently, growing research has focused on data-driven fault diagnostic methods, particularly those based on neural networks. This is due to advancements in sensor technology and increased data storage capacity, which have enhanced the data processing capabilities of neural network-based methods. Failure to identify process flaws can have detrimental effects on productivity, safety, quality of output, and economy of the process. Efficient and advanced automated diagnostic equipment is crucial in modern enterprises to detect, diagnose, and repair abnormal process behaviours. The primary goal of fault detection and isolation is to promptly alert operators to potential issues, enabling them to take necessary measures to avert system failure following the occurrence of problems [5].
Timely error detection and prediction are crucial in optimising crane performance and ensuring safety within container crane operations.
The importance of timely error detection can be understood through several vital perspectives:
  • Optimisation of Productivity and Efficiency: Timely error detection and prevention optimise crane performance and operational efficiency. By identifying and addressing errors promptly, operators can minimise the impact on productivity and throughput, ensuring that cranes operate at maximum capacity and efficiency [6]. This can be achieved by predicting errors early so that they do not turn into faults and result in failures. This performance optimisation contributes to container terminal operations’ overall productivity and profitability.
  • Prevention of Operational Disruptions: Timely error detection allows for the early identification of potential issues or malfunctions in crane operations [7]. By promptly identifying errors, operators can take corrective actions to prevent operational disruptions, such as crane breakdowns or delays in cargo handling. This proactive approach helps to maintain the smooth flow of operations within container terminals, minimising downtime and ensuring the efficient utilisation of resources [8].
  • Enhancement of Safety Protocols: Early detection of errors enables operators to implement safety protocols and procedures to mitigate risks and hazards associated with crane operations. By promptly addressing errors, operators can prevent accidents, injuries, and damage to cargo or infrastructure, safeguarding personnel’s well-being and preserving the integrity of terminal facilities [9].
  • Reduction of Maintenance Costs: Detecting, diagnosing, and predicting errors early can help reduce maintenance costs associated with crane operations. By identifying potential errors before the said errors escalate into significant failures, operators can implement preventive and prescriptive maintenance measures to address underlying issues and prolong the lifespan of equipment [10]. This proactive maintenance approach helps to minimise downtime, repair costs, and operational disruptions, ultimately leading to cost savings for terminal operators [11].
  • Compliance with Regulatory Standards: Timely error detection ensures compliance with regulatory standards and industry regulations governing crane operations. By promptly identifying and addressing errors, operators can maintain adherence to safety guidelines and operational protocols mandated by regulatory authorities. This compliance not only ensures the safety of personnel and assets but also helps to avoid potential fines and legal liabilities associated with non-compliance [12,13].
In summary, timely error identification and prediction are essential in optimising crane performance, ensuring safety in container crane operations, and benefiting stakeholders across the maritime supply chain.

1.2. Research Objectives, Motivation, and Contributions

One critical aspect of safeguarding safety, efficiency, and reliability in container terminal operations is detecting and mitigating errors that may occur during crane operations. Errors in quay container crane operations can have significant implications, ranging from potential damage to cargo and infrastructure to disruptions in supply chain logistics. Moreover, human error, equipment malfunction, and environmental contingencies contribute to the complexity of error detection and pose challenges to ensuring uninterrupted operations [14]. System failures can be prevented by identifying and anticipating errors, resulting in a more robust and durable system. Error prediction in container crane operations involves using data analysis, machine learning, and deep learning methodologies to predict prospective errors or anomalies that may occur during the operation of container cranes [6].
This research aims to develop proactive strategies for error detection and prediction by harnessing the power of deep learning, data analytics, and predictive modelling, thereby enhancing container terminal operations’ safety, efficiency, and reliability. Addressing this problem requires a comprehensive understanding of container terminals’ operational dynamics and the application of advanced AI technologies and methodologies for error detection, diagnosis, and prediction [15].
By analysing diverse data sources, including crane sensor data, past operation logs, weather conditions, and other pertinent aspects, predictive models can be created to foresee and minimise problems in advance. Implementing this proactive strategy enhances safety, effectiveness, and overall efficiency in container terminal operations.
Research findings in this domain have significant implications for the maritime industry, port authorities, terminal operators, and other stakeholders involved in container terminal operations. The objective is to enhance operational safety, minimise downtime, optimise resource utilisation, and improve overall terminal performance by effectively detecting and mitigating errors in operational data. The scope of this paper lies in exploring how deep learning can enhance error detection, prediction, and time series analysis in container crane operations, which is currently a critical need in the maritime industry and will help to enhance operational efficiency and safety.
The potential of this research extends beyond container cranes to other industries with imbalanced data challenges—where rare events or anomalies occur can benefit significantly. Other industrial sectors can significantly benefit from this research, such as manufacturing, in identifying equipment failures or defects early in production lines; the energy sector, in predicting anomalies in power generation or distribution systems; and transportation, in detecting irregularities in vehicle performance or safety systems. Additionally, organisations can target interventions and preventive measures by identifying critical elements associated with errors.
For instance:
Maintenance: Prioritise maintenance schedules for components most likely to cause errors;
Process Optimisation: Adjust operational procedures based on error patterns;
Resource Allocation: To minimise disruptions, allocate resources (personnel, materials) strategically.
This research is motivated by the urgency of improving error recognition and prediction in container cranes in the multibillion-dollar container shipping industry, which is the backbone of the current worldwide economy. Traditional rule-based techniques frequently fail because they cannot manage complicated, dynamic settings and uneven data distributions. Deep learning, particularly LSTM networks, provides a viable solution to these shortcomings. By capturing temporal connections and learning from previous data, LSTMs can model complex patterns and increase accuracy.

1.3. Deep Learning Overview

Deep learning is a branch of artificial intelligence (AI) that involves training computer systems to perform tasks such as recognising patterns, making decisions, and solving problems without being explicitly programmed to do so. It uses algorithms known as neural networks, which are inspired by the structure and function of the human brain [16]. Data-driven machine health monitoring is becoming increasingly prevalent in modern production systems because low-cost sensors are widely deployed and connected to the internet. Deep learning offers valuable methods for processing and evaluating large-scale operational data [17]. Deep learning enables computers to recognise patterns, classify information, and make highly accurate predictions by learning from large amounts of data. Deep learning employs neural networks that consist of numerous layers, known as deep architectures, to acquire knowledge from input and generate predictions. This technology has applications in various fields, including image and speech recognition, natural language processing, autonomous vehicles and, in this case, the manufacturing industry.
Several key factors make the utilisation of deep learning paramount in error detection, diagnosis, and prediction in various industries, including quay container crane operations:
  • Deep learning algorithms, such as convolutional neural networks (CNNs) and recurrent neural networks (RNNs), have demonstrated exceptional capability in handling complex and high-dimensional data [18]. In container crane operations, where data streams from various sensors, control systems, and operational logs are abundant and diverse, deep learning models can effectively process these data to identify subtle patterns and anomalies indicative of errors.
  • Deep learning models excel in capturing temporal dependencies and dynamic relationships within sequential data [19]. In container crane operations, where crane movements, cargo handling processes, and environmental conditions evolve, deep learning algorithms can analyse historical data to predict future states, enabling proactive error detection and prevention [20].
  • The scalability and adaptability of deep learning models make them well-suited for real-time and offline monitoring and decision-making in dynamic operational environments. By continuously learning from new data and adapting to changing conditions, deep learning-based error detection systems can enhance operational safety, optimise resource utilisation, and mitigate potential risks in container crane operations [21,22].
Overall, the importance of utilising deep learning for error detection, diagnosis, and prediction in container crane operations lies in its ability to harness the power of advanced data analytics to enhance operational safety, efficiency, and resilience in maritime logistics. As technology advances, leveraging deep learning algorithms will become increasingly indispensable for ensuring container terminals’ seamless and secure operation in the global supply chain ecosystem.
By leveraging advanced deep learning techniques, the research aims to address the inherent complexities of error detection and prediction in container crane operations, where operational data are represented as discrete Boolean values over time. The proposed algorithm seeks to effectively capture temporal dependencies and subtle patterns within Boolean time series data, enabling accurate anticipation of potential errors before occurrence during crane operations. Through empirical validation and performance assessment, this paper endeavours to demonstrate the effectiveness and applicability of the proposed deep learning algorithm in enhancing operational safety, efficiency, and reliability within container terminal management.

1.4. Workflow

Subsequent sections of the workflow analysis will thoroughly examine the existing state-of-the-art by exploring the myriad facets of error detection in container crane operations. Furthermore, methodological approaches employed in addressing this challenge will be scrutinised alongside empirical findings gleaned from relevant studies. This comprehensive analysis will elucidate a nuanced understanding of error prediction within the context of container crane operations, shedding light on its implications and potential avenues for advancement within academic and research discourse.
The following section will inform about the methodology and data used in this research. It presents a novel, custom-built, Python-based algorithm that integrates SMOTE and LSTM techniques to address imbalanced data through custom preprocessing, analysis, and incorporation of evaluation metrics. The workflow structure is shown in Figure 1 below:

2. State-of-the-Art Review

As highlighted earlier, ensuring the safety and reliability of crane operations is of the utmost importance. Time series data from such heavy machinery operations pose unique challenges due to their large size and complex patterns. Promptly identifying operational errors can reduce accidents and downtime [23]. Machine learning and deep learning models have emerged as powerful tools for detecting anomalies in such data. Extensive literature exists on fault and failure detection in ML [24]. However, very little is available on error detection and prediction. It is crucial to detect and predict an error because an error is a precursor to faults and failure. Figure 2 below illustrates this correlation between error, defect, and failure.
A machine’s operational error signal detection refers to the process of identifying abnormal or unexpected signals in a machine’s operation. These signals can indicate the system’s or machine’s problems, malfunctions, or deviations from normal behaviour. This research used actual on-board and off-board STS crane databases from ports and cranes, such as warranty, alarms, and operational data where error signals generated by the crane PLC were available.
The significance of using deep learning for error detection in container crane operations lies in its ability to effectively capture complex patterns, temporal dependencies, and nonlinear relationships inherent in operational data. The vital points highlighting its significance are as follows:
  • Complexity of Operational Data: Container crane operations generate vast amounts of data, including sensor readings, crane movements, cargo handling, and environmental conditions. Deep learning algorithms, such as RNNs and CNNs, excel at processing high-dimensional and sequential data [18], making them well-suited to analysing the intricate dynamics of crane operations.
  • Temporal Dependencies: Crane operations exhibit temporal dependencies, where actions and events at one time step influence subsequent states and outcomes. RNNs, particularly LSTM networks, are designed to capture and learn from temporal dependencies in sequential data, enabling accurate modelling of the temporal evolution of crane operations and the detection of abnormal patterns or deviations [26,27].
  • Feature Learning: Deep learning models can automatically learn relevant features from raw data, eliminating the need for manual feature engineering. In the context of error detection in container crane operations, deep learning algorithms can extract informative features from sensor data, crane trajectories, and operational logs, enabling more effective detection of anomalies and deviations indicative of errors.
  • Adaptability to Complex Environments: container crane operations are subject to various environmental factors, such as wind, weather conditions, and sea states, which can influence crane performance and introduce uncertainties [28,29]. Deep learning models, with their capacity to learn from diverse and noisy data sources, exhibit robustness and adaptability to complex operating environments, enhancing the reliability and accuracy of error detection systems [22].
  • Scalability and Generalisation: Deep learning algorithms are inherently scalable and can handle large volumes of data, making them suitable for analysing the extensive datasets generated by container terminal operations. Moreover, deep learning models can generalise unseen data well, enabling effective error detection across different terminal configurations, crane types, and operating conditions [30].
  • Continuous Learning and Improvement: Deep learning models support continuous learning and improvement through iterative training on new data. As additional operational data become available, deep learning-based error detection systems can be updated and refined to adapt to evolving operational conditions, improving their effectiveness over time [16,31].
Several methods have been proposed for error detection in STS container crane operations. The authors of [32] introduced a new method for detecting crane rails’ wear, significantly improving accuracy, while [33] identified and assessed human errors among tower crane operators, focusing on the importance of monitoring the anti-collision system. The authors of [34] addressed the issue of detecting physical impacts to the corners of shipping containers during handling operations using the impacts detection methodology. It used the impacts detection methodology to detect recurrent quay crane impacts on the same container locations during hooking. These contemporaneous hits suggest false hooking, which could cause severe metal deformations over short durations. The study highlights the necessity of shipping container damage detection for port safety and efficiency. In [35], the authors developed a high-speed colour-based object detection algorithm for quayside crane operator assistance systems, significantly increasing the detection rate while maintaining high accuracy. These studies collectively highlight the importance of continuous improvement in error detection methods to enhance safety and efficiency in STS container crane operations. Several studies have demonstrated the efficacy of deep learning for error prediction in container crane operations. Timely error detection is essential in optimising crane performance and guaranteeing safety. Unnoticed errors or problems can compromise production and safety by causing inefficiencies, equipment damage, and possible accidents [36].
Human error is a significant contributing factor in accidents during mobile crane operations. Effective crane control and precise positioning depend on pre-established speeds for each direction, determined according to the crane system’s specifications. Detecting problems in speed, acceleration, or deceleration promptly can enhance performance and avoid overloading or crashes. Developing intelligent assistance systems that detect real-time errors can enhance crane operation safety by reducing the likelihood of human errors [37]. Proficient expertise is necessary for the safe operation of overhead cranes and to minimise the occurrence of equipment malfunctions. Nevertheless, the lack of skilled operators has been a worry recently. Early identification of errors, such as problems with rope tension or differences in load weight, can aid in the prevention of accidents and equipment damage, thereby enhancing safety without only depending on the operator’s skills [38].
Ensuring prompt identification of errors is essential in successfully implementing efficient automated crane trajectories and providing a user-friendly interface that assists operators in choosing and executing movements. Timely identification of errors in trajectory planning or execution can enhance performance and prevent accidents [36]. The manual planning process currently employed for crane lift path planning is arduous and error-prone, primarily due to construction sites’ dynamic and congested conditions. Implementing automated systems capable of real-time error or collision detection can enhance operational efficiency and precision [39].
The research on error prediction in STS container crane operations is diverse, covering various aspects of crane operations. The authors of [40] focused on the fatigue damage analysis of ageing steel structures, a critical factor in error prediction. The authors of [41] identified specific risk factors in stevedoring operations, which can inform error prediction strategies. In [42], the authors addressed the need for robust control systems in offshore container cranes, which can help mitigate errors. The authors of [43] highlighted the importance of structural health monitoring in error prediction, providing a potential method for early detection. Finally, [44] identified a decrease in the mean time between failures due to heavy operations, increased maintenance incidents, and man-hours. Key performance indicators were developed to assess ship-to-shore crane performance and provide insights for future improvements in container crane equipment operation. The findings suggest that the performance indicators can guide future inspections and improvements in container crane operations.
Promising progress is being made in using deep learning for fault identification and prediction in time series data. To tackle problems like noisy labelling, ensemble methods for fault identification [45], and innovative models like GRU-enhanced DCNN for better fault diagnosis in chemical processes [46], several strategies have been put forth. Furthermore, deep learning models for anomaly identification in spacecraft telemetry channels have been investigated, highlighting the necessity of automated methods for effectively monitoring system anomalies [47]. These studies demonstrate how deep learning methods, such as recurrent units and convolutional neural networks, can improve fault detection efficiency, generalisability, and accuracy in various industrial areas.
Deep learning has shown remarkable capabilities in analysing complex data patterns and making predictions. Deep neural networks (DNNs) excel in learning representations from large-scale data, enabling them to detect subtle signals indicative of impending errors in crane operations. Techniques such as RNNs and CNNs have been adapted to model sequential and spatial dependencies in crane sensor data, operation logs, and environmental factors. Key deep learning architectures that may be used for the Boolean time series data from the STS container cranes include the following [18,48,49,50]:
  • Recurrent Neural Networks (RNNs): RNNs are adept at handling sequential data, rendering them suitable for time-series analysis. RNNs can effectively capture temporal dependencies in crane operation data [51].
  • Long Short-Term Memory (LSTM): LSTM networks, a variant of RNNs, are designed to address the vanishing gradient problem. LSTMs are particularly adept at modelling long-term dependencies and have been successfully utilised to predict crane behaviour.
  • Gated Recurrent Unit (GRU): GRUs are another RNN variant that maintains memory while being computationally efficient. GRUs have shown promise in predicting input force values for crane control.
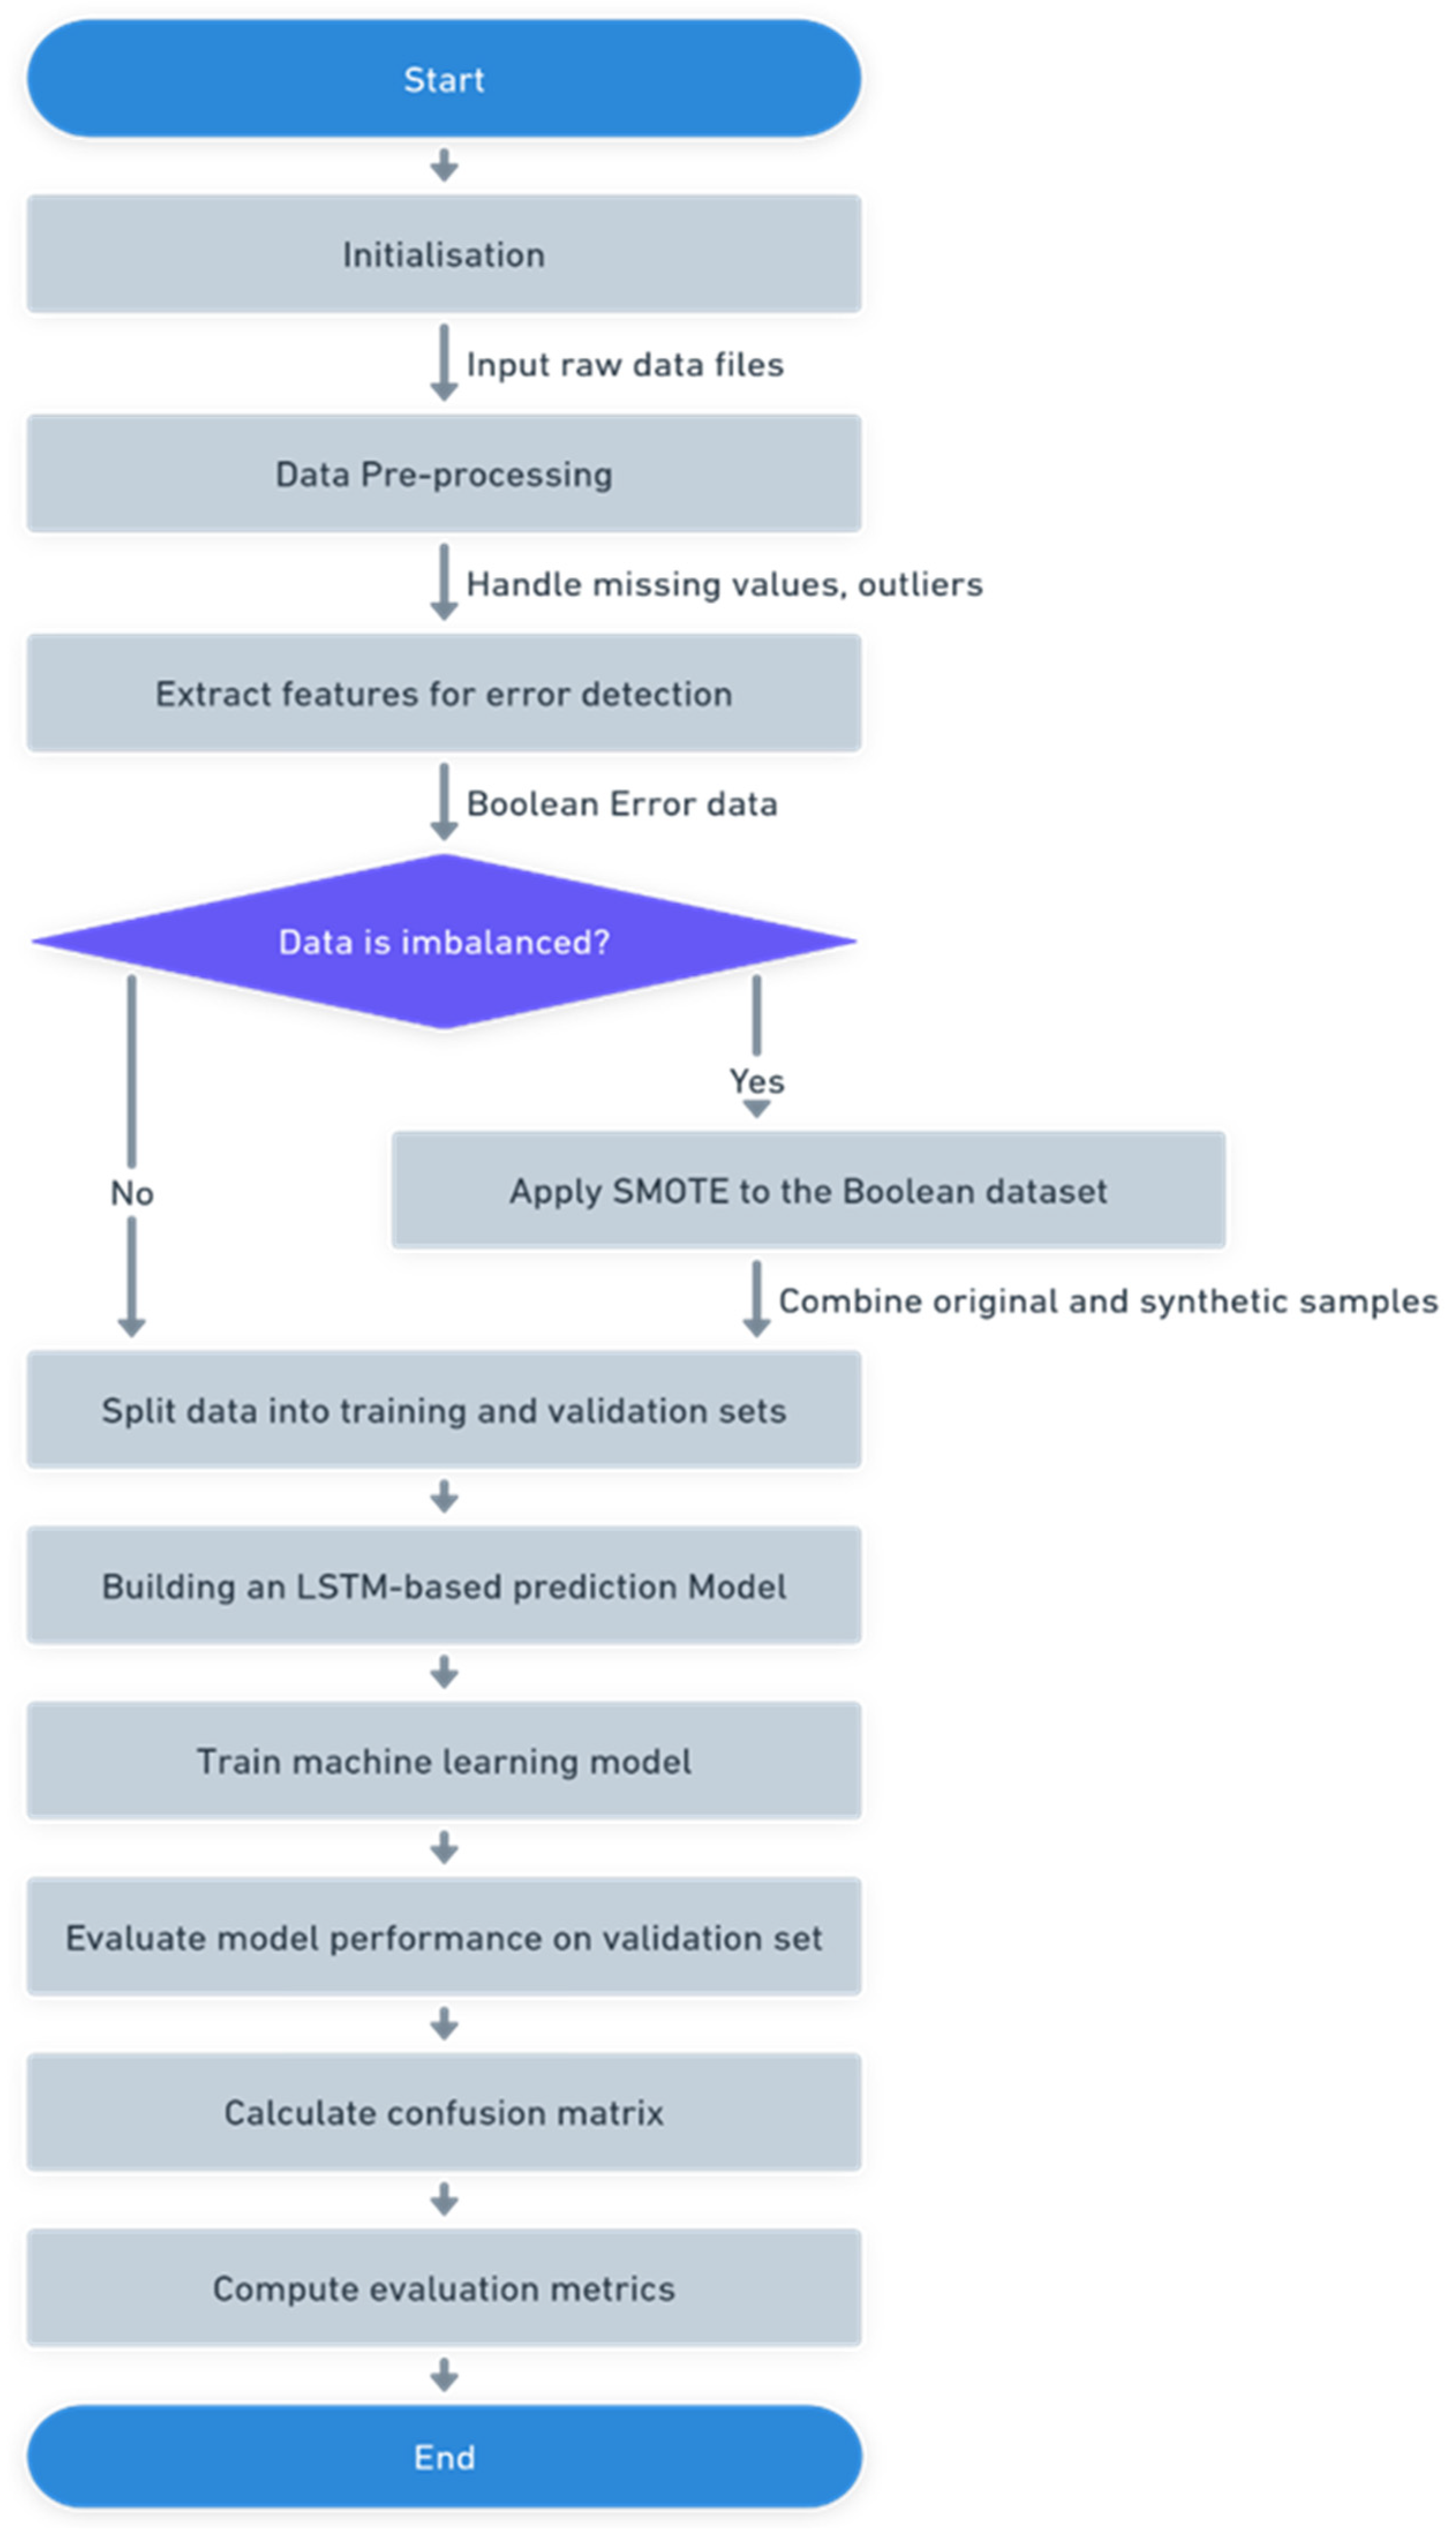
RNNs are a robust machine learning technique that excels at handling sequential data, such as time series and natural language processing. RNNs contain a feedback loop that allows them to learn complicated correlations in input sequences and exploit these structures in a nonlinear fashion [52]. RNNs have been extensively employed in diverse domains, such as sentiment analysis, energy demand forecasting, and monthly flow prediction [53]. An essential benefit of RNNs is their capability to handle input sequences of varying lengths and produce output sequences of varying lengths. These characteristics make them suitable for tasks such as language modelling, machine translation, and speech recognition [51]. Deep neural networks, which are capable of learning even more intricate representations of the input data, can be created by stacking RNNs [54].
More sophisticated RNN architectures, such as LSTMs and GRUs, have been created to solve the problem of long-term dependencies, which can be problematic for regular RNNs. These designs better capture long-term dependencies in the input data by employing gating techniques to retain and forget information selectively.
In the available literature, the methodologies used for Boolean time series error or fault detection, diagnosis, and prediction in manufacturing industries based on machine learning can be seen in Table 1 below, and deep learning can be seen in Table 2 below, as follows:
Container cranes are crucial in container terminals and are fundamental to the global economy because most of the world’s goods pass through them. However, their automation level is lower than those of yard cranes and automated guided vehicles (AGVs) [21]. Various methodologies have been explored here, but the gap lies in further refining and expanding the application of deep learning techniques to address specific challenges in error detection, diagnosis, and prediction in quay container crane data analytics. This would ultimately improve safety, efficiency, and automation in port operations. The essential part is early failure diagnosis, which comes with the initial error identification and prediction step. The proposed methodology aims to do just that.

3. Methodology

The dataset used here for deep learning model training and evaluation included the actual data from container cranes at container terminals. It was in a proprietary format and could not be read directly. It was converted into a readable format using Python programming. It consisted of the operational data from the PLC, sensors, and other calculations. The extracted error data were Boolean, meaning the output was 0 or 1.
Software systems are used to diagnose and keep PLC data for 30 days, after which it is discarded. It is a vital tool for crane operations and daily performance evaluation. It provides a dependable data source in time series, raw data directly from the sensors, and their calculations. It detects and locates periodic errors within the crane. It creates approximately 680 to 730 monthly files, storing data per hour. It holds about 23,000 PLC variables in an average crane but can go much higher in a few cranes (e.g., 31,521 PLC variables in STS CC2124). That is 518.4 billion samples per month (20,000 data at 100 ms). The data features were selected (in this case, errors and some other identifier signals), and data from those variables were converted into CSV files in Excel using Python code. The error data contained roughly 3000 variables. Only two columns were non-Boolean, including the last for timestamps/time series (of improper format). There were approximately 3000 columns and more than 16,100,000 (16 million) rows.
The operational dataset analysis assessed eight cranes from different ports; finally, analysing three cranes in detail revealed that most had 2852–2878 error signals. However, only 3 to 6 signals were turning on, showing that an actual error occurred on cranes. This indicated the rarity of error events and the scarcity of relevant data to be analysed further, which posed a significant challenge in the project.
A custom code in Python was developed to extract the data from the proletariat data acquired from the cranes. The resultant Excel files were then used for further data processing.
The custom-built algorithm was developed using SMOTE and LSTM algorithms in Python programming, alongside customised preprocessing procedures, addressing imbalanced data and integrating evaluation metrics.
Data Pre-processing: Customised preprocessing was employed to extract Boolean data. Initially, the unprocessed data, which consisted of time series and sensor readings, were loaded. Ensuring data quality was paramount so that any missing values and outliers were addressed. Subsequently, Boolean features, which consisted of binary flags or true/false values, were extracted.
Addressing Imbalanced Data: In the case of an imbalanced dataset, when one class is considerably underrepresented, SMOTE can be employed. This method produces artificial samples for the underrepresented category by creating new instances through interpolating existing data points. The objective is to achieve a balanced class distribution, guaranteeing equitable representation of both classes. Next, the initial dataset is merged with the artificially generated samples. Subsequently, the dataset is divided into separate subsets for training and validation purposes. The data were split in the ratio 7:3 for testing the model, with 70% being the training data and the remaining 30% being the testing data. These data were reshaped into a three-dimensional format, with the dimensions being the samples, time steps, and features.
Constructing the LSTM model: Developing the LSTM structure was crucial. An LSTM neural network is built using input layers representing sequential data, LSTM layers capturing temporal dependencies, and an output layer conducting binary classification. The model was compiled by selecting a loss function, such as binary cross-entropy, an optimiser, such as Adam, and an evaluation metric, such as accuracy. The model had a batch size of 50 and was trained for 40 epochs, consisting of 2 LSTM layers and one dense layer for the final output. A seed value was provided at the start, which helped generate reproducible results for the model so that randomly different results were not generated each time the model ran. Once the model was trained, its performance was assessed on the validation set, and any adjustments to the hyperparameters were made, if necessary.
Model Evaluation: The model was evaluated using a range of metrics, such as accuracy, precision, recall, and F1-score. The confusion matrix offers a comprehensive breakdown of predictions, including true positives, true negatives, false positives, and false negatives. The evaluation metrics analysed the model’s behaviour and made any required modifications. The custom-built algorithm flowchart is shown below in Figure 3.

4. Results

This section represents the experimental results of applying the proposed deep learning algorithm to the error detection and prediction task.

4.1. Evaluation Metrics
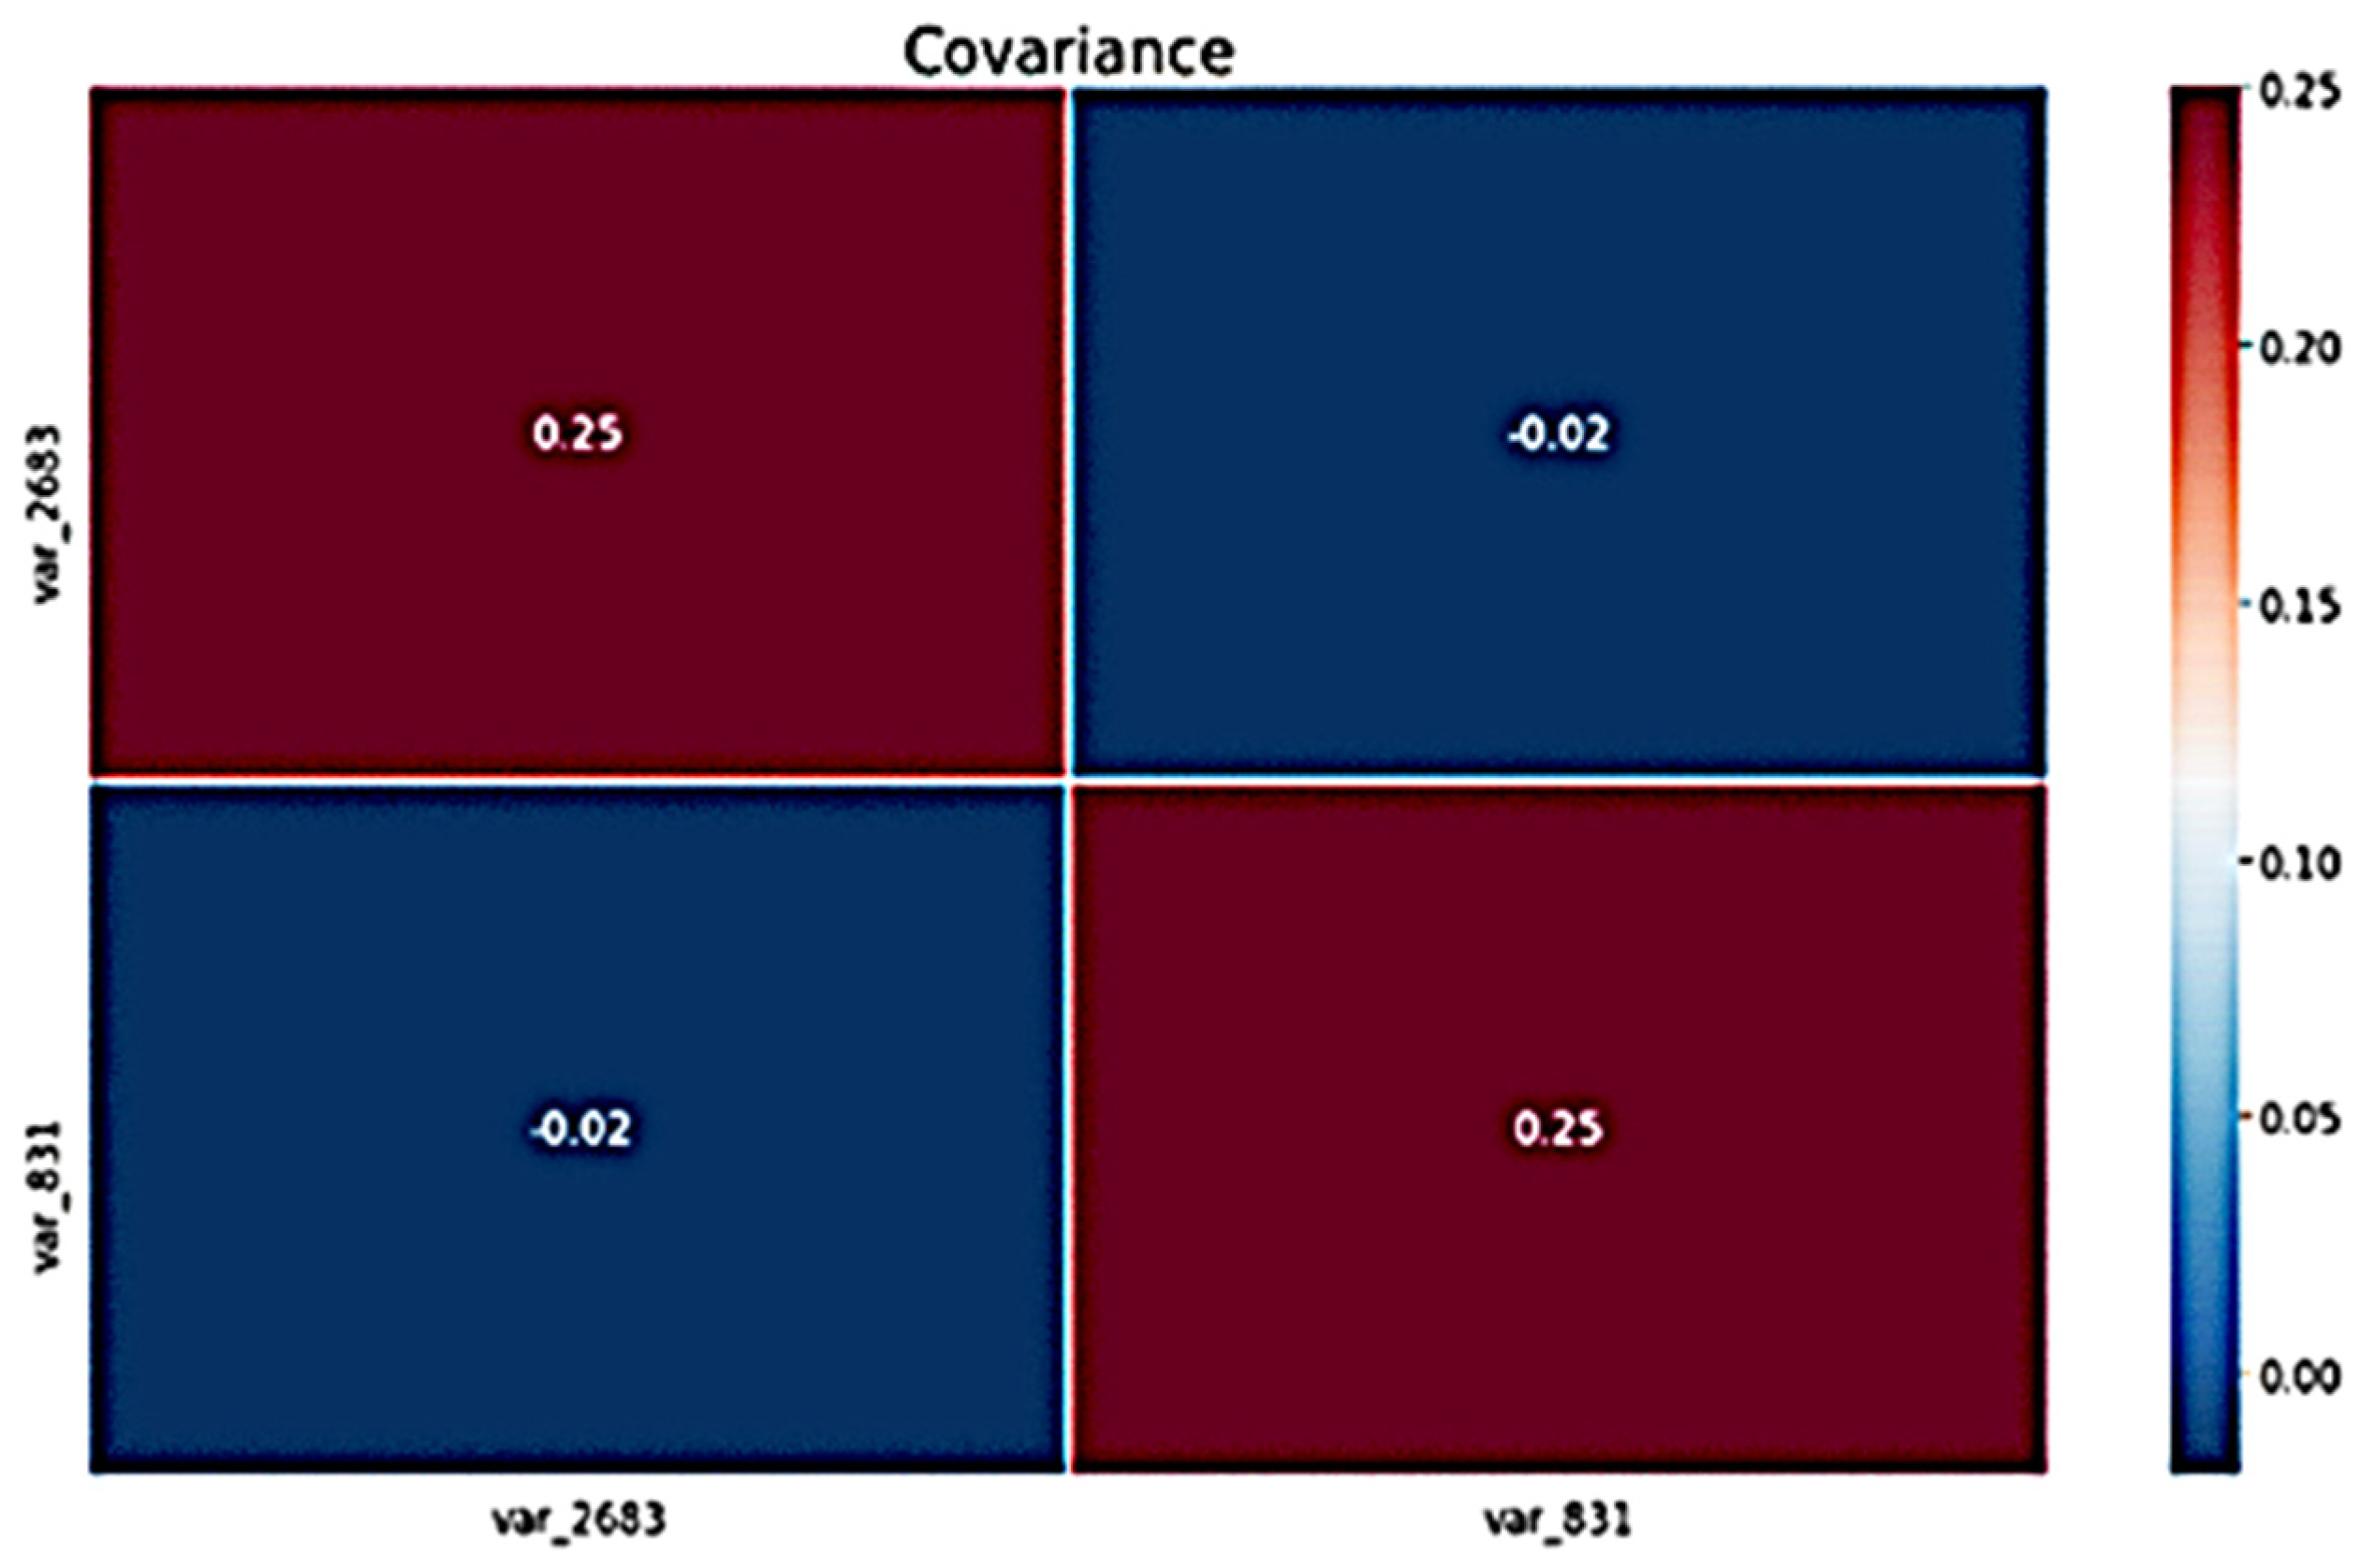
Evaluation metrics are quantitative measures used to assess the performance of a model or algorithm, particularly in machine learning, statistics, and data analysis. These metrics help determine how well a model is performing and guide improvements and optimisations. The variables shown as var_xxxx in the following metrics represent specific error signals generated from container cranes.

4.1.1. Covariance

Covariance is a consistently additive relationship across the two data samples. This relationship can be summarised between two variables, called the covariance. It is calculated as the average of the product between the values from each sample, where the values have been centred (had their mean subtracted) [63]. Covariance does not imply causation—it only measures the statistical relationship. Understanding covariance can help identify patterns and dependencies when analysing data. A covariance matrix represents the relationships between pairs of variables in a dataset. It quantifies the extent to which two variables vary together.
Cov (X,Y) = (sum(x − mean(X)) × (y − mean(Y))) × 1/(n − 1)
In this heatmap, each cell corresponds to the covariance between two variables. The diagonal cells (top left to bottom right) represent the covariance of a variable with itself. These values are always positive. The off-diagonal cells (top right and bottom left) represent the covariance between different variables. These values can be positive or negative. The heatmap uses colour intensity to represent covariance values. Dark red indicates a strong positive covariance (close to 1), meaning the variables tend to increase or decrease together. Dark blue indicates a negative covariance (close to −1), suggesting an inverse relationship. Lighter shades represent a weaker correlation (closer to 0).
The heatmap above in Figure 4 shows the x-axis and y-axis labels correspond to specific variables (e.g., ‘var_2663’ and ‘var_831’) var_2663 represents .tINTF_General_Visu.tLaneProtection.tCover3.tMotor4.tMotor.tPT100.tAlarm.bStatus and var_831—.tINTF_General_Visu.tLaneProtection.tCover1.tMotor4.tCB.tSignalWithError.tError.bHasError.
The top left quadrant has a dark red shade, indicating a robust positive covariance (around 0.25) between var_2663 and itself. The bottom right quadrant also shows a solid positive covariance for var_831. The light blue off-diagonal quadrants suggest a weak inverse relationship (around −0.02) between var_2663 and var_831, indicating that motor 4 has a positive covariance with the temperature sensor error in the motor four control block.

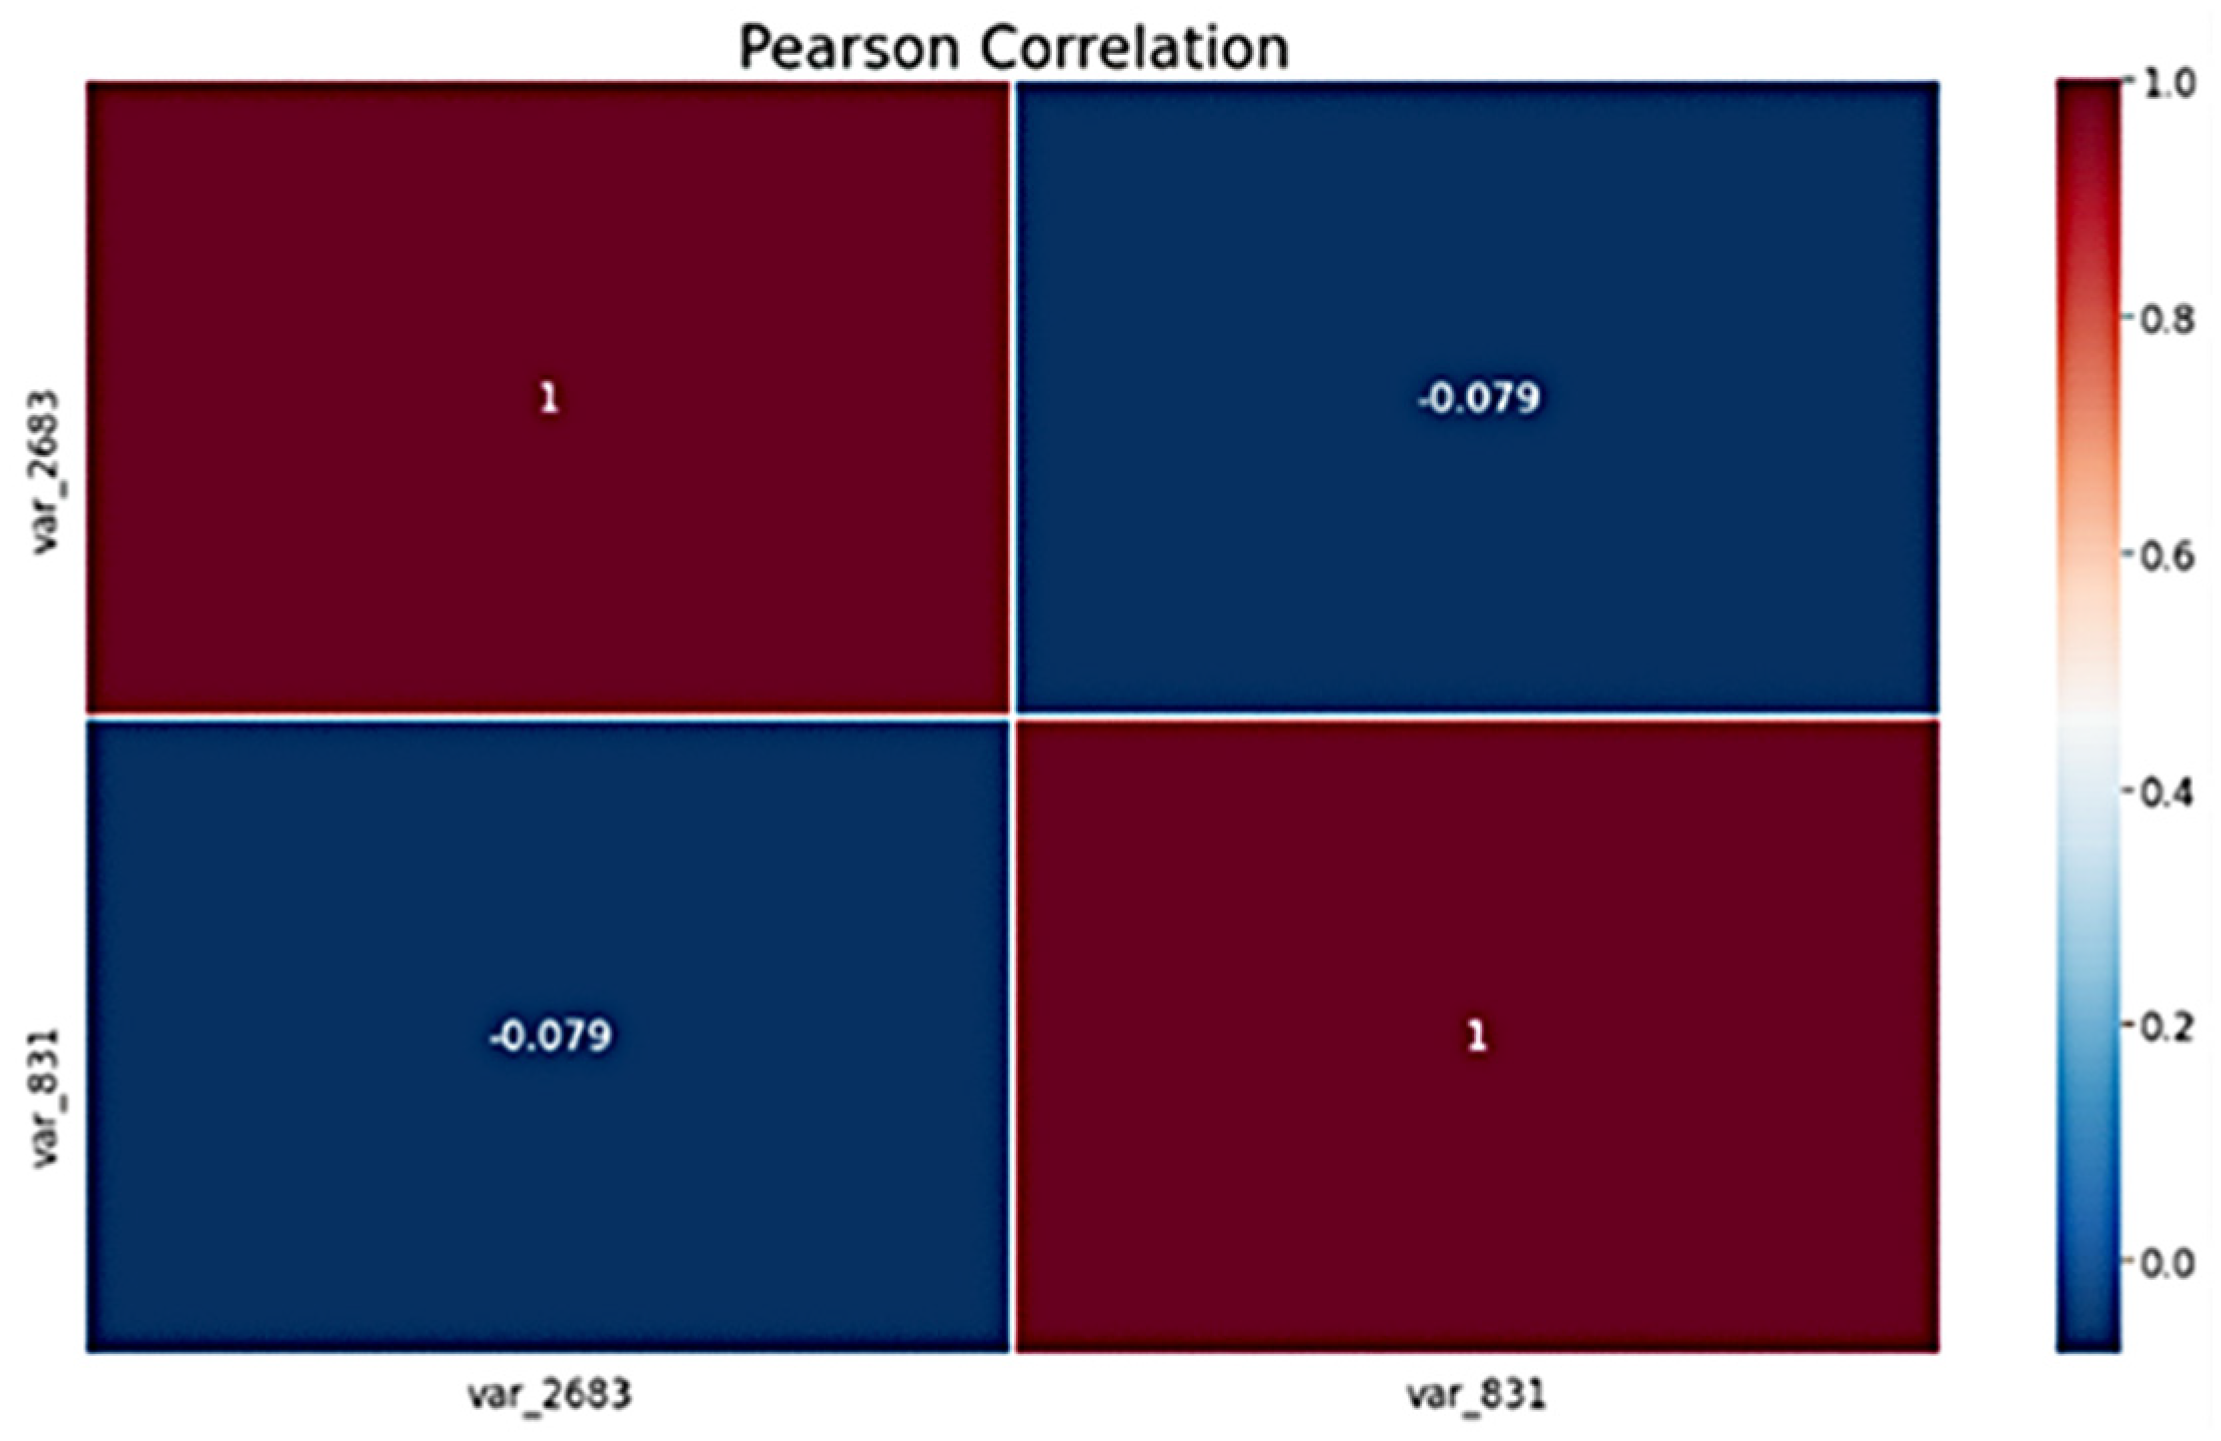
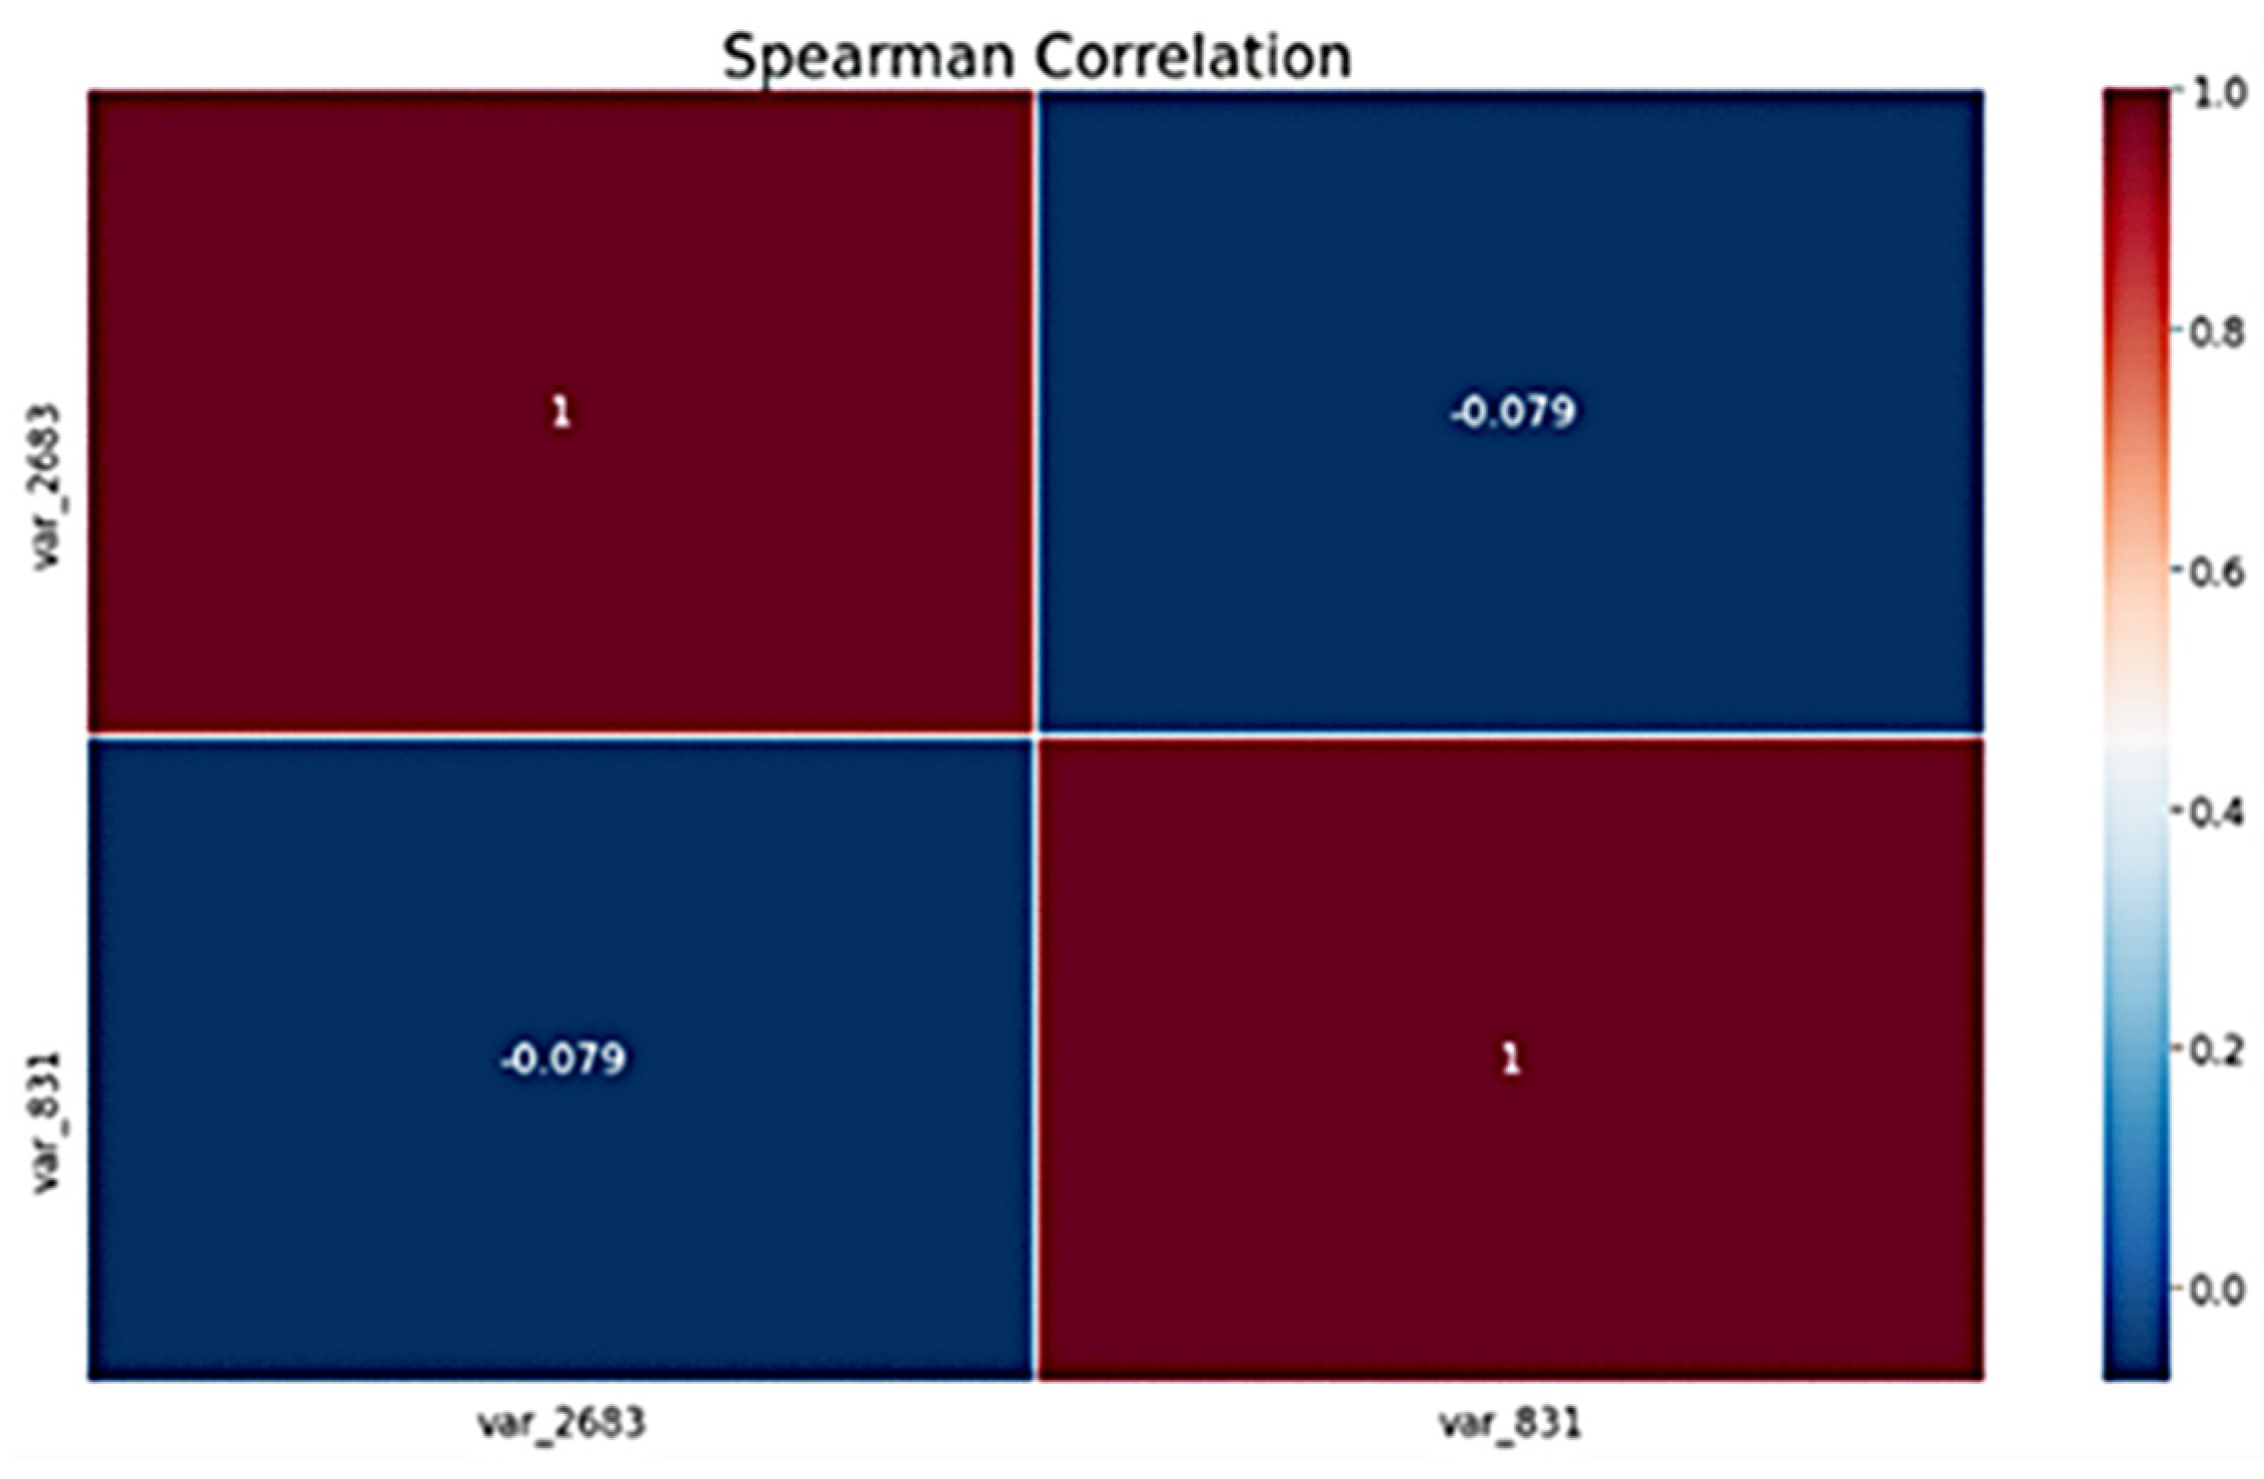
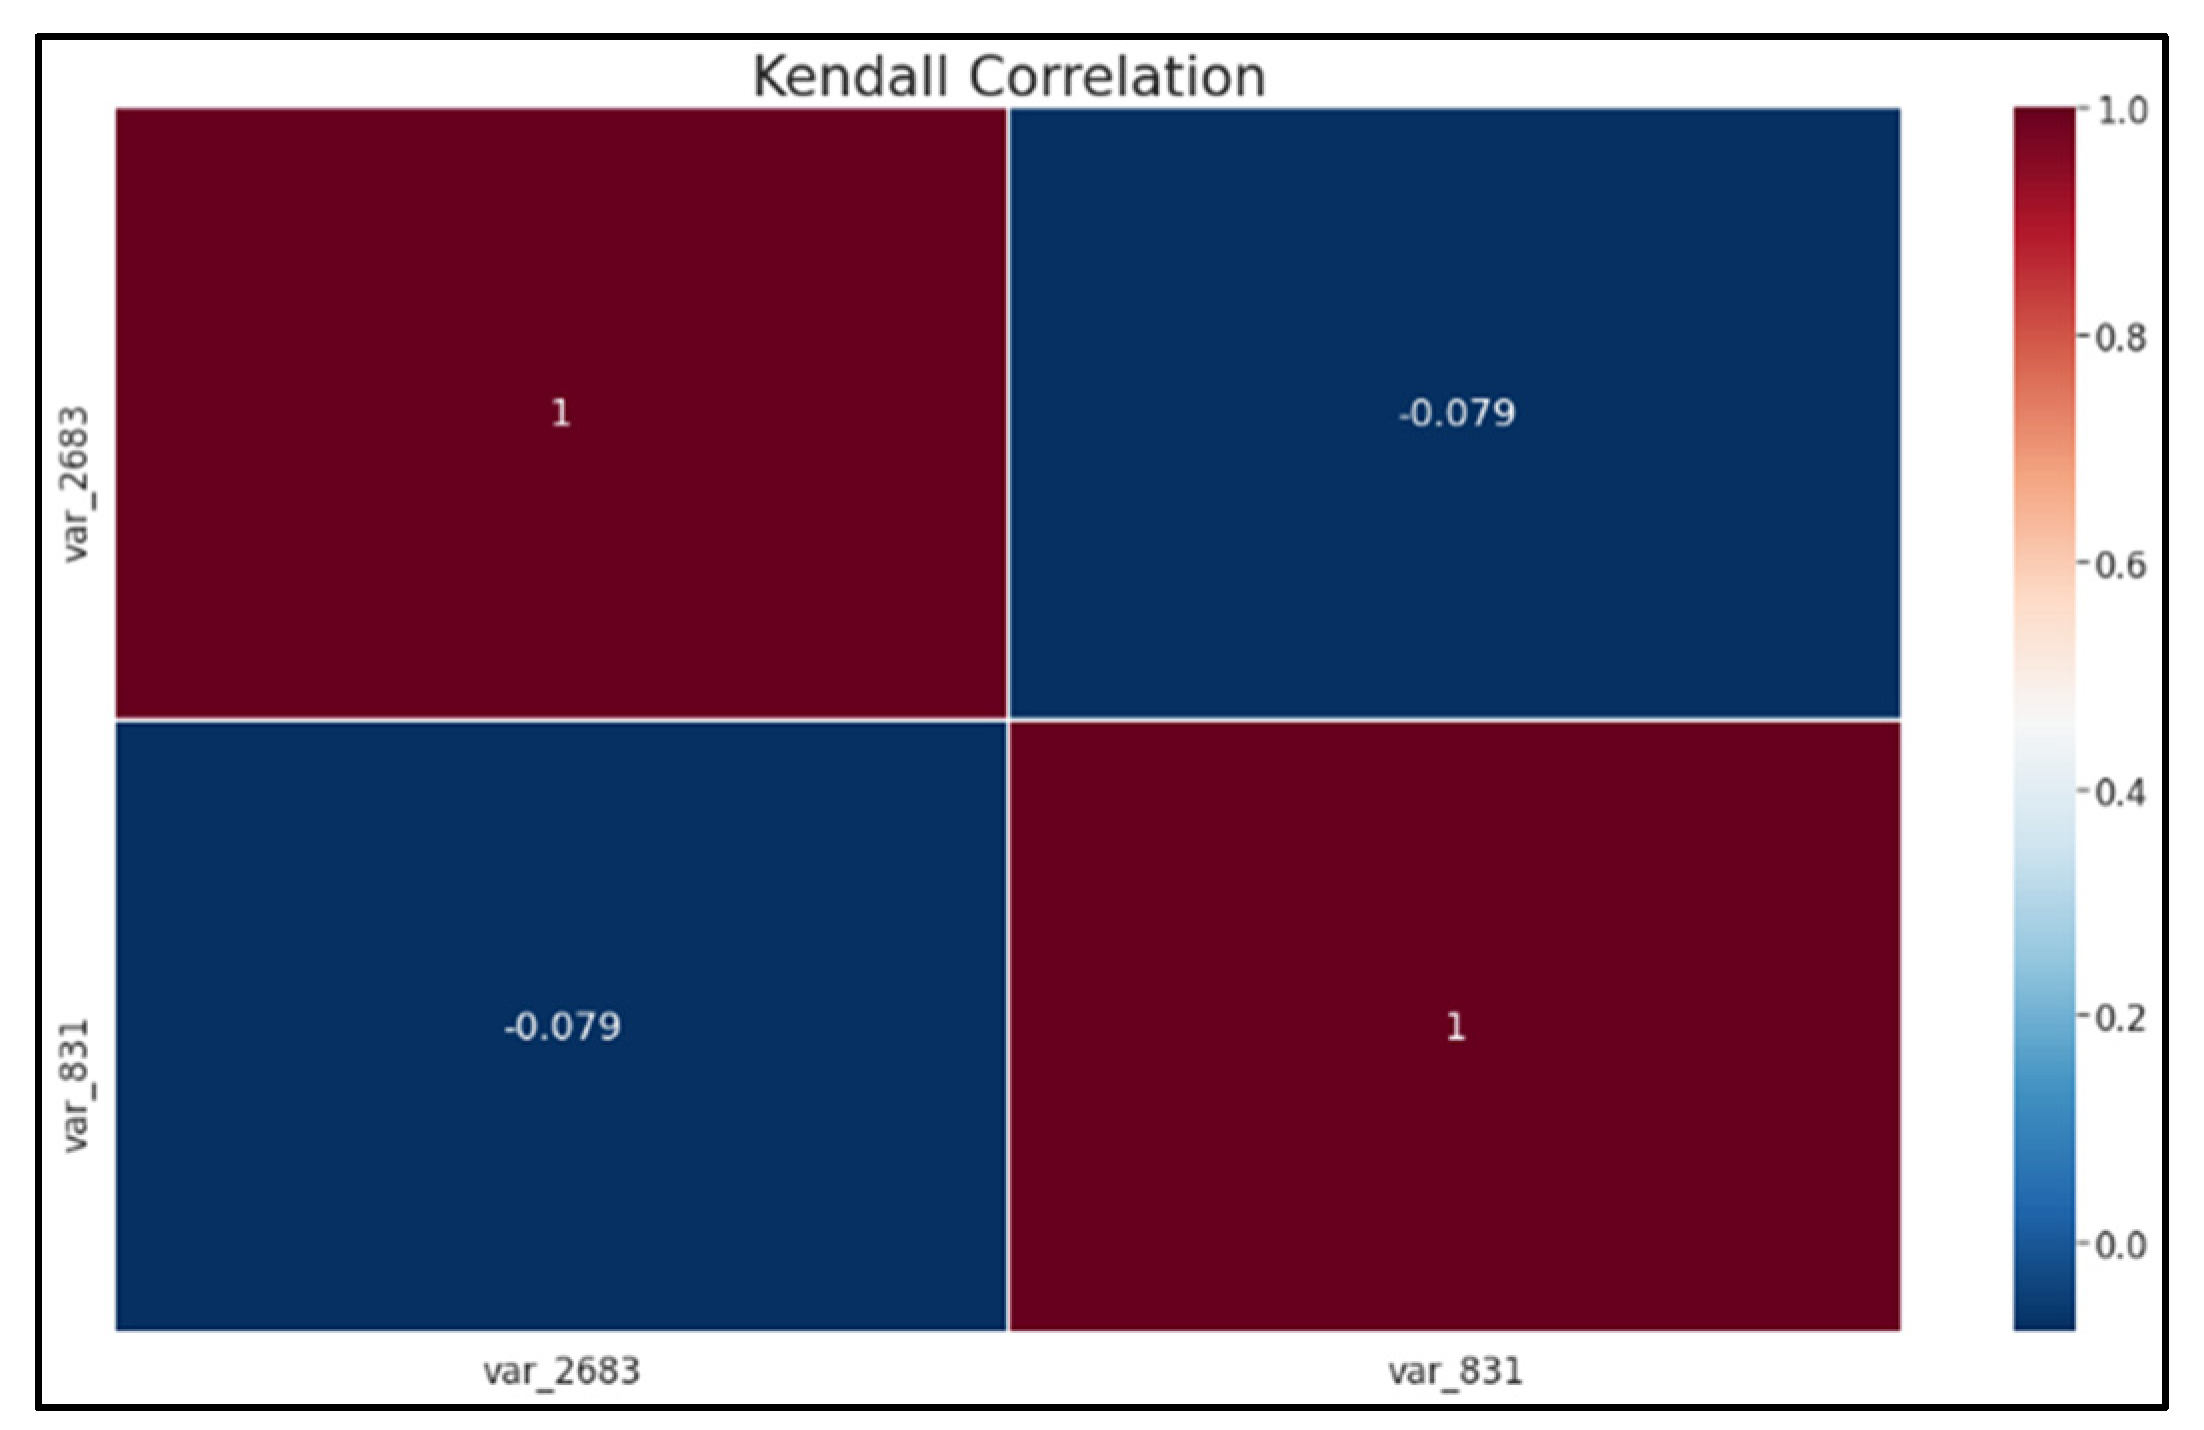
4.1.2. Correlation Matrix

The correlation matrix is a frequently used multivariate technique for determining strongly connected variables. This aspect of the project focused on correlating all the variables in the error signals and some operational signals considered dependent variables, such as CraneOn, CraneOff, and twist-lock locked. Error variables with only one unique value, 0, were removed because homogenous variables contain only one unique value and do not contribute additional information to the model. The correlation between the variables was analysed and visualised to give more insight into the data. Correlation was employed to determine the relationship between variables. It can be positive, indicating that both variables move in the same direction, or negative, indicating that when one variable’s value increases, the values of the other variables decrease. Correlation can also be neutral or zero, indicating that the variables have no relationship or are unrelated.

Pearson Correlation

Pearson’s correlation coefficient is computed by dividing the covariance of two variables by the product of their standard deviations. It is the normalisation of the covariance between the two continuous variables to give an interpretable score. It quantifies the degree to which a change in one variable is associated with a change in another variable [63].
PearsonCorrelation (r) = covariance(X,Y)/(stdv(X)× stdv(Y)
This heatmap shown in Figure 5 above, compares the two variables var_2683, i.e., .tINTF_General_Visu.tLaneProtection.tCover3.tMotor4.tMotor.tPT100_Group.tPT100_2.tError.bHasError and “var_831” i.e., .tINTF_General_Visu.tLaneProtection.tCover1.tMotor4.tCB.tSignalWithError.tError.bHasError. The heatmap displays the correlation coefficient between these variables. The diagonal quadrants (where a variable is compared to itself) show a correlation coefficient 1 (as expected). The off-diagonal quadrants reveal a weak negative correlation of approximately −0.079. The colour scale ranges from −1 to 1. Dark red represents stronger negative correlations, while dark blue indicates stronger positive correlations.

Spearman Correlation

Spearman’s correlation was calculated from each sample’s relative rank of values. This approach is commonly used in non-parametric statistics, such as statistical methods where no specific distribution of the data, like the Gaussian distribution, is assumed [64]. This coefficient measures the strength and direction of the monotonic relationship between two ranked variables. It is beneficial in identifying and assessing nonlinear relationships and ordinal data.
SpearmanCorrelation = covariance(rank(X),rank(Y))/std(rank(X)) × std(rank(Y))
This heatmap shown above in Figure 6, is divided into four quadrants to show the Spearman correlation coefficient between two variables labelled as var_2683—.tINTF_General_Visu.tLaneProtection.tCover3.tMotor4.tMotor.tPT100_Group.tPT100_2.tError.bHasError on the y-axis and var_831—.tINTF_General_Visu.tLaneProtection.tCover1.tMotor4.tCB.tSignalWithError.tError.bHasError on the x-axis. The two diagonal quadrants show a perfect positive correlation (a value of 1) for each variable with itself (indicated by the red colour and the number 1). The off-diagonal quadrants reveal a very low negative correlation of −0.079 between the two variables (indicated by deep blue).

Kendall Correlation

The Kendall Tau rank correlation coefficient measures the degree of similarity between two sets of ranks given to the same set of objects. Unlike Spearman’s coefficient, the Kendall Tau measures only directional agreement, not rank differences.
KendallCorrelation = (Number of Concordant Pairs − Number of Discordant pairs)/n(n − 1)/2
The Kendall correlation heatmap displayed in Figure 7 reaffirms the findings of the other correlations. It focuses on the same two variables as the other correlation heatmaps, i.e., var_2683—.tINTF_General_Visu.tLaneProtection.tCover3.tMotor4.tMotor.tPT100_Group.tPT100_2.tError.bHasError on the y-axis and var_831—.tINTF_General_Visu.tLaneProtection.tCover1.tMotor4.tCB.tSignalWithError.tError.bHasError on the x-axis. The top left and bottom right quadrants are dark red, indicating a perfect correlation of 1. This is expected since each variable correlates with itself. The top right and bottom left quadrants are blue, suggesting a weak negative correlation (approximately −0.079) between var_2683 and var_831.

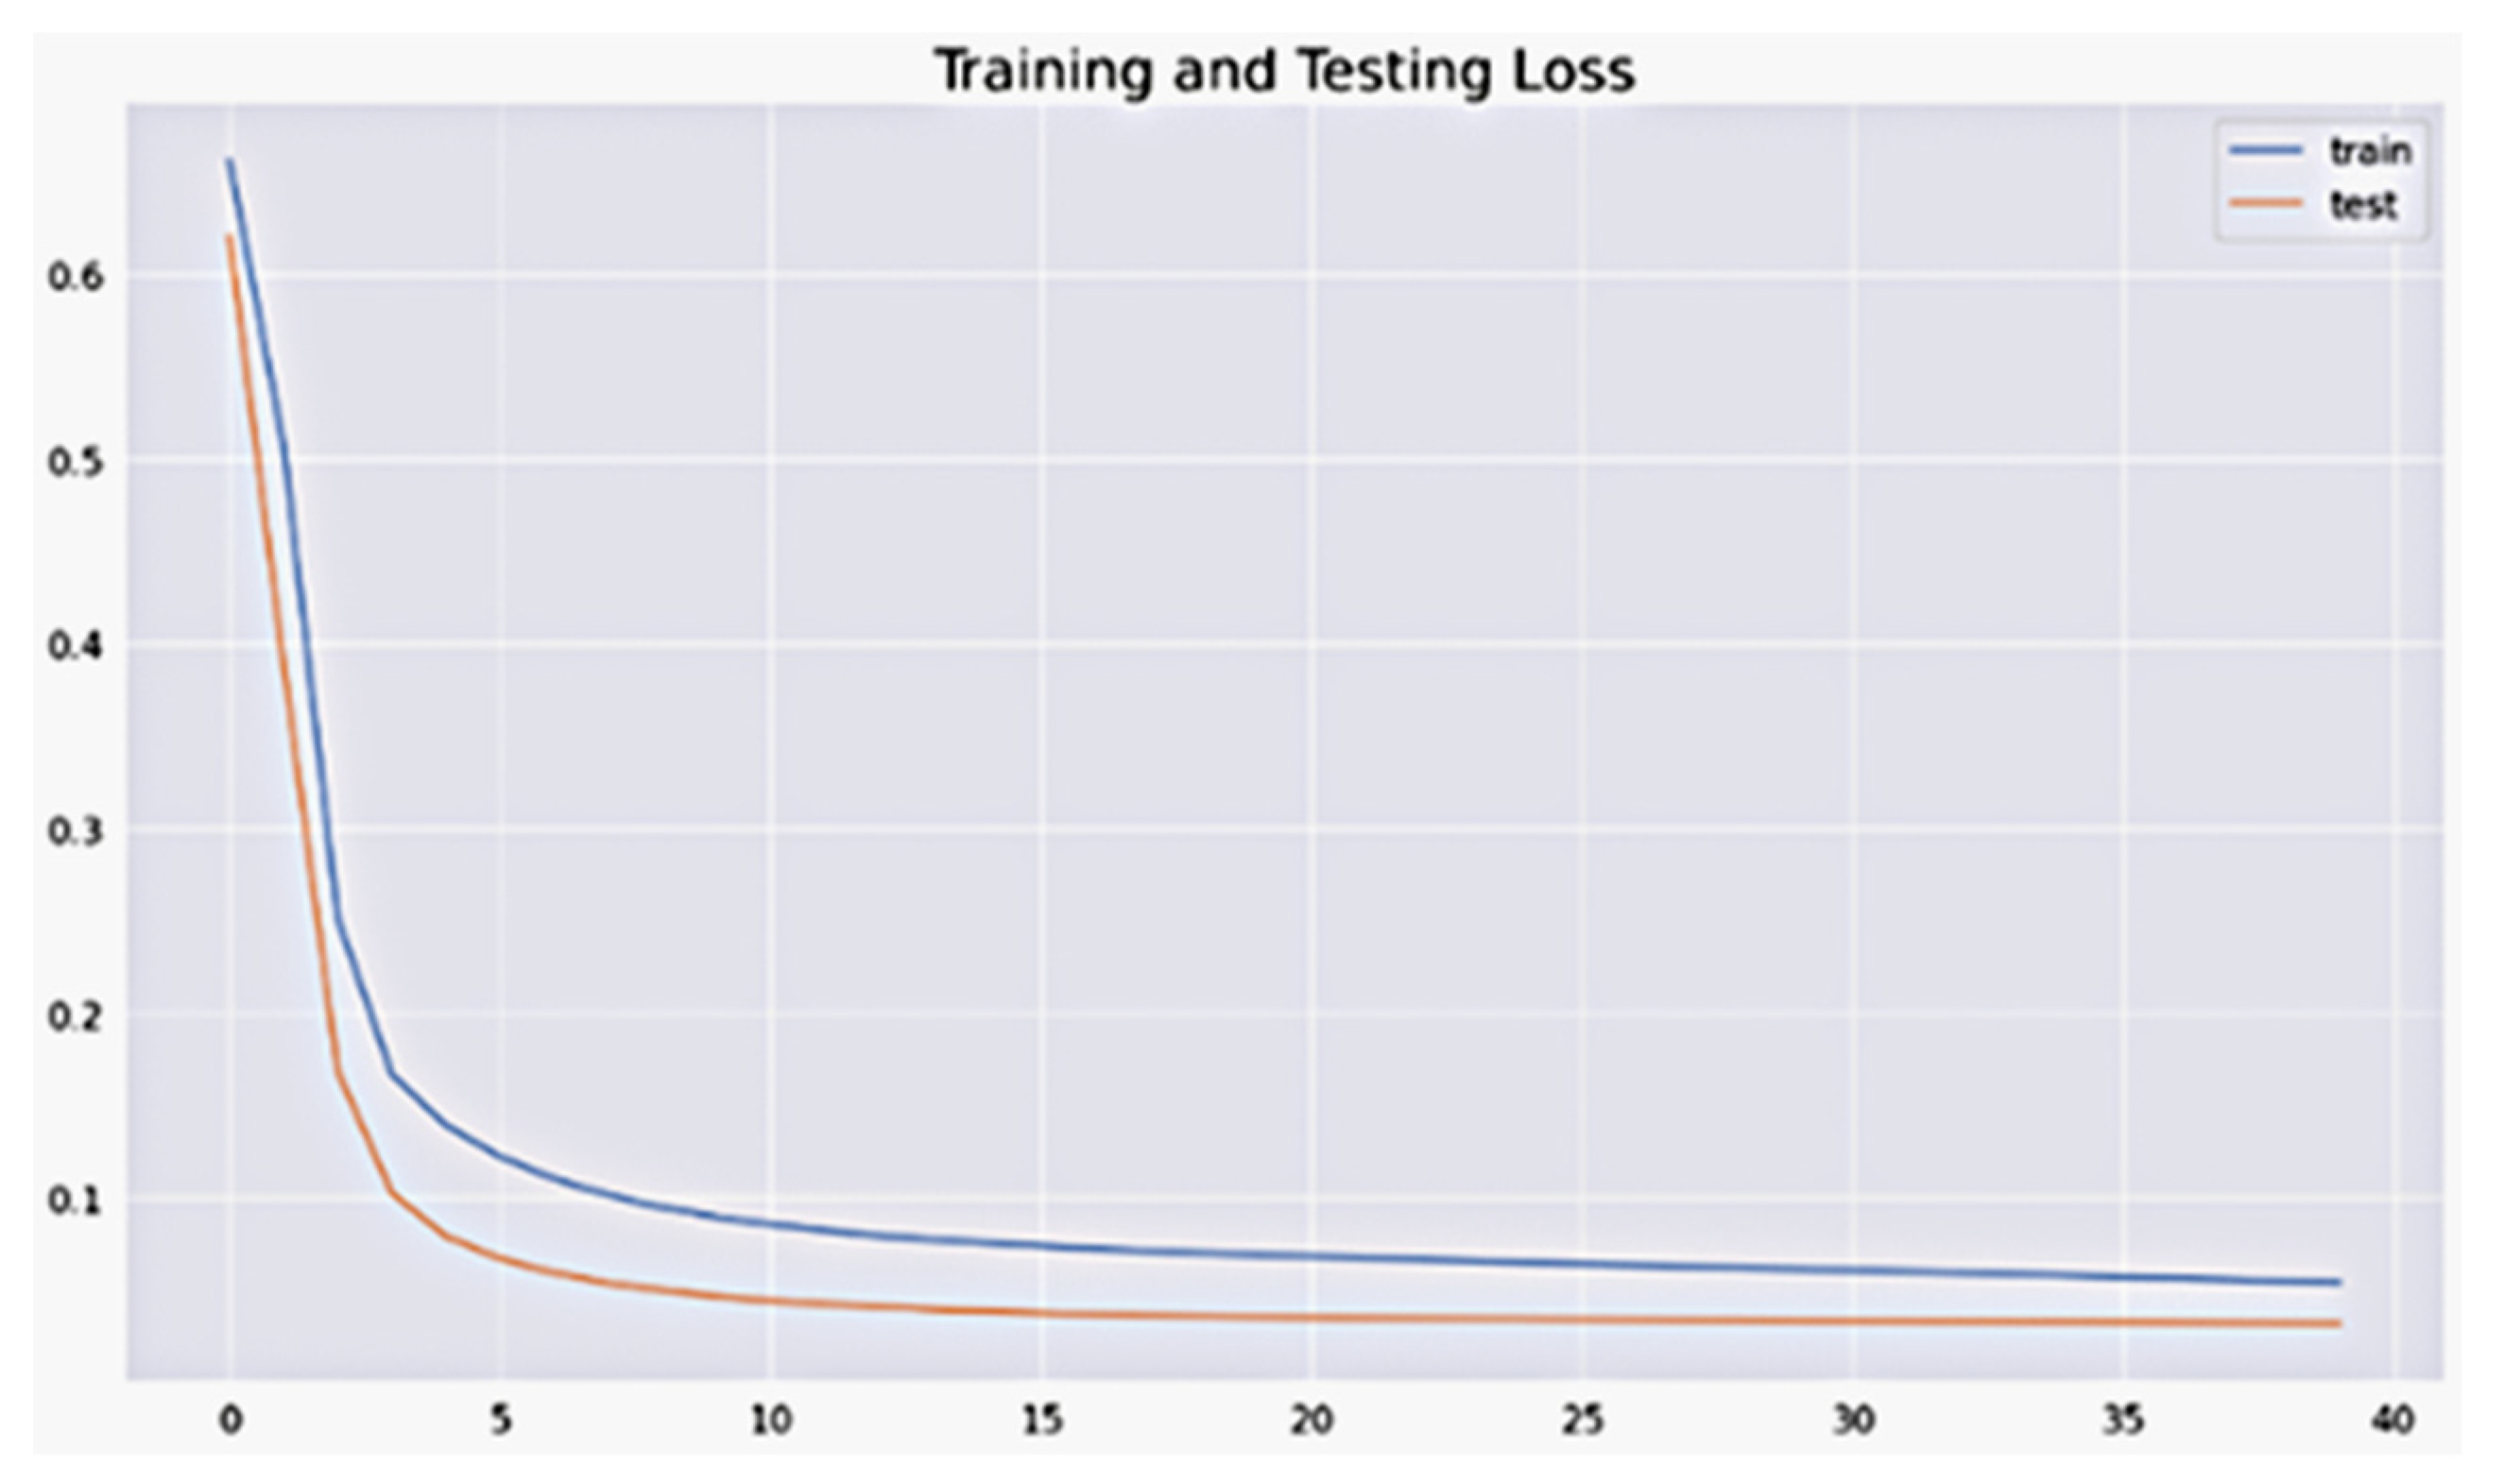
4.1.3. Training and Test Loss Function

In machine learning, the training loss and test loss (or validation loss) are critical metrics used to evaluate a model’s performance during the training process. These loss functions help measure how well the model performs on the training and unseen data (test or validation data). Training loss is the error or discrepancy between the predicted and actual outputs on the training dataset. It provides a measure of how well the model fits the training data. Test loss (or validation loss) is the error between the predicted and actual test or validation dataset outputs. This dataset is not used during training but is kept aside to evaluate the model’s performance on unseen data.
The root mean squared error (RMSE) value is calculated. The square root of the mean squared error provides a measure in the same units as the target variable.
The graph in Figure 8 shows two lines: train (in blue) and test (in orange). The horizontal axis represents the number of epochs, ranging from 0 to 40, while the vertical axis represents the loss, ranging from 0.0 to 0.7. Both lines initially show a sharp decline in loss during the early epochs, indicating effective learning from the training data. As the epochs progress, both lines gradually flatten out, suggesting diminished returns on learning and the risk of overfitting if the test loss increases. The train line represents the loss of the training data, and the test line represents the loss of unseen test data. Monitoring both lines helps assess model performance and generalisation ability and aids in diagnosing issues like overfitting, underfitting, and convergence. This graph is academically relevant in evaluating ML models and is used to optimise training strategies and improve model performance.

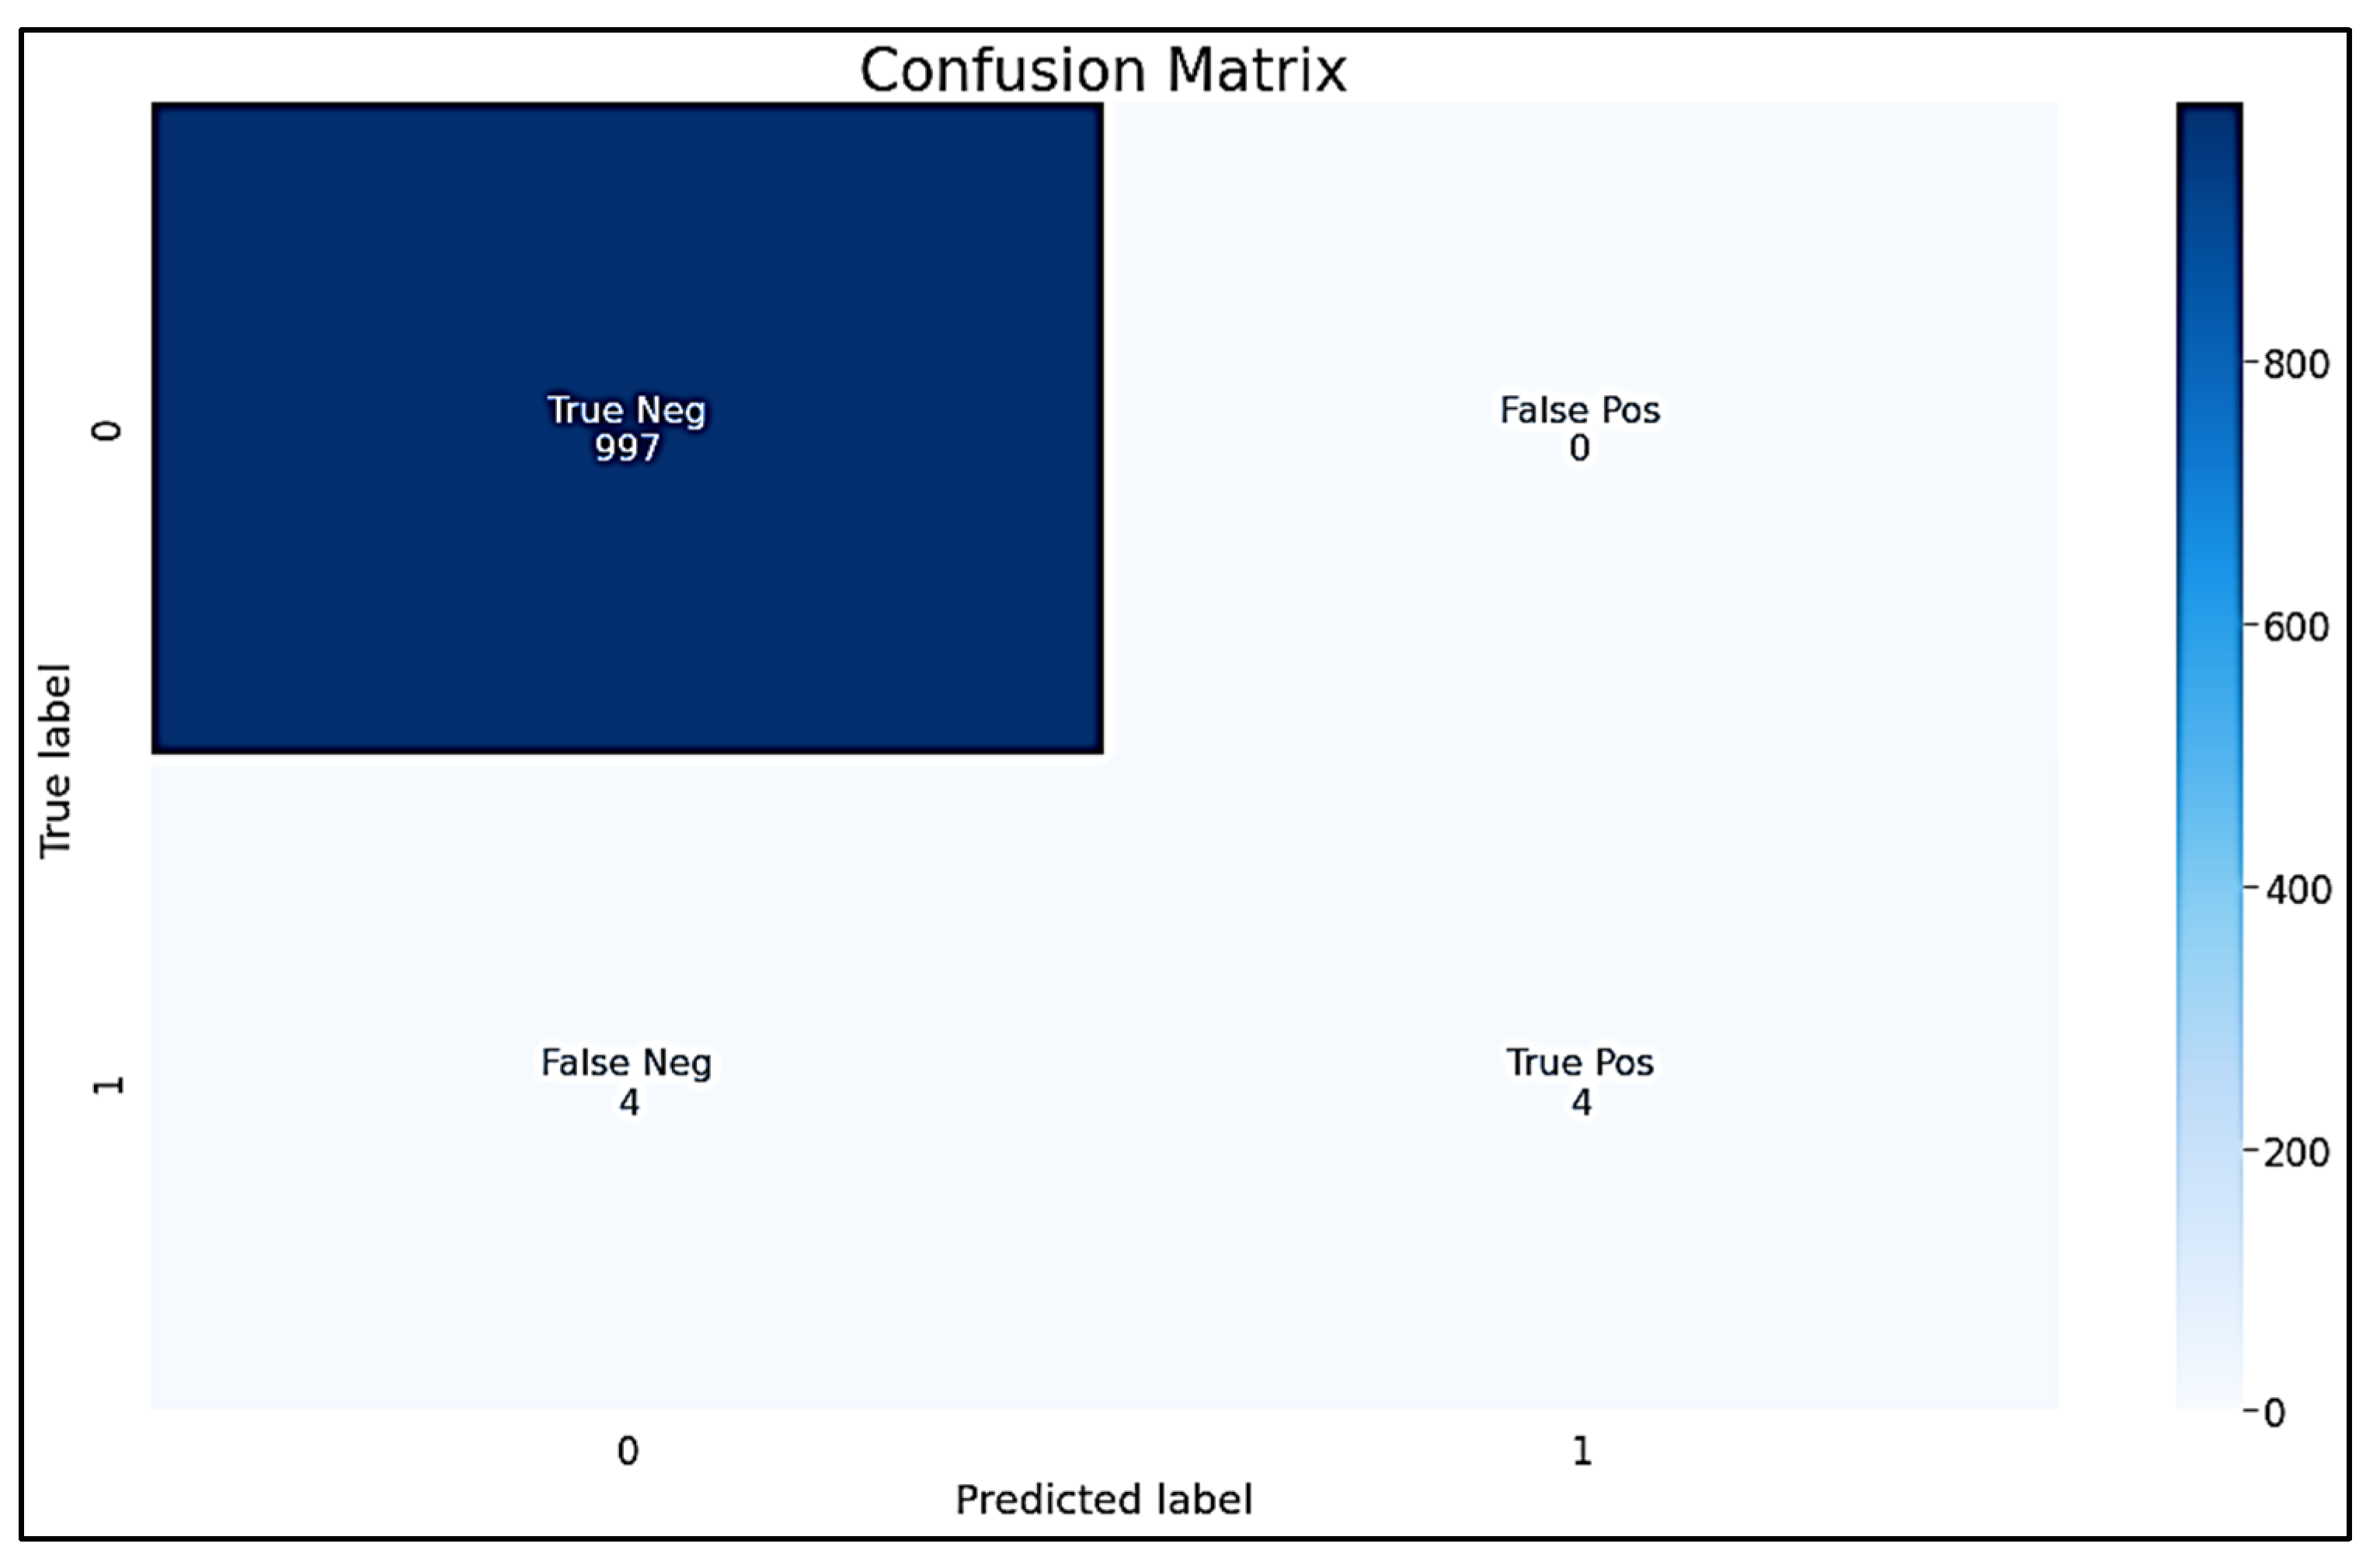
4.1.4. Confusion Matrix

A confusion matrix is a fundamental tool for evaluating the performance of classification models. It provides a comprehensive view of how well a model predicts different classes. The confusion matrix is based on a binary classification problem with two classes: 0 and 1. These classes could represent various outcomes, such as pass/fail, yes/no, or true/false. The matrix is organised into four quadrants:
  • True Negatives (TN): Instances correctly predicted as class 0. These are desirable predictions—correctly identifying instances as negative (class 0);
  • False Positives (FP): Instances incorrectly predicted as class 1 when they are actually class 0. These are errors—instances wrongly classified as positive (class 1) when they are not;
  • False Negatives (FN): Instances incorrectly predicted as class 0 when they are actually class 1. These are also errors—instances wrongly classified as negative when they are positive;
  • True Positives (TP): Instances correctly predicted as class 1. These are desirable predictions—correctly identifying instances as positive.
The confusion matrix shown in Figure 9 summarises the classification model’s performance. It provides insights into how well the model’s predictions aligned with the actual outcomes.
  • True Negative (TN): The model correctly predicted negative instances (the actual outcome was negative). There are 997 true negatives;
  • False Positive (FP): The model incorrectly predicted positive instances (the actual negative outcome). Here, there are nine false positives;
  • False Negative (FN): The model incorrectly predicted negative instances (the actual positive outcome). The matrix shows four false negatives;
  • True Positive (TP): The model correctly predicted positive instances (the actual outcome was positive). In this matrix, there are four true positives.

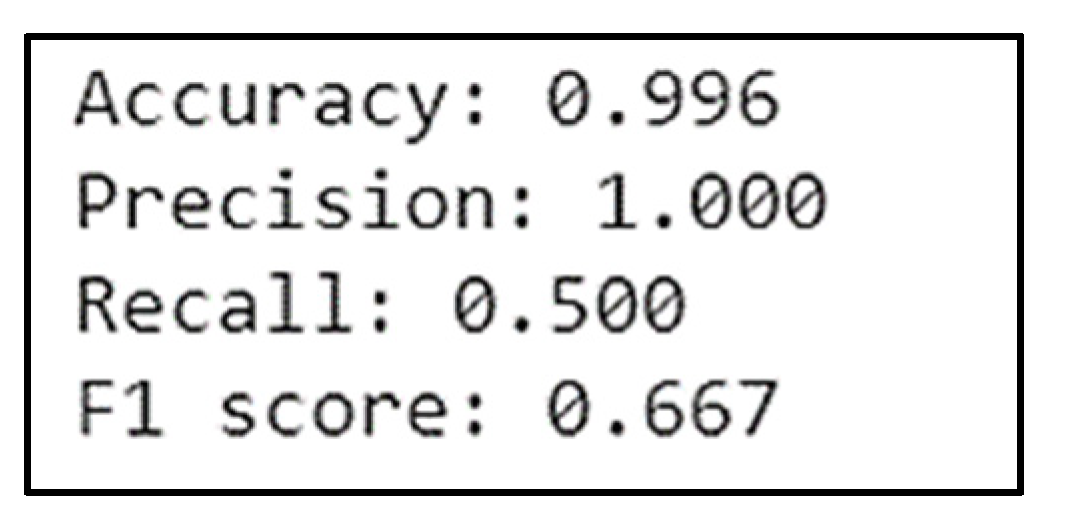
4.1.5. Accuracy, Precision, Recall, F1 Score

The accuracy, precision, recall, and F1 score shown in Figure 10 below were also calculated and printed for the predicted data evaluation metrics. These model performances were then saved in a text file.
Accuracy: The number of correct predictions is divided by the total number of predictions.
Accuracy = (True Positives + True Negatives)/Total Instances
Precision: This measures the accuracy of positive class predictions by determining how many of them actually belong to the positive class.
Precision = True Positives/(True Positives + False Positives)
Recall (Sensitivity): This calculates the proportion of correct positive predictions out of all the positive examples in the dataset.
Recall = True Positives/(True Positives + False Negatives)
F1 Score: This provides a single score that balances precision and recall in one number. It is a harmonic mean of precision and recall.
F1 Score = 2 × ((Precision × Recall)/(Precision + Recall))
Accuracy: Achieving an accuracy of 0.996 indicates overall solid performance.
Precision: A precision score 1.00 suggests that the model rarely misclassified true errors as non-errors.
Recall: The recall score 0.500 indicates that the model identified only half of the actual errors. This trade-off between precision and recall is common in imbalanced datasets.
F1 Score: The F1 score (0.667) balances precision and recall, providing a comprehensive view of the model’s effectiveness.

4.2. Error Data Time Series Prediction

The final result is the prediction of the following n seconds of data where the user provides the n seconds as input in the beginning, and the corresponding data are saved in a CSV file. For this, the next 1 s worth of data is predicted for the next 60 s with the help of historical data available for analysis. The output from the predicted CSV file for one of the error variables is shown below in Table 3:

5. Discussion

Timely error detection and prediction are essential in optimising crane performance. They are crucial in ensuring safety by preventing accidents, protecting equipment from damage, and reducing human errors. As a result, these practices enhance productivity and lower operating expenses.
Understanding predictive analytics’ limitations is critical. First and foremost, progress is impossible without an extensive and high-quality training dataset. Second, having a clear description of the concept to be forecasted and past occurrences is critical. One of the challenges in predictive analytics is identifying a needle in a haystack and predicting its occurrence. However, there are certain limitations of traditional methods. These limitations in container crane operations are as follows:
  • Human-Induced Errors: Human operators still play a significant role in quay crane operations despite automation advancements. Their decisions and actions can lead to errors, affecting productivity and safety [64].
  • Complex Dynamics: Container cranes operate in a dynamic environment with varying container weights, wind conditions, and vessel movements. Predicting errors in such a complex system is challenging [65,66,67].
  • Efficiency and Downtime: Minimising downtime due to errors is critical. Timely error prediction can prevent costly delays and optimise crane utilisation [68,69].
  • Imbalanced data: A dataset is called imbalanced when there are substantial disparities in the number of examples of each class, resulting in one or more classes being underrepresented in the dataset [70]. This phenomenon has been established in several real-world datasets gathered in industrial settings.
Therefore, this research developed a novel, custom-built algorithm to address these limitations and challenges by focusing on detecting and predicting errors before they convert into faults and failures.
The following points address any challenges and limitations encountered during the implementation:
  • Because there was a significant time difference between the data array files, the data array files could not be merged for analysis; instead, analysis was performed on each data array file separately.
  • For time series forecasting, the data were scaled down from milliseconds to seconds, because the data in milliseconds were not continuous, i.e., (1, 2, 3, …, 999).
  • There may be a good chance of error as the dataset size was small, so the LSTM model could not properly and correctly predict new data. By adding more data, this issue can be resolved.
Despite the promising results, implementing deep learning models for error prediction in real-world crane operations remains challenging. These include data quality issues, the interpretability of complex models, and integration with existing systems. Future research directions may address these challenges through advanced model architectures, data fusion techniques, and collaborative efforts between academia and industry stakeholders. The avenues for future research can advance with improved data quality and quantity, which are currently lagging.

6. Conclusions

Research on container cranes encompasses various aspects related to their design, operation, and impact on port logistics. However, there is a glaring absence of studies focusing on early error identification to prevent faults and failures. Timely error prediction through deep learning algorithms has the potential to revolutionise crane performance and ensure optimal efficiency within container crane operations.
A custom-built deep learning algorithm based on LSTM was developed, achieving an accuracy of 99.6% in predicting crane error signals using LSTM and SMOTE for classification prediction, with a precision of 1.00, recall of 0.500, and an f1 score of 0.667. However, further data are required to improve the model’s outcomes.
The current data availability is limited to a month with approximately 30,000 variables, including less than 3000 error variables. The usable data were a small sample set, with only 3 to 6 error variables that were occasionally activated. The study also provides other outputs, such as correlation, covariance, and confusion matrices. The experiments demonstrated the technique’s capability to identify crucial elements, leading to efforts to enhance the model’s structure for improved error prediction in industrial big data.
While the output model relies on pre-existing data, its ability to handle imbalanced data, a common issue in most industries, presents a significant advantage. With further data, the existing model can be enhanced. Continuous data over several months will provide a more comprehensive error data sample set, contributing to improved outputs. Once a larger dataset is obtained in future, exploration of other algorithms such as random forest, naïve Bayes, and XG boost may be used.
Continued research and innovation in this area are essential to fully realising the benefits of predictive analytics in port operations.

Author Contributions

Conceptualization, A.A.; data curation, A.A.; formal analysis, A.A.; methodology, A.A.; software, A.A.; supervision, L.K. and J.W.; validation, A.A.; visualization, A.A.; writing—original draft, A.A.; writing—review and editing, A.A., L.K. and J.W. All authors have read and agreed to the published version of the manuscript.

Funding

This project was supported, in part, by Science Foundation Ireland grant 13/RC/2094_P2 and co-funded under the European Regional Development Fund through the Southern & Eastern Regional Operational Programme to Lero—the Science Foundation Ireland Research Centre for Software (www.lero.ie, accessed on 20 July 2024) during the initial two years of this project.

Data Availability Statement

The datasets presented in this article are not readily available because of the container port’s privacy or data security issues. Requests to access the datasets should be directed to the corresponding author of this paper.

Conflicts of Interest

The authors declare no conflicts of interest.

References

  1. Mordor Intelligence. Container Shipping Market—Size, Share & Growth Analysis. Mordor Intelligence Industry Reports. [Online]. Available online: https://www.mordorintelligence.com/industry-reports/global-container-shipping-market (accessed on 17 July 2024).
  2. Lindeberg, E.; Improving the Operational Performance of STS Cranes. Västerås, Sweden, February 2011. Available online: www.porttechnology.org (accessed on 18 June 2021).
  3. Ship-to-Shore (STS) Container CranesMarket Size, Share, Industry Forecast 2028. Available online: https://www.fortunebusinessinsights.com/ship-to-shore-sts-container-cranes-market-102880 (accessed on 15 June 2021).
  4. Zrniü, N.; Hoffmann, K. Development of Design of Ship-To-Shore Container Cranes: 1959–2004. In International Symposium on History of Machines and Mechanisms; Springer: Dordrecht, The Netherlands, 2007. [Google Scholar] [CrossRef]
  5. Khoukhi, A.; Khalid, M.H. Hybrid computing techniques for fault detection and isolation, a review. Comput. Electr. Eng. 2015, 43, 17–32. [Google Scholar] [CrossRef]
  6. Saltzer, J.H.; Frans Kaashoek, M. 2.2: Faults, Failures, and Fault-Tolerant Design 2.2.1: Faults, Failures, and Modules. In Principles of Computer System Design; Massachusetts Institute of Technology LibreTexts: Davis, CA, USA, 2024; Chapter 2.2; pp. 1–461. Available online: https://eng.libretexts.org/@go/page/58498 (accessed on 19 July 2024).
  7. Safaei, M.M.; Hejazian, S.; Pedrammehr, S.; Pakzad, M.; Ettefagh, M.; Fotouhi, M. Damage Detection of Gantry Crane with a Moving Mass Using Artificial Neural Network. Buildings 2024, 14, 458. [Google Scholar] [CrossRef]
  8. Wang, Z.; Cheng, J.; Hu, H. A Proactive-Reactive-Based Approach for Continuous Berth Allocation and Quay Crane Assignment Problems with Hybrid Uncertainty. J. Mar. Sci. Eng. 2024, 12, 182. [Google Scholar] [CrossRef]
  9. Gattuso, D.; Pratico, F.G.; Longo, R.; Cassone, G.; Vigna, M.; Sceni, R. Rail operations in freight terminals: Safety issues and proposed methodology. In 5th IEEE International Conference on Models and Technologies for Intelligent Transportation Systems, MT-ITS 2017—Proceedings, Naples, Italy, 26–28 June 2017; Institute of Electrical and Electronics Engineers Inc.: Piscataway, NJ, USA, 2017; pp. 164–169. [Google Scholar] [CrossRef]
  10. Huang, M.; Liu, Z.; Tao, Y. Mechanical fault diagnosis and prediction in IoT based on multi-source sensing data fusion. Simul. Model. Pract. Theory 2020, 102, 101981. [Google Scholar] [CrossRef]
  11. Meddaoui, A.; Hain, M.; Hachmoud, A. The benefits of predictive maintenance in manufacturing excellence: A case study to establish reliable methods for predicting failures. Int. J. Adv. Manuf. Technol. 2023, 128, 3685–3690. [Google Scholar] [CrossRef]
  12. Fernandes, M.; Canito, A.; Bolón-Canedo, V.; Conceição, L.; Praça, I.; Marreiros, G. Data analysis and feature selection for predictive maintenance: A case-study in the metallurgic industry. Int. J. Inf. Manag. 2019, 46, 252–262. [Google Scholar] [CrossRef]
  13. Yeoh, J.K.W.; Wong, J.H.; Peng, L. Integrating Crane Information Models in BIM for Checking the Compliance of Lifting Plan Requirements. In Proceedings of the 33rd International Symposium on Automation and Robotics in Construction (ISARC 2016), Auburn, AL, USA, 18–21 July 2016; Available online: https://www.iaarc.org/publications/fulltext/ISARC2016-Paper192.pdf (accessed on 20 July 2024).
  14. Chu, F.; Gailus, S.; Liu, L.; Ni, L. The Future of Port Automation|McKinsey. 2018. Available online: https://www.mckinsey.com/industries/travel-logistics-and-infrastructure/our-insights/the-future-of-automated-ports (accessed on 18 May 2024).
  15. Lepenioti, K.; Pertselakis, M.; Bousdekis, A.; Louca, A.; Lampathaki, F.; Apostolou, D.; Mentzas, G.; Anastasiou, S. Machine Learning for Predictive and Prescriptive Analytics of Operational Data in Smart Manufacturing. In Advanced Information Systems Engineering Workshops; Springer: Cham, Switzerland, 2020. [Google Scholar] [CrossRef]
  16. What Is Deep Learning?|A Beginner’s Guide. Available online: https://www.scribbr.com/ai-tools/deep-learning/ (accessed on 19 May 2024).
  17. Zhao, R.; Yan, R.; Chen, Z.; Mao, K.; Wang, P.; Gao, R.X. Deep learning and its applications to machine health monitoring. Mech. Syst. Signal Process. 2019, 115, 213–237. [Google Scholar] [CrossRef]
  18. Kumar, A.; Gaur, N.; Chakravarty, S.; Alsharif, M.H.; Uthansakul, P.; Uthansakul, M. Analysis of spectrum sensing using deep learning algorithms: CNNs and RNNs. Ain Shams Eng. J. 2024, 15, 102505. [Google Scholar] [CrossRef]
  19. Ubal, C.; Di-Giorgi, G.; Contreras-Reyes, J.E.; Salas, R. Predicting the Long-Term Dependencies in Time Series Using Recurrent Artificial Neural Networks. Mach. Learn. Knowl. Extr. 2023, 5, 1340–1358. [Google Scholar] [CrossRef]
  20. Heilig, L.; Stahlbock, R.; Voß, S. From Digitalization to Data-Driven Decision Making in Container Terminals. arXiv 2019, arXiv:1904.13251. [Google Scholar]
  21. Shin, H.-S.; Lee, S.-P.; Ha, Y.-S.; Kim, H.-S. Designing container crane control learning model using deep learning. J. Adv. Mar. Eng. Technol. 2023, 47, 2023–2234. [Google Scholar] [CrossRef]
  22. Chalapathy, R.; Chawla, S. Deep Learning for Anomaly Detection: A Survey. arXiv 2019, arXiv:1901.03407. [Google Scholar]
  23. Shagluf, A.; Longstaff, A.P.; Fletcher, S. (PDF) Maintenance Strategies to Reduce Downtime Due to Machine Positional Errors, Maintenance Performance Measurement and Management (MPMM). Available online: https://www.researchgate.net/publication/267864966_Maintenance_Strategies_to_Reduce_Downtime_Due_to_Machine_Positional_Errors (accessed on 18 July 2024).
  24. Fernandes, M.; Corchado, J.M.; Marreiros, G. Machine learning techniques applied to mechanical fault diagnosis and fault prognosis in the context of real industrial manufacturing use-cases: A systematic literature review. Appl. Intell. 2022, 52, 14246–14280. [Google Scholar] [CrossRef] [PubMed]
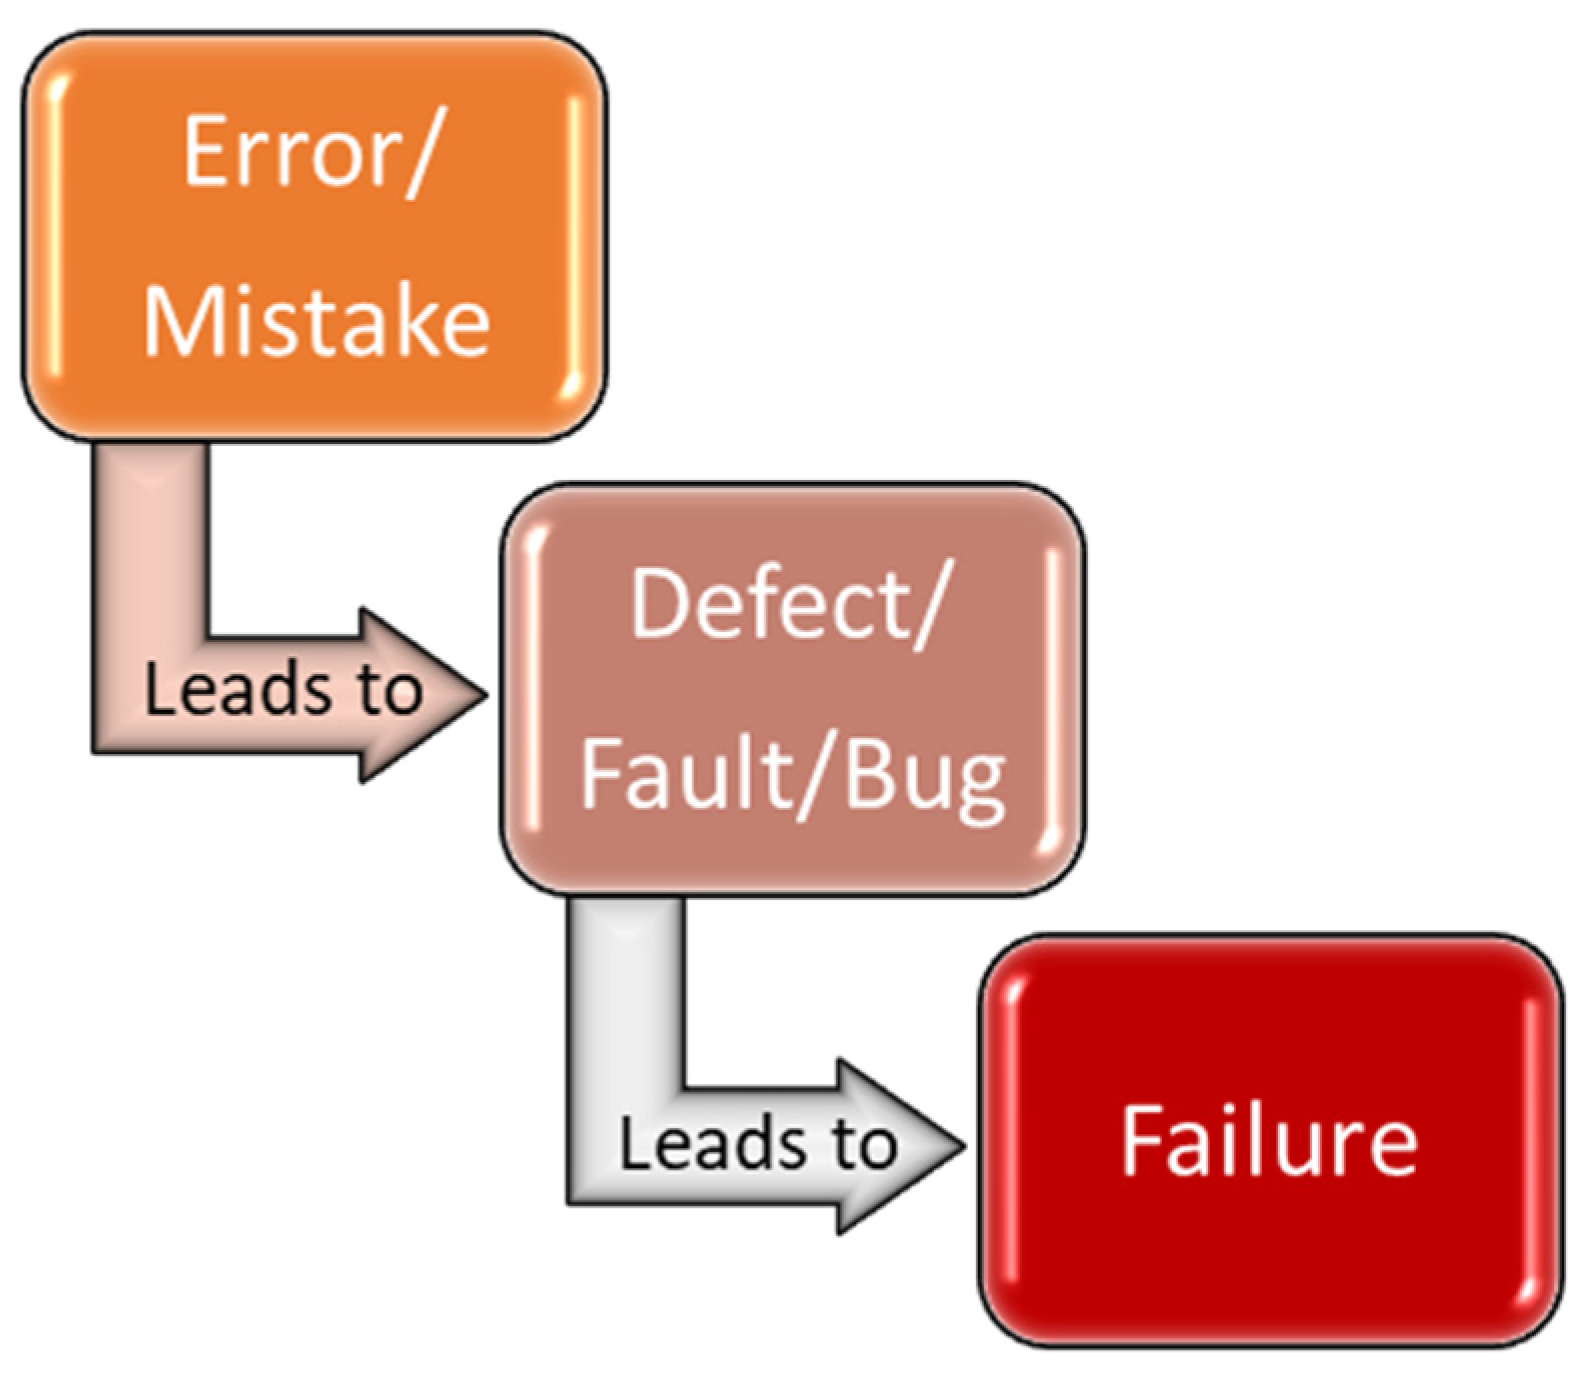
  25. Software Testing—Bug vs Defect vs Error vs Fault vs Failure—GeeksforGeeks. Available online: https://www.geeksforgeeks.org/software-testing-bug-vs-defect-vs-error-vs-fault-vs-failure/ (accessed on 22 April 2024).
  26. Jalayer, M.; Orsenigo, C.; Vercellis, C. Fault detection and diagnosis for rotating machinery: A model based on convolutional LSTM, Fast Fourier and continuous wavelet transforms. Comput. Ind. 2021, 125, 103378. [Google Scholar] [CrossRef]
  27. Zhao, R.; Yan, R.; Wang, J.; Mao, K. Learning to monitor machine health with convolutional Bi-directional LSTM networks. Sensors 2017, 17, 273. [Google Scholar] [CrossRef] [PubMed]
  28. Zrnic, N.; Petković, Z.; Bošnjak, S.M. Automation of ship-to-shore container cranes: A review of state-of-the-art. FME Transactions 2005, 33, 111–121. Available online: https://www.researchgate.net/publication/228936324_Automation_of_ship-to-shore_container_cranes_A_review_of_state-of-the-art (accessed on 24 March 2024).
  29. Tran, Q.H.; Huh, J.; Nguyen, V.B.; Kang, C.; Ahn, J.H.; Park, I.J. Sensitivity analysis for ship-to-shore container crane design. Appl. Sci. 2018, 8, 1667. [Google Scholar] [CrossRef]
  30. Li, Z. Deep Learning Driven Approaches for Predictive Maintenance A Framework of Intelligent Fault Diagnosis and Prognosis in the Industry 4.0 Era. Ph.D. Thesis, Norwegian University of Science and Technology, Trondheim, Norway, 2018. [Google Scholar]
  31. Goodfellow, I.; Bengio, Y.; Courville, A. 2015. Available online: http://www.deeplearningbook.org/ (accessed on 15 June 2024).
  32. Liu, W.; Xiao, J. A new method of detection the wear of crane rails and its error analysis. J. Mech. Strength 2014, 36, 878–883. Available online: https://www.researchgate.net/publication/293095272_A_new_method_of_detection_the_wear_of_crane_rails_and_its_error_analysis (accessed on 19 March 2024).
  33. Mohammadfam, I.; Borgheipour, H.; Tehrani, G.; Madadi, S. Identification and assessment of human errors among tower crane operators using SHERPA and CREAM techniques. J. Health Saf. Work. 2020, 10, 5–8. [Google Scholar]
  34. Jakovlev, S.; Eglynas, T.; Jusis, M.; Voznak, M.; Partila, P.; Tovarek, J. Detecting Physical Impacts to the Corners of Shipping Containers during Handling Operations Performed by Quay Cranes. J. Mar. Sci. Eng. 2023, 11, 794. [Google Scholar] [CrossRef]
  35. Gao, X.; Yeh, H.G.; Marayong, P. A high-speed color-based object detection algorithm for quayside crane operator assistance system. In Proceedings of the 11th Annual IEEE International Systems Conference, SysCon 2017—Proceedings, Montreal, QC, Canada, 24–27 April 2017. [Google Scholar] [CrossRef]
  36. Westerberg, S.; Shiriaev, A. Virtual Environment-Based Teleoperation of Forestry Machines: Designing Future Interaction Methods. J. Hum.-Robot. Interact. 2013, 2, 84–110. [Google Scholar] [CrossRef]
  37. Ren, W.; Wu, Z.; Zhang, L. Real-time planning of a lifting scheme in mobile crane mounted controllers. Can. J. Civ. Eng. 2016, 43, 542–552. [Google Scholar] [CrossRef]
  38. Watanabe, M.; Momoi, Y.; Odai, M.; Ieshige, K. Simultaneous estimation for rope tension and load of cranes using motor driving signals. Trans. JSME 2023, 89. [Google Scholar] [CrossRef]
  39. Lei, Z.; Behzadipour, S.; Al-Hussein, M.; Hermann, U. Application of robotic obstacle avoidance in crane lift path planning. In Proceedings of the 28th ISARC, Seoul, Republic of Korea, 29 June–2 July 2011. [Google Scholar]
  40. Lehner, P.; Křivý, V.; Krejsa, M.; Pařenica, P.; Kozák, J. Stochastic Service Life Prediction of Existing Steel Structure Loaded by Overhead Cranes. Procedia Struct. Integr. 2018, 13, 1539–1544. [Google Scholar] [CrossRef]
  41. Shang, K.C.; Tseng, W.J. A risk analysis of stevedoring operations in seaport container terminals. J. Mar. Sci. Technol. 2010, 18, 201–210. [Google Scholar] [CrossRef]
  42. Ismail, R.M.T.R.; That, N.D.; Ha, Q.P. Modelling and robust trajectory following for offshore container crane systems. Autom. Constr. 2015, 59, 179–187. [Google Scholar] [CrossRef]
  43. Liu, J.; Qin, X.; Sun, Y.; Zhang, Q. Response Prediction Model for Structures of Quayside Container Crane Based on Monitoring Data. J. Perform. Constr. Facil. 2021, 35. [Google Scholar] [CrossRef]
  44. Jo, J.H.; Kim, S. Key Performance Indicator Development for Ship-to-Shore Crane Performance Assessment in Container Terminal Operations. J. Mar. Sci. Eng. 2020, 8, 6. [Google Scholar] [CrossRef]
  45. Cheng, C.; Liu, X.; Zhou, B.; Yuan, Y. Intelligent Fault Diagnosis With Noisy Labels via Semisupervised Learning on Industrial Time Series. IEEE Trans. Ind. Inform. 2023, 19, 7724–7732. [Google Scholar] [CrossRef]
  46. Lee, X.Y.; Kumar, A.; Vidyaratne, L.; Rao, A.R.; Farahat, A.; Gupta, C. An ensemble of convolution-based methods for fault detection using vibration signals. In Proceedings of the 2023 IEEE International Conference on Prognostics and Health Management (ICPHM 2023), Montreal, QC, Canada, 5–7 June 2023; pp. 172–179. [Google Scholar] [CrossRef]
  47. Zhang, J.; Zhang, M.; Feng, Z.; Ruifang, L.V.; Lu, C.; Dai, Y.; Dong, L. Gated recurrent unit-enhanced deep convolutional neural network for real-time industrial process fault diagnosis. Process Saf. Environ. Prot. 2023, 175, 129–149. [Google Scholar] [CrossRef]
  48. How To Code RNN and LSTM Neural Networks in Python. Available online: https://www.nbshare.io/notebook/249468051/How-To-Code-RNN-and-LSTM-Neural-Networks-in-Python/ (accessed on 28 April 2022).
  49. Quiñones-Grueiro, M.; Llanes-Santiago, O.; Silva Neto, A.J. Fault Diagnosis in Industrial Systems. Stud. Syst. Decis. Control 2021, 309, 1–14. [Google Scholar] [CrossRef]
  50. Illustrated Guide to LSTM’s and GRU’s: A Step by Step Explanation|by Michael Phi|towards Data Science. Available online: https://towardsdatascience.com/illustrated-guide-to-lstms-and-gru-s-a-step-by-step-explanation-44e9eb85bf21 (accessed on 13 April 2021).
  51. Maheswaranathan, N.; Williams, A.H.; Golub, M.D.; Ganguli, S.; Sussillo, D. Reverse engineering recurrent networks for sentiment classification reveals line attractor dynamics. In Proceedings of the 33rd Conference on Neural Information Processing Systems (NeurIPS 2019), Vancouver, BC, Canada, 8–14 December 2019; pp. 15696–15705. [Google Scholar]
  52. Alizadeh, Z.; Yazdi, J.; Kim, J.H.; Al-Shamiri, A.K. Assessment of Machine Learning Techniques for Monthly Flow Prediction. Water 2018, 10, 1676. [Google Scholar] [CrossRef]
  53. Ahmad, J.; Tahir, A.; Larijani, H.; Ahmed, F.; Aziz Shah, S.; Hall, A.J.; Buchanan, W.J. Energy demand forecasting of buildings using random neural networks. J. Intell. Fuzzy Syst. 2020, 38, 4753–4765. [Google Scholar] [CrossRef]
  54. Li, S.; Li, W.; Member, S.; Cook, C.; Gao, Y. Deep Independently Recurrent Neural Network (IndRNN). arXiv 2019, arXiv:1910.06251v3. [Google Scholar]
  55. Abid, A.; Khan, M.T.; Iqbal, J. A review on fault detection and diagnosis techniques: Basics and beyond. Artif. Intell. Rev. 2021, 54, 3639–3664. [Google Scholar] [CrossRef]
  56. Shahin, M.; Chen, F.F.; Hosseinzadeh, A.; Zand, N. Using machine learning and deep learning algorithms for downtime minimization in manufacturing systems: An early failure detection diagnostic service. Int. J. Adv. Manuf. Technol. 2023, 128, 3857–3883. [Google Scholar] [CrossRef]
  57. Leite, D.; Martins, A.; Rativa, D.; De Oliveira, J.F.L.; Maciel, A.M.A. An Automated Machine Learning Approach for Real-Time Fault Detection and Diagnosis. Sensors 2022, 22, 6138. [Google Scholar] [CrossRef]
  58. Darban, Z.Z.; Webb, G.I.; Pan, S.; Aggarwal, C.C.; Salehi, M. Deep Learning for Time Series Anomaly Detection: A Survey. arXiv 2022, arXiv:2211.05244v2. [Google Scholar]
  59. Song, J.; Lee, Y.C.; Lee, J. Deep generative model with time series-image encoding for manufacturing fault detection in die casting process. J. Intell. Manuf. 2023, 34, 3001–3014. [Google Scholar] [CrossRef]
  60. Gui, X.; Zhang, J. Deep Metric Learning Model for Imbalanced Fault Diagnosis. arXiv 2021, arXiv:2107.03786. [Google Scholar]
  61. Liu, H.; Ma, R.; Li, D.; Yan, L.; Ma, Z. Machinery Fault Diagnosis Based on Deep Learning for Time Series Analysis and Knowledge Graphs. J. Signal Process. Syst. 2021, 93, 1433–1455. [Google Scholar] [CrossRef]
  62. Pang, J.L. Adaptive fault prediction and maintenance in production lines using deep learning. Int. J. Simul. Model. 2023, 22, 734–745. [Google Scholar] [CrossRef]
  63. Brownlee, J.; How to Calculate Correlation Between Variables in Python. Machine Learning Mastery. Available online: https://machinelearningmastery.com/how-to-use-correlation-to-understand-the-relationship-between-variables/ (accessed on 14 April 2022).
  64. Li, A. Human error risk prioritization in crane operations based on CPT and ICWGT. PLoS ONE 2024, 19, e0297120. [Google Scholar] [CrossRef] [PubMed]
  65. Eglynas, T.; Jusis, M.; Jakovlev, S.; Senulis, A.; Andziulis, A.; Gudas, S. Analysis of the efficiency of shipping containers handling/loading control methods and procedures. Adv. Mech. Eng. 2019, 11. [Google Scholar] [CrossRef]
  66. Maboudi, M.; Alamouri, A.; De Arriba López, V.; Bajauri, M.S.; Berger, C.; Gerke, M. Drone-Based Container Crane Inspection: Concept, Challenges And Preliminary Results. ISPRS Ann. Photogramm. Remote Sens. Spatial Inf. Sci. 2021, V-1-2021, 121–128. [Google Scholar] [CrossRef]
  67. Shan, J.; Zhang, M.; Zhang, D.; Zhou, X.; Li, H.; Wang, B. Container Cranes. In Handbook of Port Machinery; Springer: Singapore, 2024; pp. 451–678. [Google Scholar] [CrossRef]
  68. Viellechner, A.; Spinler, S. Novel Data Analytics Meets Conventional Container Shipping: Predicting Delays by Comparing Various Machine Learning Algorithms. Available online: https://hdl.handle.net/10125/63897 (accessed on 12 June 2024).
  69. Tian, X.; Yan, R.; Liu, Y.; Wang, S. A smart predict-then-optimize method for targeted and cost-effective maritime transportation. Transp. Res. Part B Methodol. 2023, 172, 32–52. [Google Scholar] [CrossRef]
  70. Handling Imbalanced Data for Classification—GeeksforGeeks. Available online: https://www.geeksforgeeks.org/handling-imbalanced-data-for-classification/ (accessed on 12 June 2024).
Figure 1. Research paper workflow.
Algorithms 17 00333 g001
Figure 2. Error as a precursor to failures [25].
Algorithms 17 00333 g002
Figure 3. Custom-built algorithm flowchart based on SMOTE and LSTM.
Algorithms 17 00333 g003
Figure 4. Covariance.
Algorithms 17 00333 g004
Figure 5. Pearson’s correlation.
Algorithms 17 00333 g005
Figure 6. Spearman correlation.
Algorithms 17 00333 g006
Figure 7. Kendall correlation.
Algorithms 17 00333 g007
Figure 8. The training and test loss function.
Algorithms 17 00333 g008
Figure 9. The confusion matrix.
Algorithms 17 00333 g009
Figure 10. Evaluation metrics results.
Algorithms 17 00333 g010
Table 1. Machine learning methodologies.
MethodologyDescriptionReference
Fault Detection and Diagnosis (FDD)These methodologies detect emerging irregularities and predict their consequences for the system’s behaviour.[55]
Data-Driven Fault DiagnosisThis approach uses machine learning algorithms for mechanical fault detection or fault prognosis in manufacturing equipment.[24]
An array of ML, DL, and DHL AlgorithmsThese algorithms can potentially perform early fault detection that would lead to future machine failure.[56]
Automated Machine Learning ApproachThis approach is used for real-time fault detection and diagnosis in discrete manufacturing machines.[57]
Table 2. Deep Learning Methodologies.
MethodologyDescriptionReference
Deep Learning for Time Series Anomaly DetectionThis approach uses specialised deep learning models for detecting anomalous patterns in time series data.[58]
Deep Generative ModelsVariational autoencoder reconstruction along the projection pathway (VAE-RaPP) and a fence generative adversarial network (Fence GAN) are used to deal with imbalanced time series data obtained from manufacturing applications.[59]
Deep Metric Learning ModelThis model considers imbalanced fault data and a quadruplet data pair design manner.[60]
ATT-1D CNN-GRU ModelThis model combines a one-dimensional CNN, GRU, attention mechanism, and KG (knowledge graph) for fault diagnosis.[61]
Deep-Learning-Based Adaptive Fault PredictionThis approach integrates a comprehensive convolutional feature extraction module, a customised gating module, and a multi-layered progressive extraction module.[62]
Table 3. Predicted error data.
Timestampvar_831
12/11/2020 20:350
12/11/2020 20:350
12/11/2020 20:350
12/11/2020 20:350
12/11/2020 20:350
12/11/2020 20:350
12/11/2020 20:350
12/11/2020 20:350
12/11/2020 20:350
12/11/2020 20:350
12/11/2020 20:350
12/11/2020 20:350
12/11/2020 20:350
12/11/2020 20:350
12/11/2020 20:350
12/11/2020 20:350
12/11/2020 20:350
12/11/2020 20:350
12/11/2020 20:350
12/11/2020 20:350
12/11/2020 20:351
12/11/2020 20:351
12/11/2020 20:351
12/11/2020 20:350
12/11/2020 20:350
12/11/2020 20:350
12/11/2020 20:350
12/11/2020 20:351
12/11/2020 20:351
12/11/2020 20:351
12/11/2020 20:361
12/11/2020 20:361
12/11/2020 20:360
12/11/2020 20:360
12/11/2020 20:360
12/11/2020 20:360
12/11/2020 20:361
12/11/2020 20:361
12/11/2020 20:361
12/11/2020 20:361
12/11/2020 20:361
12/11/2020 20:360
12/11/2020 20:360
12/11/2020 20:360
12/11/2020 20:360
12/11/2020 20:360
12/11/2020 20:360
12/11/2020 20:360
12/11/2020 20:360
12/11/2020 20:360
12/11/2020 20:360
12/11/2020 20:360
12/11/2020 20:360
12/11/2020 20:360
12/11/2020 20:360
12/11/2020 20:360
12/11/2020 20:360
12/11/2020 20:360
12/11/2020 20:360
12/11/2020 20:360
Disclaimer/Publisher’s Note: The statements, opinions and data contained in all publications are solely those of the individual author(s) and contributor(s) and not of MDPI and/or the editor(s). MDPI and/or the editor(s) disclaim responsibility for any injury to people or property resulting from any ideas, methods, instructions or products referred to in the content.

