Abstract
Semantic segmentation of medical images holds significant potential for enhancing diagnostic and surgical procedures. Radiology specialists can benefit from automated segmentation tools that facilitate identifying and isolating regions of interest in medical scans. Nevertheless, to obtain precise results, sophisticated deep learning models tailored to this specific task must be developed and trained, a capability not universally accessible. Segment Anything Model (SAM) 2 is a foundational model designed for image and video segmentation tasks, built on its predecessor, SAM. This paper introduces a novel approach leveraging SAM 2’s video segmentation capabilities to reduce the prompts required to segment an entire volume of medical images. The study first compares SAM and SAM 2’s performance in medical image segmentation. Evaluation metrics such as the Jaccard index and Dice score are used to measure precision and segmentation quality. Then, our novel approach is introduced. Statistical tests include comparing precision gains and computational efficiency, focusing on the trade-off between resource use and segmentation time. The results show that SAM 2 achieves an average improvement of 1.76% in the Jaccard index and 1.49% in the Dice score compared to SAM, albeit with a ten-fold increase in segmentation time. Our novel approach to segmentation reduces the number of prompts needed to segment a volume of medical images by 99.95%. We demonstrate that it is possible to segment all the slices of a volume and, even more, of a whole dataset, with a single prompt, achieving results comparable to those obtained by state-of-the-art models explicitly trained for this task. Our approach simplifies the segmentation process, allowing specialists to devote more time to other tasks. The hardware and personnel requirements to obtain these results are much lower than those needed to train a deep learning model from scratch or to modify the behavior of an existing one using model modification techniques.
1. Introduction
Image segmentation is a crucial problem in the field of computer vision [1]. The objective is to partition an image into meaningful segments, each corresponding to different objects or regions of interest within the image. This task involves classifying every pixel in an image to its corresponding category, thus enabling more detailed analysis and interpretation of visual data. Image segmentation is fundamental in various applications, such as object detection, scene understanding, and automated image editing.
The segmentation problem becomes even more critical in medical imaging due to its potential impact on patient care. Medical image segmentation involves identifying and isolating regions of interest in images obtained from medical scans, such as X-rays, Magnetic Resonance Imaging (MRI), Computed Tomography (CT), or ultrasound. These regions may correspond to anatomical structures, pathological areas, or other clinically relevant features. Accurate segmentation in medical images is essential for tasks such as tumor detection, organ delineation, and treatment planning. Advances in medical image segmentation, often driven by deep learning techniques, are paving the way for more accurate and efficient diagnostic tools, ultimately enhancing the quality of patient care [2,3,4]. While deep learning techniques are highly effective for various tasks, including image segmentation, training, and fine-tuning, they require substantial computational and personnel resources [5]. Furthermore, the time needed to achieve functional results is considerable. However, medical cost prediction is essential in the current healthcare environment, where resources are limited, and the demand for medical services is increasing [6].
In 2023, Meta (https://ai.facebook.com/, accessed on 6 March 2025) introduced SAM, a foundational model designed for image segmentation tasks [7]. Since its release, SAM has been the focus of multiple research efforts. In 2024, Meta took this breakthrough model a step further with the release of SAM 2 [8]. Also, as a foundation model, SAM 2’s main advantage over its predecessor is its ability to extend segmentation capabilities to video. This is achieved through a memory module that enables the model to track objects across frames, processing the individual images that make up a video. As with SAM, Meta continues its commitment to the open-source community by publicly releasing both the SAM 2 model and its corresponding dataset. They are distributed under the Apache License, which permits users to freely use, modify, and share the software, even for commercial purposes, provided that proper attribution is given and license notices are preserved.
In our previous work [9], we demonstrated that the results of a foundation model like SAM can be substantially improved by applying techniques that do not require significant computational power, dedicated teams of experts, or massive additional datasets. Combining the model’s capabilities with a novel prompting technique, we were able to segment medical images with a minimum number of prompts, achieving results comparable to those obtained by state-of-the-art models explicitly trained for this task. We had to provide prompts for all the slices of a medical image volume. If the volume contained 250 slices, SAM needed a prompt for each. Although prompts can be automatically generated, they depend on the geometric characteristics of the object to be segmented, so the prompt generation algorithm needs to be adapted to every segmentation target (organ or lesion). This task has development and maintenance costs, as the results need to be monitored to ensure the quality of the generated prompts, and the algorithm needs to be updated if the results are not satisfactory. Specialists could manually provide prompts, but this also has personnel costs. We intend to drastically reduce all those costs by providing a library of prototypical prompts for every segmentation task so we can let the specialists devote their time to other, more critical tasks since the segmentation process is considerably simplified. In addition, the hardware and personnel requirements to obtain these results are much lower than those needed to train a deep learning model from scratch or to modify the behavior of an existing one using model modification techniques. These results would go even further if, instead of segmenting all the slices of a volume, it was sufficient to segment just one slice, and the model would propagate the segmentation to the rest of the slices.
In this paper, we try to answer two main research questions: (1) how much, if anything, does SAM 2 improve the performance of SAM in the medical image segmentation tasks? (2) Can we leverage SAM 2 video segmentation capabilities for medical image segmentation to reduce further the number of prompts needed to segment a volume of medical images? Since the publication of SAM, the scientific community has been interested in its performance in medical image segmentation tasks. Many papers have been published investigating its performance in this field. Studying the differences between SAM and SAM 2 when segmenting medical images can be a fundamental resource that other researchers can use to determine whether or not to use this new version in their research, given the vast amount of effort applied to build on SAM’s segmentation capabilities in this direction. Before exploring whether we can leverage SAM 2’s video segmentation capabilities to reduce the number of prompts needed to segment medical image volumes, we must first determine whether SAM 2 performs at least as well as SAM in the medical image segmentation task. If SAM 2 does not offer performance improvements, investigating its video segmentation capabilities would be irrelevant. While a comprehensive, modality-specific performance analysis of SAM 2 is beyond the scope of this study, we also include an exploratory evaluation that offers initial insights into its applicability and effectiveness across different imaging modalities and anatomical regions.
The structure of this paper is organized as follows. In Section 2, we review the related works that have been published on the topic of medical image segmentation using SAM and compare them with our approach. Section 3 details the methodology behind our experiments, including the datasets utilized, the operation of segmentation with SAM 2, the preprocessing steps applied to images and videos, the data inputs required by SAM 2, and the metrics employed to evaluate segmentation quality. Section 4 compares the experimental results obtained using SAM and SAM 2 and assesses the new segmentation technique’s performance. These findings are further discussed in Section 5, where specific aspects and nuances are explored in greater depth. Finally, Section 6 offers an in-depth analysis of the results and proposes potential directions for future research.
2. Related Works
In [10], the authors presented MedSAM, a fine-tuned SAM model for medical image segmentation that outperforms the default model in 3D and 2D. The Medical SAM Adapter (Med-SA), introduced in [11], enhances SAM specifically for medical image segmentation by incorporating domain-specific medical knowledge and a light adaptation technique. Such is the interest in the application of SAM to the field of medical image segmentation that [12] focuses on presenting a comprehensive overview of the efforts applied to improve the efficacy of SAM in said task. This model was later extended in 2024 with the release of SAM 2, an advanced version capable of segmenting images and videos [8].
Foundation models like SAM are trained on vast datasets. They are versatile tools that can be integrated into various tasks across domains. A notable feature of this kind of model is its zero-shot transfer capability, which allows it to perform segmentation in domains for which it was not explicitly trained [13]. The strength of these models lies in their ability to generalize across tasks, thanks to the extensive training data and the model’s capacity to learn abstract features and latent representations, enabling the model to execute tasks accurately, even when encountering previously unseen data. However, each time the specialist needs to segment an image using these tools, there is an inherited cost associated with prompting the same object every time. In the particular case of the medical image segmentation task, this is a downside, as specialist time is a scarce and valuable resource in this domain. This work aims to reduce specialist effort as much as possible.
Wu et al. [14] propose a “One-Prompt Segmentation” paradigm that bridges interactive and one-shot methods for medical image segmentation. Their approach utilizes a single prompted image to generalize segmentation across unseen tasks without requiring retraining. This is achieved through the integration of a “One-Prompt Former”, a module designed to efficiently incorporate template features into the segmentation process. Trained on 64 medical datasets and evaluated on 14 unseen datasets, the method demonstrates robust generalization capabilities. However, its reliance on four distinct prompt types (clicks, bounding boxes, doodles, and segmentation masks) for different anatomical structures necessitates user interaction for each dataset, potentially increasing the complexity of clinical deployment.
SAM 2 has attracted considerable interest in the field of medical image segmentation. It has been applied to achieve remarkable results in the segmentation of complex anatomical structures like ocular CT scans, as demonstrated by [15], and in liver CT images [16]. Both studies utilized refined medical SAM 2 models to achieve these advancements. Medical SAM 2 was introduced by Zhu et al. [17]. It leverages SAM 2’s video segmentation framework to process medical imaging data, including unordered 2D slices and 3D volumes. The key innovation lies in a self-sorting memory bank that dynamically selects and organizes embeddings based on confidence scores and dissimilarity measures. This mechanism enhances segmentation consistency and generalization by prioritizing the most informative embeddings, irrespective of their temporal order. The framework achieves significant performance gains across a wide range of benchmarks.
In contrast, our method avoids user-dependent prompt customization, as seen in [14], and complex memory mechanisms, as in [17]. Instead, we employ a single, generalized prompt per dataset, effectively minimizing user interaction while maintaining strong segmentation performance across diverse datasets. By structuring medical volumes as bidirectional, video-like sequences rather than ordering frames based on embedding scores or dissimilarity measures, we leverage SAM 2’s capabilities without incurring excessive computational demands. This approach strikes a pragmatic balance between segmentation quality and generalization for clinical applications. Additionally, our automated prompt generation is tailored to specific tasks using an example image frame and its associated mask, further reducing the need for manual intervention.
3. Methods
3.1. Experimental Setup
In order to answer the research questions, a series of tests have to be carried out. All the tests use the same setup to ensure a fair comparison between the models. The experiments run on an Acer Predator Helios 300 laptop (Acer Inc., New Taipei City, Taiwan) with a 12-core Intel Core i7-10750H 2.60 GHz CPU, 32 GB of RAM, and an NVIDIA GeForce RTX 2070 GPU with 8 GB of GDDR6 memory. The laptop runs Windows 11 with Ubuntu 24.04 LTS via Windows Subsystem for Linux (WSL). It has Python 3.12.4, PyTorch 2.3.1, and CUDA 12.1.0 installed. The experiments use the same configuration for both models to maintain consistency and fairness in the comparison.
We intentionally chose a consumer laptop instead of a high-end computing system to evaluate the models’ performance in a real-world scenario that is more accessible to general users, particularly to medical professionals who work with systems featuring diverse hardware configurations depending on the specific hospital or healthcare facility. This decision allows us to assess whether these models can be efficiently deployed on consumer-grade hardware, which is crucial for wider adoption in practical settings. Furthermore, considering that medical images contain sensitive patient data, it is essential to ensure that segmentation processes can be executed on dedicated medical hardware systems. By using a typical consumer laptop, we aim to demonstrate the feasibility of running advanced medical image segmentation models on affordable and widely available equipment rather than on specialized servers that may not be as readily accessible.
Different pre-trained checkpoints are available for each model. Table 1 contains the names of the models and their respective sizes for reference, with the chosen models’ checkpoints in bold. The greater the size of the model, the better it performs. The choice to test SAM is ViT-L, as the laptop’s GPU cannot load the ViT-H checkpoints due to its GPU memory limitations. However, in the case of SAM 2, the large version of the model can run without problems. Although the test machine cannot run the best version of SAM, it can run the best version of SAM 2. Note that the best SAM 2 model size is 28.14% smaller than the best SAM model and 64.99% smaller than the one used for the comparison.

Table 1.
Model checkpoint sizes (chosen checkpoints in bold).
3.2. Datasets
To assess SAM 2’s performance in segmenting medical images, compare it with the original SAM, and test our proposed approach to medical image segmentation, we selected two widely recognized public lung datasets, one comprising axial lung scans and the other containing frontal chest X-rays, ensuring representation of both image modalities in our experiments. These datasets were chosen due to their accessibility, publication status, and frequent use in previous scientific studies, underscoring their significance in comparative research. Furthermore, they are the same datasets used in our previous work [9], allowing for a direct comparison between the models. Image dimensions are described in width × height.
Both datasets provide lung masks verified by radiology specialists, ensuring the availability of well-labeled data for research. The first dataset (COVID-19) includes 20 axial lung scans [18], divided into two subsets: Coronacases (see Figure 1a) and Radiopaedia (see Figure 1b). The quality of the CT slices in the Coronacases subset is superior to that of the Radiopaedia subset, the latter being composed of cone beam CTs with lower resolution, hence the disparity in quality. Moreover, while the Coronacases subset consists exclusively of 512 × 512 slices, the Radiopaedia subset is more varied, including 829,630 × 630 slices and 110,630 × 401 slices. Coronacase CT scans in this dataset average slices, while Radiopaedia averages , providing 3520 slices for evaluating SAM 2’s performance. This dataset is also utilized to evaluate the performance of DMDF-Net, as reported by Owais et al. [19]. The differences between these two kinds of CT make them ideal for a separate study so that they will be treated as different datasets during this work.

Figure 1.
Prediction examples (yellow box: target location; green circles: lung centers; red circle: background).
The second dataset (Montgomery) comprises 138 frontal chest X-rays [20], provided in Portable Network Graphics (PNG) format, along with corresponding left and right lung masks (see Figure 1c). Chen et al. [21] used this dataset, referred to as Montgomery after the collection site in Montgomery County, MD, USA, to evaluate the performance of TransAttUnet. This dataset contains 414,892 × 4020 slices and 4020 × 4892 slices.
Dataset Diversity
A well-defined evaluation dataset is essential for ensuring unbiased and generalizable results. This section addresses potential concerns regarding dataset diversity by detailing the representativeness of the test data, including variations in patient demographics and disease types, while also providing a comprehensive description of the data sources.
The COVID-19 dataset [18] is derived from the volumes folder (https://academictorrents.com/details/136ffddd0959108becb2b3a86630bec049fcb0ff, accessed on 6 March 2025) within the COVID-19 image dataset collection [22]. Its primary contribution lies in providing high-quality labels for objects of interest created by experienced radiologists. The data sources are detailed in [22] and include reputable platforms such as Radiopaedia (https://radiopaedia.org/, accessed on 6 March 2025) and Coronacases (https://coronacases.org/, accessed on 6 March 2025). As its name suggests, the dataset specifically includes COVID-19 cases.
The Montgomery dataset [20] was collected in collaboration with the Department of Health and Human Services, Montgomery County, MD, USA. In addition to medical images, the dataset authors provide manually segmented lung masks. These segmentations were performed under the supervision of a radiologist, following anatomical landmarks. The dataset includes tuberculosis cases from a screening program conducted in Montgomery County.
Although both datasets are anonymized to protect patient privacy, their curators have provided certain demographic information. Figure 2 shows the sex and age distribution for these datasets.

Figure 2.
Sex and age distribution in COVID-19 and Montgomery datasets.
The sex distribution in the COVID-19 and Montgomery datasets is not perfectly balanced but remains relatively close to an even split, according to the data provided in their respective publications. Specifically, the COVID-19 dataset consists of 61.90% male and 38.10% female cases, while the Montgomery dataset includes 45.99% male and 54.01% female cases.
The age distribution in the COVID-19 dataset is skewed toward middle-aged and older individuals, with samples between 25 and 80 years old and prominent peaks around 40, 50, and 70 years old. This suggests a focus on conditions prevalent in middle-aged and elderly populations. In contrast, the Montgomery dataset exhibits a broader and more evenly distributed age range, spanning from young (10s and 20s) to elderly individuals (80s and 90s). The distribution shows noticeable peaks around 30 and 55 years old, indicating a more balanced representation across different age groups. While the COVID-19 dataset is particularly suited for studying diseases that predominantly affect middle-aged and older adults, the Montgomery dataset allows for broader generalization across diverse age demographics.
3.3. Comparison Between SAM and SAM 2
SAM [7], a foundation model developed by Meta AI Research, is designed to segment all distinct objects in an image without user interaction. Its architecture is depicted in Figure 3a. The model employs an autonomous segmentation approach to generate masks that delineate objects within the image. However, SAM also supports flexible prompts, such as point coordinates or bounding boxes, to refine segmentation results. These prompts do not crop the input image but rather guide the model’s attention to specific regions, enabling iterative refinements based on user input.

Figure 3.
SAM [7] vs. SAM 2 [8] architecture.
SAM 2 [8] builds upon the success of its predecessor, SAM, by extending segmentation capabilities to video. Its architecture is depicted in Figure 3b. The model initially identifies and segments objects in the first frame of a video based on user-provided prompts, generating a set of masks for each identifiable object. These prompts may include point coordinates or bounding boxes that indicate where the target object is likely located (positive points for the foreground) or where it is absent (negative points for the background). Notably, the bounding box does not crop the input image but instead guides the model’s focus. This process can be iteratively refined until the segmentation results are satisfactory. Once the desired segmentation is achieved in the first frame, SAM 2 propagates these prompts across the video, enabling object tracking in subsequent frames. The model retains the flexibility of various prompt types, ensuring an interactive experience that enhances precision and adaptability.
The primary architectural difference between SAM and SAM 2 stems from the distinct tasks they are designed to address: SAM segments objects in static images, whereas SAM 2 extends segmentation across video frames. While SAM focuses solely on image segmentation, SAM 2 introduces a temporal component, allowing it to process a sequence of images, effectively forming a video. To capture the relationships between frames, the memory encoder’s output is stored in a memory bank. This memory bank, together with a memory attention mechanism, maintains object segmentation continuity across frames. In addition to generating segmentation masks, SAM estimates a confidence score for its results based on the Jaccard index. When SAM 2 tracks objects across frames, it further provides an estimated occlusion score for each detected object, enhancing its ability to handle object persistence and visibility changes.
Given an input image, SAM 2 is capable of autonomously identifying and segmenting the various elements it contains. This process produces a series of masks, each corresponding to a potential object within the image. These masks may overlap when multiple candidate regions are present. Alternatively, users can guide the segmentation using flexible prompts, which help refine the results. These prompts can consist of point coordinates or bounding boxes indicating where the target object is located (positive prompts or foreground) or where it is not (negative prompts or background). Importantly, the bounding box does not crop the image; it merely instructs SAM 2 where to focus its attention.
In this study, the selected prompting approach combines minimal point coordinates within a bounding box. This method is intended to simulate an interactive tool where a specialist might begin by drawing a bounding box around the lungs, then marking the areas to be segmented (i.e., the lungs), and finally, indicating parts of the background to be excluded. Figure 1 illustrates two examples of this approach using different CT slices: one from each subset of the selected dataset (Coronacases and Radiopaedia) and a chest X-ray. The orange box encompasses all the masks generated for the current slice. The green circles denote a point near the center of each lung. In contrast, the red circle identifies the background, indicating a region that should not be considered part of the lungs.
3.4. Image Processing
The datasets utilized in this study consist of medical images in various formats. Even when the formats overlap, the characteristics of each sample differ. This section examines the unique attributes of each dataset. It outlines the necessary steps to standardize them into a standard format.
CT scans and corresponding masks in the CT dataset are stored in Neuroimaging Informatics Technology Initiative (NIfTI) format (https://nifti.nimh.nih.gov/, accessed on 6 March 2025). Since SAM cannot process this format directly, it is first converted to a more suitable format for this study.
Each CT scan comprises multiple slices representing axial samples taken from the patient. Each slice consists of values arranged in a two-dimensional matrix of rows and columns. These values, known as Hounsfield Units (HUs), indicate the attenuation of X-rays as they pass through different materials, with distilled water serving as the reference [23]. The values typically range from . Depending on the anatomical region under study and the nature of the tissues involved, a contrast enhancement technique known as windowing [24] may be beneficial. This process requires knowledge of the window’s width and level. The window width determines which attenuation values are of interest, while the window level specifies the center of the window. When windowing is applied, all values below and above the specified width are disregarded. In the dataset used, the Coronacases CT volumes have not been windowed, whereas the Radiopaedia volumes have already undergone this process. Therefore, the Coronacases volumes are appropriately windowed to ensure consistency across the dataset. Finally, all CT slices are converted to grayscale, with each pixel assigned a value between 0 and 255.
In contrast, X-rays do not utilize HUs. Instead, they produce images in which the brightness or darkness of the pixels reflects the degree of X-ray absorption by different tissues. Consequently, no preprocessing steps are required for the chest X-ray dataset.
At this point, all images are in a standardized format and ready for further processing by the original SAM but not yet by SAM 2.
3.5. Video Processing
Unlike the original SAM, which processed each image independently, SAM 2 can process videos. However, video processing is carried out in a particular way. To allow SAM 2 to process a video, it must first be converted into a sequence of independent frames. This means the model operates on a series of individual images that happen to be temporally ordered. The user is responsible for converting the video file into independent frames in JPEG or PNG format. The key difference is that SAM 2, unlike the previous version of the model, includes a memory module that keeps track of segmentations from previous frames, allowing it to improve the segmentation of the current one. Ultimately, this enables SAM 2 to track objects throughout a scene.
A video is a sequence of images, each representing a frame. The frames have a temporal relation, as they are shown in succession. In the medical imaging domain, a volume is a sequence of slices, each representing a frame. Although there is no temporal relation between the slices, there is a spatial relation, as they are part of the same volume. This spatial relation can be transformed into a temporal one if the initial slice is considered the first frame of the video, the second slice the second frame, and so on. This transformation allows us to take advantage of SAM 2’s memory and try to reduce the number of prompts needed to segment a volume.
Figure 4a shows a summary of the proposed prompt reduction process. For reference, Figure 4b shows a summary of the segmentation process proposed in our previous work [9], using SAM instead of SAM 2. The first step is to convert the different frames of the video to be segmented to the Joint Photographic Experts Group (JPEG) format. The second step is dividing the video into two parts, using what we have called a seed frame. If given the chance to choose a single slice as the best representation of a whole volume, the specialist would likely select one of the central slices. The slices closer to the start and end of the volume are less likely to contain the organ to be segmented in its entirety. For the tests performed in this study, we are choosing the central slice of the volume as the seed frame. Given the dataset’s characteristics, would this choice be the most appropriate? To answer this question, we analyze the spatial distribution of the Jaccard Index and Dice Score for the Coronacases and Radiopaedia datasets using SAM, as the outcomes of this analysis will be used to support the selection of the middle slice as the seed for the SAM 2 video segmentation process. The results can be seen in Figure 5. The X-axis represents the normalized slice position, as each volume has a different number of slices. The Y-axis represents the metric value (Jaccard Index or Dice Score) for the given dataset. The average metric value is marked with a red dotted line, while the position of the central slice is marked with a vertical solid blue line. The 1% percentile of the metric is marked with an orange range, while the 2% percentile is marked with a yellow range. In the Coronacases dataset, any slice inside the 1% percentile of the metric would be a good candidate, making it an appropriate choice for the seed frame. In this case, the central slice is inside that range. On the other hand, the Radiopaedia dataset shows different behavior. The 1% percentile of the metric is displaced to the right of the center slice because of the dataset’s characteristics. However, the central slice is still inside the 2% percentile of the metric, making it a good candidate for the seed frame.

Figure 4.
Proposed segmentation process. (a) Proposed segmentation process using SAM 2. (b) Previously proposed segmentation process using SAM [9].

Figure 5.
Spatial distribution of segmentation metrics using SAM, with emphasis on the central slice.
We will make the central slice shared by both halves of the video, and it will be the first frame. Using this seed frame and moving backward through the volume’s slices, we create the first half of the video that SAM 2 will process. Similarly, by moving forward in time, we create the second half of the video. In this way, SAM 2 can use the memory of the segmentation of previous slices to improve the current slice segmentation.
Our prompting algorithm [9] selects the prompt to segment the seed frame. The selection process for determining prompt points begins with identifying the contours within the mask. Initially, a bounding box encompassing all mask contours for the seed frame is established, followed by identifying the centroid of each mask contour. However, due to the irregular shape of the lungs, the centroid may occasionally fall outside the mask boundary. To address this, the centroid is adjusted by using it as a seed to find intersections on the X and Y axes with the mask. The centroid is then repositioned to the intersection’s midpoint, which contains the most points, ensuring it is placed within the mask. This adjustment is applied even when the centroid is inside the mask to ensure it is more accurately centered within the corresponding mask. A negative prompt is also included, representing the center of the frame. Once segmented, SAM 2 can propagate the segmentation to the rest of the frames of the two halves of the video.
In the case of the Montgomery dataset samples, there is no temporal relation between the slices since they are independent chest radiographs belonging to different patients. However, there is a spatial relation since the nature of these samples is similar. In this case, we can also take advantage of SAM 2 memory to improve the segmentation of the radiographs.
Assuming a folder with the slices in JPEG format exists, alg:videoprocessing shows the algorithm for dividing the slices into two parts, selecting the seed, adding the prompts needed for the seed frame, propagating them to the rest of the slices, and combining the results.
3.6. Metrics
The effectiveness of SAM 2’s segmentation results will be evaluated using the Jaccard index () Equation (1) and the Dice score () Equation (2). These metrics are widely employed to assess the similarity between A and B images.
Müller et al. [25] argue that both the Jaccard index and the Dice score are reliable and accurate metrics for evaluating the automatic segmentation of medical images. The Dice score offers a balanced perspective by considering both recall and precision. At the same time, the Jaccard index imposes a stricter penalty for under- or over-segmentation, making it particularly valuable when a high level of segmentation accuracy is essential. More information about these metrics can be found in [9].
| Algorithm 1 Video processing algorithm. |
| Require: Require: |
| function SplitVideo() |
| copy frames 0 to to |
| reverse frame order in |
| copy frames to end to |
| end function |
| function ProcessVideo() |
| segment with |
| propagate segmentation through |
| save results |
| end function |
| function JoinResults(, ) |
| reverse results order in |
| delete results in |
| join and |
| end function |
4. Results
This section presents the results of the experiments conducted to answer the research questions posed in this work: (1) how much, if anything, does SAM 2 improve the performance of SAM in medical image segmentation tasks? (2) Can we leverage SAM 2 video segmentation capabilities for medical image segmentation to reduce further the number of prompts needed to segment a volume of medical images? Each of these research questions is addressed in a separate subsection.
4.1. SAM vs. SAM 2
SAM 2 is a generalization of SAM to the video domain. It processes video frames one at a time. It has a memory attention module that provides access to the previous memories of the target object. When applied to images, the memory is empty, and the model behaves like SAM. In another paper [8], the authors claim that SAM 2 delivers better performance under said conditions than SAM on image segmentation benchmarks while being six times faster. We want to test if SAM 2 can also improve the performance of SAM on medical image segmentation tasks, comparing both models on the same datasets we used in our previous work [9].
4.1.1. Segmentation Performance
A comparison across the three datasets used in our previous work is shown in Figure 6.

Figure 6.
Segmentation comparison (Owais et al. [19], Chen et al. [21]).
The results show that SAM 2 outperforms SAM in all cases. The improvement is more significant in the Radiopaedia dataset, where the average Jaccard index increases by 1.76% and the average Dice score by 1.49%. In the Coronacases dataset, the improvement is similar, with the Jaccard index increasing by 1.39% and the Dice score by 1.08%. The Montgomery dataset shows a more modest improvement, at most half a percentage point in both metrics.
However, the improvement is most notable in the results’ distribution. Figure 6 shows that average values are closer to the median in each case, and the variance is lower, which means that SAM 2 is more consistent in its performance than SAM. Table 2 confirms it, showing that the standard deviation is lower for SAM 2 in all cases.
Table 2.
SAM 2’s segmentation results (delta from SAM).
In Table 3, the performance of various state-of-the-art Deep Learning (DL) models in the lung segmentation task is compared with that of SAM 2. The results of SAM are also included for reference. The performance reported by Owais et al. [19] was obtained using the same CT dataset as in this study. Their DMDF-Net achieved a Jaccard index of 97.38% and a Dice score of 98.66%, whereas SAM 2 obtained a Jaccard index of 92.66% and a Dice score of 95.96%. Similarly, Chen et al. [21] used the same X-ray dataset as this work. Their TransAttUnet model achieved a Jaccard index of 97.82% and a Dice score of 98.88%, whereas SAM 2 obtained a Jaccard index of 87.77% and a Dice score of 93.40%. In both cases, the custom models outperformed SAM 2. However, it is important to highlight that, despite not being specifically trained on medical images, SAM 2 produced results that were relatively close to those of domain-specific solutions. Notably, SAM 2 consistently outperformed SAM across all instances.
Table 3.
Segmentation performance of SAM 2 vs. state-of-the-art medical image segmentation models.
Although the Jaccard index and Dice score are suitable performance measures, comparing the execution time of SAM 2 with state-of-the-art models provides additional insight into its overall efficiency. Table 4 presents a comparison of the execution times of SAM 2 and the model proposed by Owais et al., with SAM included for reference. In the row corresponding to Owais et al., the execution times for SAM 2 and SAM represent the average time required to segment both the Coronacases and Radiopaedia samples. Execution time data for the model by Chen et al. are not available. Hu et al. [26] are also included in this comparison. In the row corresponding to Hu et al., the execution times for SAM 2 and SAM reflect the time required to segment samples from the Coronacases, Radiopaedia, and Montgomery datasets. The model by Owais et al. is capable of processing a single image in , while SAM 2 requires . However, as discussed in Section 4.1.6, the time required for an expert to manually segment a medical image is measured in minutes. Hu et al. report a processing time of approximately per image, in which case SAM 2 demonstrates a significant advantage in execution speed.
Table 4.
Execution time of SAM 2 vs. state-of-the-art medical image segmentation models.
4.1.2. Model Performance Deltas
Focusing on improvement differences, or deltas, instead of absolute values could shed more light on this comparison. The distribution of these deltas for each dataset and metric appears in Figure 7, without outliers. These deltas are shown in Table 2 in parentheses.

Figure 7.
SAM 2 vs. SAM segmentation delta comparison. (a) CoronacasesJaccard index. (b) Radiopaedia Jaccard index. (c) Montgomery Jaccard index. (d) Coronacases Dice score. (e) Radiopaedia Dice score. (f) Montgomery Dice score.
Coronacases and Radiopaedia deltas for both metrics are centered around zero, suggesting that the central tendency of the delta values is neutral, with no significant overall increase or decrease. However, the Montgomery dataset shows a slight negative skew (around 1%), indicating that the improvement in this dataset is more extreme than in the other two.
The Interquartile Range (IQR), represented by the box, is small for Coronacases and Radiopaedia deltas for both metrics. It shows that the middle 50% of the data lies close to ±1%. The whiskers extend close to ±3% except in the Jaccard index for Radiopedia, which is close to ±5%, suggesting that the changes are relatively small for better and worse segmentation results. Again, Montgomery shows a more significant delta, with the IQR extending close to ±5% and the whiskers close to ±15% Jaccard index, and close to ±3% and the whiskers close to ±10% Dice score, reinforcing a more significant improvement in this dataset.
The notch around the median suggests that we can be 95% confident that the actual median lies within this notch. The notch does not overlap with the ends of the box, suggesting that the median is distinct and significantly different from the IQR endpoints.
Overall, the Jaccard index changes for the Coronacases and Radiopaedia datasets appear to be centered around zero, with a small degree of variability and no significant outliers. The distribution is relatively symmetric and well-behaved.
In any case, the box plots appear symmetric around the median, indicating that the distribution of the delta values is relatively balanced. A slightly more prolonged whisker at the upper end might suggest a minor positive skew. This skew is reinforced by the average value (represented by the discontinuous green line) being consistently higher than the median (represented by the solid green line) in every instance.
4.1.3. Outliers Analysis
Leaving the outliers out of the plot maintains the focus on the main distribution of the data. However, it is essential to note that the outliers are not necessarily errors or anomalies in the data. They could be valid data points that are more extreme than the rest. In this case, they represent the most significant improvements (and declines) in the segmentation results. The last step in analyzing these data would be to investigate these outliers. Figure 8 shows the normalized deltas for each dataset and metric, sorted from best to worst values.

Figure 8.
SAM 2 vs. SAM deltas in descending order.
The Coronacases and Radiopaedia datasets show many extremely positive deltas for the Jaccard index and Dice score. Although extreme negative deltas exist, they are less frequent. Most deltas are close to zero, meaning the results will remain the same. However, the odds of improvement are higher than the odds of decline. The Montgomery dataset, on the other hand, shows no outliers for both metrics because the improvements are less infrequent than in the other two datasets. Most deltas are positive, meaning the odds of performance improvement are higher than the odds of decline.
SAM 2 improves SAM performance because the model segments are better. There is no correlation between the size of the masks and model performance. The Pearson correlation coefficient is close to for both the Jaccard index and Dice score when testing the Coronacases and Radiopaedia datasets and around when testing the Montgomery dataset. These low values mean there is no linear correlation between the mask size and the delta values.
4.1.4. Best and Worst Deltas
For illustrative purposes, Figure 9 shows samples of the best and worst deltas for each dataset and metric. The improvement is quite notable in some cases, such as the Coronacases or Radiopaedia examples. The Montgomery improvement is also significant.

Figure 9.
Best and worst delta examples (Jaccard index delta and Dice score delta). (a) Coronacases (SAM). (b) Coronacases improvement (SAM 2) (67.12% and 60.44%). (c) Coronacases (SAM). (d) Coronacases decline (SAM 2) (−32.58% and −26.08%). (e) Radiopaedia (SAM). (f) Radiopaedia improvement (SAM 2) (62.72% and 54.81%). (g) Radiopaedia (SAM). (h) Radiopaedia decline (SAM 2) (−08.80% and −04.81%). (i) Montgomery (SAM). (j) Montgomery improvement (SAM 2) (13.89% and 08.47%). (k) Montgomery (SAM). (l) Montgomery decline (SAM 2) (−13.99% and −08.77%).
4.1.5. Execution Time
Lastly, we compare the execution time of the models. Figure 10a shows the execution time comparison between SAM and SAM 2. The execution time is lower for SAM 2, as the authors of the model claim. However, the most significant improvement occurs during the embedding generation phase, particularly in the image-loading process. Consequently, SAM 2 achieves a lower segmentation time than SAM. When processing a single image only once, SAM 2 is faster than SAM. However, when performing multiple segmentation operations over the same image, SAM 2 would take more time than SAM in each iteration. These results make sense, as SAM 2 prediction architecture is more complex than SAM’s, primarily due to its incorporation of a memory bank to enhance contextual understanding across segmentations. This additional structure improves segmentation consistency and adaptability across related images but also introduces additional computational overhead, particularly in data transfer and memory access times. Consequently, this increased architectural complexity likely contributes to the higher input/output latency and reduced overall throughput. Even when SAM 2 is operating in 2D segmentation mode, tensor propagation through its architecture remains necessary, further impacting processing efficiency. This suggests a trade-off between improved segmentation performance and real-time execution speed.

Figure 10.
SAM vs SAM 2 time analysis.
While evaluating SAM 2 performance, we found that SAM and SAM 2 behave differently depending on how they are executed. Figure 10b shows these differences.
The first two columns represent the time it takes to segment the Montgomery dataset when model is loaded only once. In contrast, the second two columns correspond to the scenario where the model is reloaded before processing each image, repeatedly segmenting the same image instead of the entire dataset. These results show that, in order to get the most out of SAM 2, the model should be loaded only once and then used to process all images. Otherwise, SAM and SAM 2 will take the same time to segment the images. Keeping this limitation in mind could speed the segmentation process up considerably when trying different prompts over the same image.
4.1.6. Impact of SAM 2 on Clinical Workflows
Manual segmentation of medical images is a time-intensive process that requires the intervention of highly experienced specialists. Recent studies have evaluated the time required to segment anatomical structures in various types of medical images. For instance, in the segmentation of 100 images from nine different modalities, three doctors with over 10 years of experience performed the annotation, requiring an average time of per image [27]. Similarly, in another study in which they used COVID-19 images obtained via CT, the manual segmentation of a CT scan consisting of 250 slices took a total time of 400 ± 45 , which translates to an average of per slice [28]. This process was conducted in three phases: preliminary annotations were performed by junior specialists, then refined by more experienced radiologists, and finally, verified by a senior radiologist.
The integration of SAM in medical image segmentation has significantly reduced annotation time without compromising segmentation quality. In the annotation of medical images across various modalities, SAM decreased the average annotation time from to per image while also improving annotation quality, as measured by the Human Correction Effort (HCE) index [27], decreasing the HCE value from to . Likewise, in the study of COVID-19 images in CT, where manual segmentation of a single slice took an average of [28], SAM reduced this time to ~ 1 per slice, as illustrated in Figure 10, representing a reduction of over 96%. These findings highlight that incorporating SAM into medical image segmentation not only enhances process efficiency but also alleviates the annotation workload for specialists.
Although the prediction time of SAM 2 is approximately ten times higher than that of SAM, the total segmentation time in both cases is ~ 1 . This implies that, within the segmentation process carried out by the medical specialist, which may take several minutes, the impact of SAM 2’s segmentation time is negligible. It is important to emphasize that after SAM 2 automatically segments the image, the medical specialist must refine the segmentation outcome obtained by the model based on their expert knowledge and the specific clinical context. In this regard, SAM 2 cannot replace the experience of medical professionals in annotation or diagnostic processes; rather, it serves as an assistive tool that streamlines their workflow, reduces annotation time, and enhances the quality of segmented images through its segmentation capabilities.
4.1.7. Hypothesis Test
A paired t-test was performed to determine if the differences between SAM and SAM 2 were statistically significant, as the segmentation results came from the same set of images segmented by both systems. The results are shown in Table 5 and Figure 11.
Table 5.
SAM vs SAM 2 paired t-tests.

Figure 11.
Hypothesis tests.
The analysis of the results reveals that SAM 2 consistently outperforms SAM in the Coronacases and Radiopaedia datasets, as indicated by highly significant p-values across both the Jaccard and Dice metrics. The t-statistics are strongly negative, confirming SAM 2’s superior performance in these cases. However, in the Montgomery dataset, the results show no significant difference between SAM and SAM 2, with p-values well above the typical threshold for significance. This indicates that the two systems perform similarly on this dataset, suggesting that SAM 2’s advantages may be less pronounced in specific contexts. While SAM 2 shows robust improvements in most cases, its performance relative to SAM may vary depending on the dataset.
With these results, we can conclude that SAM 2 improves SAM performance in medical image segmentation tasks. Given these results, it is safe to test SAM 2 in a more challenging scenario, such as video segmentation, knowing that it will not behave worse than SAM.
4.2. SAM 2 Video Segmentation for Image Volumes
Figure 12 shows the results of the video segmentation tests described in Section 3.5 in a box plot format. Table 6 shows the exact values of the results. Only the Coronacases and Radiopaedia datasets are shown, as the Montgomery dataset is not structured in volumes. Each Montgomery’s sample is an independent X-ray, with no time relation between them. The X-axis compares the results of SAM and SAM 2 for the Jaccard index and the Dice score. While SAM needs one prompt for each slice to achieve these results, with our proposed technique, SAM 2 only needs one prompt for the whole volume. The Coronacases dataset has 10 volumes and 2156 slices with their corresponding mask. With SAM, we would need 2156 prompts to segment the whole dataset. However, with SAM 2, we only need 10 prompts, one for each volume. The Y-axis shows the values of each metric. Each box plot represents the distribution of the results for each dataset and metric. The boxes are paired per metric. The outliers are not shown in the plot. The median value is shown as a solid green horizontal line inside the box, while the average is dashed. The notch around the median represents the 95% confidence interval. The state-of-the-art results are shown as a horizontal line atop each box. The delta between different model versions is shown as a green vertical dashed line between the boxes. The delta between the model and the state-of-the-art results is shown as a dashed red line at the right of each pair of boxes.

Figure 12.
Video results (Owais et al. [19], Chen et al. [21]).
Table 6.
SAM 2 video’s segmentation results (delta from SAM).
When comparing the results in the Coronacases dataset, SAM 2’s results are slightly worse than SAM’s. The average Jaccard index is 0.50% lower, and the average Dice score is 0.50% lower. In both cases, this decrease is below the 0.50% threshold. However, the distribution of values with SAM 2 is more compact than with SAM.
On the other hand, the Radiopaedia dataset shows a different behavior. Results are slightly better with SAM 2 than with SAM. The average Jaccard index is 1.64% higher, and the average Dice score is 1.31% higher. Again, the distribution of values with SAM 2 is more compact than with SAM.
Could we use a single prototypical seed prompt for the whole dataset, further reducing the prompting effort and creating a library of prototypical prompts for the medical image segmentation tasks? For this test, we used the seed prompt from the first volume of each dataset to segment the rest of the volumes in that dataset. For illustrative purposes, Figure 13 shows the seed prompt chosen for each dataset (Figure 13a,c) from the first volume, side by side with the seed prompt they are replacing from the second volume (Figure 13b,d). Although they are not identical, they share some fundamental characteristics resembling the same anatomical structure, like the rough shape and location of the lungs and the heart, the image’s appearance, and its dimensions.

Figure 13.
Shared seed video results. (a) Coronacases shared seed. (b) Coronacases proper seed. (c) Radiopaedia shared seed. (d) Radiopaedia proper seed.
The results are shown in Figure 14. When processing the Coroncases dataset, the Jaccard index and the Dice score show an improvement of 0.60% and 0.40%, respectively. The Radiopaedia datasets result in a decrease of 0.18% and 0.16% for the Jaccard index and the Dice score, respectively. In both cases, the results are very similar to the ones obtained when using the seed prompt from the same volume. For the 2156 masks in the Coronacases dataset, using a single seed prompt would reduce the number of prompts needed to segment the volume to one. That is a 99.95% reduction in prompts needed to segment the volume. This previous test shows that the model can successfully segment all the volumes in a dataset using a single, representative seed prompt taken from one of the volumes, drastically reducing the number of prompts needed to segment the dataset (e.g., from 2156 to 10 in the Coronacases dataset).

Figure 14.
Shared seed video results (Owais et al. [19], Chen et al. [21]).
4.3. Exploratory Analysis of Spleen MRI Segmentation
The primary objective of this study is to compare segmentation efficacy and prompting strategies within lung CT and X-ray datasets. This focus is motivated by the fact that CT and X-ray are among the most commonly used imaging modalities in radiological workflows. Additionally, it enables direct benchmarking against previously published studies, including our own prior work. Nevertheless, in this section, we briefly explore the applicability of SAM-based models to other imaging modalities and anatomical regions. This is not intended as an exhaustive evaluation across all modalities or organs but rather as a preliminary step to inform future research directions. In particular, we analyze the segmentation capabilities of SAM and SAM 2 on spleen MRI images.
For this exploratory analysis, we selected the clinical abdominal organ segmentation dataset AMOS [29], which comprises 500 CT and 100 MRI volumes. Each of these volumes includes multiple segmentation labels corresponding to various abdominal organs, such as the spleen. We chose the spleen as the segmentation target to assess the performance of an organ different from the lungs and MRI to evaluate the models on a modality distinct from the CT data used in the primary comparison. The spleen’s relatively simple morphology and lack of pronounced concavities make it a suitable candidate for this exploratory segmentation task. To evaluate the segmentation performance of SAM and SAM 2 specifically on MRI data, we selected 14 volumes labeled as MRI. To ensure representativeness and reduce potential biases related to MRI acquisition devices, we further narrowed the selection to a subset of 8 volumes acquired using a Siemens Ingenia scanner.
Figure 15 shows an example of an MRI slice from the AMOS dataset, illustrating the spleen segmentation result produced by SAM 2.

Figure 15.
MRI prediction example.
The segmentation methodology follows the approach described previously in Section 3.4 and Section 3.5. In this exploratory evaluation, we assessed four segmentation configurations. First, we applied SAM with individual prompts provided for every slice across the eight selected MRI volumes. Second, we evaluated SAM 2 using the same per-slice prompting strategy. Third, we tested a propagation-based approach with SAM 2, where segmentation was initialized using a single prompt on the central slice of each volume. Finally, we explored a variant of this propagation-based strategy in which the seed prompt was shared across all volumes, aiming to further reduce the prompting effort by using a single prompt for the entire dataset.
Figure 16 summarizes the MRI segmentation performance of SAM and SAM 2 on the AMOS dataset. On the one hand, the X-axis in Figure 16a compares the performance of SAM and SAM 2 in image processing mode using the Jaccard index and Dice score. On the other hand, Figure 16b compares the performance of SAM 2 in video processing mode, using either the middle slice of each volume as a seed prompt or a shared seed prompt for the entire dataset. For this subset of the dataset, which includes eight volumes and a total of 1633 slices, SAM requires 1633 prompts to achieve complete segmentation, whereas SAM 2 in video processing mode reduces this requirement to only 8 prompts, one per volume for the middle-slice seed and one for the entire dataset in the shared-seed configuration. The Y-axis displays the corresponding metric values, with each box representing the distribution per dataset and metric. Outliers are omitted for clarity. Solid horizontal green lines denote median values, dashed horizontal lines indicate mean values, and notches represent 95% confidence intervals. Horizontal reference lines correspond to state-of-the-art performance: the blue line indicates the Jaccard index () achieved by a multi-class, multi-modal nnU-Net on spleen MRI images [30], while the orange line marks the Dice score () achieved by the TransDiffSeg model when segmenting spleen MRI images [31]. It is worth noting that, while the Dice score benchmark is based on the AMOS dataset, the Jaccard index reference is drawn from a different one. Vertical dashed green lines indicate performance differences between model versions, and vertical dashed red lines highlight deviations from the state-of-the-art baselines.

Figure 16.
Video results (He et al. [30], Gu W. et al. [31]).
In this exploratory evaluation on spleen MRI segmentation, the highest average performance was achieved using the video processing mode of SAM 2, where the middle slice of each volume was used as the seed frame. This configuration yielded a mean Dice score of , representing a decline of 7.03% compared to the state-of-the-art Dice value of reported by TransDiffSeg [31]. Similarly, the mean Jaccard index reached , corresponding to a decline of 9.18% relative to the benchmark Jaccard index of obtained by a multi-modal nnU-Net [30].
The same configuration used for lung segmentation was employed without modification, and no preprocessing was performed on the MRI volumes, as this analysis was intended to be exploratory. Because neither the prompt was tailored to MRI images nor any additional preprocessing was applied, the gap between the Dice and Jaccard scores obtained with this approach and those of the state-of-the-art increased from and 5.39 percentage points, respectively, in the best-performing lung segmentation configuration to and in the best-performing spleen segmentation configuration. These findings suggest that the prompting strategy and segmentation approach proposed in this study can be effectively transferred to different imaging modalities and anatomical targets, delivering competitive results with minimal adaptation.
Despite these differences, the results are promising, especially considering that (1) the models were not fine-tuned for this specific task, (2) unlike the lung CT images, no preprocessing was applied to the MRI data, and (3) the prompting strategy was not adapted to the target organ or imaging modality. Nevertheless, although a comprehensive, modality-specific performance analysis of SAM 2 is beyond the scope of this work, this exploratory section offers initial insights into its applicability and effectiveness for SAM-based segmentation tasks beyond the lung CT and X-ray data analyzed in the primary comparative study.
5. Discussion
Medical image segmentation is critical in clinical applications, such as diagnosis and treatment planning. Ever since computers have been able to work in image processing, this task has been attempted to be automated. The application of artificial intelligence to this task has been a priority since its resurgence at the turn of the century [32]. Recent advances in deep learning have significantly improved the accuracy and efficiency of segmentation methods, particularly those that require minimal user input.
Deep learning-based interactive segmentation methods, such as those incorporating Convolutional Neural Network (CNN)s with user inputs like bounding boxes and scribbles like [33], have demonstrated increased accuracy and robustness, especially for previously unseen objects. Due to their zero-shot learning features, these methods require fewer user interactions and less time than traditional methods.
Techniques such as geodesic distance transforms and resolution-preserving networks further improve the accuracy of interactive segmentation by refining the initial automatic segmentations with minimal user intervention [34].
A deep learning-based interactive segmentation method that achieves accurate results with fewer user interactions is proposed in [35]. The authors claim their method consumes less time and generalizes well to previously unseen objects in medical images. In order to do so, they first encode user-provided interior margin points via a CNN to achieve a good initial segmentation result of both previously seen and unseen objects. Then, an information fusion method combines the initial segmentation with a few additional user clicks to refine the segmentation.
Knowledge distillation techniques have been employed to transfer knowledge from large, well-trained networks for medical image segmentation to smaller, lightweight networks. This approach maintains high segmentation accuracy while significantly reducing computational complexity and storage requirements. To cite just one example, [36] improved a lightweight network’s segmentation capability by up to 32.6%.
The integration of SAM 2 into clinical workflows, particularly in radiotherapy, aligns with the increasing demand for efficiency and precision in oncology. Radiotherapy is a complex, multi-step process involving imaging acquisition, contouring of anatomical structures, treatment planning, delivery, and follow-up, requiring significant expertise and coordination among specialists [37]. In resource-constrained settings, many of these steps remain highly manual and time-consuming. SAM 2 could support the automation and standardization of critical stages such as segmentation and verification, thereby reducing clinicians’ workload and enhancing treatment consistency. By accelerating processes like image acquisition and contouring, SAM 2 may also help minimize the time patients spend undergoing imaging procedures, thus reducing discomfort and limiting unnecessary exposure to ionizing radiation. This fits into a broader trend toward the adoption of AI-based tools [38], such as those developed in initiatives like Medical Open Network for AI(MONAI) [39] or Open Health Imaging Foundation Viewer (OHIF) [40], which are being successfully integrated into image-based workflows to improve diagnostic accuracy and therapeutic planning.
We aim to enable specialists to perform medical image segmentation with as little interaction as possible at the lowest possible cost. All the work mentioned in this section has one thing in common: the need for considerable resources to develop, reproduce, or use it. In order to develop deep learning networks, it is necessary to have a team of professionals dedicated exclusively to it, with access to first-rate data and computational resources. Fine-tuning an existing neural network is less demanding than creating one from scratch. However, it is still a process within the reach of a few.
For those who need these resources, the task of segmenting medical images becomes a slow and tedious process, requiring the intervention of a medical imaging specialist throughout the process. The proposal of this work is an evolution of our previous one [9]. The segmentation of each image was performed with a minimum number of prompts. Our current proposal provides a single prompt to segment all images from the same source with an accuracy close to that obtained by state-of-the-art models trained explicitly for this task. The specialist’s task is reduced to monitoring the results to ensure the quality of the results, being able to devote more time to other, more critical tasks.
The results of using SAM 2 to segment an entire volume, or a whole dataset, of medical images using a single set of prompts and a reference frame that can then be propagated to the rest of the frames are very promising. Compared to SAM, SAM 2 yields very similar results in quality. In the case of the Coronacases dataset, the decrease in the quality of the results is minimal. In the case of the Radiopaedia dataset, the results improve. This difference in results is consistent with those obtained in the first experiment (see Table 1). The average results obtained with SAM 2 were better in both datasets. However, the improvement was more significant in the Radiopaedia dataset. The nature of the data is a key factor in the segmentation result if one wants to compare the results between SAM and SAM 2.
The video processing algorithm proposed in this work has similarities with the prompts selection algorithm presented in our previous work. Both proposals manage to improve the results of the medical image segmentation task without altering the essence of the segmentation, and they do so efficiently. In this case, if we ignore the segmentation task handled by SAM 2, the computational complexity of the proposed algorithm would be linear , where n is the number of images in the volume. Therefore, no significant computational burden is being added to the segmentation process.
The results shown in Figure 12 show that SAM 2 video segmentation results are similar to SAM image segmentation results. To achieve these results in our experiments, SAM needs one set of prompts for each slice (two positive, one negative, and a bounding box), while SAM 2 needs only a single set of these prompts for the whole volume. Each volume starts and ends with slices that have no corresponding mask, so the CT machine can capture the whole organ (e.g., the lungs) in the image.
When using SAM 2’s prompt propagation features, its behavior in these start and end extremes of the volume is worse than SAM’s. Notice how the metric minimum values are far lower with SAM 2 than with SAM in Table 6. Even though the model is not able to segment the frames closer to the extremes of the volumes, where the area to segment is smaller, SAM 2 is still able to segment the rest of the volume with a single set of prompts while maintaining very similar global results. In the Coronacases dataset, SAM 2 cannot propagate the prompt only in three slices of the whole dataset. As a consequence, it loses track of the object twice at the start and once at the end of a volume. In the Radiopaedia, it happens four times: twice at the start and twice at the end of the volume.
Although there exists a slight decline in the Coronacases dataset results, it is greatly compensated by the difference in the number of prompts needed to segment each volume. Using SAM would require 2156 prompts, one for each slice. However, SAM 2 would require only 10 prompts, one for each of the 10 volumes, as the model can propagate the seed frame segmentation through the whole volume. That is a 99.54% reduction in prompts needed to segment the volume. Moreover, when using a single seed prompt for the whole dataset, the number of prompts needed to segment the volume is reduced to one. That is a 99.95% reduction in prompts needed to segment the volume. In both instances, the results are very similar to those obtained using one prompt for each slice. These results justify the development of a system that allows radiology specialists to select a single representative frame of a given machine to segment the rest of the frames of the same machine. These results justify the development of a prototypical prompt library for medical image segmentation that allows radiology specialists to select a single representative frame of a given machine to segment the rest of the frames of the same machine.
5.1. Limitations
While this study compares SAM 2 and SAM’s performance when segmenting medical images and introduces a novel approach to segmenting medical image volumes, several limitations should be acknowledged. Firstly, although the study primarily focused on a single medical image segmentation task, namely lung segmentation, we have included an exploratory analysis of spleen segmentation in MRI data. This preliminary evaluation provides valuable initial insights into the applicability of the proposed methods beyond the lung and across different imaging modalities. Although it does not constitute a comprehensive assessment, it demonstrates that the results of SAM 2 improve upon those of SAM. The generalizability of the findings to a broader range of organs and imaging modalities still needs to be thoroughly tested. Future work should explore applying the proposed methods to additional segmentation tasks to determine their broader applicability. Secondly, the study employed only one prompt configuration, consisting of a bounding box with two positive points and one negative point. This configuration was chosen for its simplicity and effectiveness in lung segmentation, as demonstrated in our previous work [9], and was retained unchanged in the exploratory spleen MRI analysis. However, the performance and adaptability of other prompt configurations were not explored, potentially limiting the method’s robustness and flexibility in more complex segmentation scenarios. Finally, the datasets used in this study contained COVID-19 lesions, which introduces a degree of specificity to the results. COVID-19 lesions may introduce unique challenges or biases that do not occur in other lung pathologies. Future studies should validate the approach on a broader range of lung conditions to ensure its applicability across diverse clinical scenarios. These limitations suggest clear lines for future research to enhance the generalizability and robustness of the findings presented in this study.
5.2. Requirements for Training Segmentation Models
As noted in Section 1, training segmentation models for medical imaging demands substantial computational resources, specialized expertise, and significant financial investment. Recent studies have highlighted these challenges.
For instance, DMDF-Net [19], a dual multiscale dilated fusion network, was designed for segmenting COVID-19 lesions in lung CT scans. The model was trained on the MosMed [41] and COVID-19-CT-Seg [18] datasets ( 70 CT scans totaling 5569 images). Training was conducted over 15 epochs with a batch size of eight and a learning rate of , utilizing an NVIDIA GTX 1070 GPU. The total estimated project cost, covering dataset curation, model architecture design, model training and evaluation, and personnel expenses, including three engineers, amounted to EUR 61,500 over six months. This estimate is based on the average annual salary of a Machine Learning Engineer in Spain, approximately EUR 41,000 (https://www.glassdoor.es/Salaries/spain-machine-learning-engineer-salary-SRCH_IL.0,5_IN219_KO6,31.htm?countryRedirect=true, accessed on 12 March 2025).
Similarly, TransAttUnet [21], a multi-level attention-guided U-Net incorporating transformer-based mechanisms, was developed for medical image segmentation. The model was trained on 4255 images from the ISIC-2018 [42], JSRT [43], Montgomery [20], NIH [44], Clean-CC-CCII [45], Bowl [46], and GLaS [47] datasets. Training was conducted over 100 epochs with a batch size of four and a learning rate of , utilizing an NVIDIA Titan XP GPU. Given that this project required a team of five engineers, the estimated cost amounted to EUR 102,500 over six months, using the same salary reference.
Another example is a Mask R-CNN-based approach [26] for lung CT segmentation, trained on a dataset of 1265 ground-truth images. The model was trained using an NVIDIA GTX 1050 Ti GPU. The total expenditure for this project amounted to 101,600 € over six months, underscoring the substantial costs associated with prolonged training and hyperparameter optimization. Assuming a team of four engineers, personnel costs alone would be approximately EUR 82,000, according to the previously cited salary benchmark.
Furthermore, DS-TransUNet [48], a Residual U-Net designed for medical image segmentation, was trained on the LUNA, VESSEL12 [49], and HUG-ILD [50] datasets (11,325 images). Training was conducted over 50 epochs with a batch size of eight and a learning rate of , utilizing an NVIDIA GTX 1060 GPU. This project involved six engineers, resulting in an estimated personnel cost of EUR 123,000 over six months, following the salary estimate previously discussed.
Moreover, the time required to achieve functional results is considerable. Training and refining foundational models, such as SAM2, demands a large number of GPUs and extensive datasets to achieve optimal performance. For instance, MedSAM2, the SAM2 fine-tuned model for medical applications, utilized 64 NVIDIA A100 GPUs for distributed training [17]. This setup highlights the challenges in resource allocation and underscores the necessity of optimizing efficiency in segmentation models.
These studies highlight the substantial computational demands, dataset requirements, and financial commitments associated with training segmentation models. In contrast, our proposed approach leverages pretrained segmentation models alongside advanced prompting strategies, significantly reducing both computational and development costs. Rather than training complex architectures from scratch, we optimize segmentation tasks through efficient model adaptation, minimizing GPU utilization and eliminating the need for large-scale dataset curation. This strategy offers a cost-effective, scalable, and accessible alternative for medical image segmentation.
6. Conclusions
In this paper, we compared SAM 2 with SAM in medical image segmentation tasks. Regardless of our first impulses, new is not necessarily better. When deciding between SAM or SAM 2, consider precision, responsiveness, and computing resources. In particular, SAM 2 is the way to go if the best precision when segmenting medical images is required. It usually provides the same results as SAM but is better on average. In our tests, SAM 2 results get up to an average 1.76% improvement in the Jaccard index, a 1.49% improvement in the Dice Score, and a better standard deviation for both metrics, getting even closer to the state-of-the-art solutions than SAM does. However, SAM is still the best choice in a pipeline where responsiveness is critical. After processing the image to get its embeddings, SAM can predict a mask in around 61 . In comparison, SAM 2 takes around 588 to perform the same task, which is approximately ten times slower. The threshold for users to feel that the system reacts instantaneously to their actions is 100 [51]. SAM is below this threshold, while SAM 2 is above it. If computing resources are scarce, SAM 2 is the best choice. The best SAM 2 model is smaller than the best SAM model. At the same time, the computing time for a single prediction is faster on average.
Furthermore, we presented a new medical image segmentation technique that uses a single seed prompt to segment a whole volume, further reducing the number of prompts needed to perform the task in 99.54% of the Coronacases dataset. The results are very close to the ones obtained when using one prompt for each slice, with practically no difference in the metrics used to measure the differences. Besides, we have also shown that the model is able to segment all the volumes in a dataset using a single, representative seed prompt taken from one of the volumes. In this case, the reduction in the number of prompts needed to segment the volume is 99.95% in the Coronacases dataset. This new technique could be used to virtually reduce the number of prompts needed to segment a volume up to 100%, allowing us to choose a representative seed prompt for images with similar characteristics, thus achieving infinite segmentation results with a single prompt.
In future work, given the results obtained in this paper, we plan to test our segmentation technique in a case study in a hospital, integrating it into a segmentation tool. It would be interesting to study whether we can automate the creation of the artificial seed iteratively while the machine is working. Moreover, as part of this clinical implementation, future research will involve evaluating how the segmentation results influence clinical decision-making and patient outcomes. This will include potential collaborations with radiology experts to gain deeper insights into the practical utility of the developed techniques, thus ensuring that the segmentation tool can be effectively integrated into real-world medical workflows. These steps are crucial in translating the technical advancements of SAM 2 into practical solutions that improve clinical practices and patient care.
We will also test the technique in other medical image segmentation tasks, such as tumor segmentation, to see if the results are similar. The results obtained in this paper suggest that SAM 2 can recognize objects in images, even if they are rudimentary, and transfer that knowledge to other images. What are the characteristics of the images that allow the model to do this? How far can we refine these seed frames to make them more representative of the whole volume? Data augmentation techniques could be used to generalize the seed prompt to meet certain desirable characteristics. We have also evaluated our approach to medical imaging modalities beyond CT and X-rays, such as MRI, with promising results. Extending this evaluation to other common modalities, such as Ultrasound Sonography (USG), would further test the robustness of our method. Moreover, given the growing importance of Hyperspectral Imaging (HSI) in medical diagnostics [52], we plan to include this modality in our future benchmarking efforts. Lastly, it is essential to consider the extent to which our improvements can enhance SAM 2 results. The existence of a potential ceiling value beyond which further improvements may be unreachable could be examined. This limit would likely be influenced by various factors that require thorough investigation.
Author Contributions
All authors contributed equally to the conception, design, implementation, and writing of this paper. All authors have read and agreed to the published version of the manuscript.
Funding
This work was supported by Grant CPP2021-008491 funded by MICIU/AEI/10.13039/50100011033 and by the European Union NextGeneration EU/PRTR.
Data Availability Statement
The source code used to reproduce the analyses and results in this paper is available at https://github.com/i3uex/prompt_once_segment_everything_code (accessed on 10 April 2025).
Conflicts of Interest
The authors declare that they have no known competing financial interests or personal relationships that could have appeared to influence the work reported in this paper.
References
- Szeliski, R. Computer Vision: Algorithms and Applications; Springer Nature: Berlin/Heidelberg, Germany, 2022. [Google Scholar]
- Nieto-del-Amor, F.; Ye-Lin, Y.; Monfort-Ortiz, R.; Diago-Almela, V.J.; Modrego-Pardo, F.; Martinez-de-Juan, J.L.; Hao, D.; Prats-Boluda, G. Automatic Semantic Segmentation of EHG Recordings by Deep Learning: An Approach to a Screening Tool for Use in Clinical Practice. Comput. Methods Programs Biomed. 2024, 254, 108317. [Google Scholar] [CrossRef]
- Wang, G.; Luo, X.; Gu, R.; Yang, S.; Qu, Y.; Zhai, S.; Zhao, Q.; Li, K.; Zhang, S. PyMIC: A Deep Learning Toolkit for Annotation-Efficient Medical Image Segmentation. Comput. Methods Programs Biomed. 2023, 231, 107398. [Google Scholar] [CrossRef] [PubMed]
- Mikhailov, I.; Chauveau, B.; Bourdel, N.; Bartoli, A. A Deep Learning-Based Interactive Medical Image Segmentation Framework with Sequential Memory. Comput. Methods Programs Biomed. 2024, 245, 108038. [Google Scholar] [CrossRef] [PubMed]
- Klemetti, A.; Raatikainen, M.; Myllyaho, L.; Mikkonen, T.; Nurminen, J.K. Systematic Literature Review on Cost-Efficient Deep Learning. IEEE Access 2023, 11, 90158–90180. [Google Scholar] [CrossRef]
- Sandoval Serrano, D.R.; Rincón, J.C.; Mejía-Restrepo, J.; Núñez-Valdez, E.R.; García-Díaz, V. Forecast of Medical Costs in Health Companies Using Models Based on Advanced Analytics. Algorithms 2022, 15, 106. [Google Scholar] [CrossRef]
- Kirillov, A.; Mintun, E.; Ravi, N.; Mao, H.; Rolland, C.; Gustafson, L.; Xiao, T.; Whitehead, S.; Berg, A.C.; Lo, W.Y.; et al. Segment Anything. arXiv 2023, arXiv:2304.02643. [Google Scholar] [CrossRef]
- Ravi, N.; Gabeur, V.; Hu, Y.T.; Hu, R.; Ryali, C.; Ma, T.; Khedr, H.; Rädle, R.; Rolland, C.; Gustafson, L.; et al. SAM 2: Segment Anything in Images and Videos. arXiv 2024, arXiv:2408.00714. [Google Scholar]
- Gutiérrez, J.D.; Rodriguez-Echeverria, R.; Delgado, E.; Rodrigo, M.Á.S.; Sanchez-Figueroa, F. No More Training: SAM’s Zero-Shot Transfer Capabilities for Cost-Efficient Medical Image Segmentation. IEEE Access 2024, 12, 24205–24216. [Google Scholar] [CrossRef]
- Ma, J.; Wang, B. Segment Anything in Medical Images. arXiv 2023, arXiv:2304.12306. [Google Scholar] [CrossRef]
- Wu, J.; Ji, W.; Liu, Y.; Fu, H.; Xu, M.; Xu, Y.; Jin, Y. Medical SAM Adapter: Adapting Segment Anything Model for Medical Image Segmentation. arXiv 2023, arXiv:2304.12620. [Google Scholar] [CrossRef]
- Zhang, Y.; Shen, Z.; Jiao, R. Segment Anything Model for Medical Image Segmentation: Current Applications and Future Directions. Comput. Biol. Med. 2024, 171, 108238. [Google Scholar] [CrossRef]
- Chang, M.W.; Ratinov, L.; Roth, D.; Srikumar, V. Importance of Semantic Representation: Dataless Classification. In Proceedings of the AAAI, AAAI’08, Chicago, IL, USA, 13–17 July 2008; Volume 2, pp. 830–835. [Google Scholar]
- Wu, J.; Xu, M. One-Prompt to Segment All Medical Images. In Proceedings of the IEEE/CVF Conference on Computer Vision and Pattern Recognition (CVPR), Seattle, WA, USA, 17–21 June 2024. [Google Scholar]
- Kulyabin, M.; Zhdanov, A.; Pershin, A.; Sokolov, G.; Nikiforova, A.; Ronkin, M.; Borisov, V.; Maier, A. Segment Anything in Optical Coherence Tomography: SAM 2 for Volumetric Segmentation of Retinal Biomarkers. Bioengineering 2024, 11, 940. [Google Scholar] [CrossRef] [PubMed]
- Kong, L.; Huang, M.; Zhang, L.; Chan, L.W.C. Enhancing Diagnostic Images to Improve the Performance of the Segment Anything Model in Medical Image Segmentation. Bioengineering 2024, 11, 270. [Google Scholar] [CrossRef] [PubMed]
- Zhu, J.; Qi, Y.; Wu, J. Medical SAM 2: Segment Medical Images as Video via Segment Anything Model 2. arXiv 2024, arXiv:2408.00874. [Google Scholar] [CrossRef]
- Jun, M.; Cheng, G.; Yixin, W.; Xingle, A.; Jiantao, G.; Ziqi, Y.; Minqing, Z.; Xin, L.; Xueyuan, D.; Shucheng, C.; et al. COVID-19 CT Lung and Infection Segmentation Dataset; Zenodo: Genève, Switzerland, 2020. [Google Scholar] [CrossRef]
- Owais, M.; Baek, N.R.; Park, K.R. DMDF-Net: Dual Multiscale Dilated Fusion Network for Accurate Segmentation of Lesions Related to COVID-19 in Lung Radiographic Scans. Expert Syst. Appl. 2022, 202, 117360. [Google Scholar] [CrossRef]
- Jaeger, S.; Candemir, S.; Antani, S.; Wáng, Y.X.J.; Lu, P.X.; Thoma, G. Two Public Chest X-ray Datasets for Computer-Aided Screening of Pulmonary Diseases. Quant. Imaging Med. Surg. 2014, 4, 475. [Google Scholar] [CrossRef]
- Chen, B.; Liu, Y.; Zhang, Z.; Lu, G.; Kong, A.W.K. TransAttUnet: Multi-level Attention-guided U-Net with Transformer for Medical Image Segmentation. arXiv 2022, arXiv:2107.05274. [Google Scholar] [CrossRef]
- Cohen, J.P.; Morrison, P.; Dao, L. COVID-19 Image Data Collection. arXiv 2020, arXiv:2003.11597. [Google Scholar] [CrossRef]
- Dance, D.R.; Christofides, S.; Maidment, A.D.A.; McLean, I.D.; Ng, K.H. Diagnostic Radiology Physics; Non-Serial Publications; International Atomic Energy Agency: Vienna, Austria, 2014. [Google Scholar]
- Tidwell, A.S. Advanced Imaging Concepts: A Pictorial Glossary of CT and MRI Technology. Clin. Tech. Small Anim. Pract. 1999, 14, 65–111. [Google Scholar] [CrossRef] [PubMed]
- Müller, D.; Soto-Rey, I.; Kramer, F. Towards a Guideline for Evaluation Metrics in Medical Image Segmentation. BMC Res. Notes 2022, 15, 210. [Google Scholar] [CrossRef]
- Hu, Q.; De F. Souza, L.F.; Holanda, G.B.; Alves, S.S.; Dos S. Silva, F.H.; Han, T.; Rebouças Filho, P.P. An Effective Approach for CT Lung Segmentation Using Mask Region-Based Convolutional Neural Networks. Artif. Intell. Med. 2020, 103, 101792. [Google Scholar] [CrossRef]
- Huang, Y.; Yang, X.; Liu, L.; Zhou, H.; Chang, A.; Zhou, X.; Chen, R.; Yu, J.; Chen, J.; Chen, C.; et al. Segment Anything Model for Medical Images? Med. Image Anal. 2024, 92, 103061. [Google Scholar] [CrossRef] [PubMed]
- Ma, J.; Wang, Y.; An, X.; Ge, C.; Yu, Z.; Chen, J.; Zhu, Q.; Dong, G.; He, J.; He, Z.; et al. Toward Data-efficient Learning: A Benchmark for COVID-19 CT Lung and Infection Segmentation. Med. Phys. 2021, 48, 1197–1210. [Google Scholar] [CrossRef]
- Ji, Y.; Bai, H.; Ge, C.; Yang, J.; Zhu, Y.; Zhang, R.; Li, Z.; Zhanng, L.; Ma, W.; Wan, X.; et al. Amos: A Large-Scale Abdominal Multi-Organ Benchmark for Versatile Medical Image Segmentation. Adv. Neural Inf. Process. Syst. 2022, 35, 36722–36732. [Google Scholar] [CrossRef]
- He, X.; Hu, Z.; Dev, H.; Romano, D.J.; Sharbatdaran, A.; Raza, S.I.; Wang, S.J.; Teichman, K.; Shih, G.; Chevalier, J.M.; et al. Test Retest Reproducibility of Organ Volume Measurements in ADPKD Using 3D Multimodality Deep Learning. Acad. Radiol. 2024, 31, 889–899. [Google Scholar] [CrossRef] [PubMed]
- Gu, W.; Zhang, G.; Ju, R.; Wang, S.; Li, Y.; Liang, T.; Guo, W.; Gong, Z. TransDiffSeg: Transformer-Based Conditional Diffusion Segmentation Model for Abdominal Multi-Objective. J. Imaging Inform. Med. 2024, 38, 262–280. [Google Scholar] [CrossRef]
- Pham, D.; Xu, C.; Prince, J.L. Current Methods in Medical Image Segmentation. Annu. Rev. Biomed. Eng. 2000, 2, 315–337. [Google Scholar] [CrossRef] [PubMed]
- Wang, G.; Li, W.; Zuluaga, M.A.; Pratt, R.; Patel, P.; Aertsen, M.; Doel, T.; David, A.; Deprest, J.; Ourselin, S.; et al. Interactive Medical Image Segmentation Using Deep Learning with Image-Specific Fine Tuning. IEEE Trans. Med. Imaging 2017, 37, 1562–1573. [Google Scholar] [CrossRef] [PubMed]
- Wang, G.; Zuluaga, M.A.; Li, W.; Pratt, R.; Patel, P.; Aertsen, M.; Doel, T.; David, A.; Deprest, J.; Ourselin, S.; et al. DeepIGeoS: A Deep Interactive Geodesic Framework for Medical Image Segmentation. IEEE Trans. Pattern Anal. Mach. Intell. 2017, 41, 1559–1572. [Google Scholar] [CrossRef]
- Luo, X.; Wang, G.; Song, T.; Zhang, J.; Aertsen, M.; Deprest, J.; Ourselin, S.; Vercauteren, T.K.M.; Zhang, S. MIDeepSeg: Minimally Interactive Segmentation of Unseen Objects from Medical Images Using Deep Learning. Med. Image Anal. 2021, 72, 102102. [Google Scholar] [CrossRef]
- Qin, D.; Bu, J.; Liu, Z.; Shen, X.; Zhou, S.; Gu, J.J.; Wang, Z.; Wu, L.; Dai, H.F. Efficient Medical Image Segmentation Based on Knowledge Distillation. IEEE Trans. Med. Imaging 2021, 40, 3820–3831. [Google Scholar] [CrossRef]
- Gupta, V.; Erdal, B.; Ramirez, C.; Floca, R.; Genereaux, B.; Bryson, S.; Bridge, C.; Kleesiek, J.; Nensa, F.; Braren, R.; et al. Current State of Community-Driven Radiological AI Deployment in Medical Imaging. JMIR AI 2024, 3, e55833. [Google Scholar] [CrossRef] [PubMed]
- Vandewinckele, L.; Claessens, M.; Dinkla, A.; Brouwer, C.; Crijns, W.; Verellen, D.; Van Elmpt, W. Overview of Artificial Intelligence-Based Applications in Radiotherapy: Recommendations for Implementation and Quality Assurance. Radiother. Oncol. 2020, 153, 55–66. [Google Scholar] [CrossRef] [PubMed]
- MONAI Consortium. MONAI: Medical Open Network for AI; Zenodo: Genève, Switzerland, 2024. [Google Scholar] [CrossRef]
- Ziegler, E.; Urban, T.; Brown, D.; Petts, J.; Pieper, S.D.; Lewis, R.; Hafey, C.; Harris, G.J. Open Health Imaging Foundation Viewer: An Extensible Open-Source Framework for Building Web-Based Imaging Applications to Support Cancer Research. JCO Clin. Cancer Inform. 2020, 4, 336–345. [Google Scholar] [CrossRef]
- Morozov, S.; Andreychenko, A.; Pavlov, N.; Vladzymyrskyy, A.; Ledikhova, N.; Gombolevskiy, V.; Blokhin, I.; Gelezhe, P.; Gonchar, A.; Chernina, V.Y. MosMedData: Chest CT Scans with COVID-19 Related Findings Dataset. arXiv 2020, arXiv:2005.06465. [Google Scholar] [CrossRef]
- Codella, N.; Rotemberg, V.; Tschandl, P.; Celebi, M.E.; Dusza, S.; Gutman, D.; Helba, B.; Kalloo, A.; Liopyris, K.; Marchetti, M.; et al. Skin Lesion Analysis Toward Melanoma Detection 2018: A Challenge Hosted by the International Skin Imaging Collaboration (ISIC). arXiv 2019, arXiv:cs/1902.03368. [Google Scholar] [CrossRef]
- Shiraishi, J.; Katsuragawa, S.; Ikezoe, J.; Matsumoto, T.; Kobayashi, T.; Komatsu, K.i.; Matsui, M.; Fujita, H.; Kodera, Y.; Doi, K. Development of a Digital Image Database for Chest Radiographs With and Without a Lung Nodule: Receiver Operating Characteristic Analysis of Radiologists’ Detection of Pulmonary Nodules. Am. J. Roentgenol. 2000, 174, 71–74. [Google Scholar] [CrossRef]
- Tang, Y.B.; Tang, Y.X.; Xiao, J.; Summers, R.M. XLSor: A Robust and Accurate Lung Segmentor on Chest X-Rays Using Criss-Cross Attention and Customized Radiorealistic Abnormalities Generation. In Proceedings of the 2nd International Conference on Medical Imaging with Deep Learning. PMLR, London, UK, 8–10 July 2019; pp. 457–467. [Google Scholar]
- He, X.; Wang, S.; Chu, X.; Shi, S.; Tang, J.; Liu, X.; Yan, C.; Zhang, J.; Ding, G. Automated Model Design and Benchmarking of Deep Learning Models for COVID-19 Detection with Chest CT Scans. Proc. AAAI Conf. Artif. Intell. 2021, 35, 4821–4829. [Google Scholar] [CrossRef]
- Caicedo, J.C.; Goodman, A.; Karhohs, K.W.; Cimini, B.A.; Ackerman, J.; Haghighi, M.; Heng, C.; Becker, T.; Doan, M.; McQuin, C.; et al. Nucleus Segmentation across Imaging Experiments: The 2018 Data Science Bowl. Nat. Methods 2019, 16, 1247–1253. [Google Scholar] [CrossRef] [PubMed]
- Malík, P.; Knapová, K.; Krištofík, Š. Instance Segmentation Model Created from Three Semantic Segmentations of Mask, Boundary and Centroid Pixels Verified on GlaS Dataset. In Proceedings of the 2020 Federated Conference on Computer Science and Information Systems, Sofia, Bulgaria, 6–9 September 2020; pp. 569–576. [Google Scholar] [CrossRef]
- Khanna, A.; Londhe, N.D.; Gupta, S.; Semwal, A. A Deep Residual U-Net Convolutional Neural Network for Automated Lung Segmentation in Computed Tomography Images. Biocybern. Biomed. Eng. 2020, 40, 1314–1327. [Google Scholar] [CrossRef]
- Rudyanto, R.D.; Kerkstra, S.; van Rikxoort, E.M.; Fetita, C.; Brillet, P.Y.; Lefevre, C.; Xue, W.; Zhu, X.; Liang, J.; Öksüz, İ.; et al. Comparing Algorithms for Automated Vessel Segmentation in Computed Tomography Scans of the Lung: The VESSEL12 Study. Med. Image Anal. 2014, 18, 1217–1232. [Google Scholar] [CrossRef]
- Depeursinge, A.; Vargas, A.; Platon, A.; Geissbuhler, A.; Poletti, P.A.; Müller, H. Building a Reference Multimedia Database for Interstitial Lung Diseases. Comput. Med. Imaging Graph. 2012, 36, 227–238. [Google Scholar] [CrossRef] [PubMed]
- Nielsen, J. Chapter 5: Usability Heuristics. In Usability Engineering; Morgan Kaufmann: Burlington, MA, USA, 1994; pp. 115–164. [Google Scholar]
- Lai, C.L.; Karmakar, R.; Mukundan, A.; Natarajan, R.K.; Lu, S.C.; Wang, C.Y.; Wang, H.C. Advancing Hyperspectral Imaging and Machine Learning Tools toward Clinical Adoption in Tissue Diagnostics: A Comprehensive Review. APL Bioeng. 2024, 8, 041504. [Google Scholar] [CrossRef]
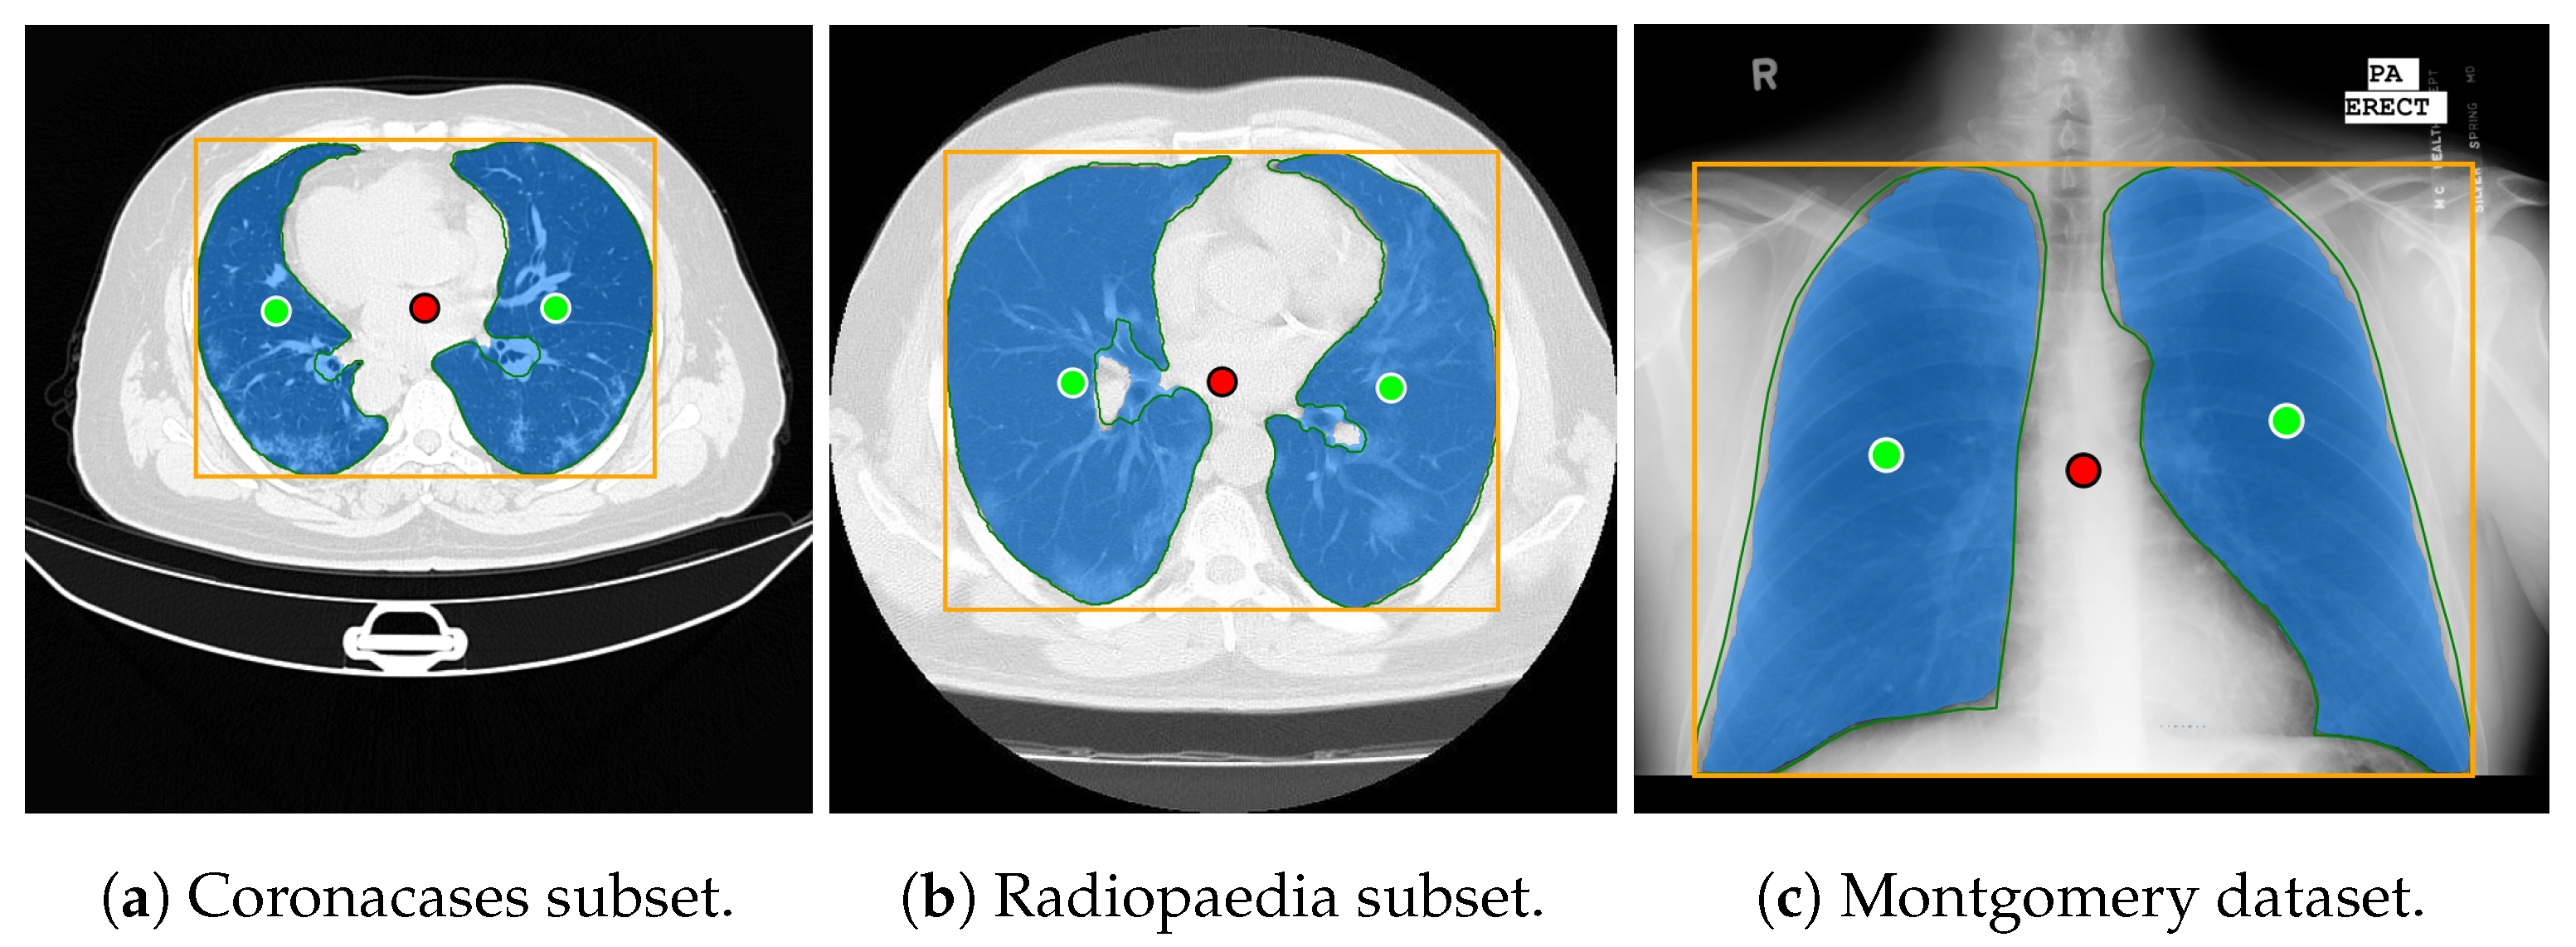
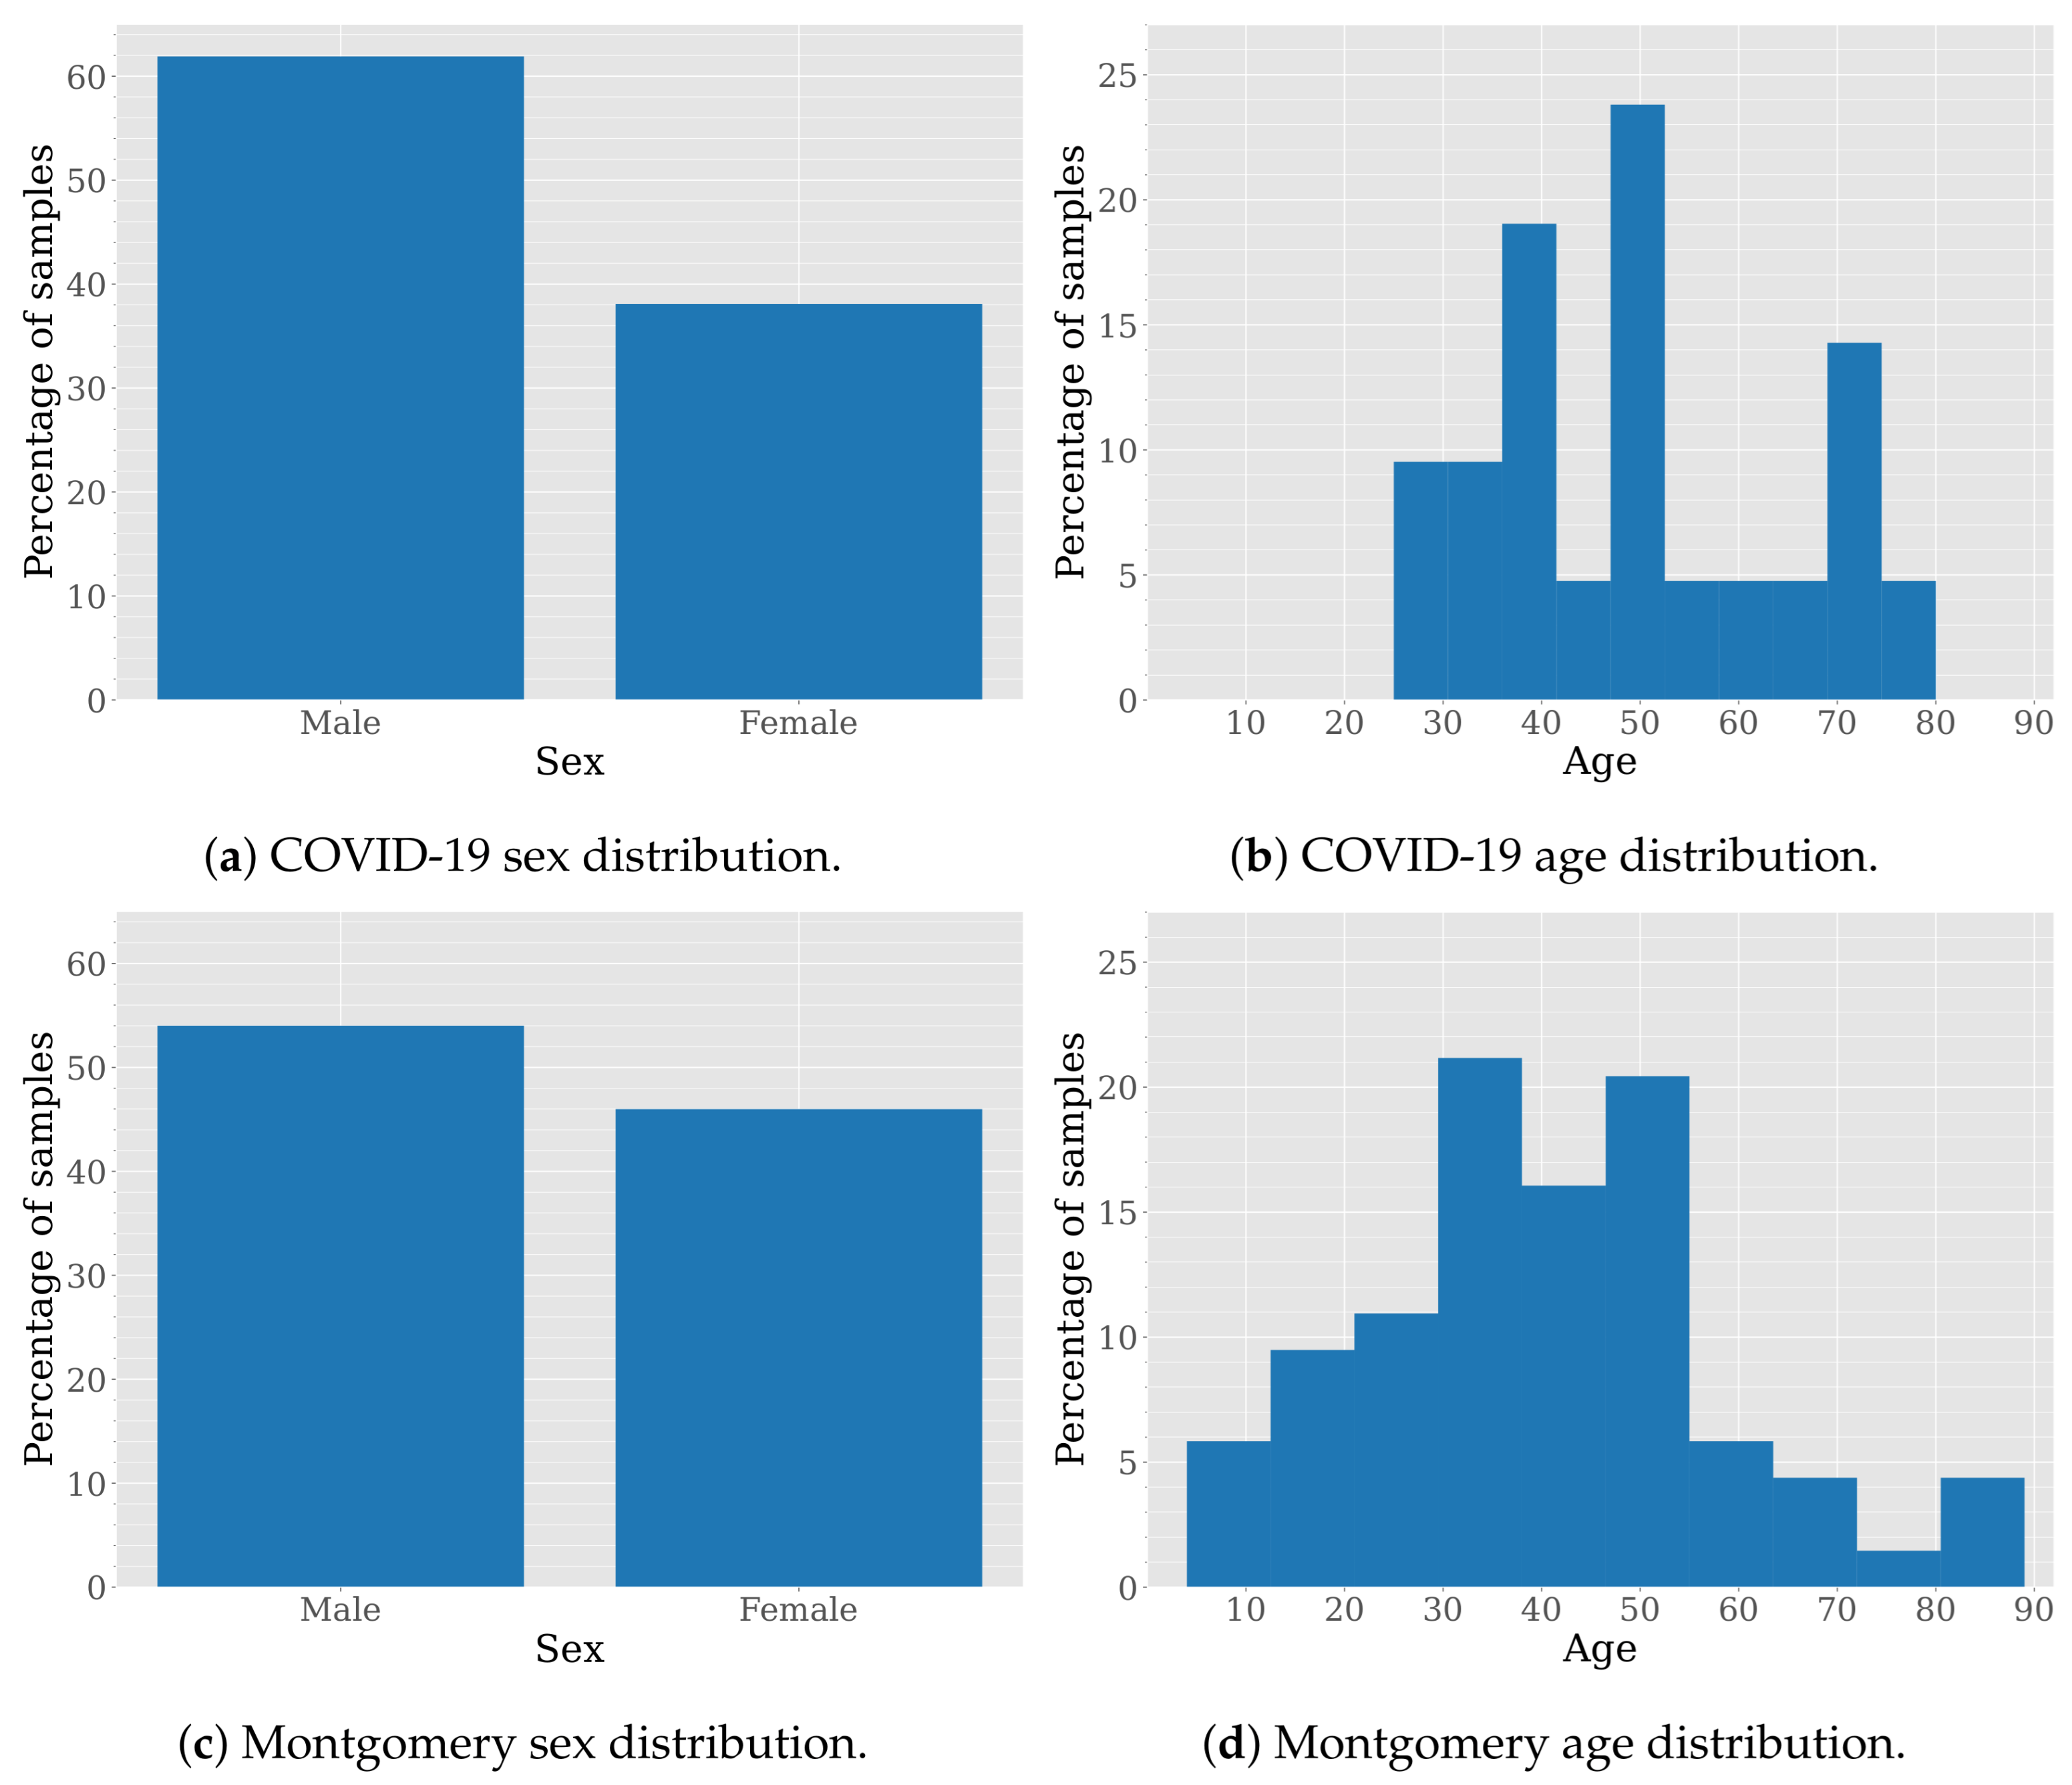
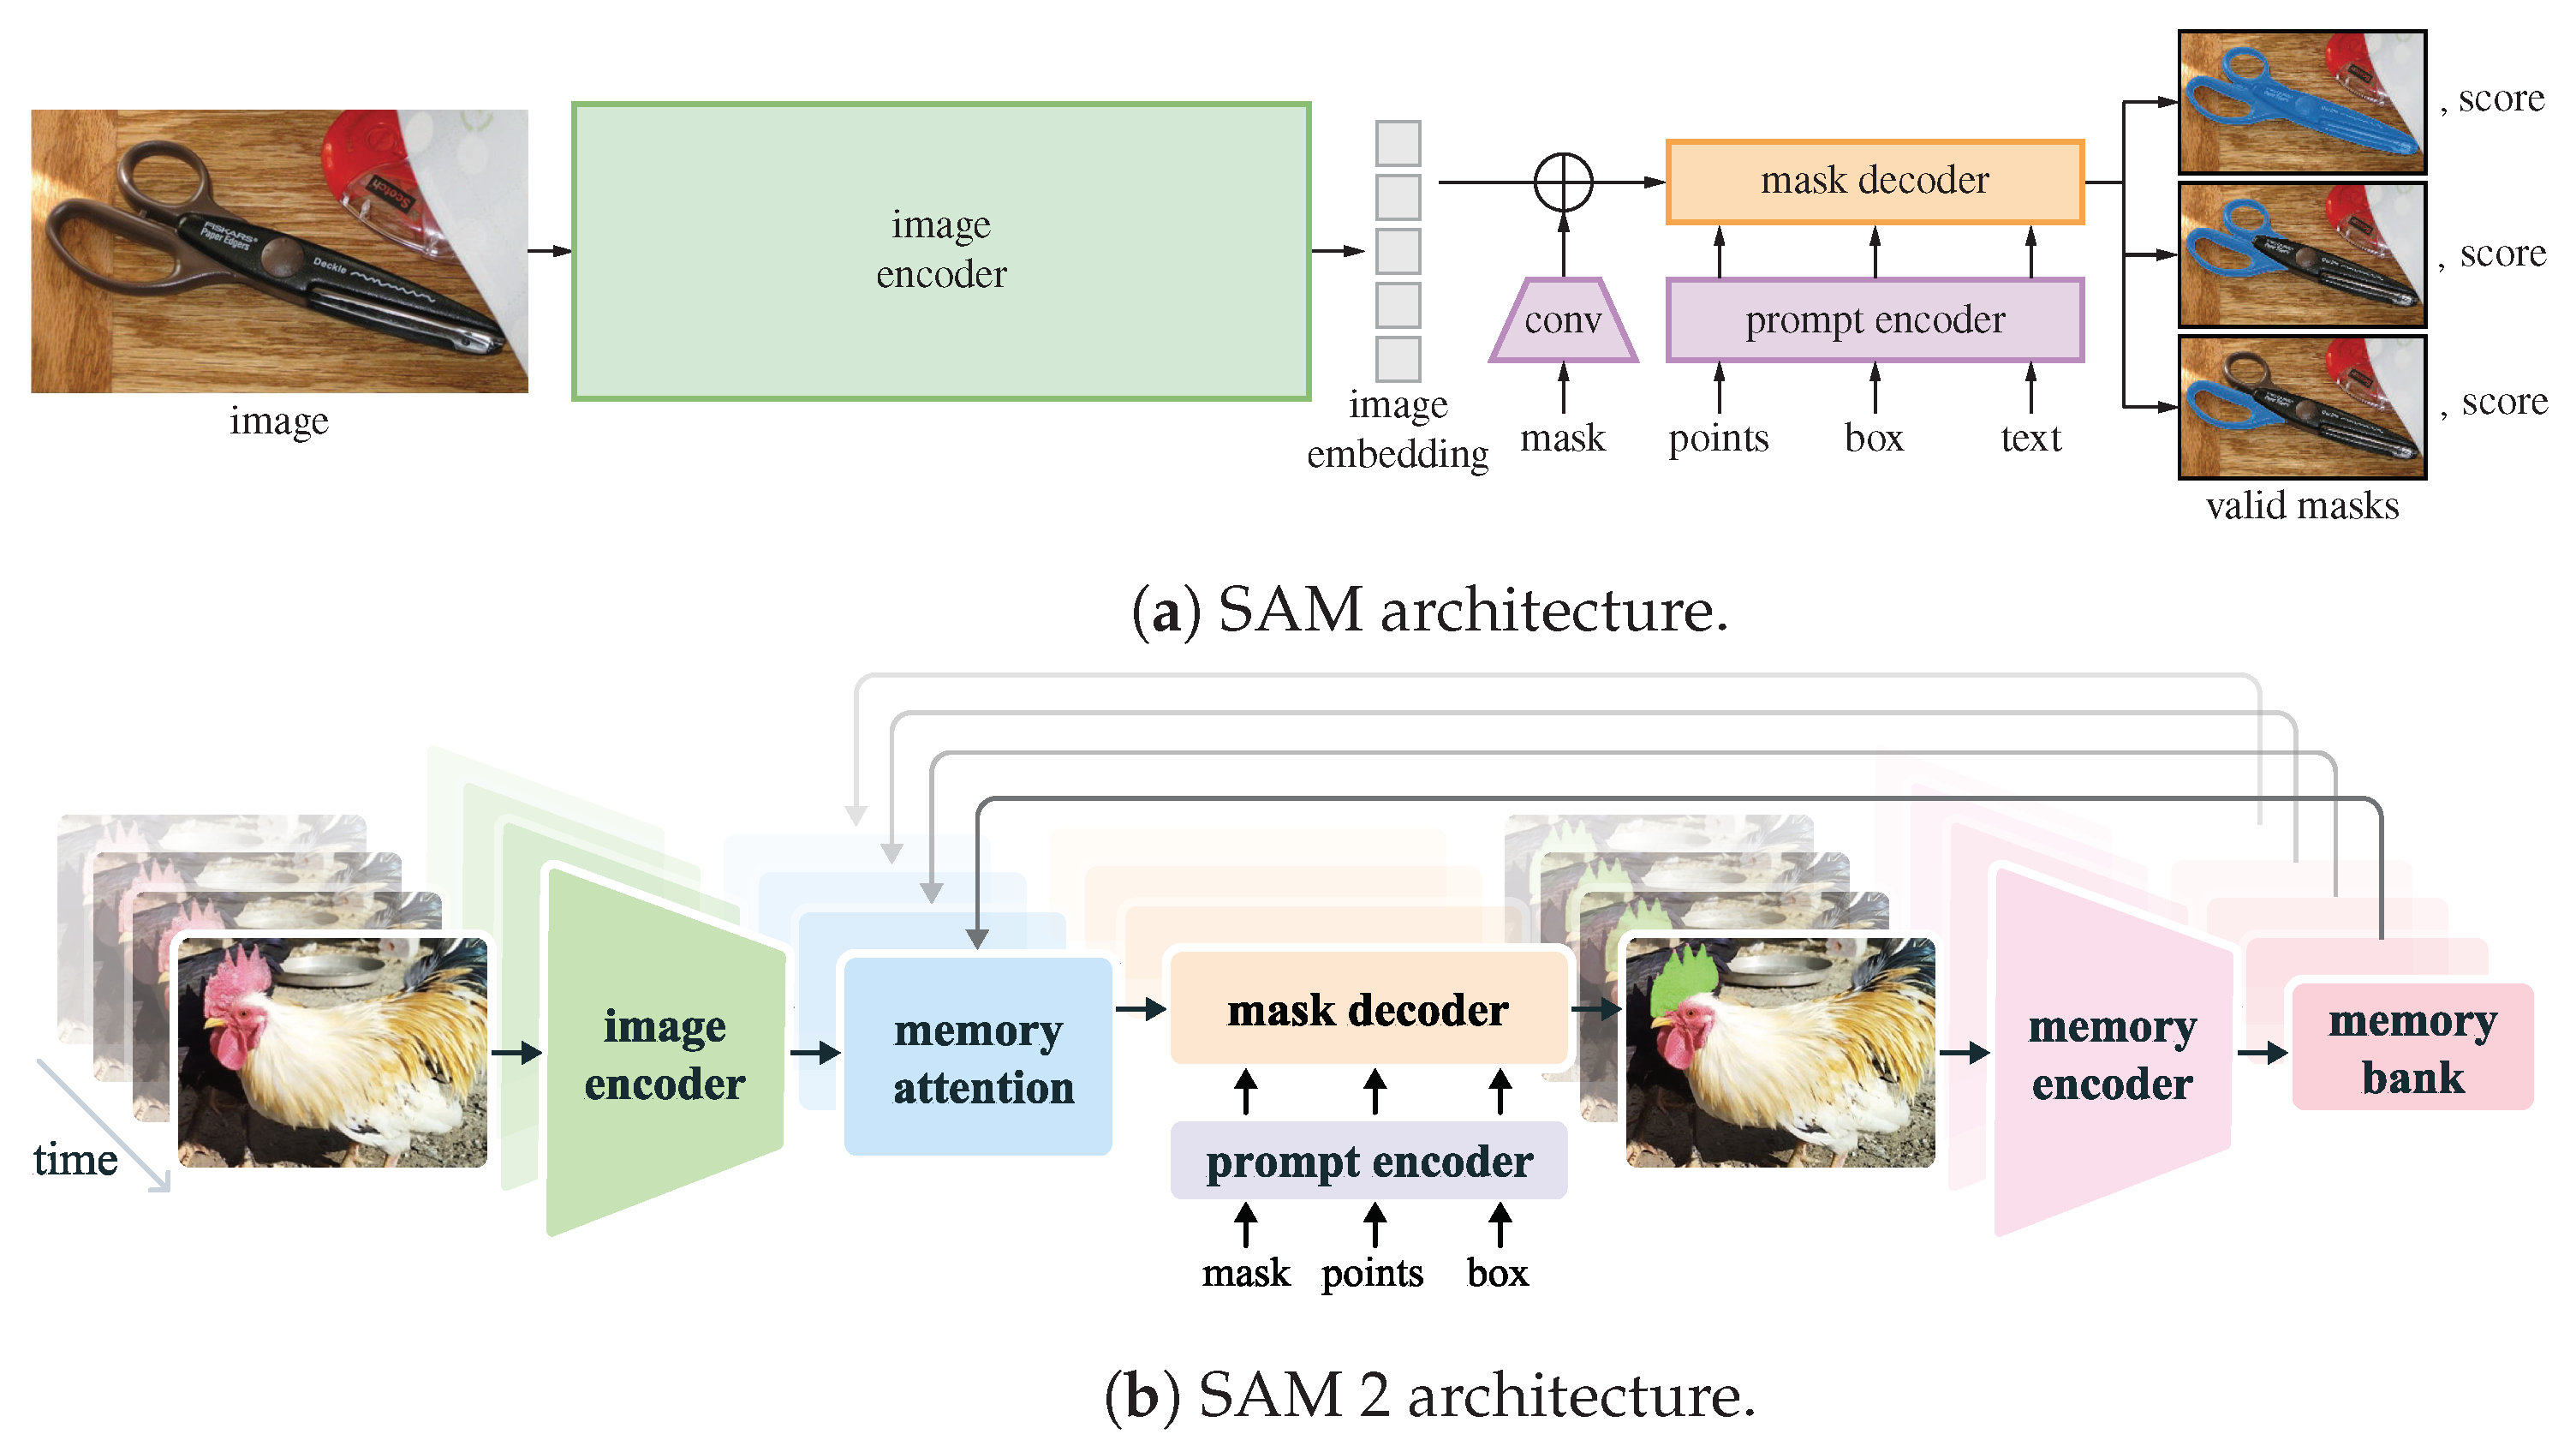
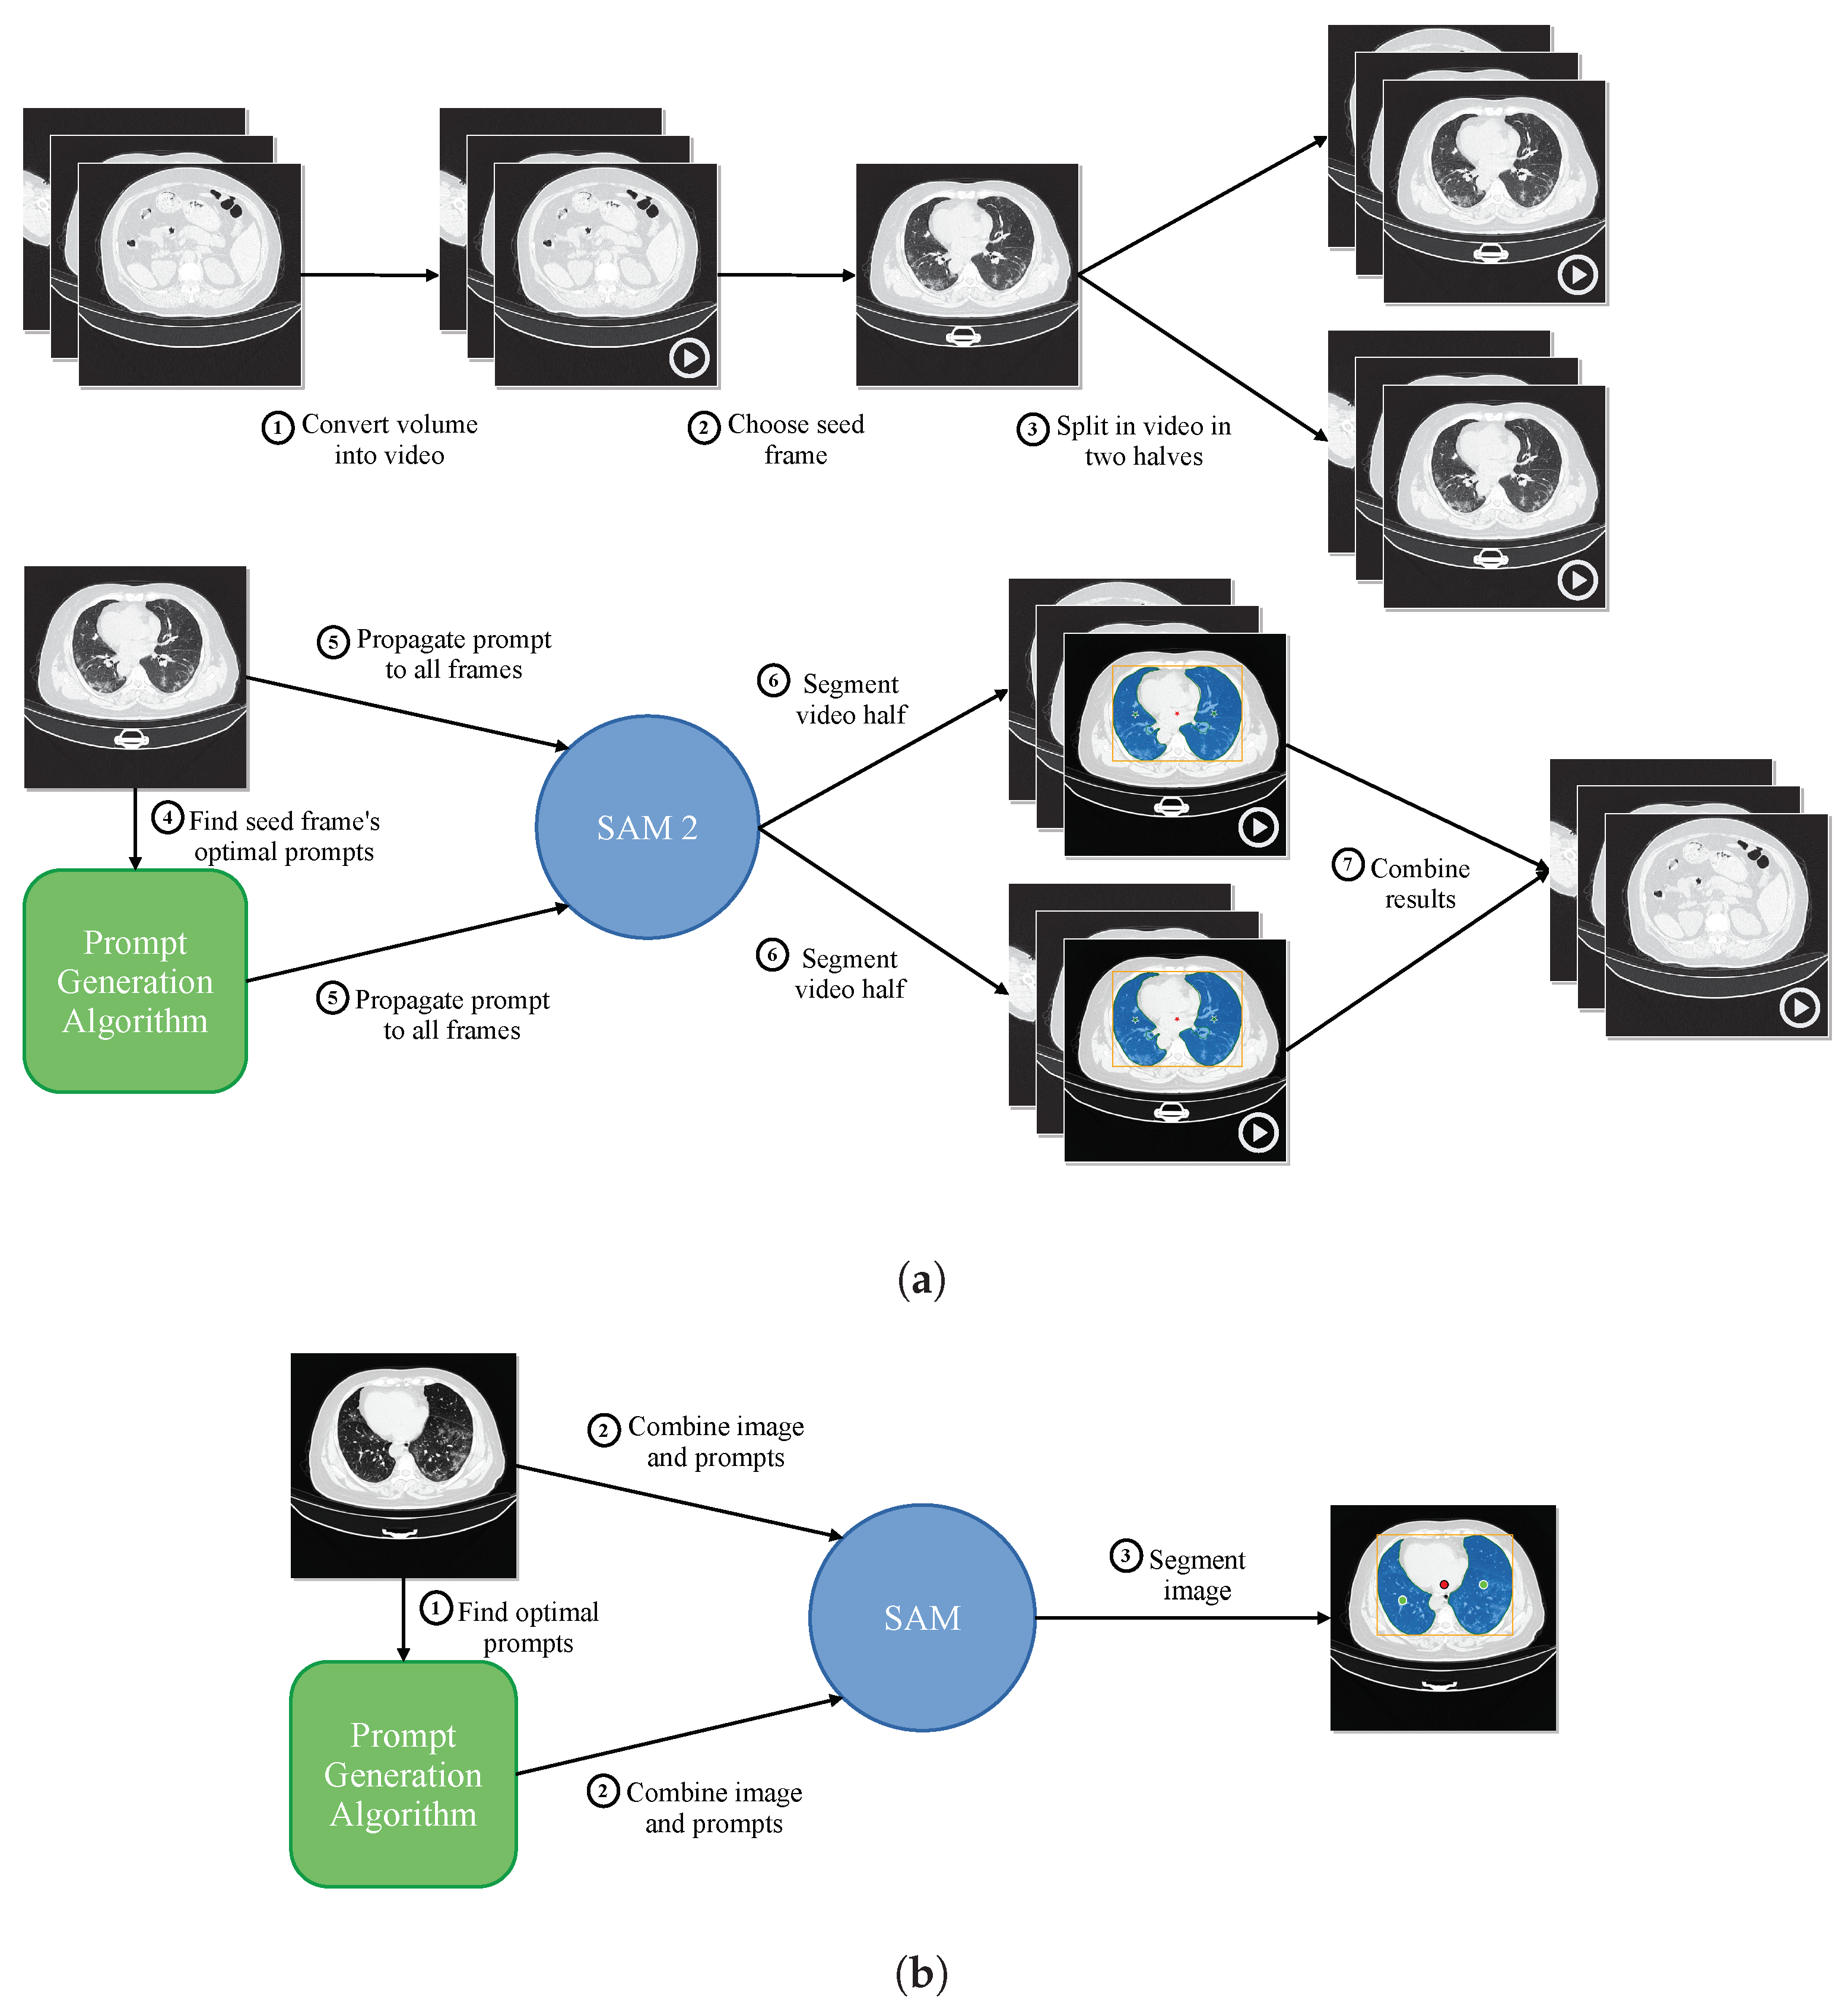
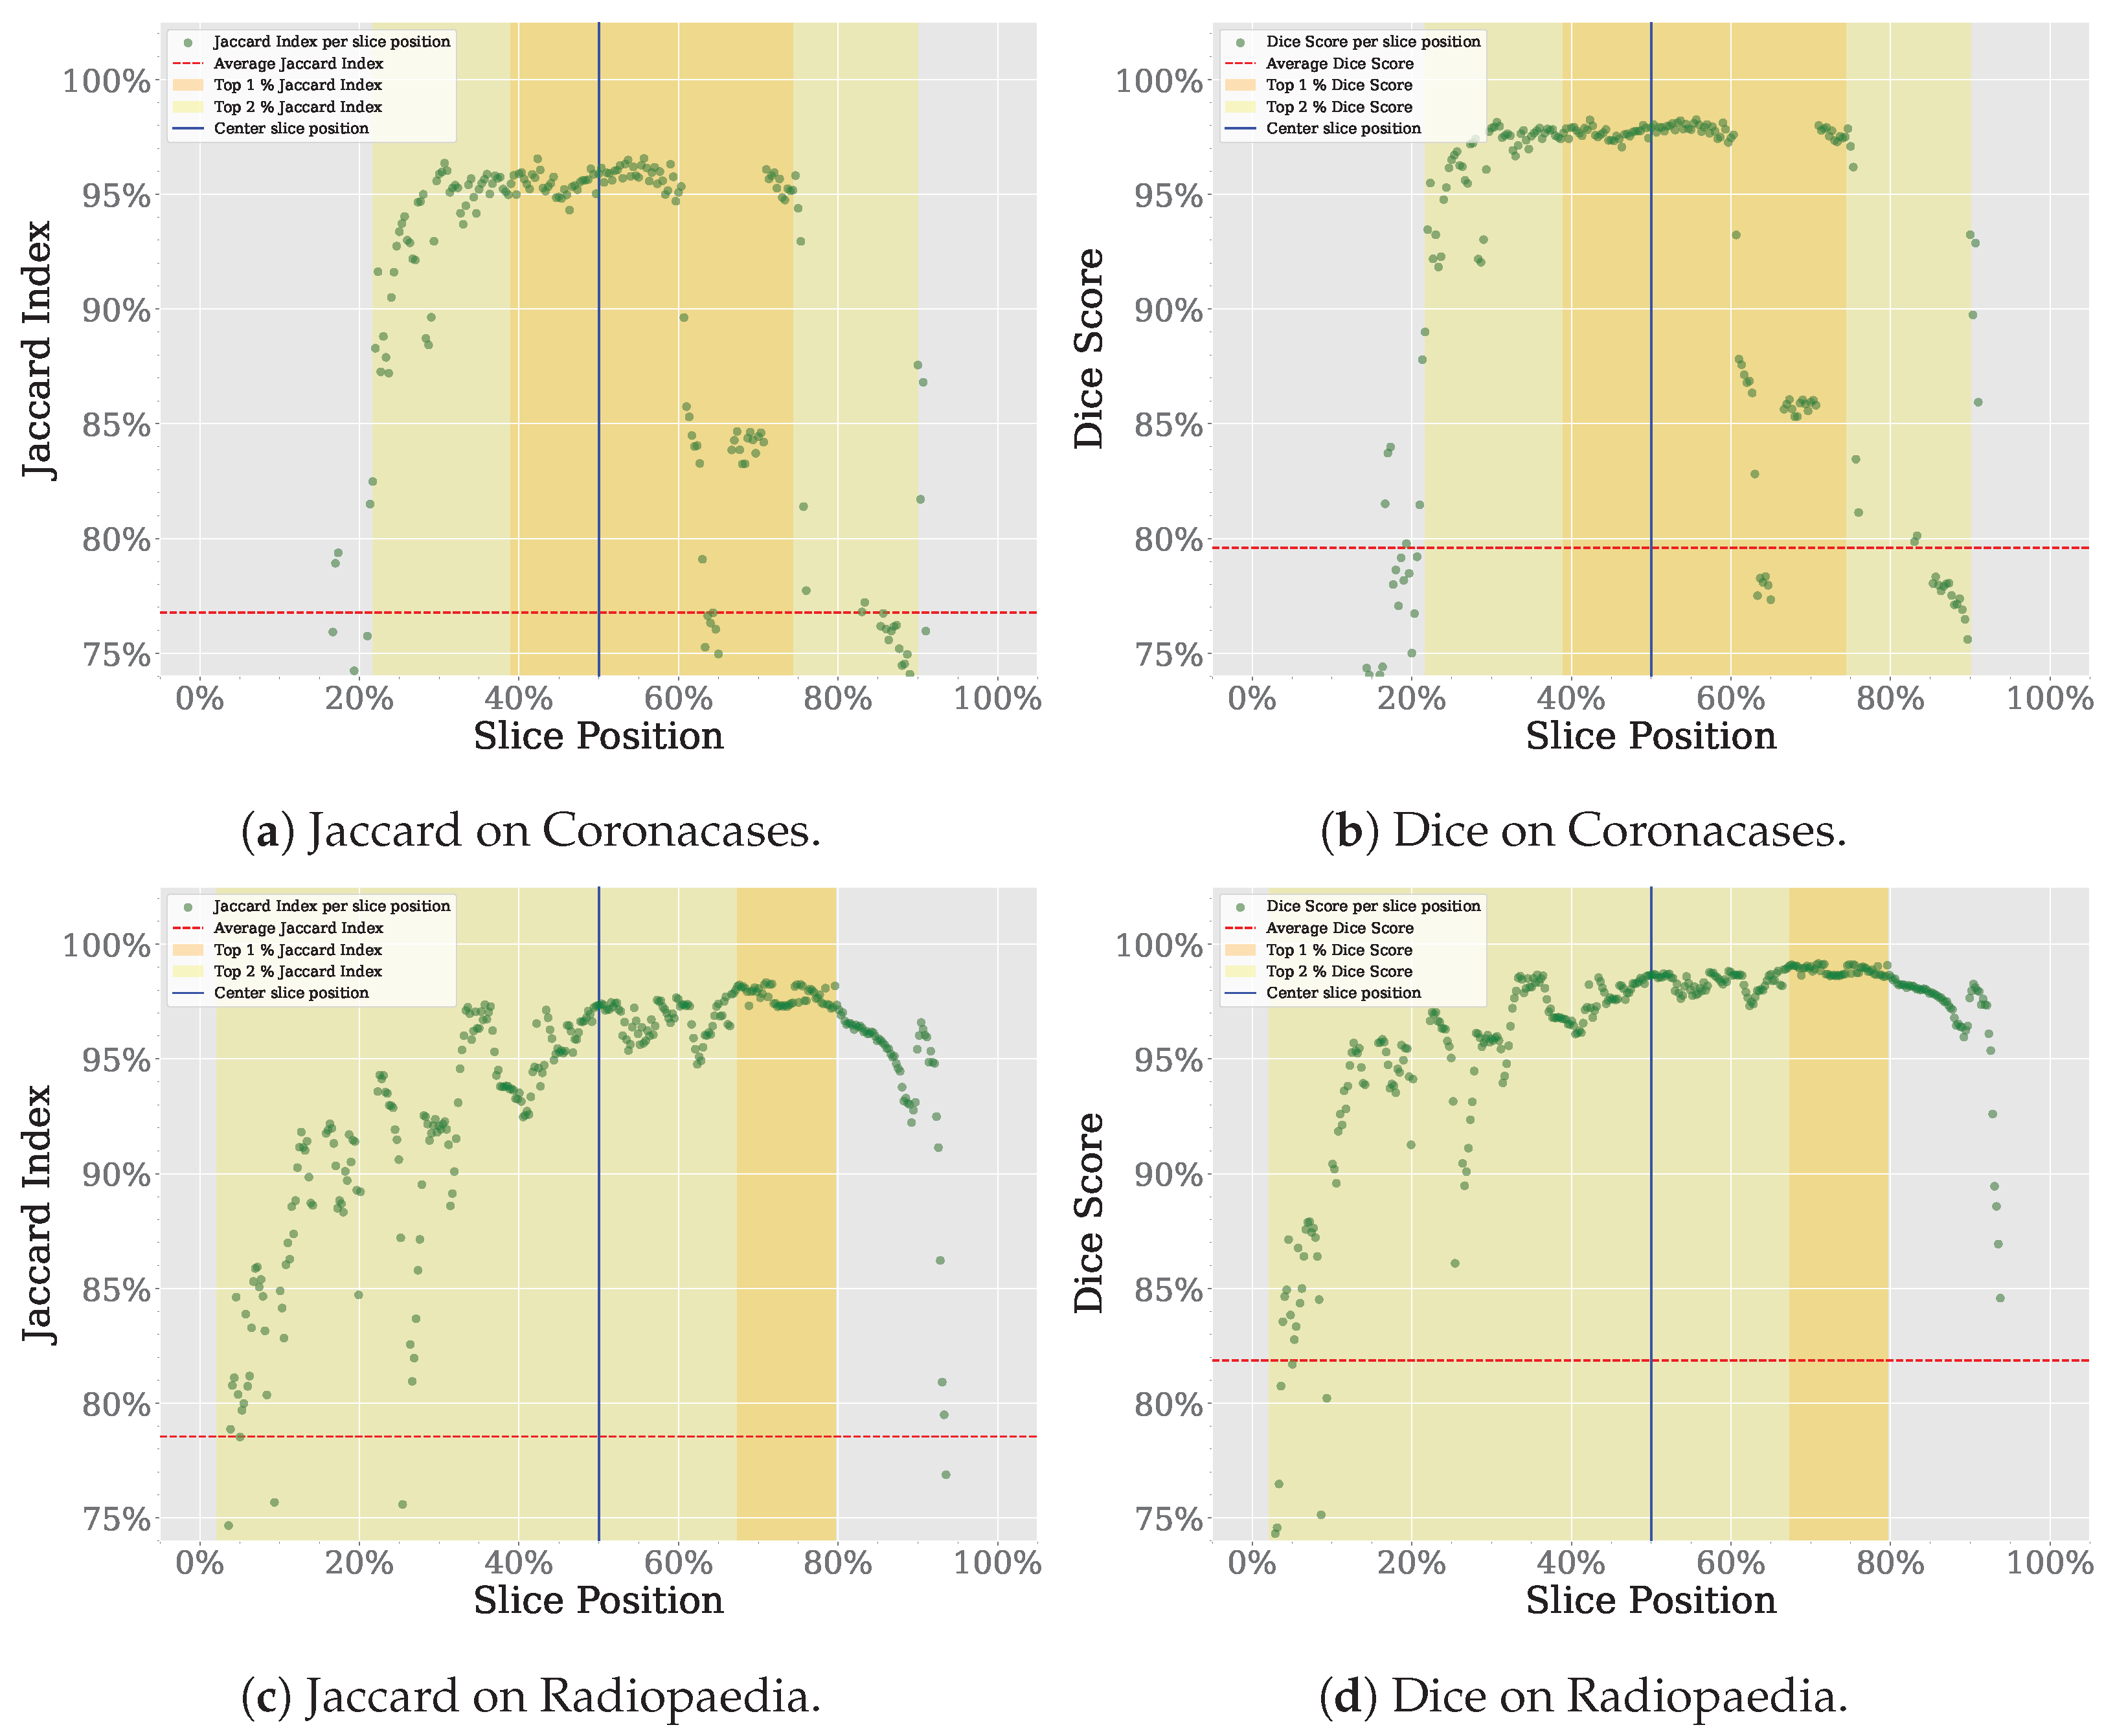
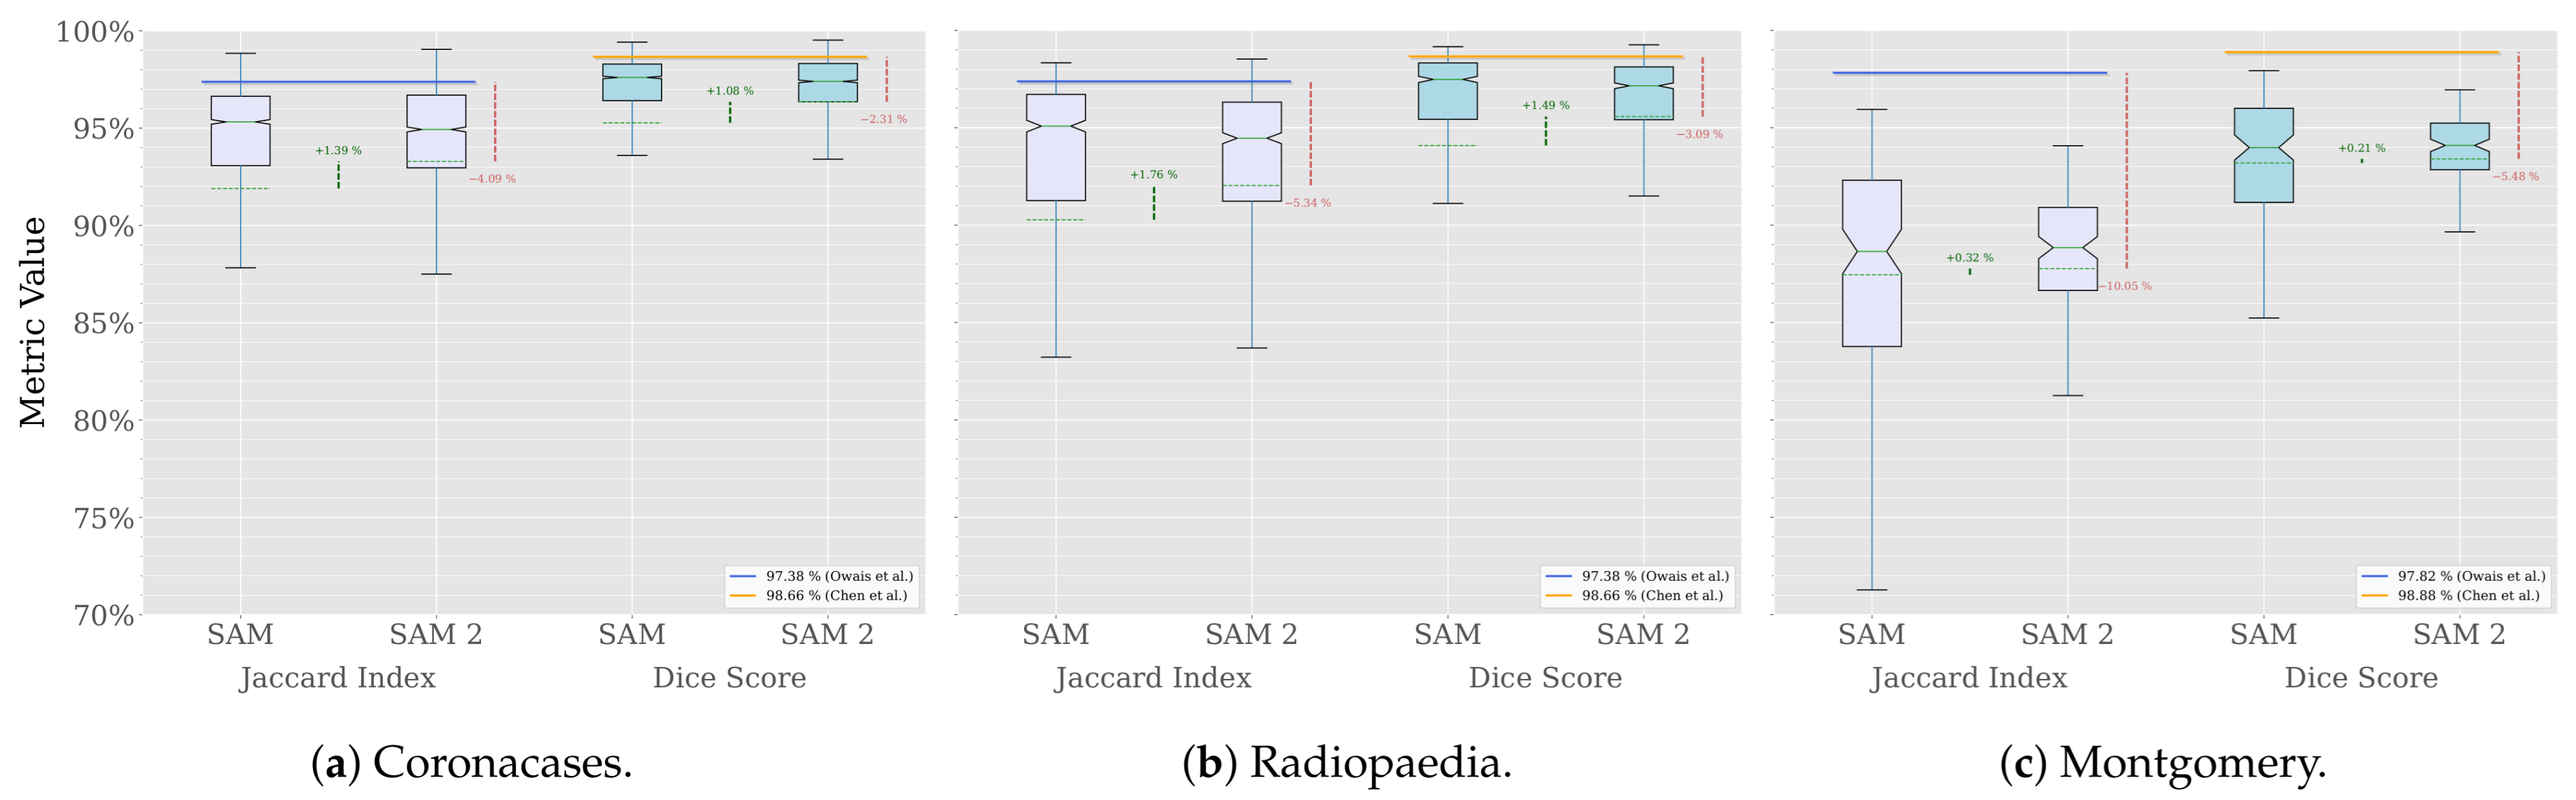

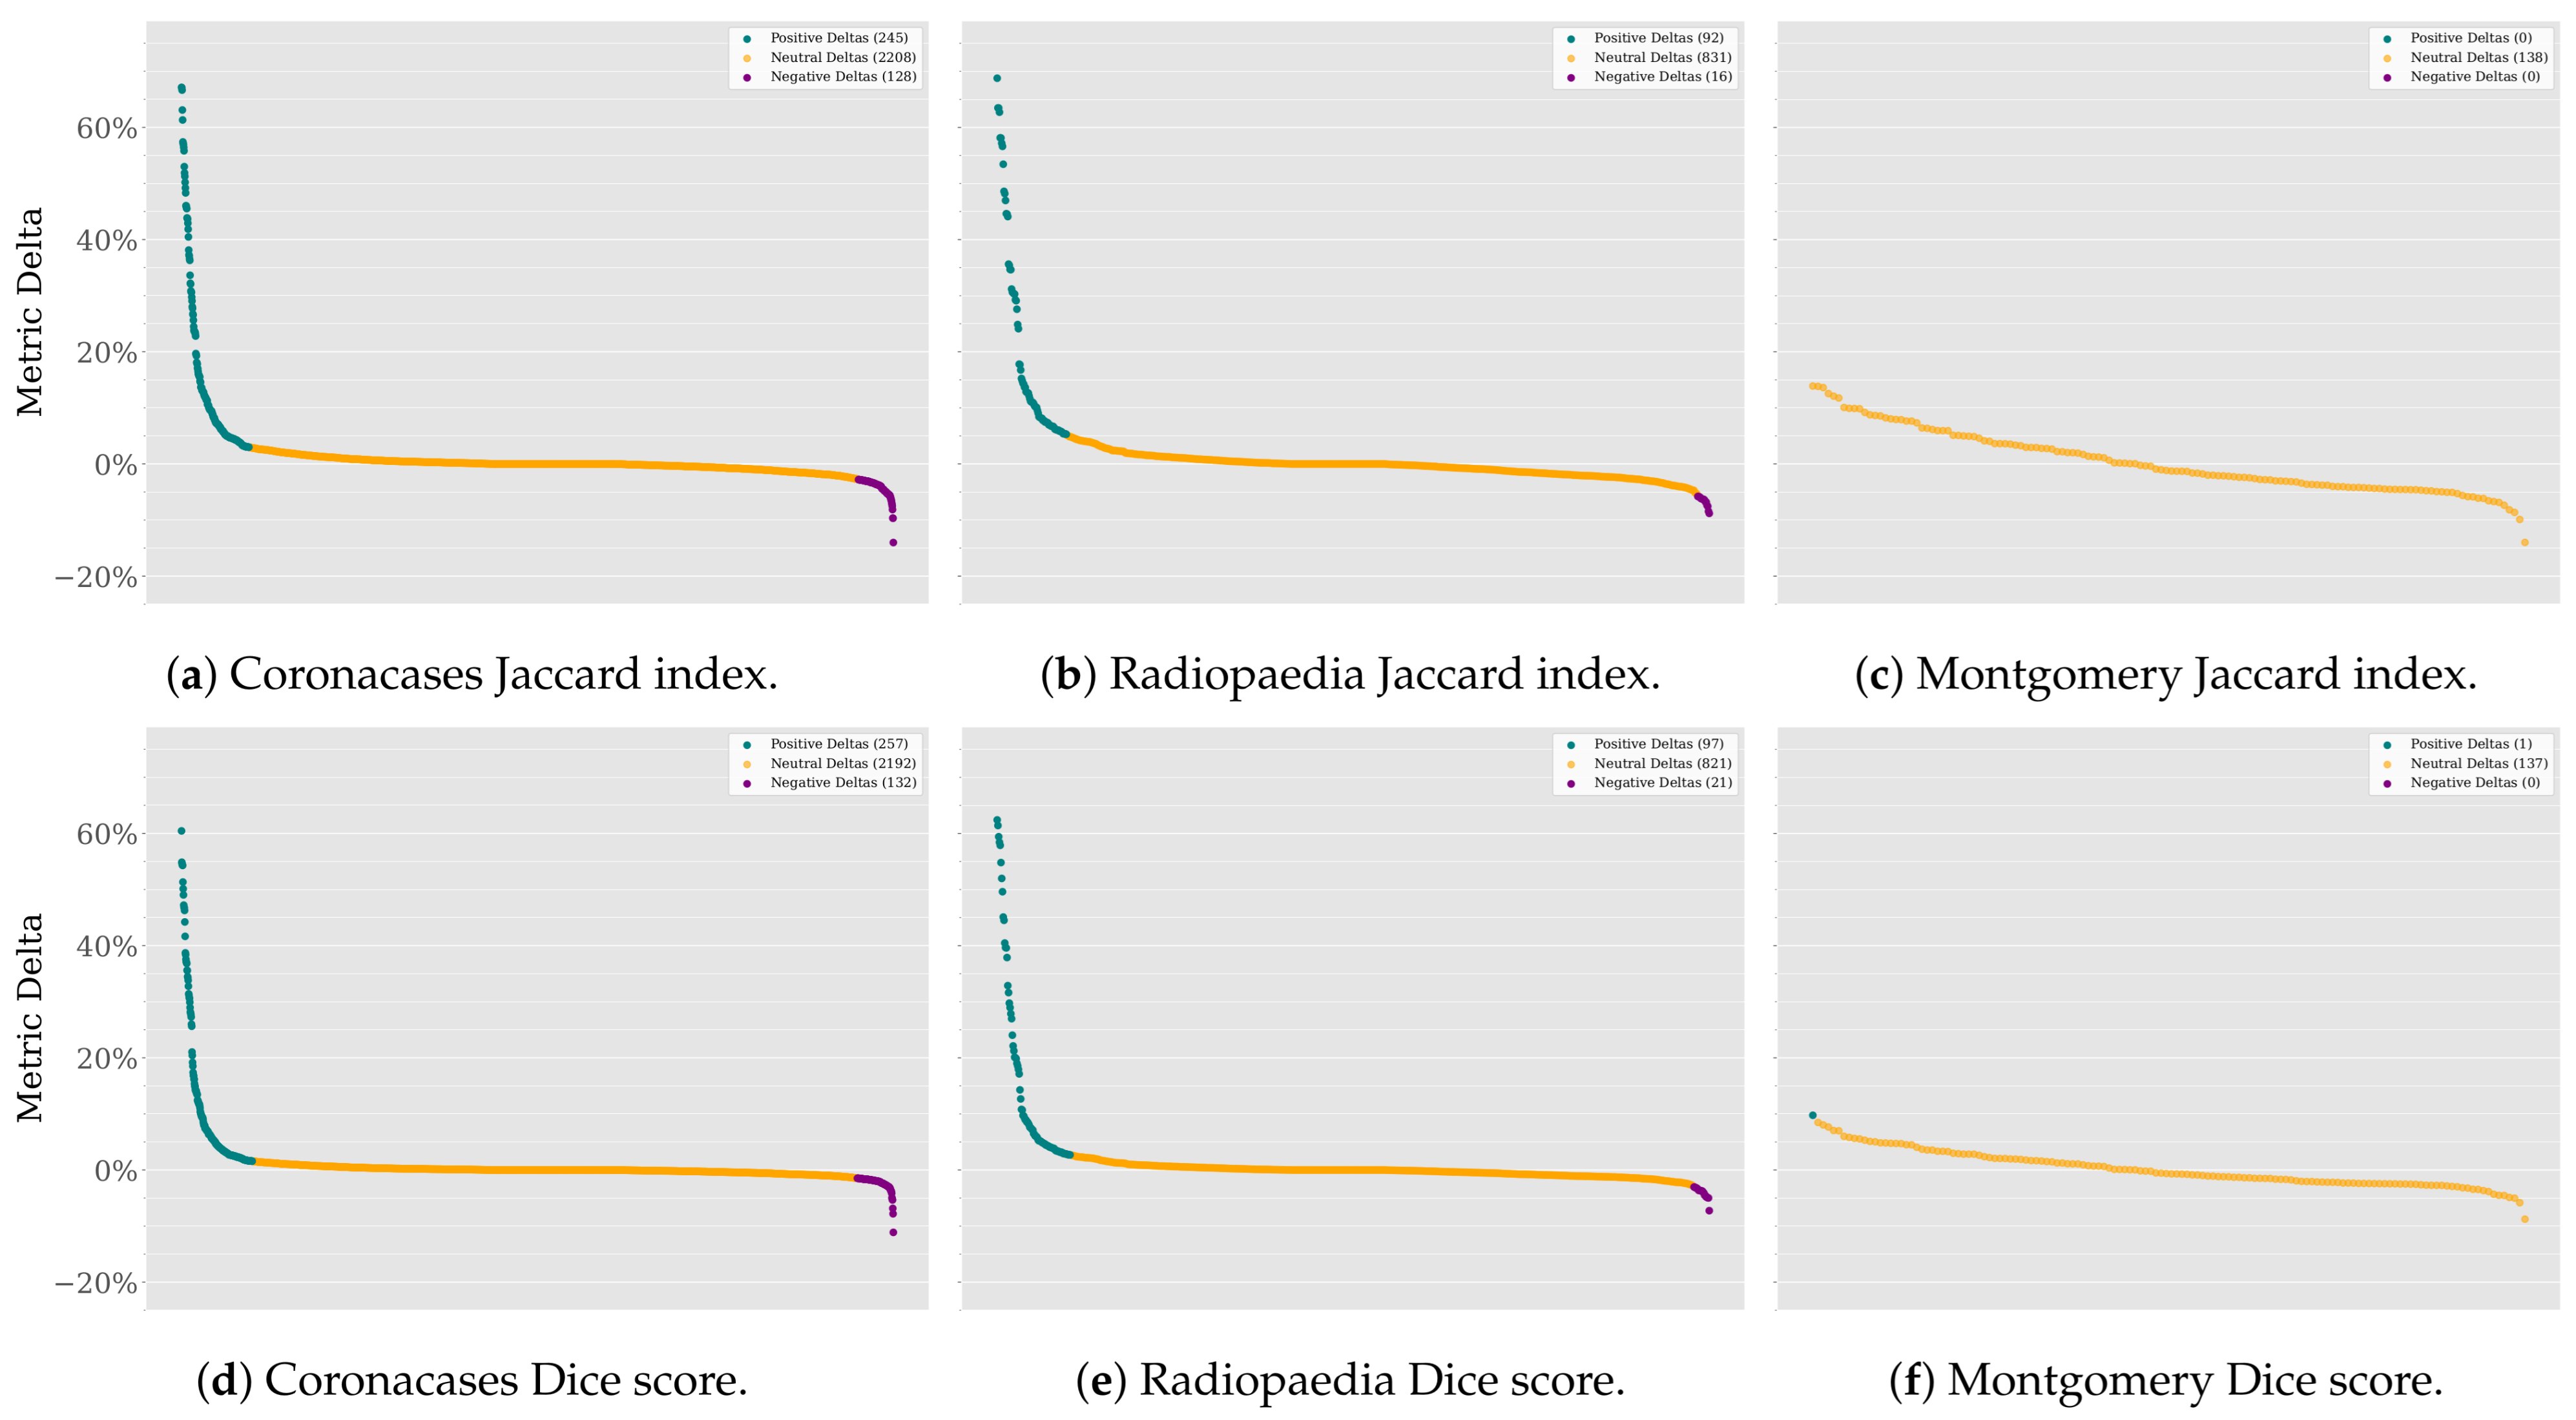
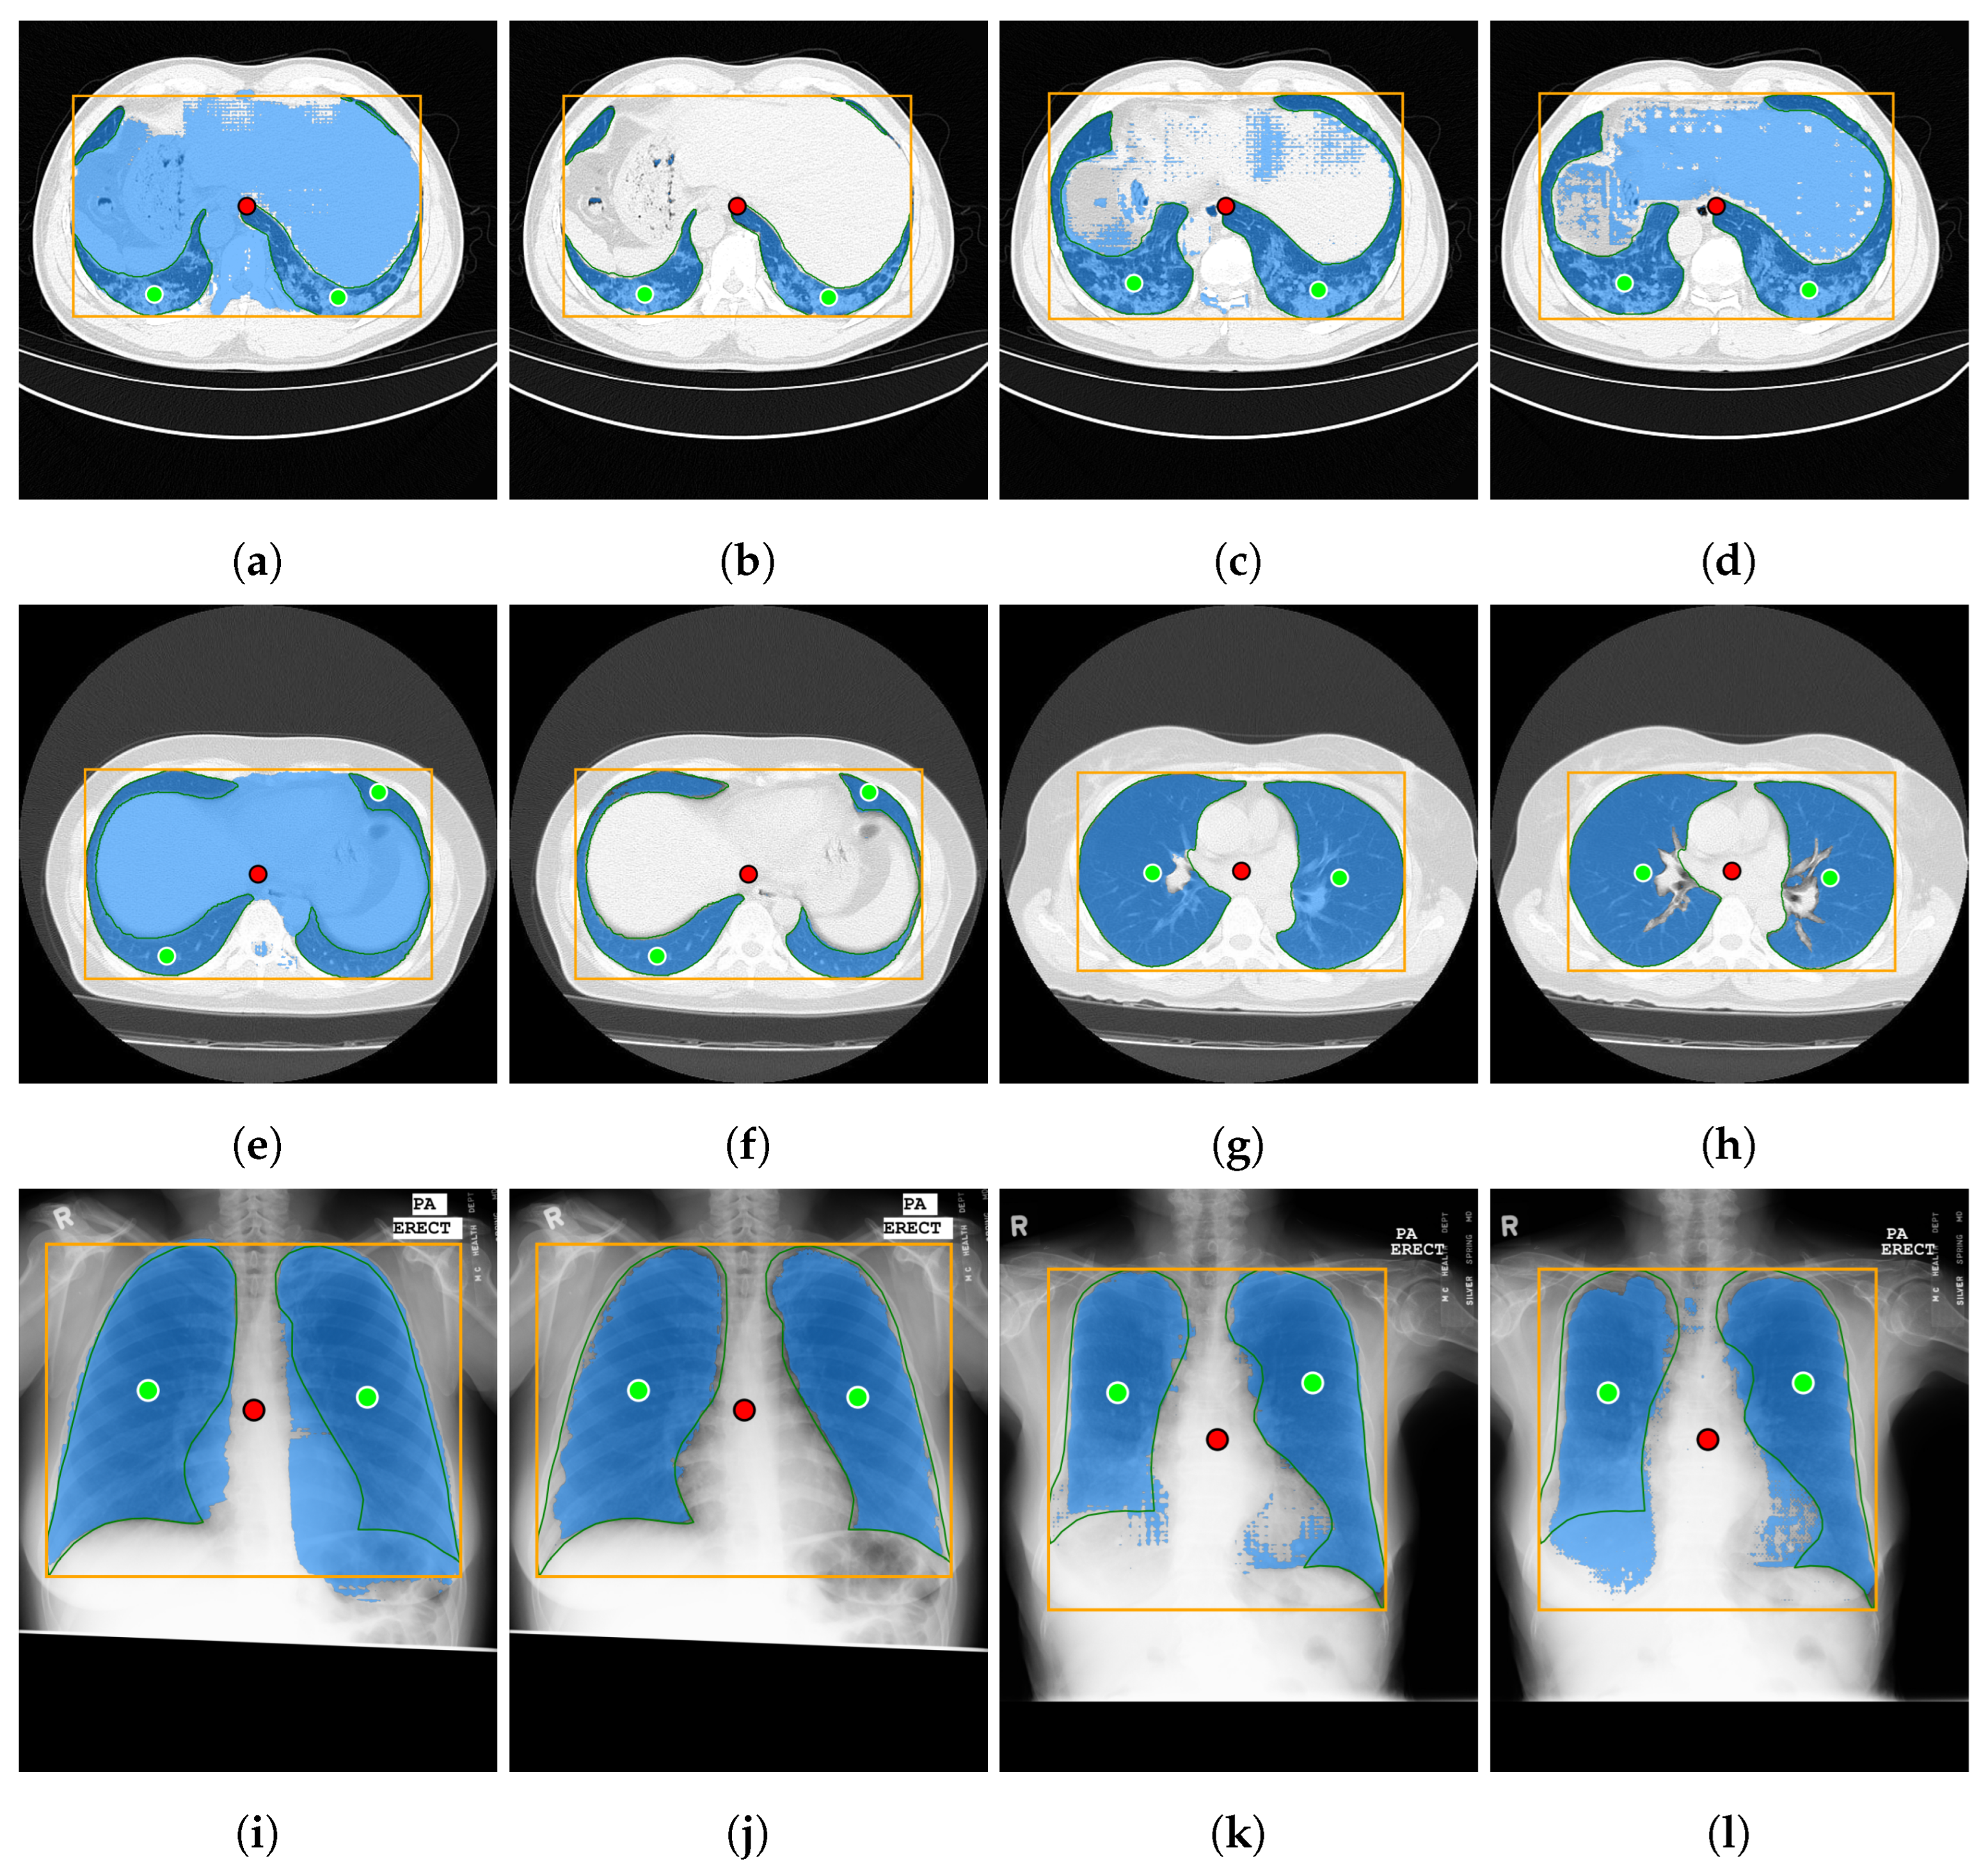
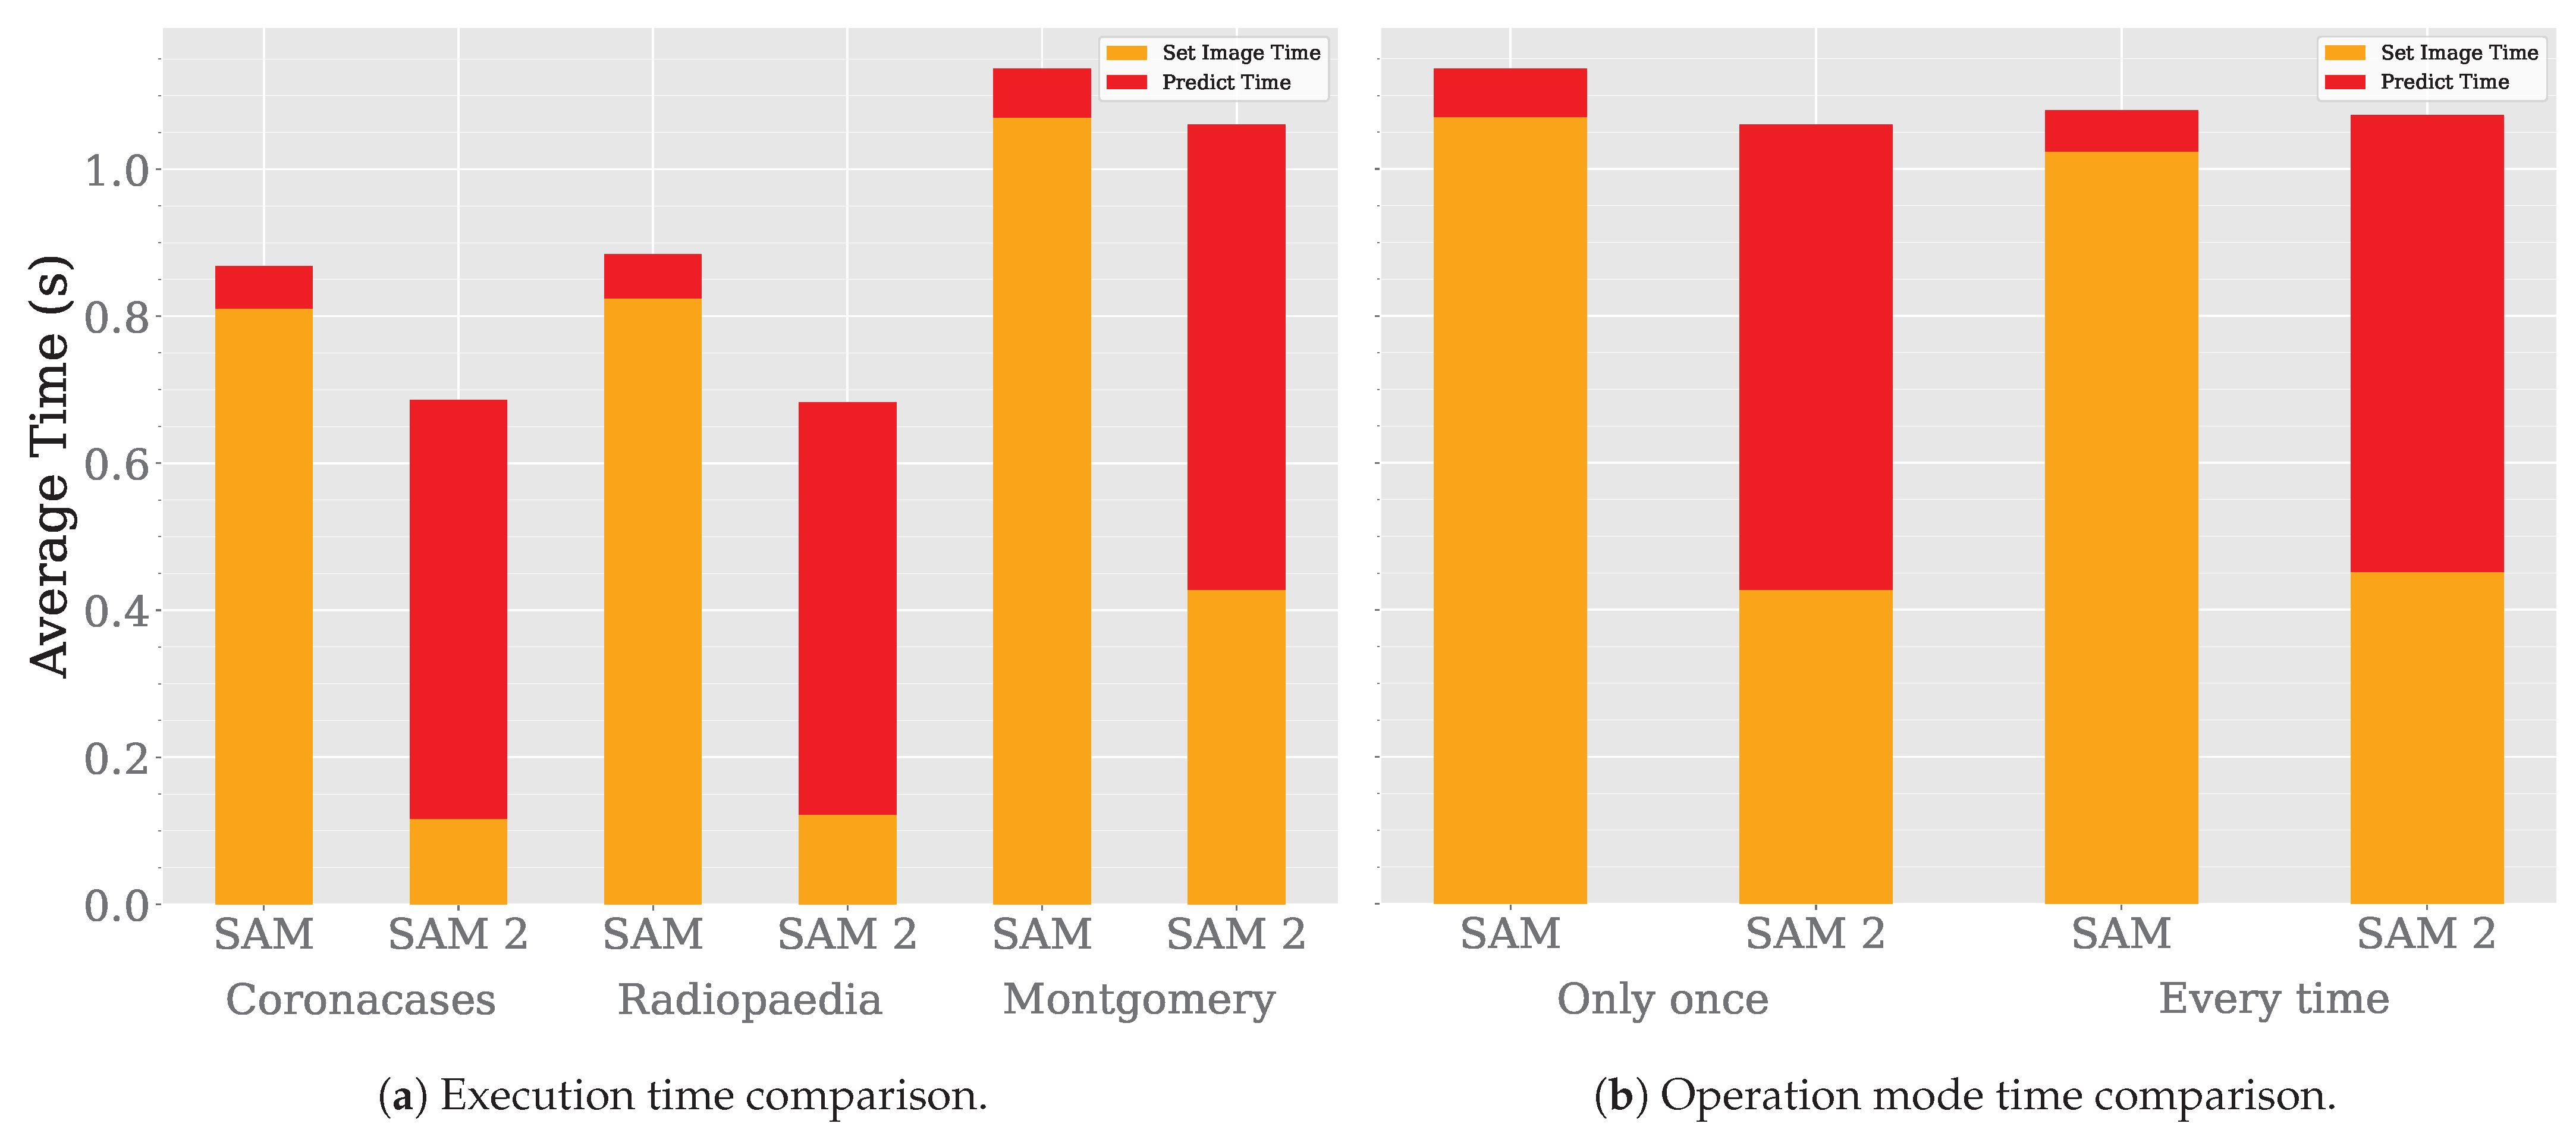
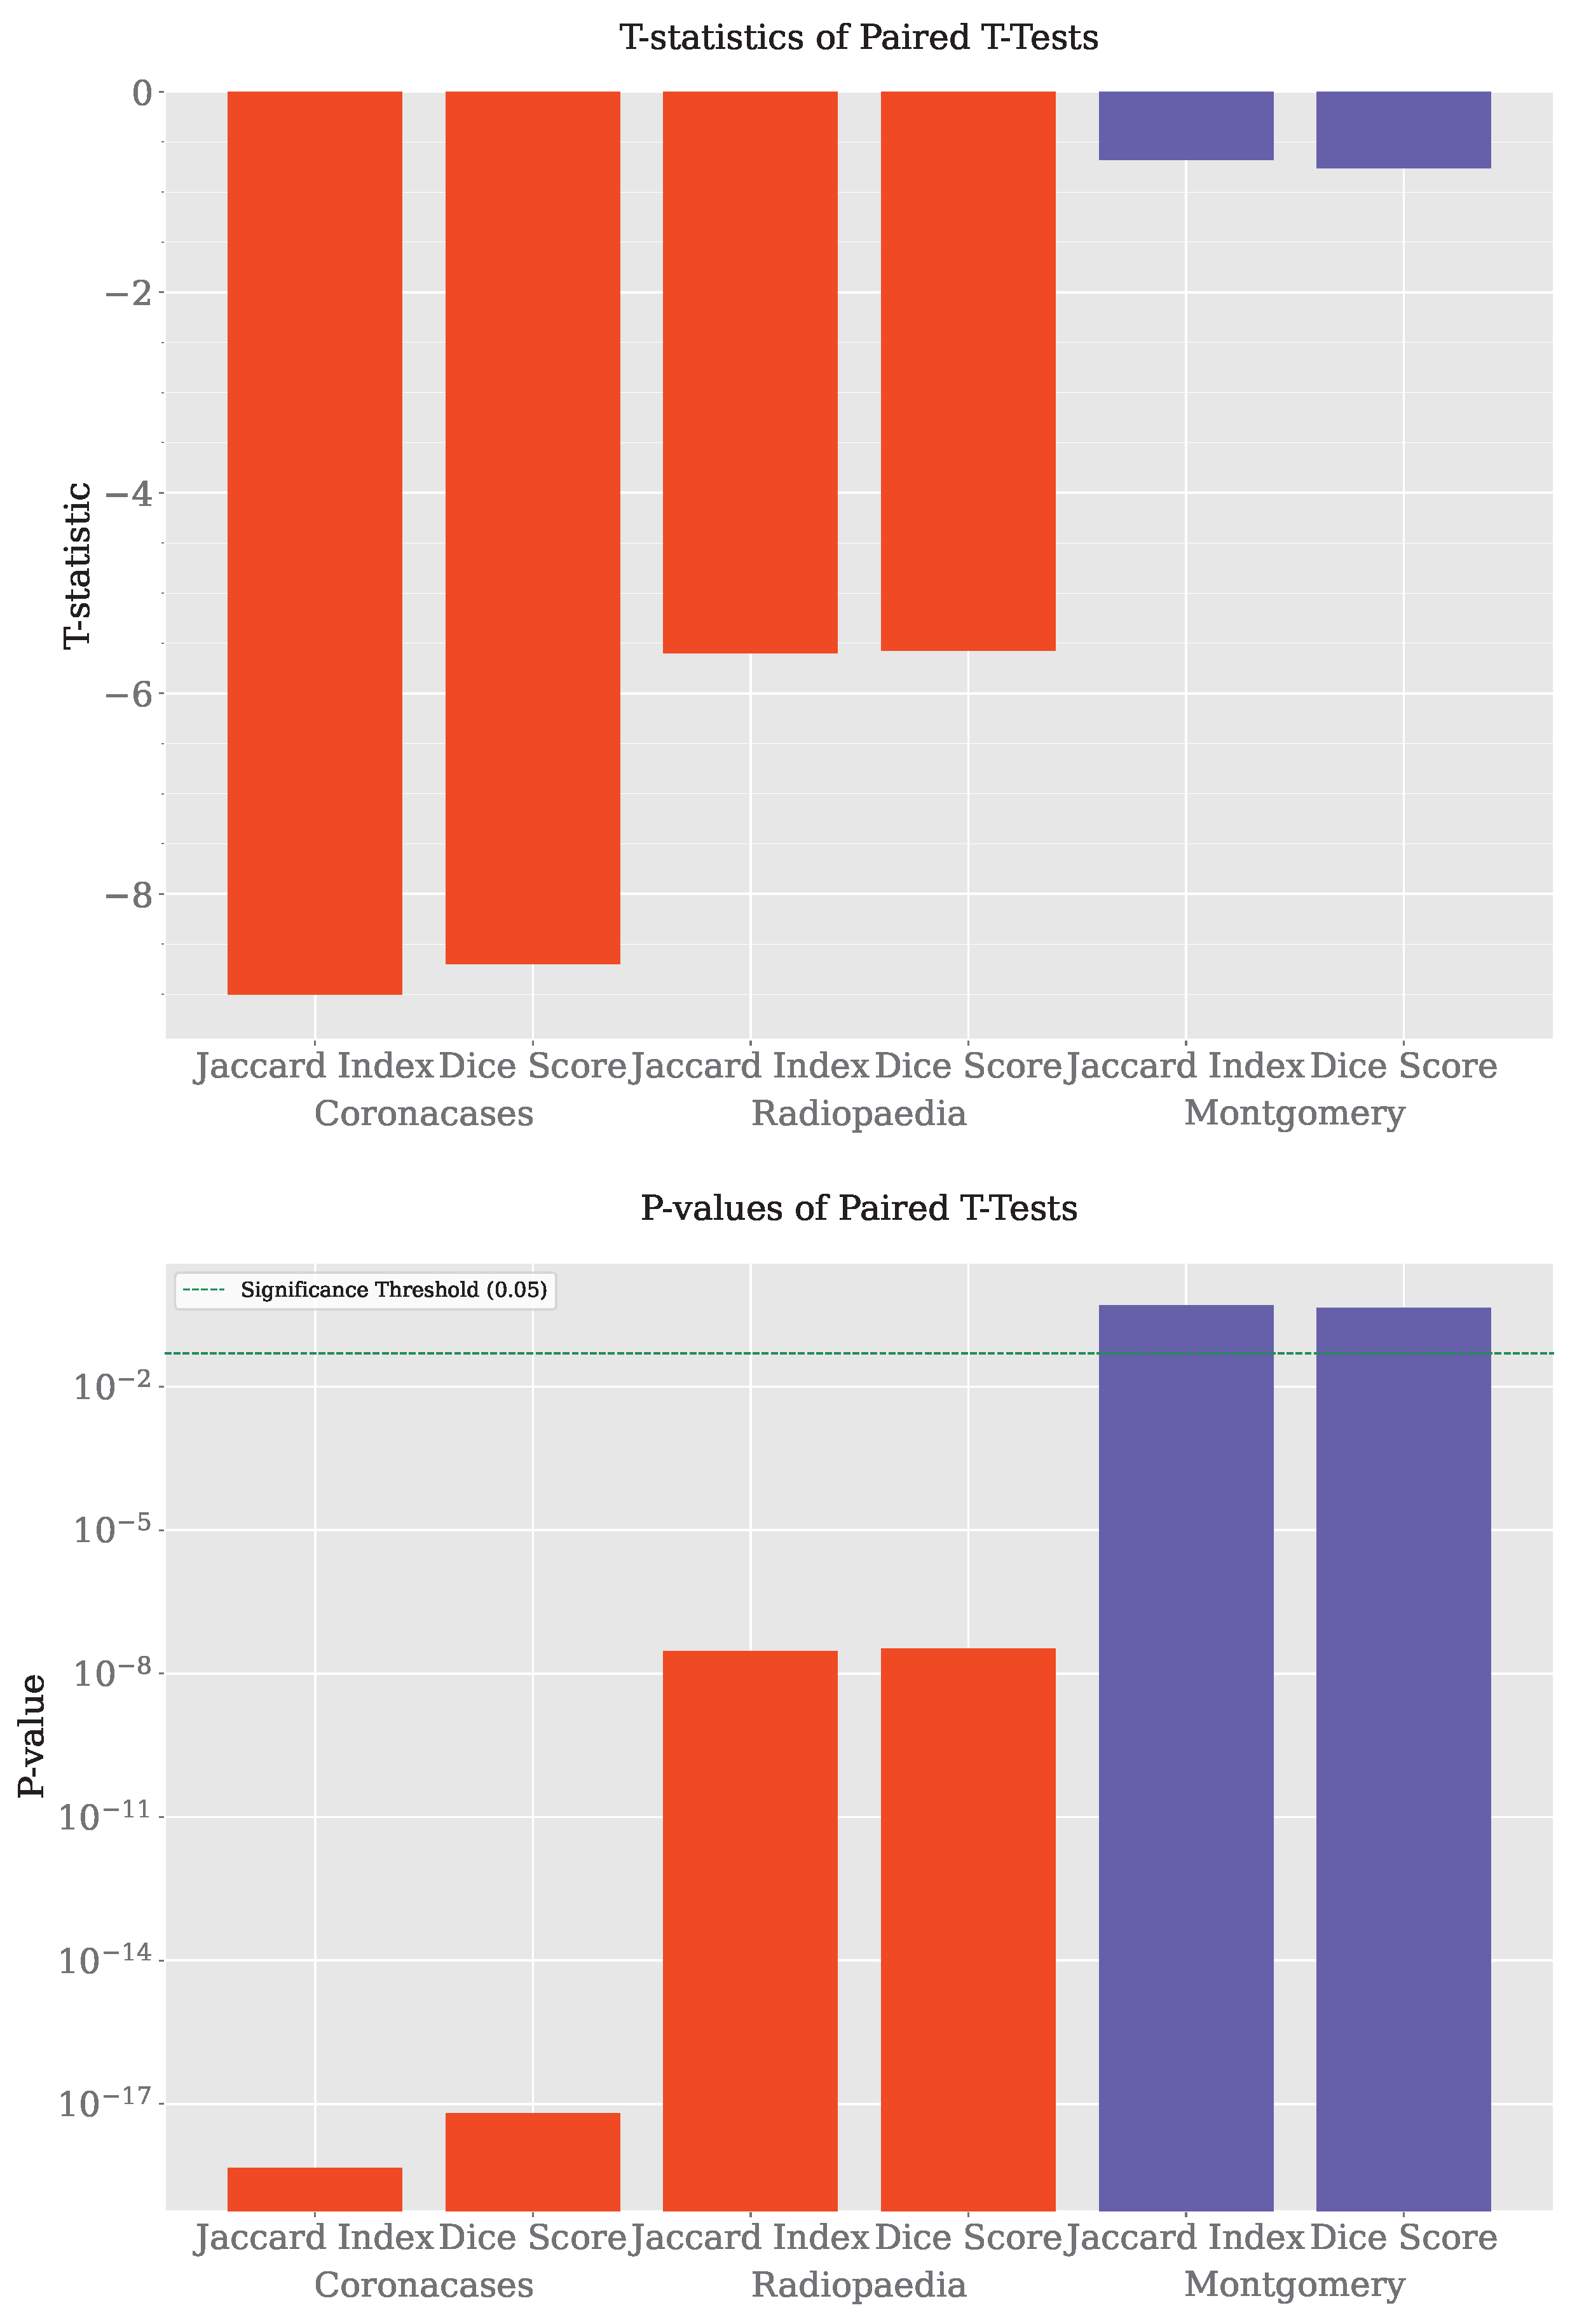
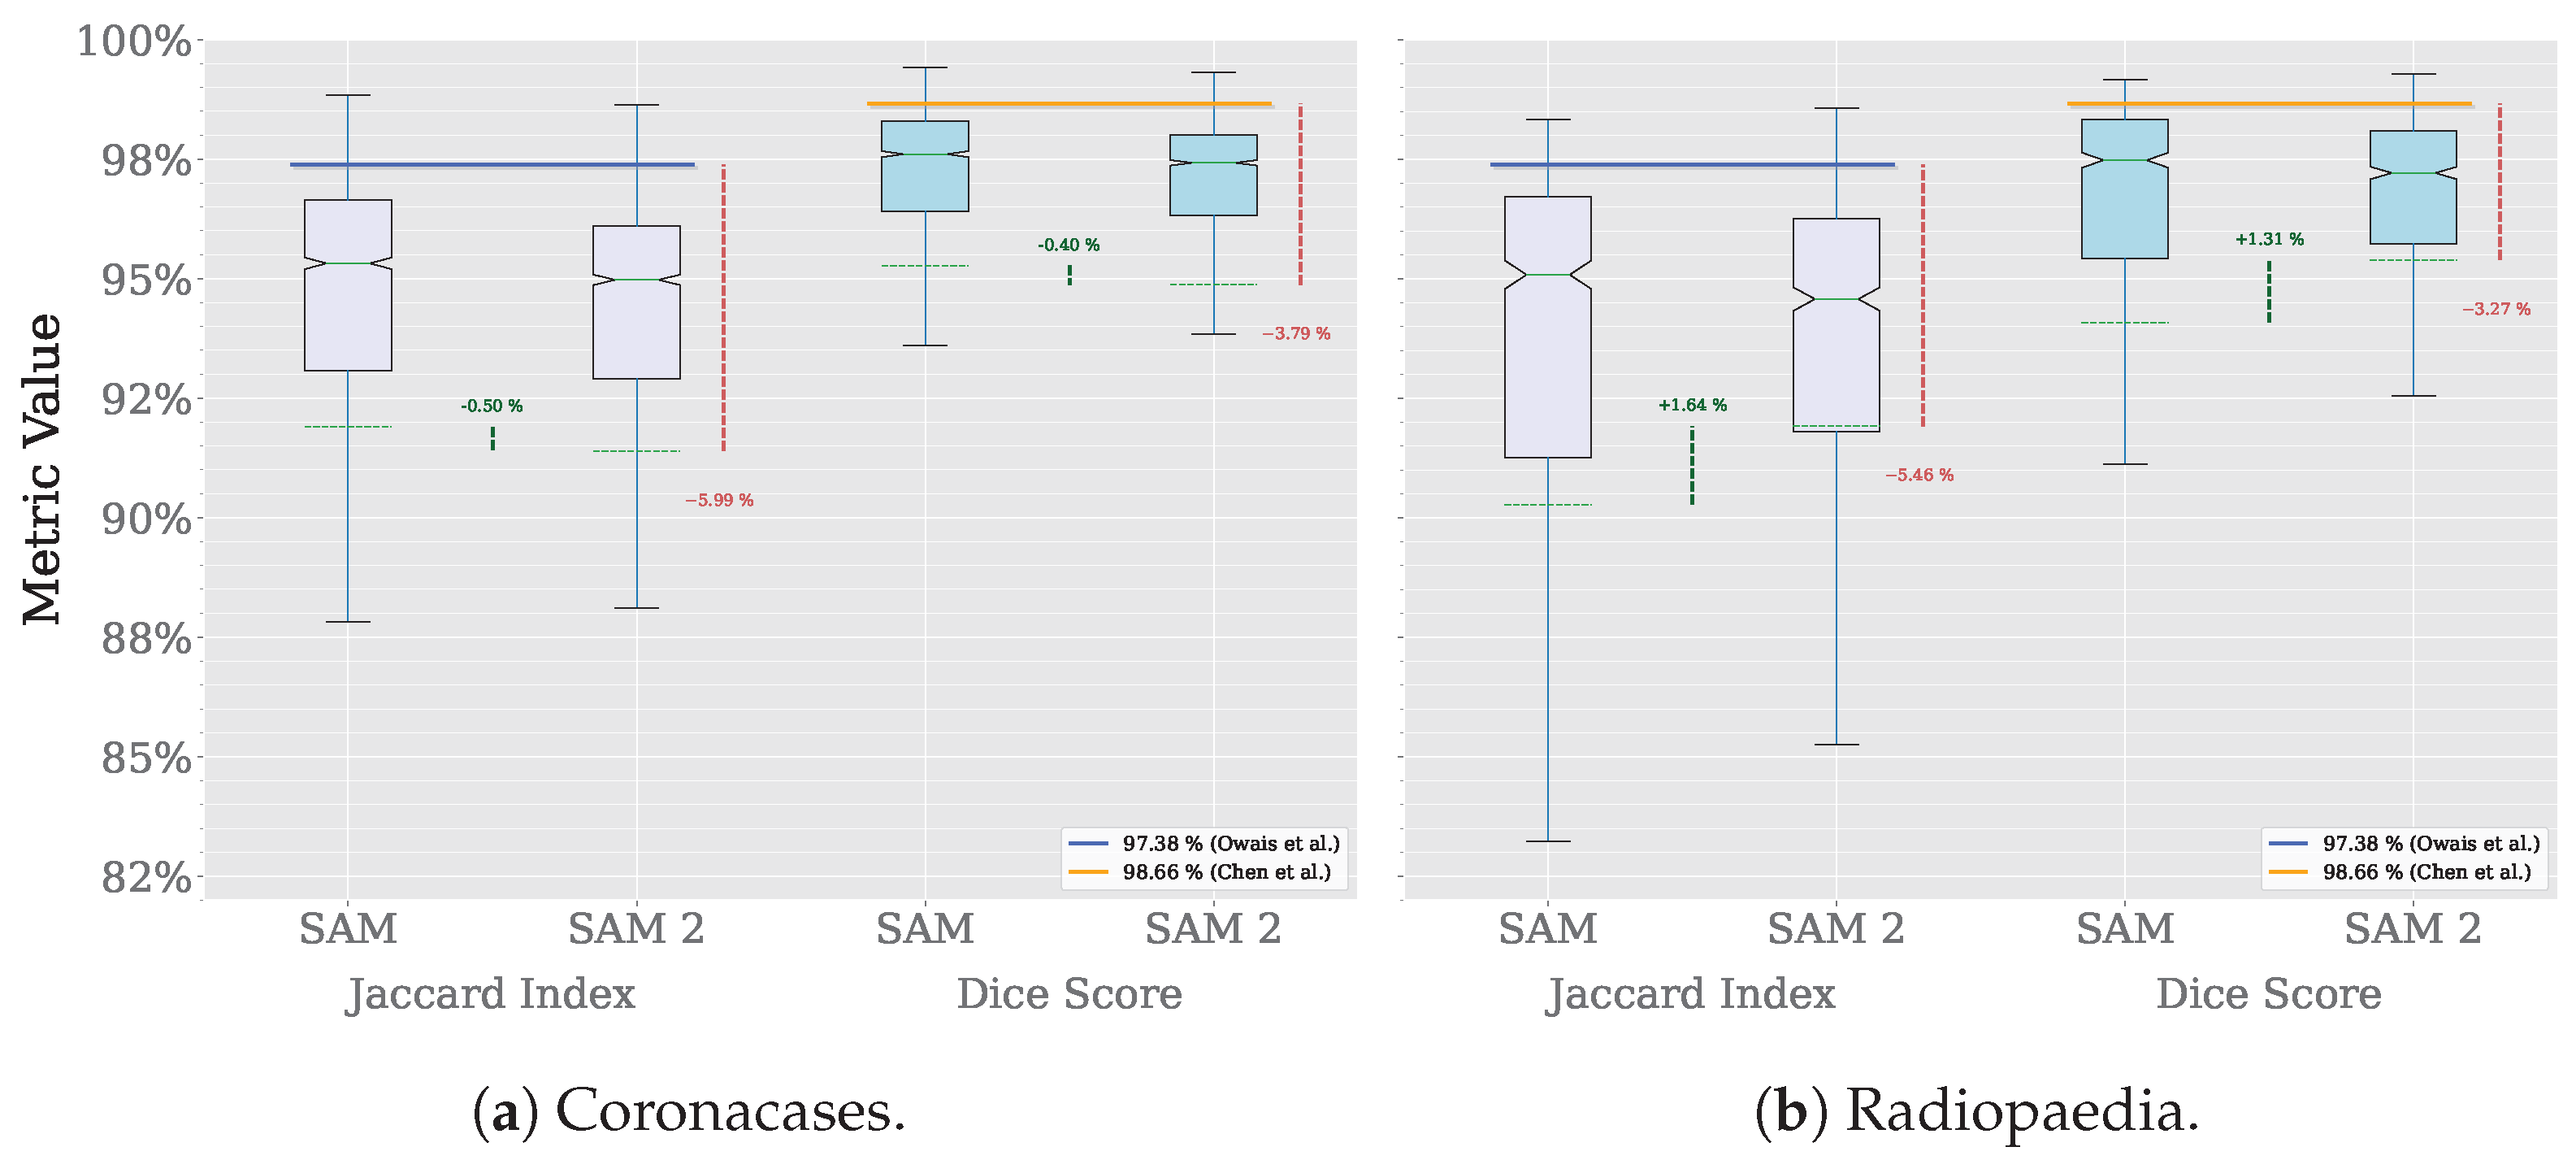
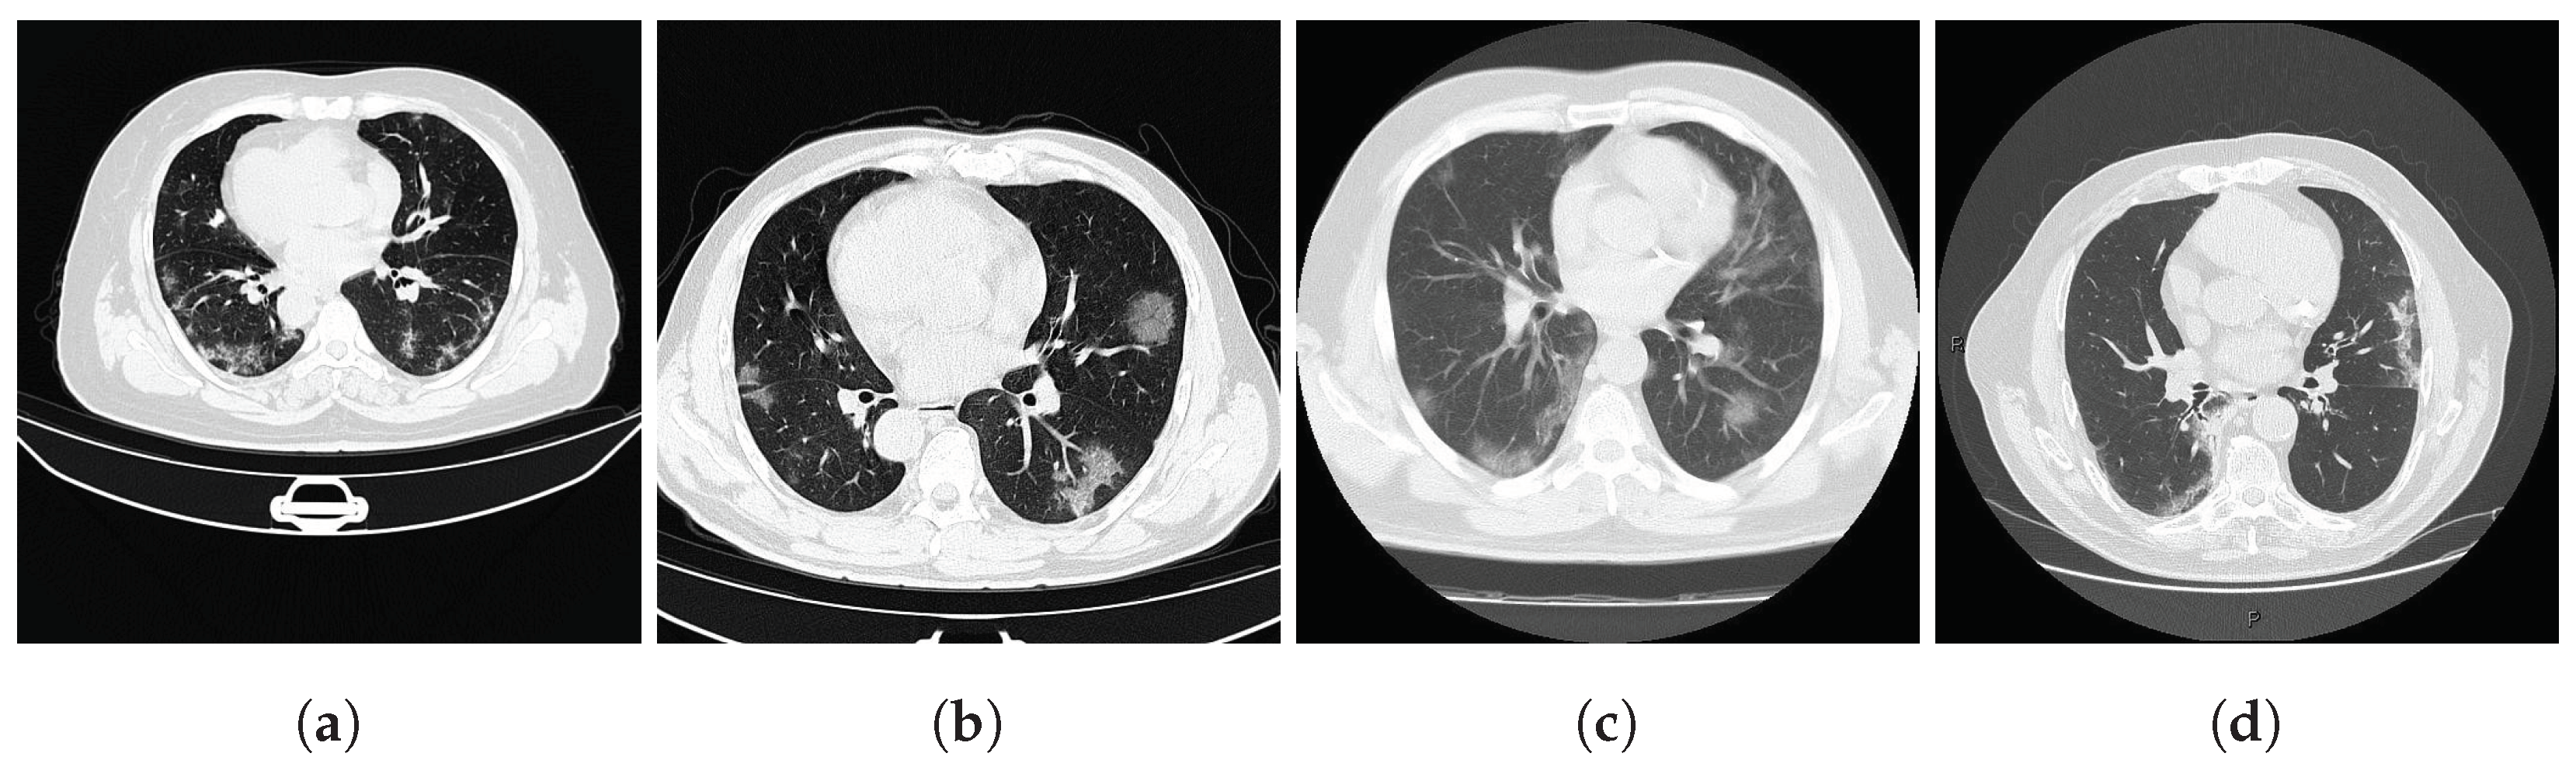
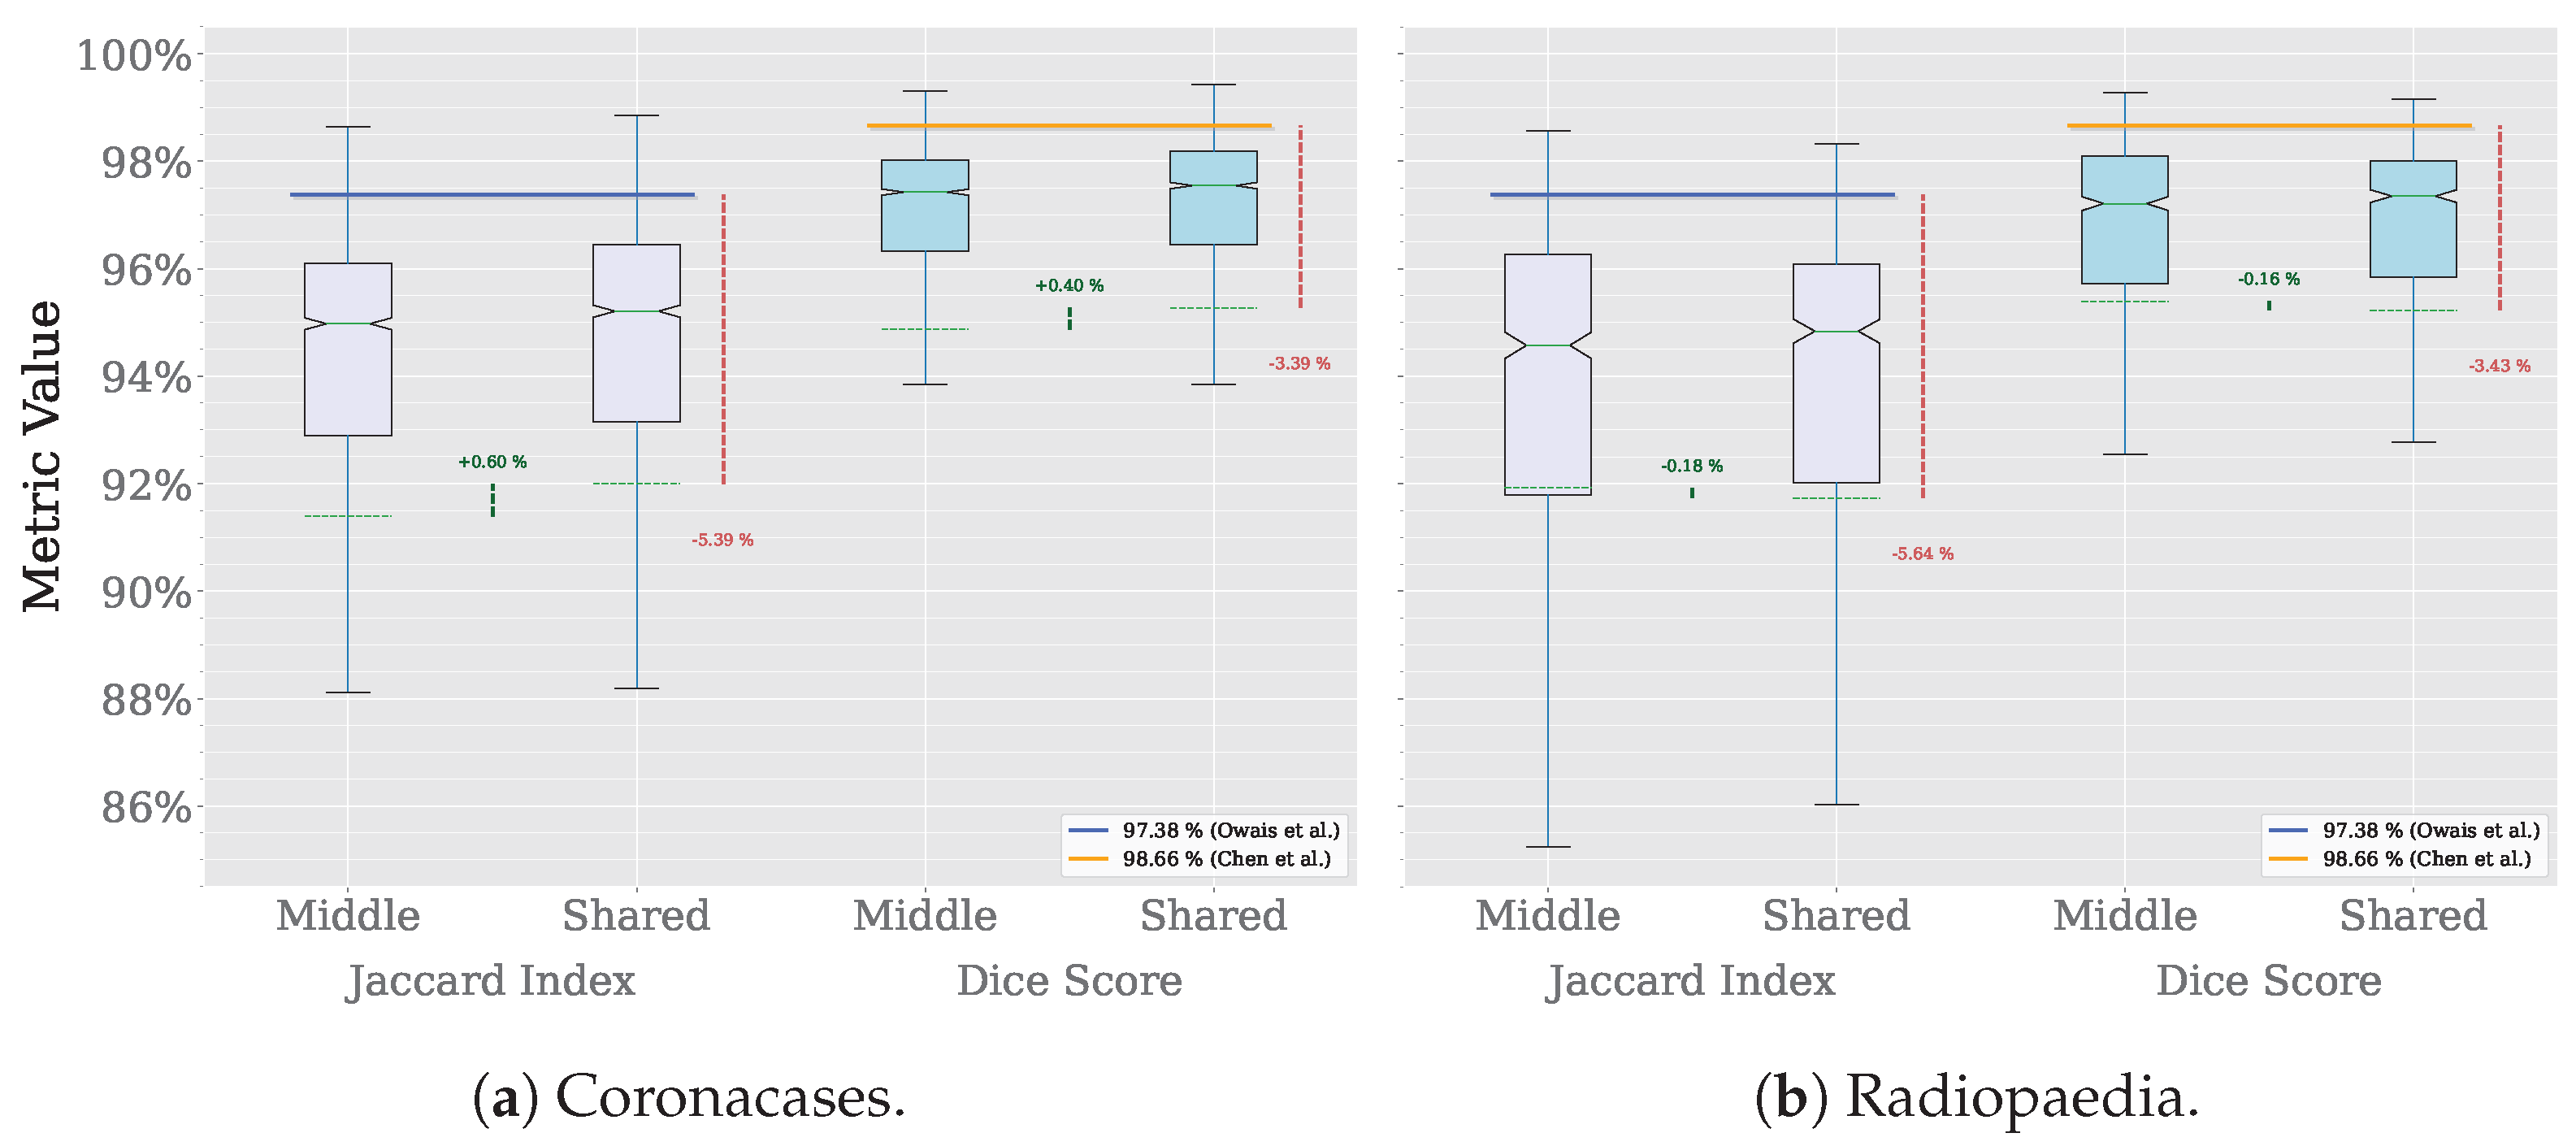
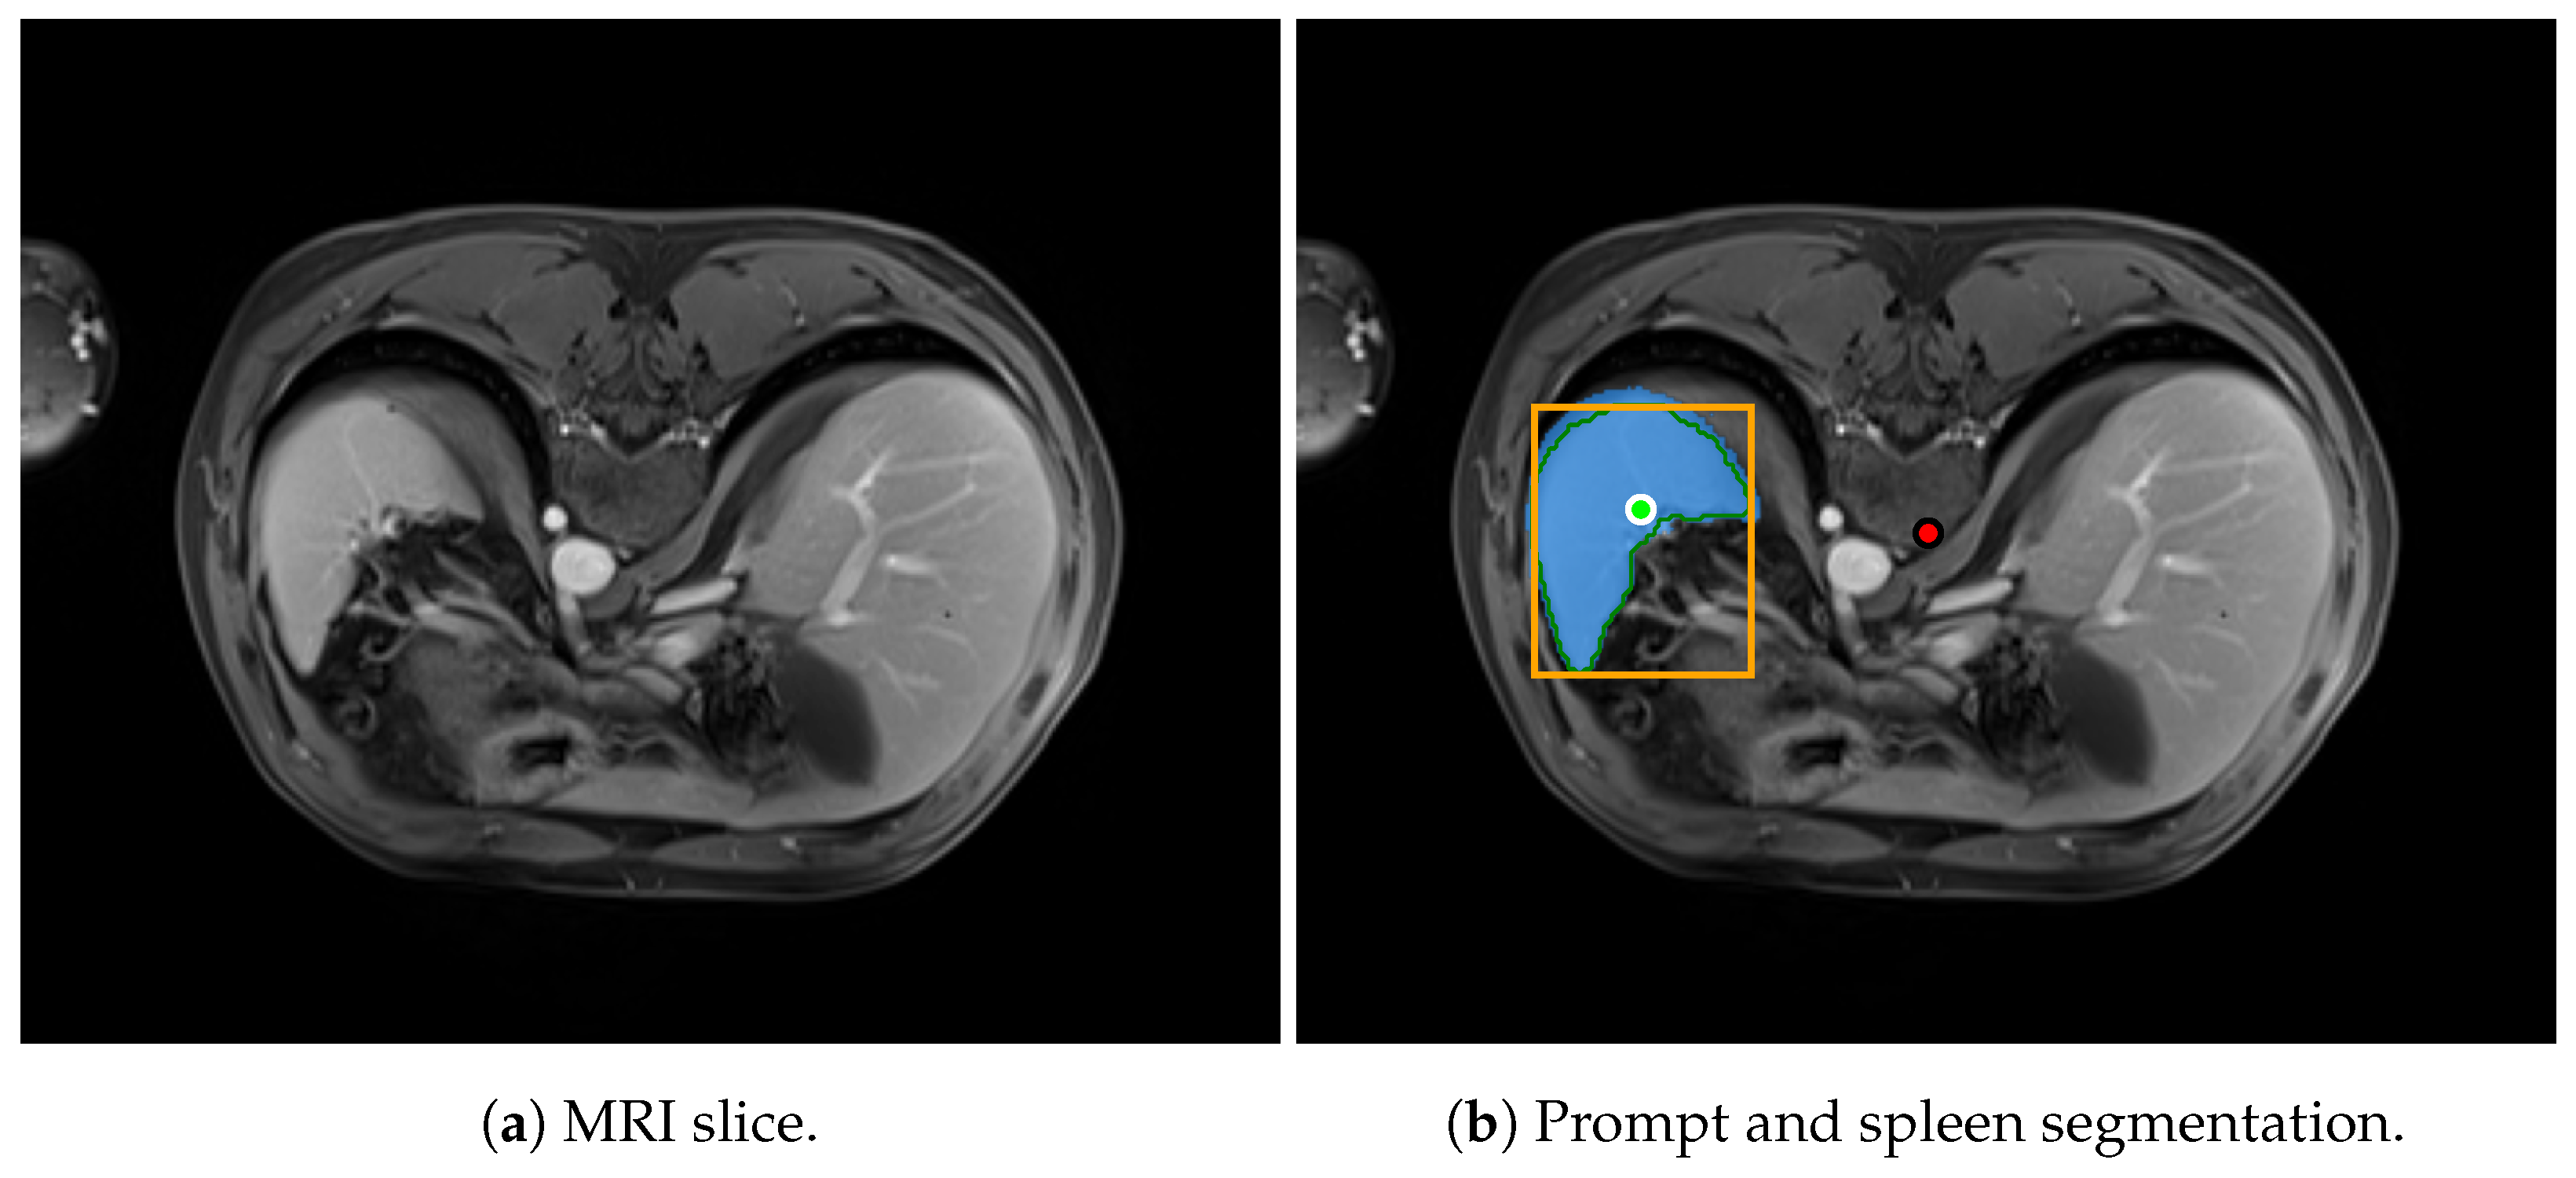
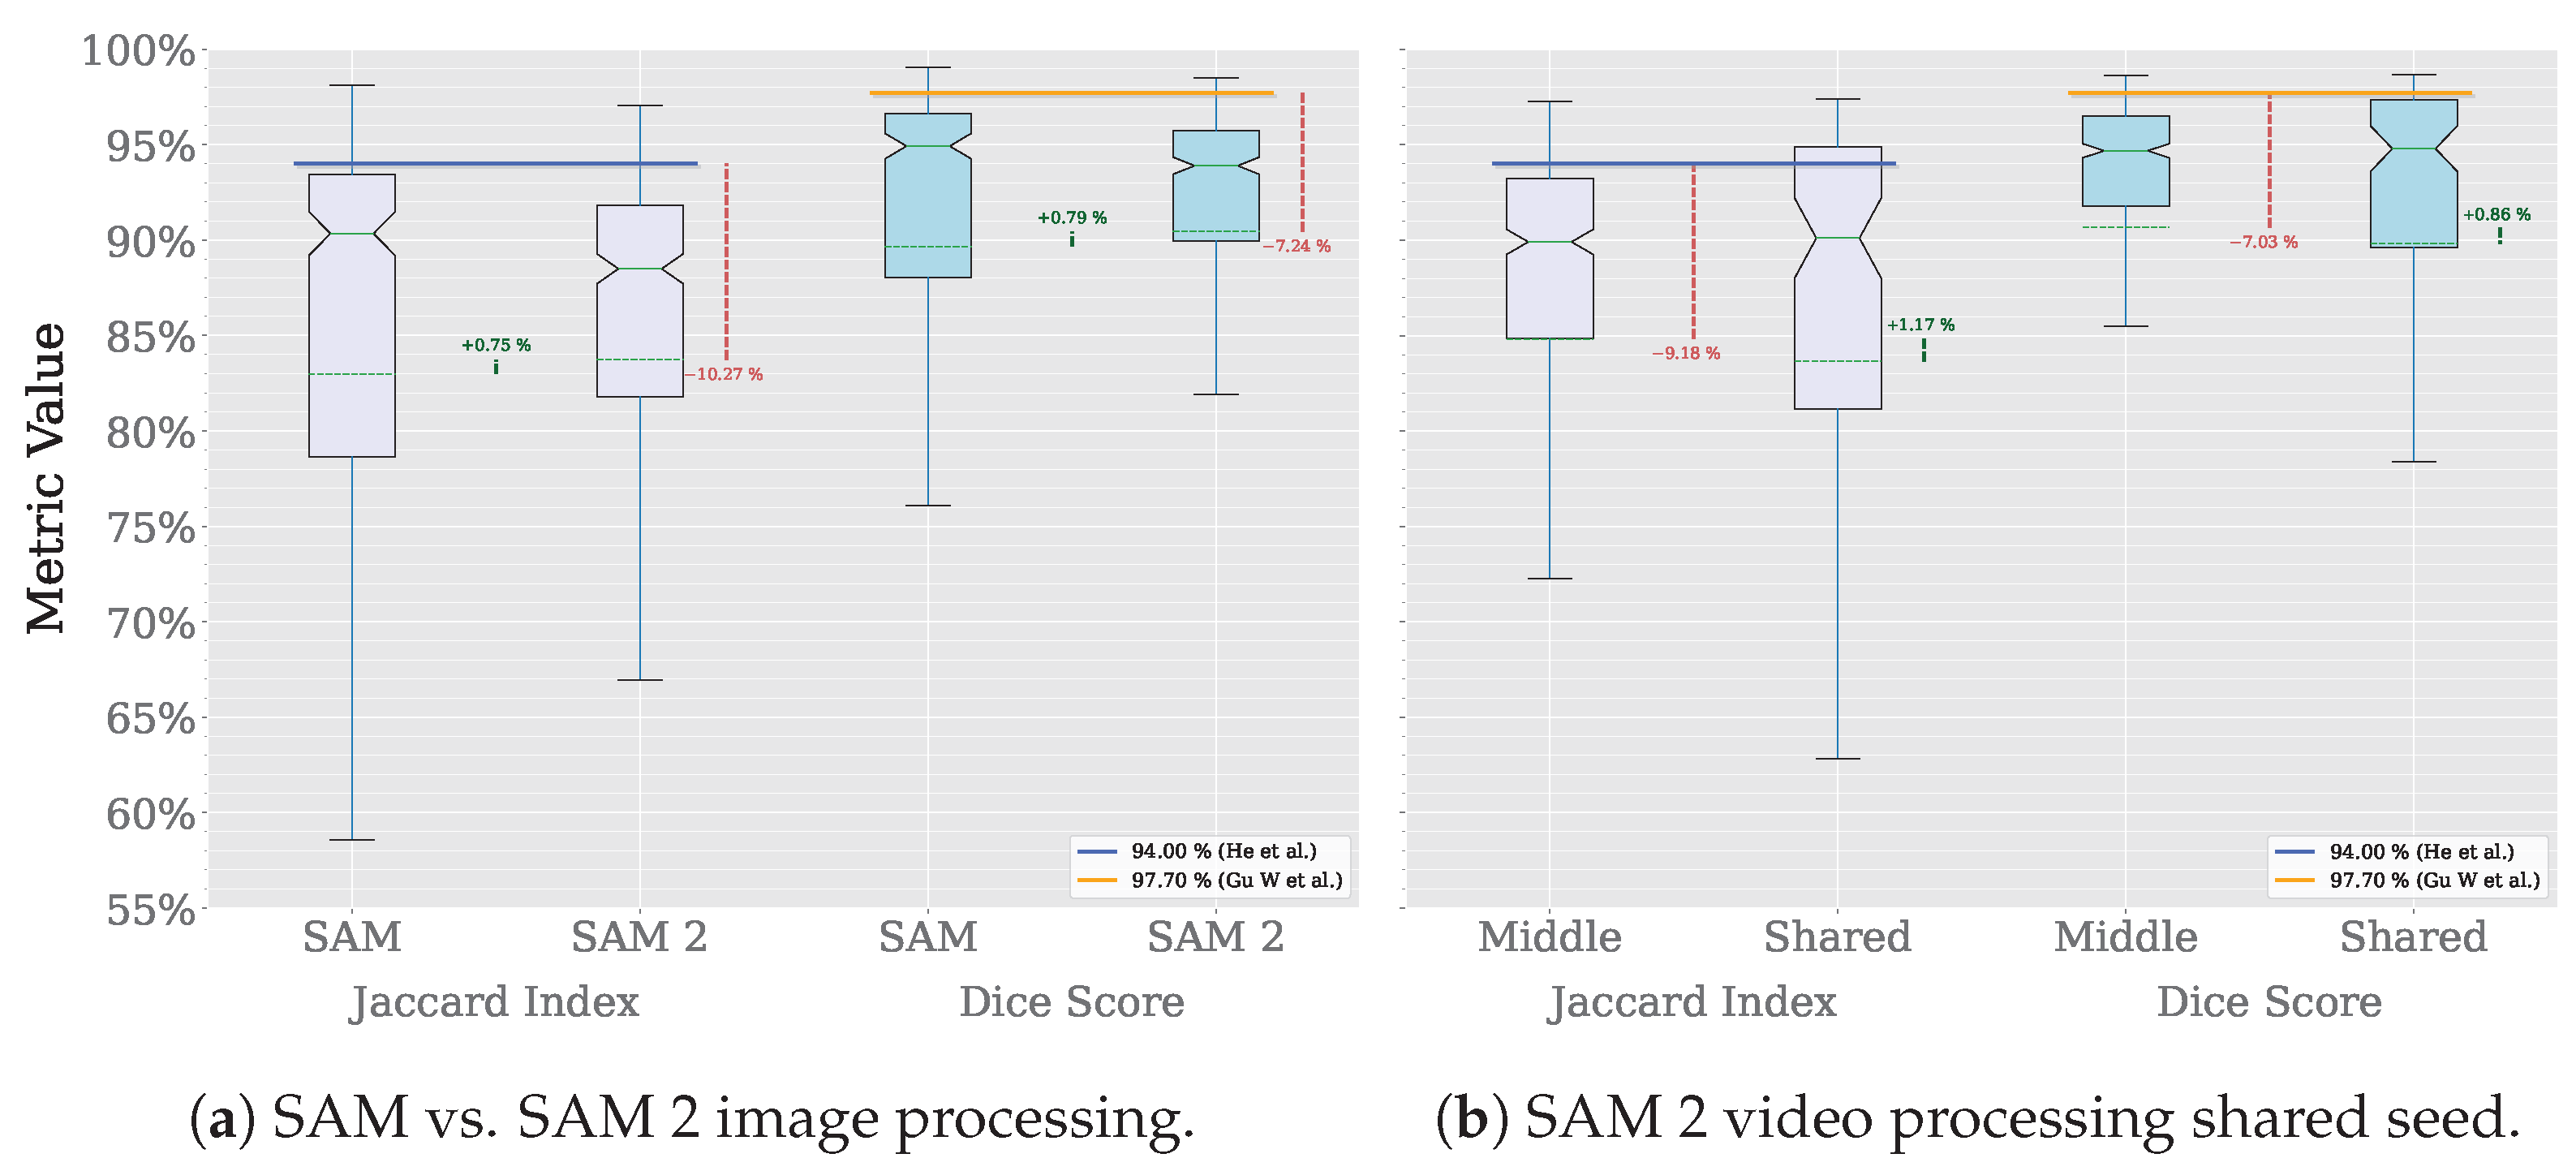
Disclaimer/Publisher’s Note: The statements, opinions and data contained in all publications are solely those of the individual author(s) and contributor(s) and not of MDPI and/or the editor(s). MDPI and/or the editor(s) disclaim responsibility for any injury to people or property resulting from any ideas, methods, instructions or products referred to in the content. |
© 2025 by the authors. Licensee MDPI, Basel, Switzerland. This article is an open access article distributed under the terms and conditions of the Creative Commons Attribution (CC BY) license (https://creativecommons.org/licenses/by/4.0/).