Coniferous-Broadleaf Mixture Increases Soil Microbial Biomass and Functions Accompanied by Improved Stand Biomass and Litter Production in Subtropical China

Abstract
:1. Introduction
2. Materials and Methods
2.1. Study Sites and Experimental Design
2.2. Stand Biomass Measurements
2.3. Litter Production and Quality Measurements
2.4. Soil Sampling and Analysis
2.5. Statistical Analysis
3. Results
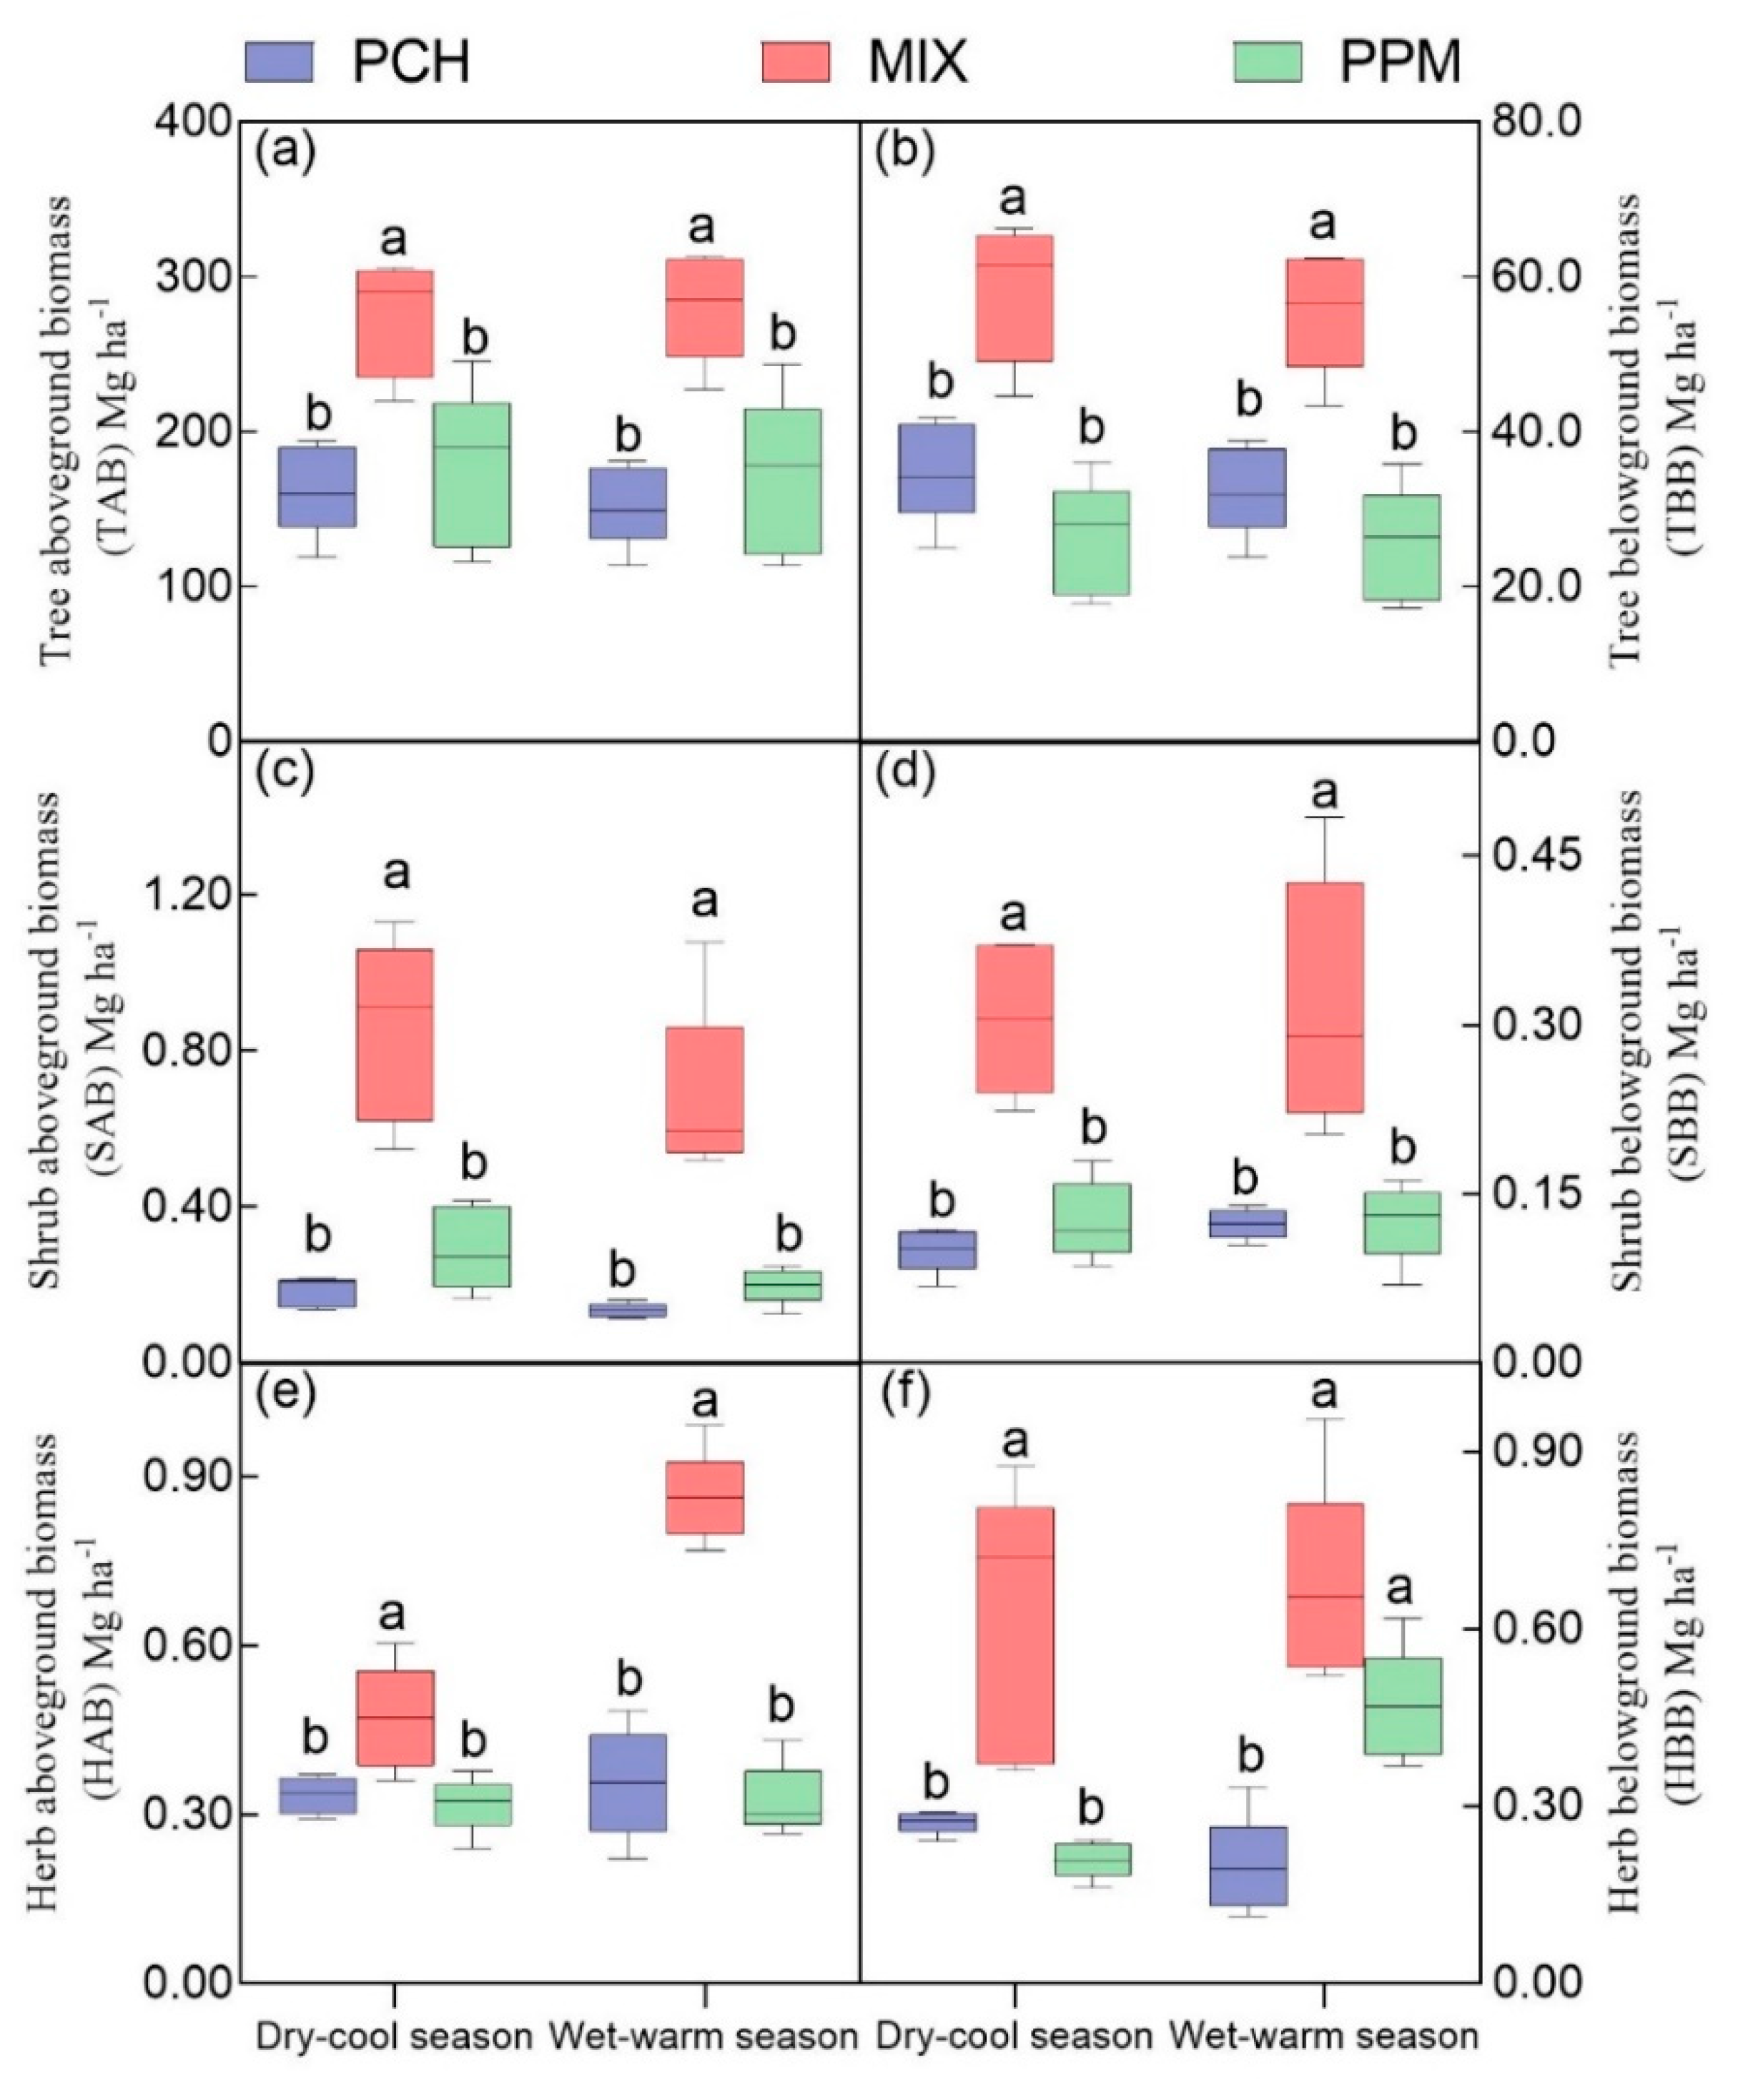
3.1. Stand Biomass
3.2. Litter Production and Quality
3.3. Soil Physical and Chemical Properties
3.4. Soil Microbial Biomass and Community Structure
3.5. Soil Microbial Functions
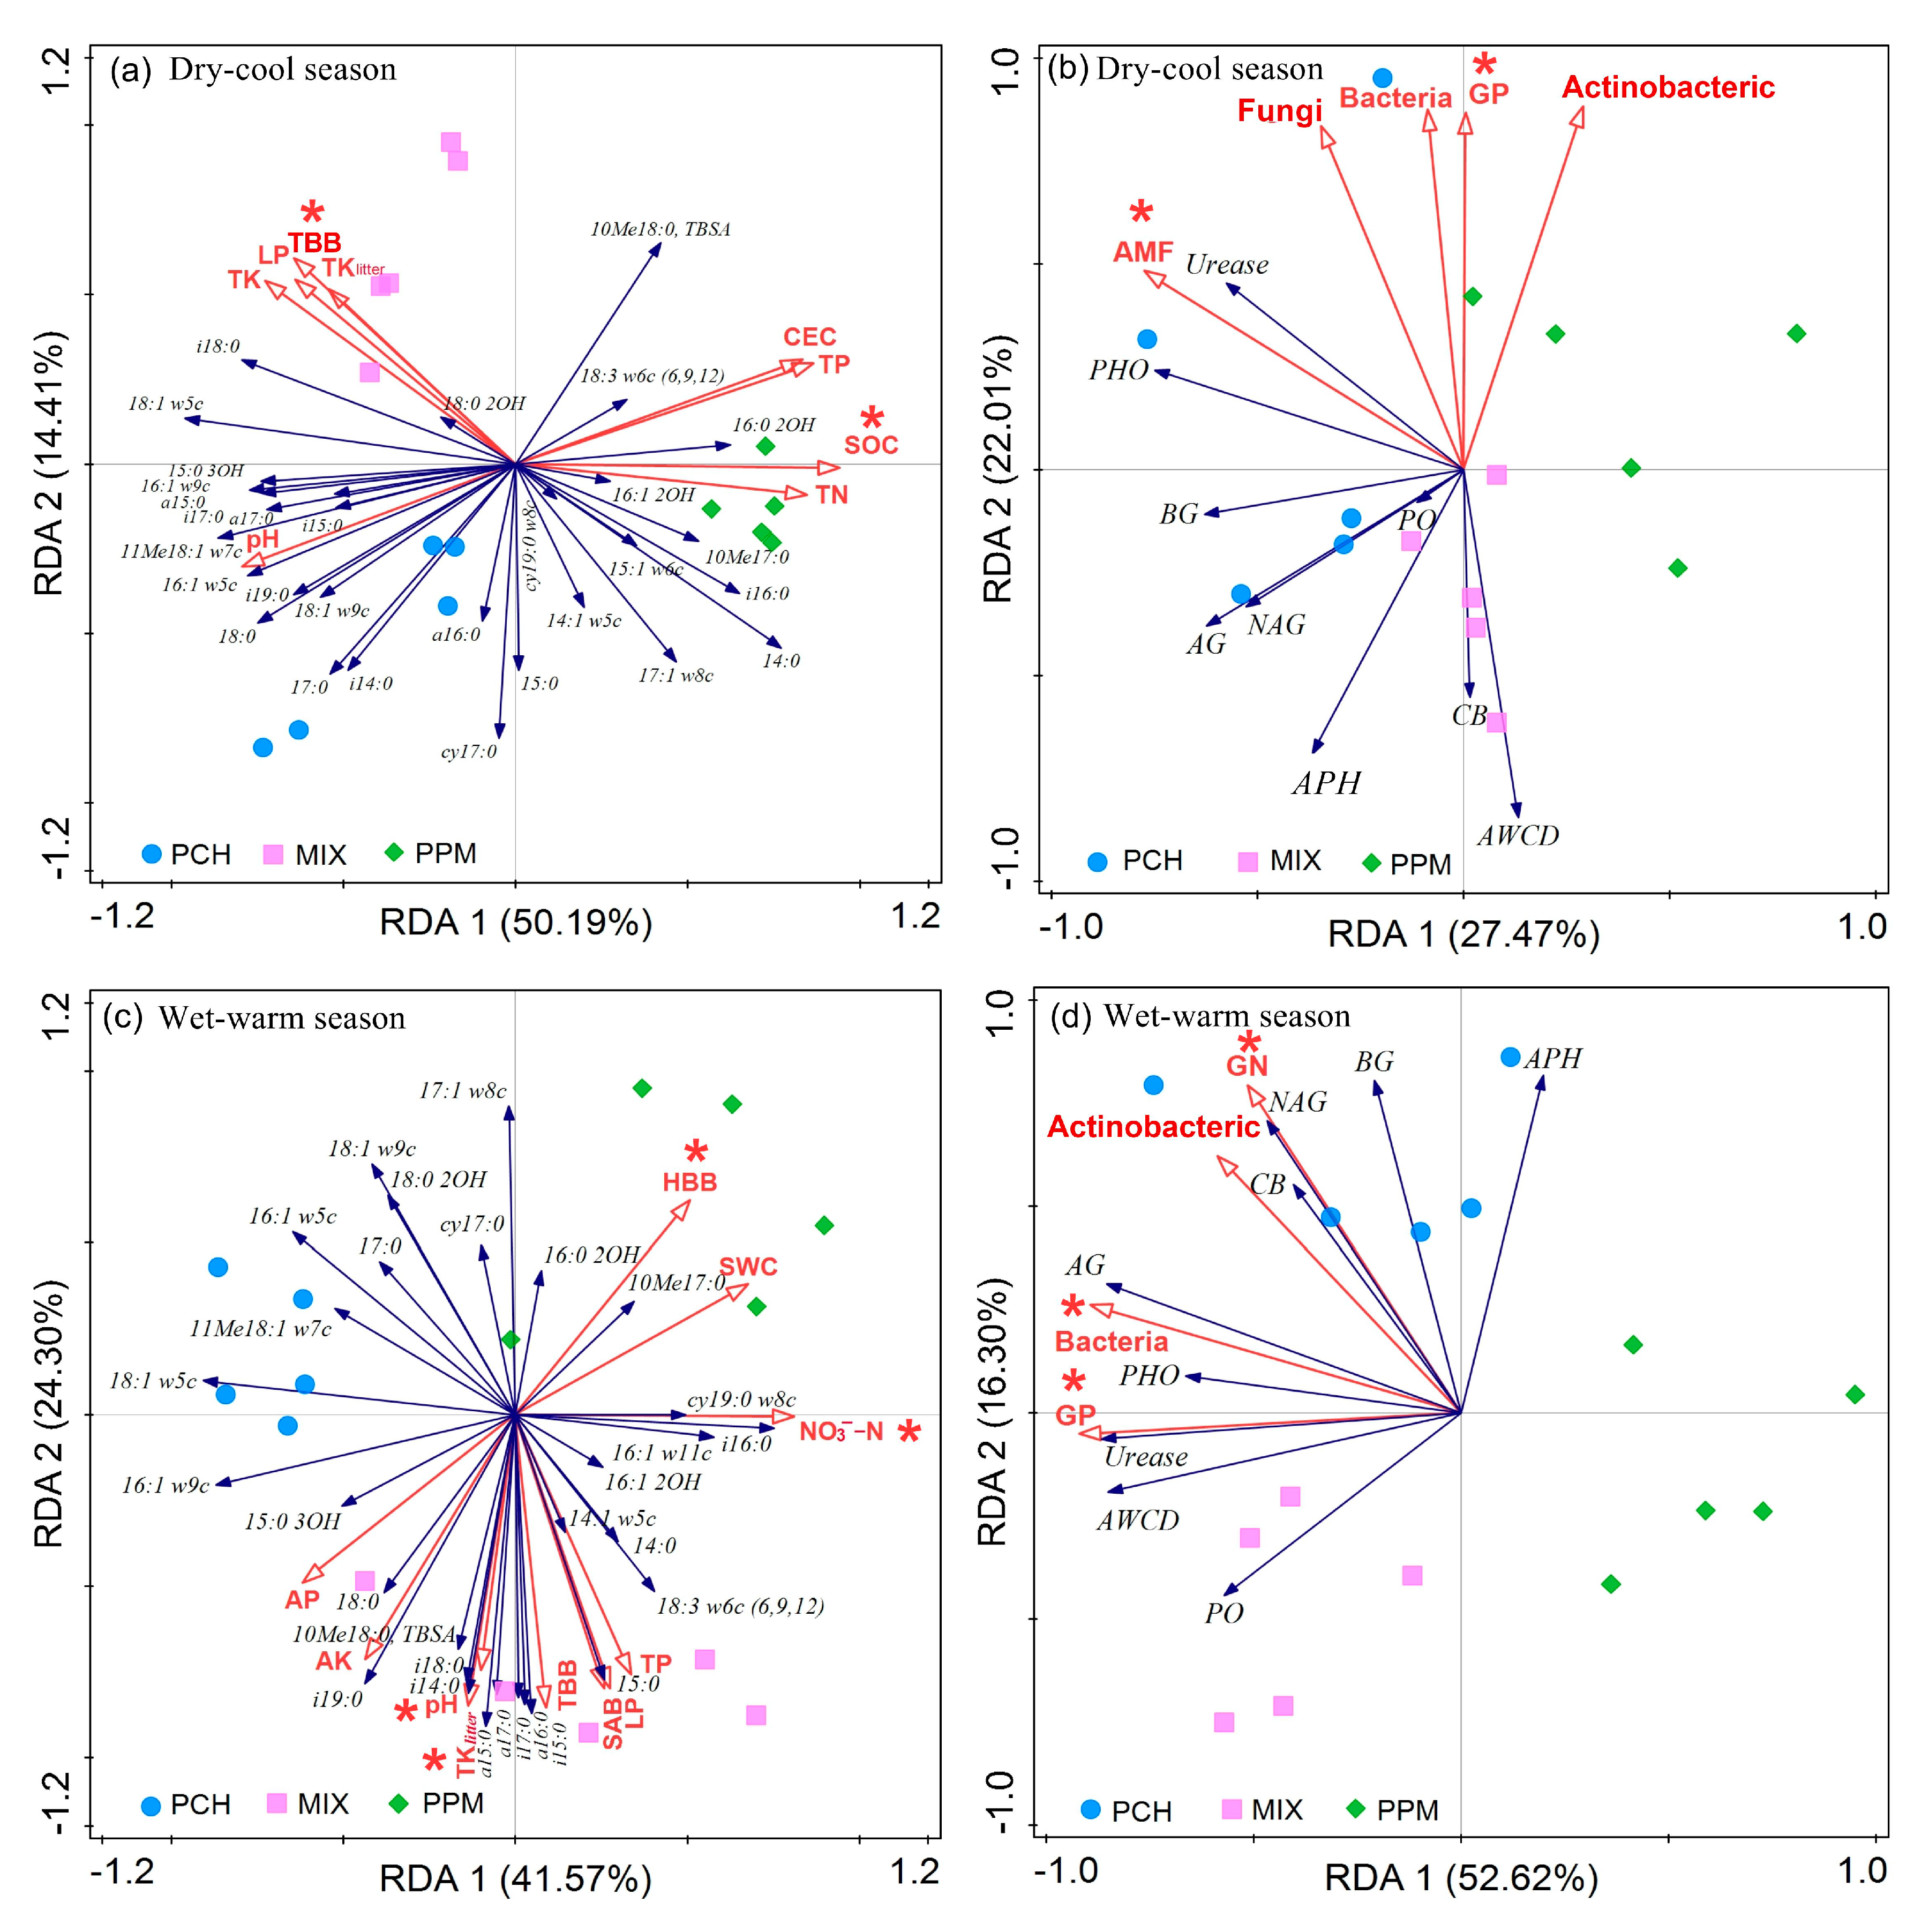
3.6. Relationship between Biotic and Abiotic Factors and Soil Microbial Composition
3.7. Relationship between Soil Microbial Structure and Functions
4. Discussion
4.1. Coniferous-Broadleaf Mixture Significantly Increase Stand Biomass and Litter Production
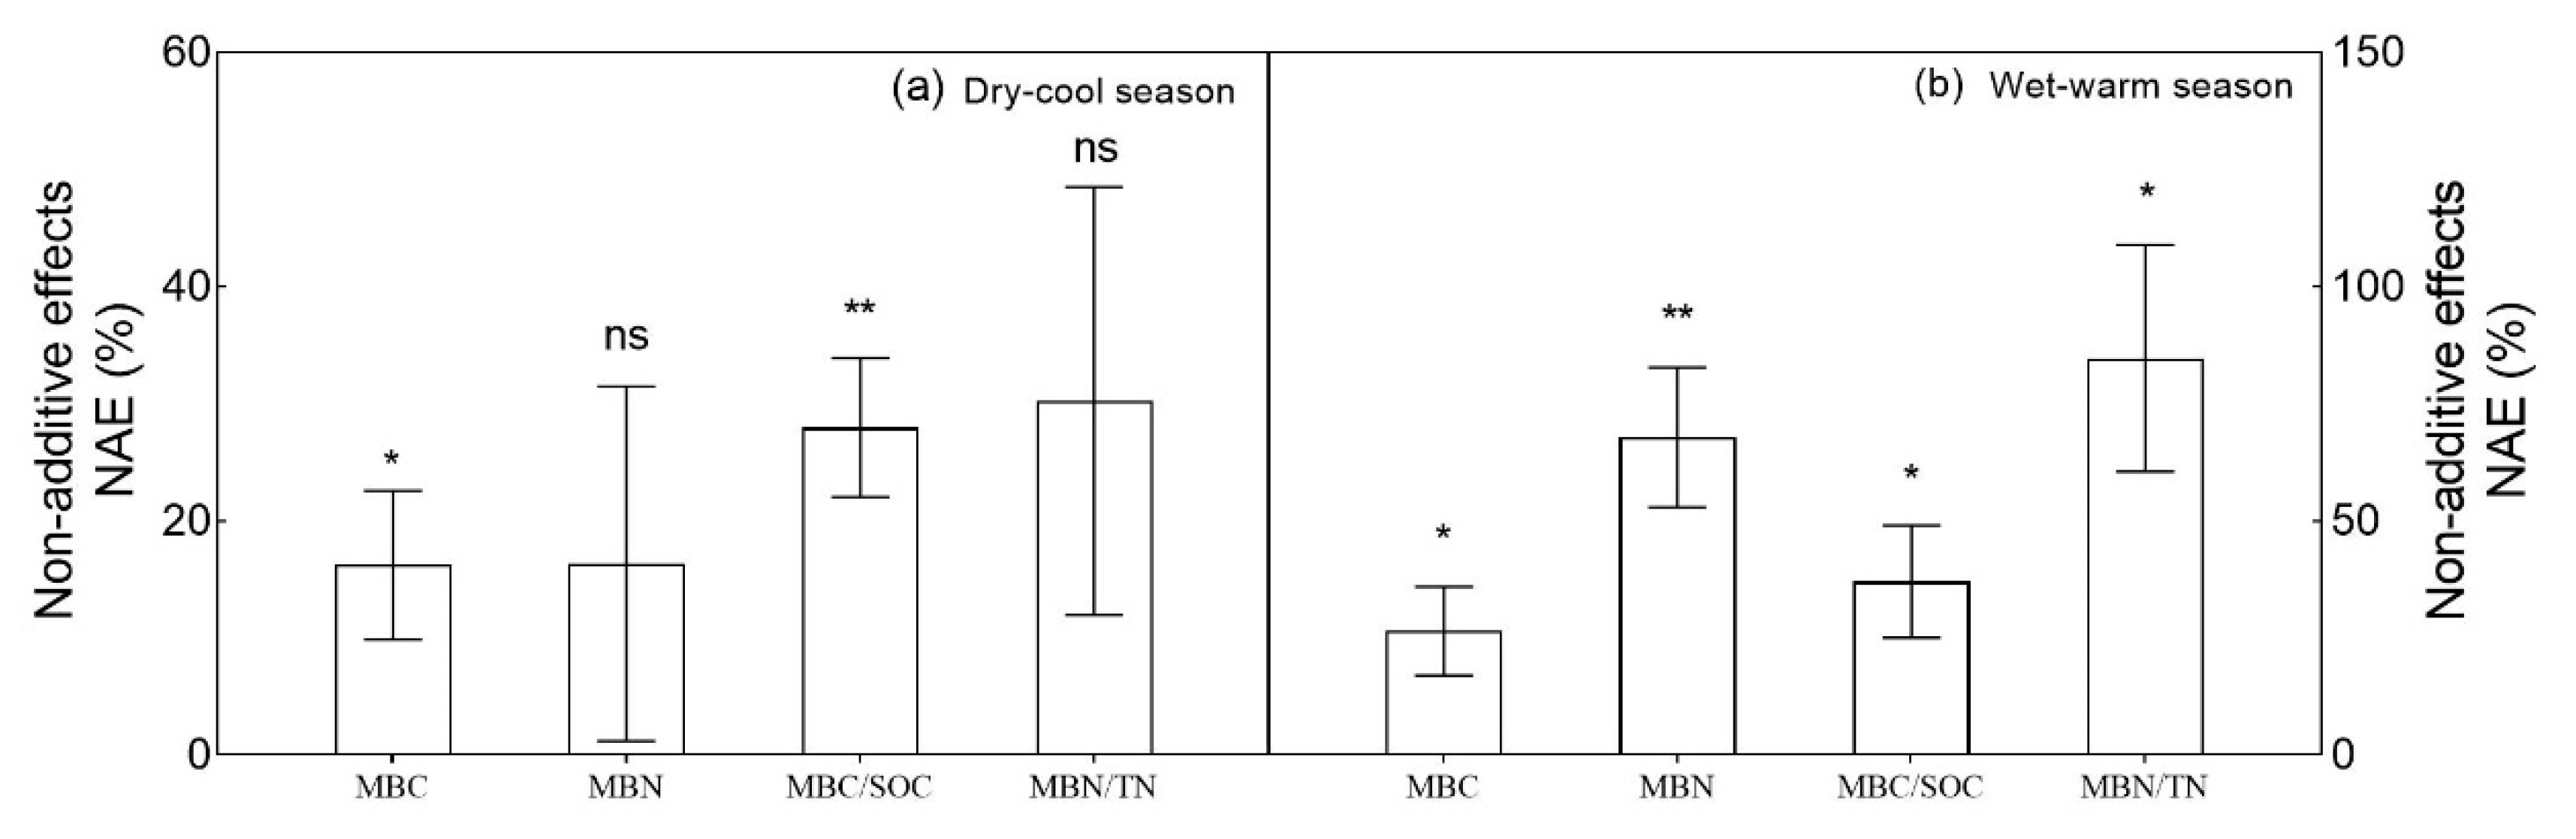
4.2. Coniferous-Broadleaf Mixture Significantly Increase Soil Microbial Biomass
4.3. Effects of Coniferous-Broadleaf Mixture on Soil Microbial Functions
5. Conclusions
Supplementary Materials
Author Contributions
Funding
Acknowledgments
Conflicts of Interest
References
- Zhang, X.; Liu, S.; Huang, Y.; Fu, S.; Wang, J.; Ming, A.; Li, X.; Yao, M.; Li, H. Tree species mixture inhibits soil organic carbon mineralization accompanied by decreased r-selected bacteria. Plant Soil 2018, 431, 203–216. [Google Scholar] [CrossRef]
- Pan, Y.; Birdsey, R.A.; Fang, J.; Houghton, R.; Kauppi, P.E.; Kurz, W.A.; Phillips, O.L.; Shvidenko, A.; Lewis, S.L.; Canadell, J.G.; et al. A large and persistent carbon sink in the world’s forests. Science 2011, 333, 988–993. [Google Scholar] [CrossRef] [PubMed]
- Chen, X.; Ju, Q.; Lin, K. Development status, issues and countermeasures of China’ s plantation. World For. Res. 2014, 27, 54–59. [Google Scholar]
- Wang, H.; Lencinas, M.V.; Ross Friedman, C.; Wang, X.; Qiu, J. Understory plant diversity assessment of Eucalyptus plantations over three vegetation types in Yunnan, China. New For. 2011, 42, 101–116. [Google Scholar] [CrossRef]
- Sang, P.M.; Lamb, D.; Bonner, M.; Schmidt, S. Carbon sequestration and soil fertility of tropical tree plantations and secondary forest established on degraded land. Plant Soil 2013, 362, 187–200. [Google Scholar] [CrossRef]
- Li, C.; Zhou, X.; Wen, Y.; Zhu, H.; Qin, Z.; Li, X.; You, Y.; Huang, X. Effects of high-generation ratations of Eucalyptus on undergrowth, soil fertility and enzyme activities. Guangxi Sci. 2019, 26, 176–186. [Google Scholar]
- You, Y.; Huang, X.; Zhu, H.; Liu, S.; Liang, H.; Wen, Y.; Wang, H.; Cai, D.; Ye, D. Positive interactions between Pinus massoniana and Castanopsis hystrix species in the uneven-aged mixed plantations can produce more ecosystem carbon in subtropical China. For. Ecol. Manag. 2018, 410, 193–200. [Google Scholar] [CrossRef]
- Huang, X.; Liu, S.; You, Y.; Wen, Y.; Wang, H.; Wang, J. Microbial community and associated enzymes activity influence soil carbon chemical composition in Eucalyptus urophylla plantation with mixing N2-fixing species in sub-tropical China. Plant Soil 2017, 414, 199–212. [Google Scholar] [CrossRef]
- Kelty, M.J. The role of species mixtures in plantation forestry. For. Ecol. Manag. 2006, 233, 195–204. [Google Scholar] [CrossRef]
- Bauhus, J.; Khanna, P.; Menden, N. Aboveground and belowground interactions in mixed plantations of Eucalyptus globulus and Acacia mearnsii. Can. J. For. Res. 2000, 30, 1886–1894. [Google Scholar] [CrossRef]
- Vandermeer, J. The Ecology of Intercropping; Cambridge University Press: New York, NY, USA, 1989; p. 237. [Google Scholar]
- Forrester, D.I. The spatial and temporal dynamics of species interactions in mixed-species forests: From pattern to process. For. Ecol. Manag. 2014, 312, 282–292. [Google Scholar] [CrossRef]
- Forrester, D.I.; Bauhus, J. A review of processes behind diversity-productivity relationships in forests. Curr. For. Rep. 2016, 2, 45–61. [Google Scholar] [CrossRef]
- Wang, H.; Liu, S.; Wang, J.; You, Y.; Yang, Y.; Shi, Z.; Huang, X.; Zheng, L.; Li, Z.; Ming, A.; et al. Mixed-species plantation with Pinus massoniana and Castanopsis hystrix accelerates C loss in recalcitrant coniferous litter but slows C loss in labile broadleaf litter in southern China. For. Ecol. Manag. 2018, 422, 207–213. [Google Scholar] [CrossRef]
- Zhao, Z.; Jia, H.; Cai, D.; Pang, S.; Ang, N.; Liu, Y. Natural regeneration and its influencing factors of Castanopsis hystrix. J. Beijing For. Univ. 2018, 40, 76–83. [Google Scholar]
- He, Y.; Qin, L.; Li, Z.; Liang, X.; Shao, M.; Tan, L. Carbon storage capacity of monoculture and mixed-species plantations in subtropical China. For. Ecol. Manag. 2013, 295, 193–198. [Google Scholar] [CrossRef]
- He, Y.; Liang, X.; Qin, L.; Li, Z.; Tan, L.; Shao, M. Community structure, species diversity of Pinus massoniana and Castanopsis hystrix plantation and the nature-based forest management in the southern subtropical China. Sci. Silvae Sin. 2013, 49, 24–33. [Google Scholar]
- Cline, L.C.; Zak, D.R. Soil microbial communities are shaped by plant-driven changes in resource availability during secondary succession. Ecology 2015, 96, 3374–3385. [Google Scholar] [CrossRef]
- Malchair, S.; Carnol, M. Microbial biomass and C and N transformations in forest floors under European beech, Sessile oak, Norway spruce and Douglas-fir at four temperate forest sites. Soil Biol. Biochem. 2009, 41, 831–839. [Google Scholar] [CrossRef]
- Ming, A.; Yang, Y.; Liu, S.; Wang, H.; Li, Y.; Li, H.; Nong, Y.; Cai, D.; Jia, H.; Tao, Y.; et al. Effects of near natural forest management on soil greenhouse gas flux in Pinus massoniana (Lamb.) and Cunninghamia lanceolata (Lamb.) Hook. plantations. Forests 2018, 9, 229. [Google Scholar] [CrossRef]
- Wen, L.; Lei, P.; Xiang, W.; Yan, W.; Liu, S. Soil microbial biomass carbon and nitrogen in pure and mixed stands of Pinus massoniana and Cinnamomum camphora differing in stand age. For. Ecol. Manag. 2014, 328, 150–158. [Google Scholar] [CrossRef]
- Van Der Heijden, M.G.A.; Bardgett, R.D.; Van Straalen, N.M. The unseen majority: Soil microbes as drivers of plant diversity and productivity in terrestrial ecosystems. Ecol. Lett. 2008, 11, 296–310. [Google Scholar] [CrossRef] [PubMed]
- Singh, J.S.; Gupta, V.K. Soil microbial biomass: A key soil driver in management of ecosystem functioning. Sci. Total Environ. 2018, 634, 497–500. [Google Scholar] [CrossRef] [PubMed]
- Chen, C.; Chen, H.Y.H.; Chen, X.; Huang, Z. Meta-analysis shows positive effects of plant diversity on microbial biomass and respiration. Nat. Commun. 2019, 10, 1332. [Google Scholar] [CrossRef] [PubMed]
- Boer, W.; Folman, L.B.; Summerbell, R.C.; Boddy, L. Living in a fungal world: Impact of fungi on soil bacterial niche development. FEMS Microbiol. Rev. 2005, 29, 795–811. [Google Scholar] [CrossRef] [PubMed]
- Hättenschwiler, S.; Tiunov, A.; Scheu, S. Biodiversity and litter decomposition in terrestrial ecosystems. Annu. Rev. Ecol. Evol. 2005, 36, 191–218. [Google Scholar] [CrossRef]
- Fornara, D.A.; Tilman, D.; Hobbie, S.E. Linkages between plant functional composition, fine root processes and potential soil N mineralization rates. J. Ecol. 2009, 97, 48–56. [Google Scholar] [CrossRef]
- Kerdraon, D.; Drewer, J.; Castro, B.; Wallwork, A.; Hall, J.; Sayer, E. Litter traits of native and non-native tropical trees influence soil carbon dynamics in timber plantations in panama. Forests 2019, 10, 209. [Google Scholar] [CrossRef]
- Yang, Y.; Liu, S.; Chen, L.; Wang, H.; Lu, L. Short-term effects of manipulated throughfall reduction on the quantity and quality of litterfall in a Pinus massoniana plantation. Acta Ecol. Sin. 2018, 38, 4470–4478. [Google Scholar]
- Zhou, X.; Wen, Y.; Goodale, U.M.; Zuo, H.; Zhu, H.; Li, X.; You, Y.; Yan, L.; Su, Y.; Huang, X. Optimal rotation length for carbon sequestration in Eucalyptus plantations in subtropical China. New For. 2017, 48, 609–627. [Google Scholar] [CrossRef]
- Bao, S.D. Soil Agro-Chemistrical Analysis; China Agricultural Press: Beijing, China, 2000; pp. 1–495. [Google Scholar]
- Evans, E.H.; Day, J.A.; Fisher, A.; Price, W.J.; Smith, C.M.M.; Tyson, J.F. Atomic spectrometry update. Advances in atomic emission, absorption and fluorescence spectrometry and related techniques. J. Anal. Atom. Spectrom. 2004, 19, 775. [Google Scholar] [CrossRef]
- Reis, B.; Zagatto, E.; Jacintho, A. Merging zones in flow injection analysis: Part 4. Simultaneous spectrophotometric determination of total nitrogen and phosphorus in plant material. Anal. Chim. Acta 1980, 119, 305–311. [Google Scholar] [CrossRef]
- Liu, W.; Wu, J.; Fan, H.; Li, Y.; Yuan, Y.; Liao, Y.; Huang, R.; Hu, L.; Fang, H.; Guo, H. Carbon pools in an age sequence of Eucalyptus plantation forests. Ecol. Environ. Sci. 2013, 22, 12–17. [Google Scholar]
- Liu, L.; Gundersen, P.; Zhang, T.; Mo, J. Effects of phosphorus addition on soil microbial biomass and community composition in three forest types in tropical China. Soil Biol. Biochem. 2012, 44, 31–38. [Google Scholar] [CrossRef]
- You, Y.; Wang, J.; Huang, X.; Tang, Z.; Liu, S.; Sun, O.J. Relating microbial community structure to functioning in forest soil organic carbon transformation and turnover. Ecol. Evol. 2014, 4, 633–647. [Google Scholar] [CrossRef]
- Dohrmann, R.; Kaufhold, S. Three new, quick CEC methods for determining the amounts of exchangeable calcium cations in calcareous clays. Clay Clay Miner. 2009, 57, 338–352. [Google Scholar] [CrossRef]
- Pan, G.; Chen, A. Comparison of methods for determination of cation exchange properties of different soils form southern China. Trop. Subtrop. Soil Sci. 1992, 1, 38–44. [Google Scholar]
- Vance, E.D.; Brookes, P.C.; Jenkinson, D.S. An extraction method for measuring soil microbial biomass C. Soil Biol. Biochem. 1987, 19, 703–707. [Google Scholar] [CrossRef]
- Brookes, P.C.; Landman, A.; Pruden, G.; Jenkinson, D.S. Chloroform fumigation and the release of soil nitrogen: A rapid direct extraction method to measure microbial biomass nitrogen in soil. Soil Biol. Biochem. 1985, 17, 837–842. [Google Scholar] [CrossRef]
- Bossio, D.A.; Scow, K.M.; Gunapala, N.; Graham, K.J. Determinants of soil microbial communities: Effects of agricultural management, season, and soil type on phospholipid fatty acid profiles. Microb. Ecol. 1998, 36, 1–12. [Google Scholar] [CrossRef]
- Wang, X.; Wang, X.; Zhang, W.; Shao, Y.; Zou, X.; Liu, T.; Zhou, L.; Wan, S.; Rao, X.; Li, Z.; et al. Invariant community structure of soil bacteria in subtropical coniferous and broadleaved forests. Sci. Rep. 2016, 6, 19071. [Google Scholar] [CrossRef]
- Bossio, D.A.; Fleck, J.A.; Scow, K.M.; Fujii, R. Alteration of soil microbial communities and water quality in restored wetlands. Soil Biol. Biochem. 2006, 38, 1223–1233. [Google Scholar] [CrossRef]
- Kourtev, P.S.; Ehrenfeld, J.G.; Haggblom, M. Exotic plant species alter the microbial community structure and function in the soil. Ecology 2002, 83, 3152. [Google Scholar] [CrossRef]
- Lv, T.; Carvalho, P.N.; Zhang, L.; Zhang, Y.; Button, M.; Arias, C.A.; Weber, K.P.; Brix, H. Functionality of microbial communities in constructed wetlands used for pesticide remediation: Influence of system design and sampling strategy. Water Res. 2017, 110, 241–251. [Google Scholar] [CrossRef] [PubMed]
- Dumontet, S.; Cavoski, I.; Ricciuti, P.; Mondelli, D.; Jarrar, M.; Pasquale, V.; Crecchio, C. Metabolic and genetic patterns of soil microbial communities in response to different amendments under organic farming system. Geoderma 2017, 296, 79–85. [Google Scholar] [CrossRef]
- Liu, B.; Li, Y.; Zhang, X.; Wang, J.; Gao, M. Effects of chlortetracycline on soil microbial communities: Comparisons of enzyme activities to the functional diversity via Biolog EcoPlates™. Eur. J. Soil Biol. 2015, 68, 69–76. [Google Scholar] [CrossRef]
- Saiya-Cork, K.R.; Sinsabaugh, R.L.; Zak, D.R. The effects of long term nitrogen deposition on extracellular enzyme activity in an Acer saccharum forest soil. Soil Biol. Biochem. 2002, 34, 1309–1315. [Google Scholar] [CrossRef]
- Steinauer, K.; Tilman, D.; Wragg, P.D.; Cesarz, S.; Cowles, J.M.; Pritsch, K.; Reich, P.B.; Weisser, W.W.; Eisenhauer, N. Plant diversity effects on soil microbial functions and enzymes are stronger than warming in a grassland experiment. Ecology 2015, 96, 99–112. [Google Scholar] [CrossRef] [PubMed]
- Wardle, D.A.; Bonner, K.I.; Nicholson, K.S. Biodiversity and plant litter: Experimental evidence which does not support the view that enhanced species richness improves ecosystem function. Oikos 1997, 79, 247–258. [Google Scholar] [CrossRef]
- Fanin, N.; Kardol, P.; Farrell, M.; Nilsson, M.; Gundale, M.J.; Wardle, D.A. The ratio of Gram-positive to Gram-negative bacterial PLFA markers as an indicator of carbon availability in organic soils. Soil Biol. Biochem. 2019, 128, 111–114. [Google Scholar] [CrossRef]
- Chen, L.; Zeng, X.; Tam, N.F.; Lu, W.; Luo, Z.; Du, X.; Wang, J. Comparing carbon sequestration and stand structure of monoculture and mixed man-grove plantations of Sonneratia caseolaris and S. apetala in Southern China. For. Ecol. Manag. 2012, 284, 222–229. [Google Scholar] [CrossRef]
- Rouhi-Moghaddam, E.; Hosseini, S.M.; Ebrahimi, E.; Tabari, M.; Rahmani, A. Comparison of growth, nutrition and soil properties of pure stands of Quercus castaneifolia and mixed with Zelkova carpinifolia in the Hyrcanian forests of Iran. For. Ecol. Manag. 2008, 255, 1149–1160. [Google Scholar] [CrossRef]
- Binkley, D.; Campoe, O.C.; Gspaltl, M.; Forrester, D.I. Light absorption and use efficiency in forests: Why patterns differ for trees and stands. For. Ecol. Manag. 2013, 288, 5–13. [Google Scholar] [CrossRef]
- Duan, W.; Ren, H.; Fu, S.; Wang, J.; Zhang, J.; Yang, L.; Huang, C. Community comparison and determinant analysis of understory vegetation in six plan-tations in South China. Restor. Ecol. 2010, 18, 206–214. [Google Scholar] [CrossRef]
- Zhang, K.; Dang, H.; Tan, S.; Wang, Z.; Zhang, Q. Vegetation community and soil characteristics of abandoned agricultural land and pine plantation in the Qinling Mountains, China. For. Ecol. Manag. 2010, 259, 2036–2047. [Google Scholar] [CrossRef]
- Hobbie, S.E.; Ogdahl, M.; Chorover, J.; Chadwick, O.A.; Oleksyn, J.; Zytkowiak, R.; Reich, P.B. Tree Species Effects on Soil Organic Matter Dynamics: The Role of Soil Cation Composition. Ecosystems 2007, 10, 999–1018. [Google Scholar] [CrossRef]
- Bosatta, E.; Ågren, G.I. Theoretical analysis of microbial biomass dynamics in soils. Soil Biol. Biochem. 1994, 26, 143–148. [Google Scholar] [CrossRef]
- Wolters, V.; Joergensen, R.G. Microbial carbon turnover in beech forest soils at different stages of acidification. Soil Biol. Biochem. 1991, 23, 897–902. [Google Scholar] [CrossRef]
- Anderson, T.H.; Domsch, K.H. Ratios of microbial biomass carbon to total organic carbon in arable soils. Soil Biol. Biochem. 1989, 21, 471–479. [Google Scholar] [CrossRef]
- Insam, H.; Domsch, K.H. Relationship between soil organic carbon and microbial biomass on chronosequences of reclamation sites. Microb. Ecol. 1988, 15, 177–188. [Google Scholar] [CrossRef]
- Anderson, T.; Domsch, K.H. Carbon assimilation and microbial activity in soil. Z. Pflanz. Bodenkd. 1986, 149, 457–468. [Google Scholar] [CrossRef]
- Cook, B.D.; Allan, D.L. Dissolved organic carbon in old field soils: Total amounts as a measure of available re-sources for soil mineralization. Soil Biol. Biochem. 1992, 24, 585–594. [Google Scholar] [CrossRef]
- Lucas-Borja, M.E.; Candel, D.; Jindo, K.; Moreno, J.L.; Andrés, M.; Bastida, F. Soil microbial community structure and activity in monospecific and mixed forest stands, under Mediterranean humid conditions. Plant Soil 2012, 354, 359–370. [Google Scholar] [CrossRef]
- Bauhus, J.; Paré, D.; Co Té, L. Effects of tree species, stand age and soil type on soil microbial biomass and its activity in a southern boreal forest. Soil Biol. Biochem. 1998, 30, 1077–1089. [Google Scholar] [CrossRef]
- Feng, W.T.; Zou, X.M.; Schaefer, D. Above- and belowground carbon inputs affect seasonal variations of soil microbial bio-mass in a subtropical monsoon forest of southwest China. Soil Biol. Biochem. 2009, 41, 978–983. [Google Scholar] [CrossRef]
- Yu, X.; Liu, X.; Zhao, Z.; Liu, J.; Zhang, S. Effect of monospecific and mixed sea-buckthorn (Hippophae rhamnoides) plantations on the structure and activity of soil microbial communities. PLoS ONE 2015, 10, e0117505. [Google Scholar] [CrossRef]
- Balser, T.C.; Firestone, M.K. Linking Microbial Community Composition and Soil Processes in a California Annual Grassland and Mixed-Conifer Forest. Biogeochemistry 2005, 73, 395–415. [Google Scholar] [CrossRef]
- Jian, S.; Li, J.; Chen, J.; Wang, G.; Mayes, M.A.; Dzantor, K.E.; Hui, D.; Luo, Y. Soil extracellular enzyme activities, soil carbon and nitrogen storage under nitrogen fertilization: A meta-analysis. Soil Biol. Biochem. 2016, 101, 32–43. [Google Scholar] [CrossRef] [Green Version]
- Wittmann, C.; Kähkönen, M.A.; Ilvesniemi, H.; Kurola, J.; Salkinoja-Salonen, M.S. Areal activities and stratification of hydrolytic enzymes involved in the biochemical cycles of carbon, nitrogen, sulphur and phosphorus in podsolized boreal forest soils. Soil Biol. Biochem. 2004, 36, 425–433. [Google Scholar] [CrossRef]
- Garland, J.L. Analysis and interpretation of community-level physiological profiles in microbial ecology. FEMS Microbiol. Ecol. 1997, 24, 289–300. [Google Scholar] [CrossRef]
- Lehman, R.M.; Colwell, F.S.; Ringelberg, D.B.; White, D.C. Combined microbial community-level analyses for quality assurance of terrestrial subsurface cores. J. Microbiol. Meth. 1995, 22, 263–281. [Google Scholar] [CrossRef] [Green Version]
- Zak, J.C.; Willig, M.R.; Moorhead, D.L.; Wildman, H.G. Functional diversity of microbial communities: A quantitative approach. Soil Biol. Biochem. 1994, 26, 1101–1108. [Google Scholar] [CrossRef]


| Stand | Density (Tree ha−1) | Height (m) | DBH (cm) | Basal Area (m2 ha−1) |
|---|---|---|---|---|
| PCH | 355 ± 15 a | 23.95 ± 0.80 a | 28.24 ± 0.97 b | 23.15 ± 1.50 b |
| MIX | 380 ± 10 a | 24.52 ± 0.37 a | 34.31 ± 1.02 a | 39.67 ± 2.27 a |
| P. massoniana | 95 ± 9 | 22.01 ± 0.67 | 26.16 ± 0.75 | 5.35 ± 0.85 |
| C. hystrix | 285 ± 15 | 25.33 ± 0.39 | 36.95 ± 1.63 | 34.32 ± 2.91 |
| PPM | 400 ± 24 a | 23.32 ± 0.71 a | 28.16 ± 1.04 b | 26.60 ± 2.57 b |
| Factors | Dry-Cool Season | Wet-Warm Season | Stand Type | Season | Stand Type × Season | |||||||
|---|---|---|---|---|---|---|---|---|---|---|---|---|
| PCH | MIX | PPM | PCH | MIX | PPM | F | p | F | p | F | p | |
| LP | 6.68 ± 0.19 b | 8.36 ± 0.69 a | 4.84 ± 0.19 c | 5.53 ± 0.43 b | 9.21 ± 0.40 a | 6.16 ± 0.23 b | 37.52 | <0.001 | 0.93 | 0.343 | 5.27 | 0.013 |
| OClitter | 190.64 ± 10.63 b | 248.59 ± 18.48 a | 255.05 ± 18.00 a | 277.57 ± 18.85 b | 274.3 ± 11.42 b | 321.75 ± 5.44 a | 6.83 | 0.004 | 24.86 | <0.001 | 2.26 | 0.127 |
| TNlitter | 17.38 ± 0.78 a | 13.53 ± 1.06 b | 14.96 ± 0.62 ab | 12.95 ± 0.59 a | 13.57 ± 0.90 a | 11.89 ± 0.50 a | 3.21 | 0.058 | 15.79 | 0.001 | 4.45 | 0.023 |
| CNlitter | 11.12 ± 0.95 b | 18.50 ± 0.81 a | 17.33 ± 1.81 a | 21.82 ± 2.23 b | 20.56 ± 1.56 b | 27.22 ± 0.96 a | 7.67 | 0.003 | 38.90 | <0.001 | 5.18 | 0.013 |
| TPlitter | 1.34 ± 0.08 a | 0.50 ± 0.07 b | 1.16 ± 0.05 a | 1.19 ± 0.15 a | 1.38 ± 0.15 a | 1.31 ± 0.05 a | 6.67 | 0.005 | 12.81 | 0.002 | 14.17 | <0.001 |
| TKlitter | 1.16 ± 0.16 a | 1.52 ± 0.10 a | 0.82 ± 0.09 b | 1.07 ± 0.02 b | 1.49 ± 0.13 a | 0.88 ± 0.07 c | 20.84 | <0.001 | 0.07 | 0.796 | 0.29 | 0.751 |
| Factors | Dry-Cool Season | Wet-Warm Season | Stand Type | Season | Stand Type × Season | |||||||
|---|---|---|---|---|---|---|---|---|---|---|---|---|
| PCH | Mixed | PPM | PCH | Mixed | PPM | F | p | F | p | F | p | |
| BD | 1.09 ± 0.03 b | 1.25 ± 0.04 a | 1.19 ± 0.02 a | 1.03 ± 0.01 a | 1.03 ± 0.03 a | 1.04 ± 0.05 a | 3.11 | 0.063 | 30.44 | <0.001 | 2.97 | 0.070 |
| WC | 39.66 ± 1.36 b | 43.59 ± 0.61 a | 40.17 ± 1.58 ab | 40.53 ± 1.07 c | 44.40 ± 0.84 b | 50.48 ± 1.41 a | 10.35 | 0.001 | 16.81 | <0.001 | 10.48 | 0.001 |
| Tem. | 16.82 ± 0.21 a | 15.50 ± 0.09 c | 16.17 ± 0.05 b | 26.28 ± 0.43 a | 25.98 ± 0.22 a | 25.41 ± 0.08 a | 8.21 | 0.002 | 2833.34 | <0.001 | 4.31 | 0.025 |
| pH | 4.32 ± 0.02 a | 4.19 ± 0.03 b | 4.04 ± 0.05 c | 4.02 ± 0.02 b | 4.21 ± 0.03 a | 3.90 ± 0.09 b | 14.40 | <0.001 | 13.70 | 0.001 | 6.23 | 0.007 |
| SOC | 37.42 ± 1.08 b | 40.82 ± 0.22 b | 56.98 ± 1.89 a | 53.31 ± 1.94 a | 48.39 ± 2.00 a | 50.83 ± 0.54 a | 24.60 | <0.001 | 23.69 | <0.001 | 28.64 | <0.001 |
| TN | 1.63 ± 0.05 b | 1.60 ± 0.06 b | 2.16 ± 0.22 a | 2.48 ± 0.11 a | 2.13 ± 0.13 a | 2.17 ± 0.14 a | 2.48 | 0.105 | 44.08 | <0.001 | 4.80 | 0.018 |
| SOC/TN | 22.98 ± 0.59 b | 25.67 ± 1.03 b | 29.49 ± 1.59 a | 21.67 ± 1.33 a | 23.04 ± 1.62 a | 23.90 ± 2.02 a | 4.57 | 0.021 | 7.22 | 0.013 | 1.14 | 0.338 |
| TP | 0.31 ± 0.04 c | 0.42 ± 0.02 b | 0.60 ± 0.04 a | 0.52 ± 0.06 b | 0.78 ± 0.04 a | 0.54 ± 0.04 b | 21.86 | <0.001 | 28.89 | <0.001 | 17.95 | <0.001 |
| AP | 9.19 ± 0.58 b | 12.52 ± 0.69 a | 10.02 ± 0.30 b | 13.30 ± 0.40 a | 13.15 ± 0.57 a | 9.98 ± 0.27 b | 16.70 | <0.001 | 15.25 | 0.001 | 10.29 | 0.001 |
| TK | 4.14 ± 0.15 b | 5.45 ± 0.49 a | 2.42 ± 0.16 c | 5.40 ± 0.50 a | 6.94 ± 0.82 a | 3.38 ± 0.13 b | 32.26 | <0.001 | 10.34 | 0.004 | 0.39 | 0.680 |
| AK | 29.90 ± 1.49 b | 46.29 ± 0.96 a | 28.46 ± 1.08 b | 47.19 ± 2.28 a | 52.79 ± 3.65 a | 28.37 ± 1.44 b | 53.75 | <0.001 | 22.57 | <0.001 | 9.27 | 0.001 |
| NO3−-N | 3.55 ± 0.24 a | 1.85 ± 0.04 c | 2.86 ± 0.22 b | 4.06 ± 0.19 c | 5.30 ± 0.09 b | 5.79 ± 0.09 a | 10.96 | <0.001 | 291.06 | <0.001 | 45.47 | <0.001 |
| NH4+-N | 21.29 ± 1.01 a | 23.34 ± 1.13 a | 24.47 ± 1.37 a | 42.24 ± 1.62 a | 43.50 ± 1.66 a | 38.83 ± 2.47 a | 0.75 | 0.482 | 196.16 | <0.001 | 2.47 | 0.105 |
| AN | 27.34 ± 1.57 a | 25.19 ± 1.14 a | 24.85 ± 0.90 a | 46.3 ± 1.55 a | 48.8 ± 1.69 a | 44.62 ± 2.46 a | 1.20 | 0.319 | 245.55 | <0.001 | 1.17 | 0.328 |
| CEC | 45.53 ± 3.27 c | 57.58 ± 4.11 b | 82.33 ± 1.94 a | 55.43 ± 2.02a | 54.46 ± 1.19 a | 62.24 ± 2.91 a | 45.14 | <0.001 | 12.16 | 0.002 | 21.68 | <0.001 |
| Factors | Dry-Cool Season | Wet-Warm Season | Stand Type | Season | Stand Type × Season | |||||||
|---|---|---|---|---|---|---|---|---|---|---|---|---|
| PCH | MIX | PPM | PCH | MIX | PPM | F | p | F | p | F | p | |
| TPLFAs | 37.67 ± 2.71 a | 32.55 ± 1.24 a | 37.96 ± 1.28 a | 43.73 ± 2.08 a | 40.01 ± 0.7 a | 34.78 ± 1.11 b | 4.64 | 0.020 | 6.46 | 0.018 | 6.07 | 0.007 |
| B | 15.79 ± 0.81 a | 13.06 ± 0.43 b | 14.90 ± 0.51 ab | 17.64 ± 0.72 a | 17.23 ± 0.42 a | 12.76 ± 0.41 b | 12.74 | <0.001 | 7.68 | 0.011 | 15.56 | <0.001 |
| GP | 9.45 ± 0.43 a | 7.94 ± 0.29 b | 9.18 ± 0.31 a | 10.66 ± 0.51 a | 11.55 ± 0.31 a | 8.10 ± 0.31 b | 8.17 | 0.002 | 17.09 | <0.001 | 20.30 | <0.001 |
| GN | 5.91 ± 0.76 a | 5.90 ± 0.16 a | 5.53 ± 0.22 a | 6.19 ± 0.25 a | 4.55 ± 0.37 b | 4.11 ± 0.20 b | 5.26 | 0.013 | 7.02 | 0.014 | 3.13 | 0.062 |
| F | 4.98 ± 0.34 a | 3.75 ± 0.22 b | 4.24 ± 0.28 ab | 4.92 ± 0.35 a | 2.96 ± 0.43 b | 3.45 ± 0.21 b | 13.56 | <0.001 | 4.48 | 0.045 | 0.91 | 0.416 |
| AMF | 1.04 ± 0.03 a | 0.75 ± 0.03 b | 0.75 ± 0.04 b | 0.85 ± 0.07 a | 0.44 ± 0.08 b | 0.48 ± 0.03 b | 28.22 | <0.001 | 34.83 | <0.001 | 0.56 | 0.577 |
| Acti | 4.26 ± 0.37 ab | 3.77 ± 0.21 b | 4.86 ± 0.20 a | 5.31 ± 0.19 a | 4.87 ± 0.12 b | 4.58 ± 0.10 b | 2.73 | 0.085 | 12.36 | 0.002 | 6.50 | 0.006 |
| B/F | 3.19 ± 0.11 a | 3.51 ± 0.13 a | 3.56 ± 0.17 a | 3.62 ± 0.14 b | 6.35 ± 0.94 a | 3.77 ± 0.33 b | 7.50 | 0.003 | 11.31 | 0.003 | 5.98 | 0.008 |
| GP/GN | 1.74 ± 0.29 b | 1.35 ± 0.03 b | 1.66 ± 0.04 a | 1.73 ± 0.08 b | 2.63 ± 0.28 a | 1.98 ± 0.11 b | 1.07 | 0.359 | 13.76 | 0.001 | 7.33 | 0.003 |
© 2019 by the authors. Licensee MDPI, Basel, Switzerland. This article is an open access article distributed under the terms and conditions of the Creative Commons Attribution (CC BY) license (http://creativecommons.org/licenses/by/4.0/).
Share and Cite
Wu, W.; Zhou, X.; Wen, Y.; Zhu, H.; You, Y.; Qin, Z.; Li, Y.; Huang, X.; Yan, L.; Li, H.; et al. Coniferous-Broadleaf Mixture Increases Soil Microbial Biomass and Functions Accompanied by Improved Stand Biomass and Litter Production in Subtropical China. Forests 2019, 10, 879. https://doi.org/10.3390/f10100879
Wu W, Zhou X, Wen Y, Zhu H, You Y, Qin Z, Li Y, Huang X, Yan L, Li H, et al. Coniferous-Broadleaf Mixture Increases Soil Microbial Biomass and Functions Accompanied by Improved Stand Biomass and Litter Production in Subtropical China. Forests. 2019; 10(10):879. https://doi.org/10.3390/f10100879
Chicago/Turabian StyleWu, Wenxiang, Xiaoguo Zhou, Yuanguang Wen, Hongguang Zhu, Yeming You, Zhiwei Qin, Yunchou Li, Xueman Huang, Li Yan, Haiyan Li, and et al. 2019. "Coniferous-Broadleaf Mixture Increases Soil Microbial Biomass and Functions Accompanied by Improved Stand Biomass and Litter Production in Subtropical China" Forests 10, no. 10: 879. https://doi.org/10.3390/f10100879
APA StyleWu, W., Zhou, X., Wen, Y., Zhu, H., You, Y., Qin, Z., Li, Y., Huang, X., Yan, L., Li, H., & Li, X. (2019). Coniferous-Broadleaf Mixture Increases Soil Microbial Biomass and Functions Accompanied by Improved Stand Biomass and Litter Production in Subtropical China. Forests, 10(10), 879. https://doi.org/10.3390/f10100879