Article

A Complete Transcriptional Landscape Analysis of Pinus elliottii Engelm. Using Third-Generation Sequencing and Comparative Analysis in the Pinus Phylogeny

Research Institute of Subtropical Forestry, Chinese Academy of Forestry, Hangzhou 311400, China
*
Author to whom correspondence should be addressed.
Forests 2019, 10(11), 942; https://doi.org/10.3390/f10110942
Submission received: 6 September 2019 / Revised: 17 October 2019 / Accepted: 19 October 2019 / Published: 24 October 2019

Abstract

:
The planting of Pinus elliottii Engelm. has now reached close to three million ha in China. Molecular breeding as part of the improvement program for P. elliottii in southern China has been carried out in recent years. Third-generation sequencing (Pacbio sequencing technology, TGS) was used to obtain the exome of P. elliottii for molecular breeding. A total of 35.8 Gb clean reads were generated using TGS. After removing the redundant reads, we obtained 80,339 high-accuracy transcripts. Significantly, a total of 76,411 transcripts (95.1%) were blasted to public annotation databases. We predicted 65,062 intact coding sequences (CDSs), 8916 alternative splicing events, 1937 long non-coding RNAs, and 22,109 simple sequence repeats (SSRs) based on these obtained transcripts. Using the public databases and the data obtained above, 23 orthologous single-copy genes were identified to analyze the phylogenetic relationships for Pinus firstly including P. elliottii. Many positive selection genes involved in important biological processes and metabolism pathways were identified between P. elliottii and other pines. These positive selection genes could be candidate genes to be researched on the genetic basis of superior performance. Our study is the first to reveal the full-length and well-annotated transcripts of P. elliottii, which could provide reference for short transcriptome sequences in the research of genetics, phylogenetics, and genetic improvement for the non-reference genome species.

1. Introduction

Slash pine (Pinus elliottii Engelm.) is a pine species of primary importance that is planted in industrial plantations of timber forests around the world. This species provides important resources for people, such as timber, resins, and paper [1,2]. Early on, slash pine was found to be an excellent species for resin-tapping and pulping in southern China, and the planting of this conifer species has now attained close to three million ha. A large-scale genetic improvement program for slash pine was implemented to produce fast-growing trees with high resin content to address the shortage of timber and resin production over the last three decades [3]. Molecular breeding, as a part of this improvement program, has been carried out in recent years. It is also very important for tree molecular breeders to understand the genetic basis of key biological processes, complex phenotype trait variation, and biological evolution.
Genome-wide analyses of pines are still a big challenge, although few important conifers species with large genome have been sequenced [4,5,6,7]. Pines contain numerous repetition and pseudogenes and are highly heterozygous. Like other conifers, the genome assembly of pines is also very difficult to determine because of our inability to obtain inbreeding lines [6]. The genome size of pines is about 17–35 gigabase pairs (Gb) [8]. The fist pine genome of Pinus taeda (22 Gb) was first published in 2014 [9,10]. Subsequently, the genome of Pinus lambertiana (31 Gb) was published [11]. The published pine genome contains highly abundant transposable elements. These published pine species genomes provide important genetic information for Pinus genetic study. However, interspecific divergences make it difficult for other pines to reference these published genomes. Whole genome sequencing is complex, time-consuming, and expensive. Thus, a better strategy is needed to obtain genome information for pines. Single-molecule, real-time (SMRT) sequencing developed by Pacific BioSciences (PacBio) is a third-generation sequencing (TGS) technology, more concisely referred to as ‘‘PacBio sequencing”. PacBio sequencing has been widely used to sequence full-length transcripts and is well-suited for the non-reference species to obtain a complete transcriptional landscape [12]. TGS could generate full-length cDNA sequences, which would help provide a reference for second-generation sequencing (SGS) technologies in the assembling process and prediction of coding sequences (CDS), simple sequence repeat (SSR), long non-coding RNAs (long ncRNAs, lncRNAs), and alternative splicing (AS) events. Based on the full-length transcript annotations, the candidate transcripts involved in important growth traits and metabolism pathways could be screened for further studies. TGS could be a good strategy to obtain the exome of the Pinus species.
Genome-wide analyses of Pinus elliottii Engelm are difficult, like those of other pines, because the genome size of P. elliottii is about 22 G [8]. Acosta et al. [13] were the first to design the oligonucleotide probes for P. taeda to capture a partial exome of P. elliottii based on the high genome similarity between P. elliottii and P. taeda and de Oliveira Junkes et al. [14] anchored filtered short reads generated using SGS technology to the reference genome of P. taeda. However, the complete transcriptional landscape of slash pine is still unknown. TGS technology could help us obtain abundant exome information for P. elliottii and provide full transcriptome reference of this species for anchoring the short reads generated using SGS [12].
In this study, TGS technology was used to sequence the RNA long reads of a pooled set of five tissues, including young leaves, old leaves, xylem, phloem, and roots from an adult P. elliottii. The short reads of 11 xylem samples obtained using SGS were used to adjust the transcripts with low quality obtained using TGS. Based on the high-quality full-length transcript of P. elliottii, we predicted CDS, lncRNA, SSR, and AS. In order to analyze Pinus’ phylogenetic relationships and identify the positive selection genes between P. elliottii and other pines that are involved in important biological processes and metabolic pathways, the unigene/gene information of 10 pines and Picea glauca were obtained from the public database. The shared orthologous single-copy genes in all conifer species were used to analyze Pinus’ phylogenetic relationships. The paired orthologous genes between P. elliottii and other pines were used to identify the positive selection genes. The identification of functional genes with a positive selection are very important to dissect the complex traits of P. elliottii.

2. Materials and Methods

2.1. Plant Materials and RNA Preparation

Five tissues, including young leaves, old leaves, xylem, phloem, and roots were collected from an adult P. elliottii with moderate growth traits (diameter at breast height, DBH, is 22.3 cm) in the progeny trial [3] in July 2018. In the same plot, the xylem of another 11 adult P. elliottii with DBH ranging from 15.8 cm to 32.5 cm were also collected. The 11 individuals were numbered from S01 to S11, with DBH respectively 22.3 cm, 23.5 cm, 30.4 cm, 16.0 cm, 15.8 cm, 19.5 cm, 24.6 cm, 23.2 cm, 28.1 cm, 23.5 cm, and 32.5 cm. All collected tissues were frozen immediately in liquid nitrogen and stored at −80 °C. The total RNA from each tissue was isolated using the RNAprep Pure Plant Kit (TIANGEN Biotech Co., Ltd., Beijing, China). Only qualifying RNA samples (A260/A280 > 2; RNA integrity number (RIN) > 8; 28S/18S > 1; RNA concentration > 150 ng/μL, total RNA mass > 2.5 ng) were used for second or third generation sequencing.

2.2. Illumina RNA-Seq Library Construction

The total RNA of the xylem from 11 adult P. elliottii individuals was used for poly(A)+ selection using oligo (dT) magnetic beads (Invitrogen 610-02). The selected RNA was eluted in water and subjected to RNA-seq library construction using the ScriptSeq Kit (Illumina, San Diego, CA, USA). The quality of the libraries was assessed using the Qubit 2.0 Fluorometer (Life Technologies, Carlsbad, CA, USA) and the Agilent 2100 Bioanalyzer (Agilent Technologies, Palo Alto, CA, USA). The effective concentration of the RNA-seq library was accurately quantified using the quantitative PCR (Q-PCR) method. The library with an effective concentration >2 nM was sequenced using the Illumina NovaSeq 6000 platform by Biomarker Tech (Beijing, China).

2.3. PacBio Long-Read Sequencing, Raw Data Processing and Differential Expression Analysis

The total RNAs of the five different tissues from an adult P. elliottii were pooled equally for long-read sequencing. PacBio long-read sequencing (from Pacific Biosciences, enabled using single molecule, real-time (SMRT) sequencing technology) was used to sequence the RNA long reads. The library was prepared according to the isoform sequencing (Iso-Seq) protocol, as described by Pacific Biosciences. The quality of the libraries was assessed using the Qubit 2.0. Fluorometer and the Agilent 2100 Bioanalyzer. Two SMRT cells were sequenced on the PacBio RS II using Biomarker Tech (Beijing China). Raw reads were processed into error corrected reads of insert (ROIs) using the Iso-Seq pipeline with FullPass > 0 and Predicted Accuracy > 0.80, following the PacBio Iso-Seq TM tutorial’s recommendation. Next, full-length, non-chimeric (FLNC) transcripts were determined by searching for the poly(A)+ tail signal and the 5′ and 3′ cDNA primers in ROIs. Iterative clustering for error correction (ICE) was used to obtain consensus isoforms, and FL consensus sequences from ICE were polished using Quiver. High quality FL transcripts were classified with the criteria that post-correction accuracy was above 99%. The short reads of the xylem RNA of 11 adult Pinus elliottii individuals, sequenced using the second-generation sequencing technology, were used to adjust the low-quality full-length transcripts obtained using third-generation sequencing. The redundant ROIs of high quality and adjusted Iso-Seq FL transcripts were removed using Cd-hit (identity > 0.99) [15].
Gene expression levels were estimated by fragments per kilobase of transcript per million fragments mapped. Differential expression (DE) analysis of two samples was performed using the EBSeq package in R version 3.6.1. The resulting FDRs (false discovery rates) were adjusted using the PPDE (posterior probability of being differentially expression). The FDR < 0.01 and |log2(foldchange)| > 1 was set as the threshold for significantly differential expression [16].

2.4. lncRNA, SSR, CDS and Alternative Splice Identifications from the PacBio Sequencing

Transcripts with lengths of more than 200 nucleotides and more than two exons were selected as lncRNA candidates. Four computational approaches, including Coding Potential Calculator (CPC), Coding-Non-Coding Index (CNCI), Coding Potential Assessment Tool (CPAT), and hmmscan algorithm against Pfam database, were combined to sort the non-protein coding RNA from putative protein-coding RNAs in the transcripts. SSRs of the full-length transcriptome of slash pine were identified using the microsatellite identification tool (MISA version 1.0; http://pgrc.ipk-gatersleben.de/misa/) [17]. The candidate coding regions within the transcript sequence were identified using the TransDecoder version 3.0.0 (https://github.com/TransDecoder/TransDecoder/releases). All non-redundancy transcripts were aligned to each other by running all-vs-all BLAST [16] with high identity settings. BLAST alignments that met all following criteria were considered to be the products of candidate AS events: there were two high-scoring segment pairs (HSPs) in the alignment [18]; two HSPs had the same forward/reverse direction within the same alignment; one sequence is continuous or had a small “overlap” size (smaller than 5 bp); the other sequence was distinct to show an “AS Gap”, and the continuous sequence should be more-or-less completely aligned to the distinct sequence; further, the AS Gap should larger than 100 bp and at least 100 bp away from the 3′/5′ end.

2.5. Functional Annotation of PacBio Isoforms

After removing redundant reads, a total of 80,339 transcripts were blasted to public databases including COG (Clusters of Orthologous Groups) [19], GO (Gene Ontology) [20], KEGG (Kyoto Encyclopedia of Genes and Genomes) [21], KOG (euKaryotic Ortholog Groups) [22], Pfam (Protein family) [23], Swissprot [24], EggNOG (Evolutionary genealogy of genes: Non-supervised Orthologous Groups) [25], and NR (NCBI nonredundant protein sequences) database using the BLAST software (version 2.2.26) [26].

2.6. Phylogenetic Analysis of the Genus Pinus

P. elliottii and 10 pines—Whitebark Pine (Pinus albicaulis), Maritime pine (Pinus pinaster), Western White Pine (Pinus monticola), Masson’s pine (Pinus massoniana), Limber Pine (Pinus flexilis), Lodgepole Pine (Pinus contorta), Canary Island pine (Pinus canariensis), Jack Pine (Pinus banksiana), loblolly Pine (Pinus taeda), and Patula Pine (Pinus patula)—were sampled for the Pinus phylogenetic analysis, considering white spruce (Picea glauca) as the outgroup. The full-length transcriptome data of P. elliottii were deposited in the National Center for Biotechnology Information (NCBI, https://www.ncbi.nlm.nih.gov/). The genome assembly and general feature format of P. taeda (version v1.01) were downloaded from NCBI previously to obtain the genes of P. taeda. The unigenes/genes of the other conifer species were obtained from NCBI and PlantGDB-Resources for Plant Comparative Genomics (http://www.plantgdb.org) (Table 2). The orthologous gene groups were identified using OrthoMCL version 2.0.9 with default settings (e-value 1 × 10⁻⁵, protein identity 50%, and an MCL inflation of 1.5). The shared orthologous single-copy genes of 12 conifer species were aligned using Muscle [27]. The alignment result was used to analyze the phylogenetic relationships using the neighbor-joining method [28] with bootstrap 1000 times [29], taking Picea glauca as an outgroup to root the trees. The evolutionary analyses were conducted in MEGA7 [30]. The Ks distribution for the pairwise orthologous genes between the slash pine and 11 other conifer species were drawn using the R version 3.3.2 software (R Foundation for Statistical Computing, Vienna, Austria). The numbers of the synonymous or nonsynonymous substitutions (Ks or Ka) per site were estimated using the PAML software [31]. The positive genes are listed based on the criterion Ka/Ks > 1.

2.7. Data Availability Statement

The datasets for this study can be found in the NCBI. The link for the second sequencing of the raw data is: https://dataview.ncbi.nlm.nih.gov/object/PRJNA552414?reviewer=rktf4k8h7gmdnurk0ljb0r1h0l

3. Results

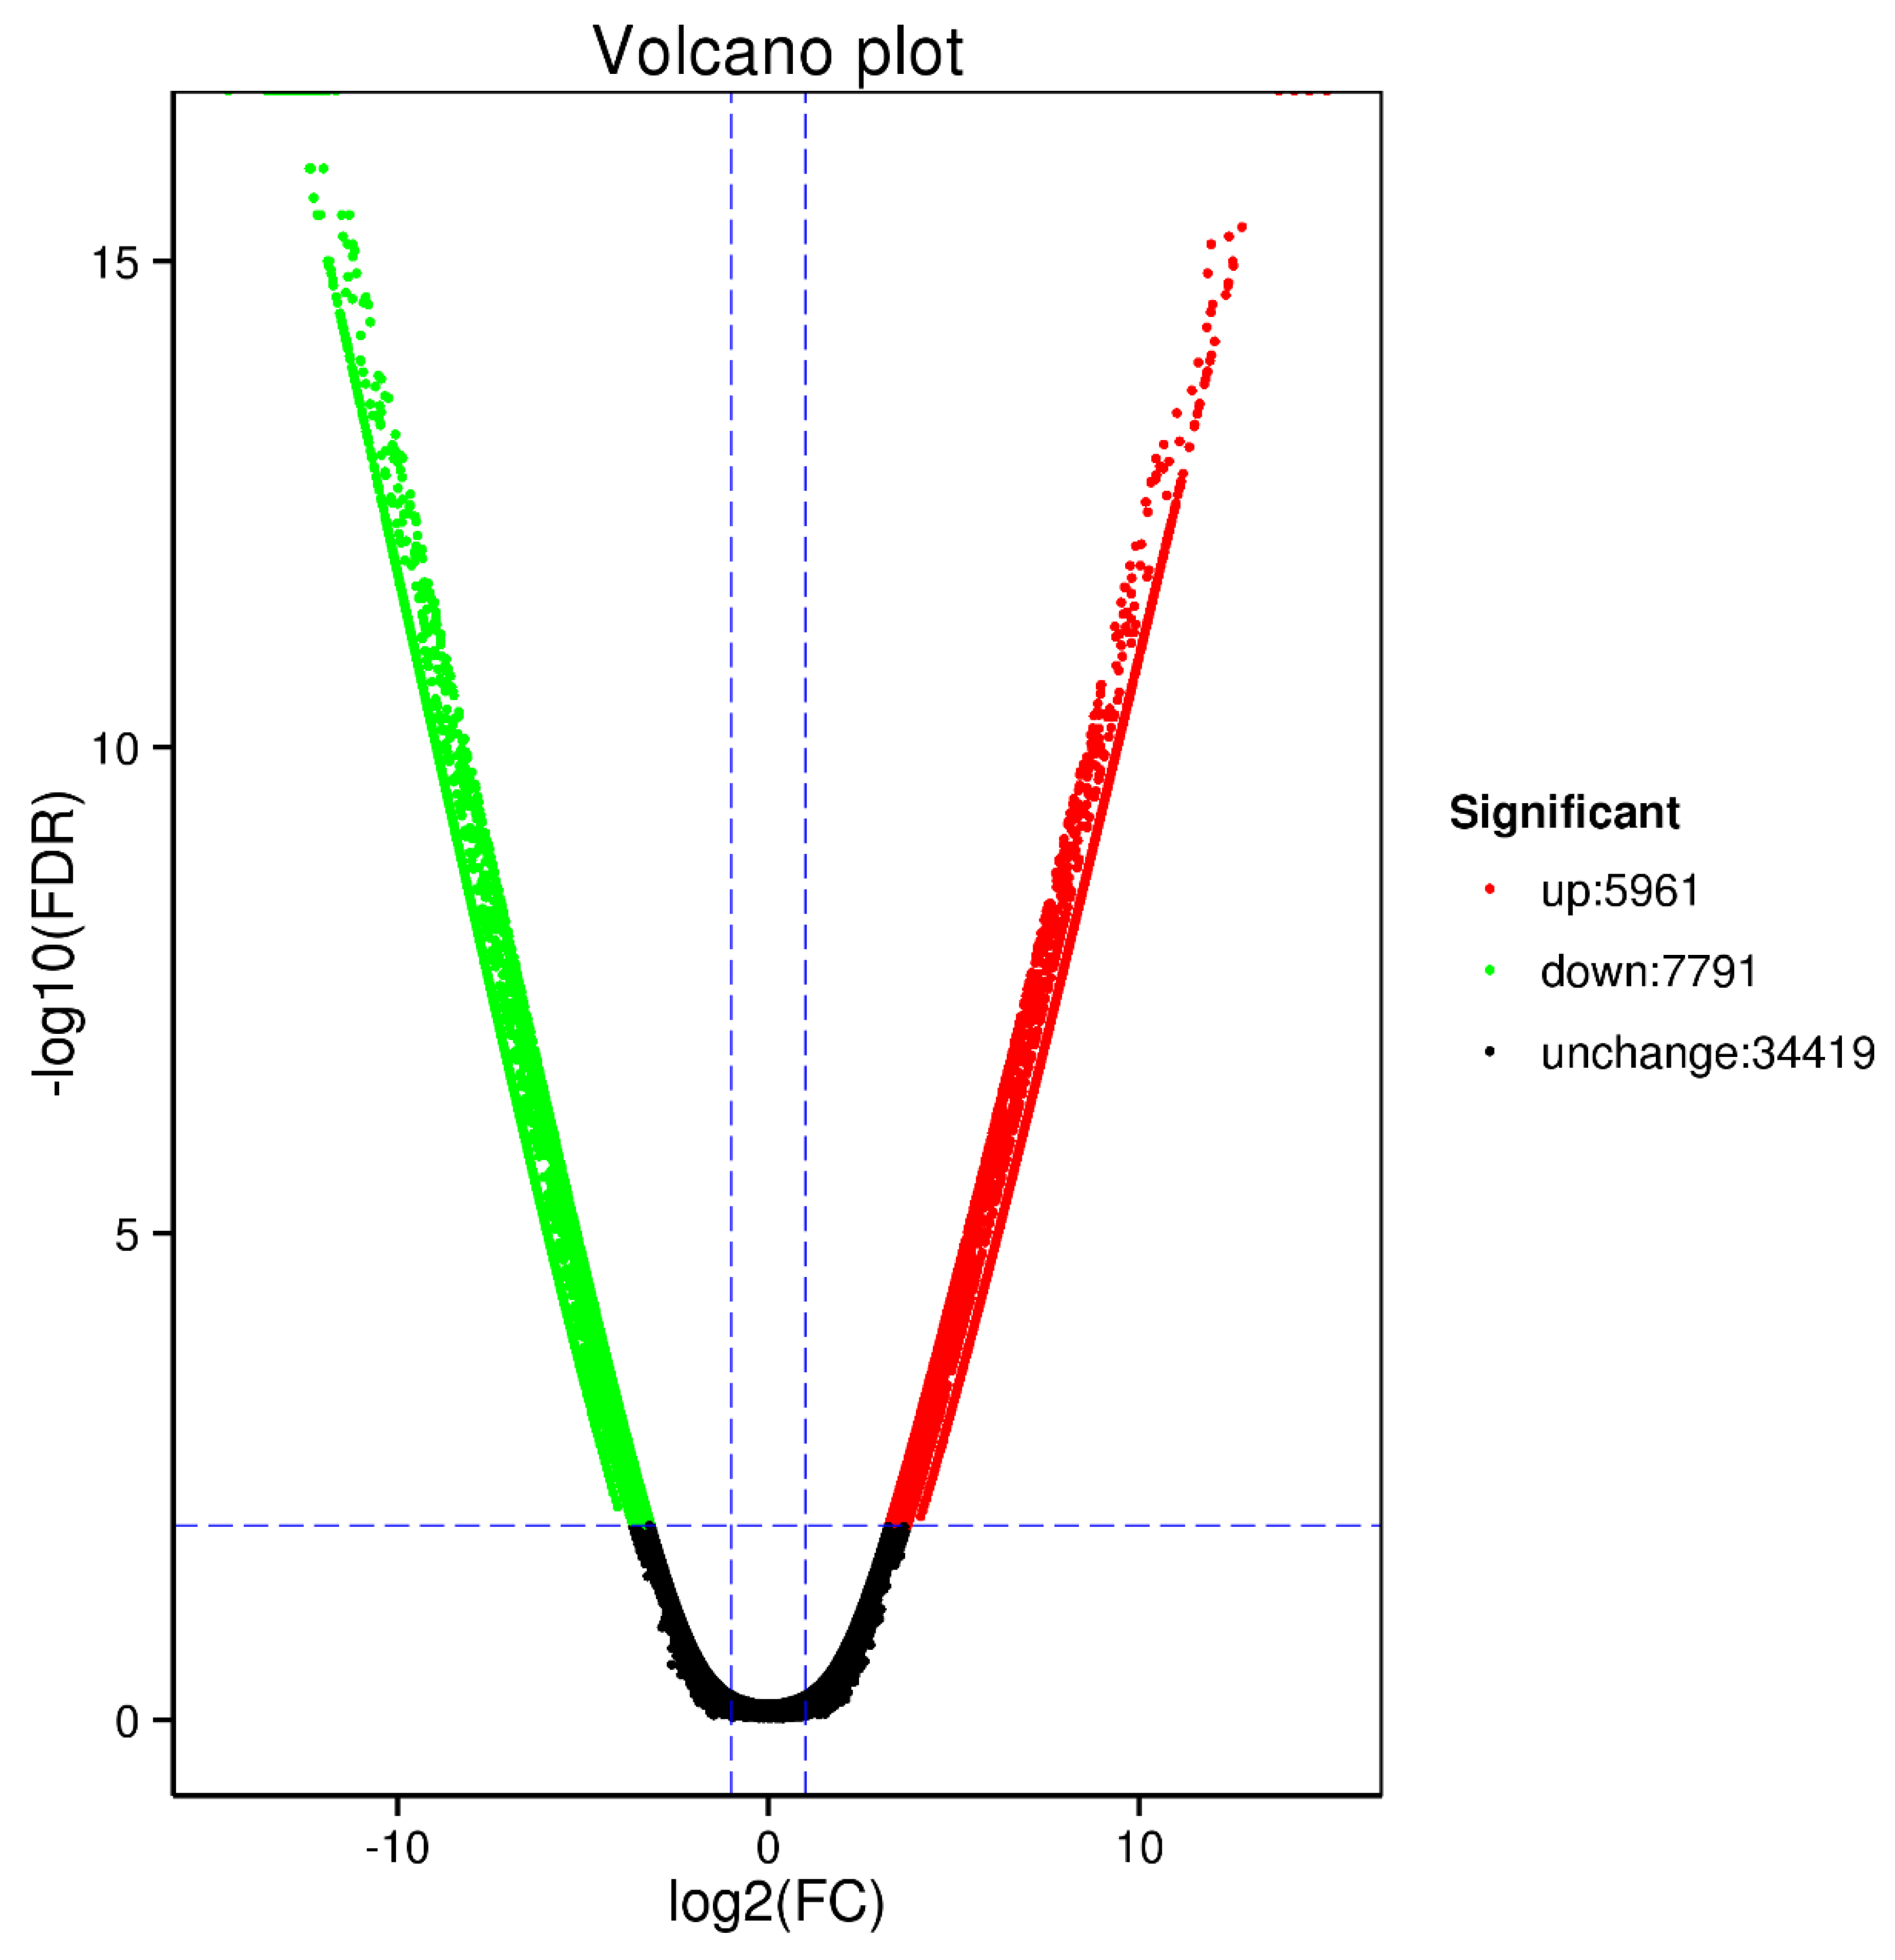
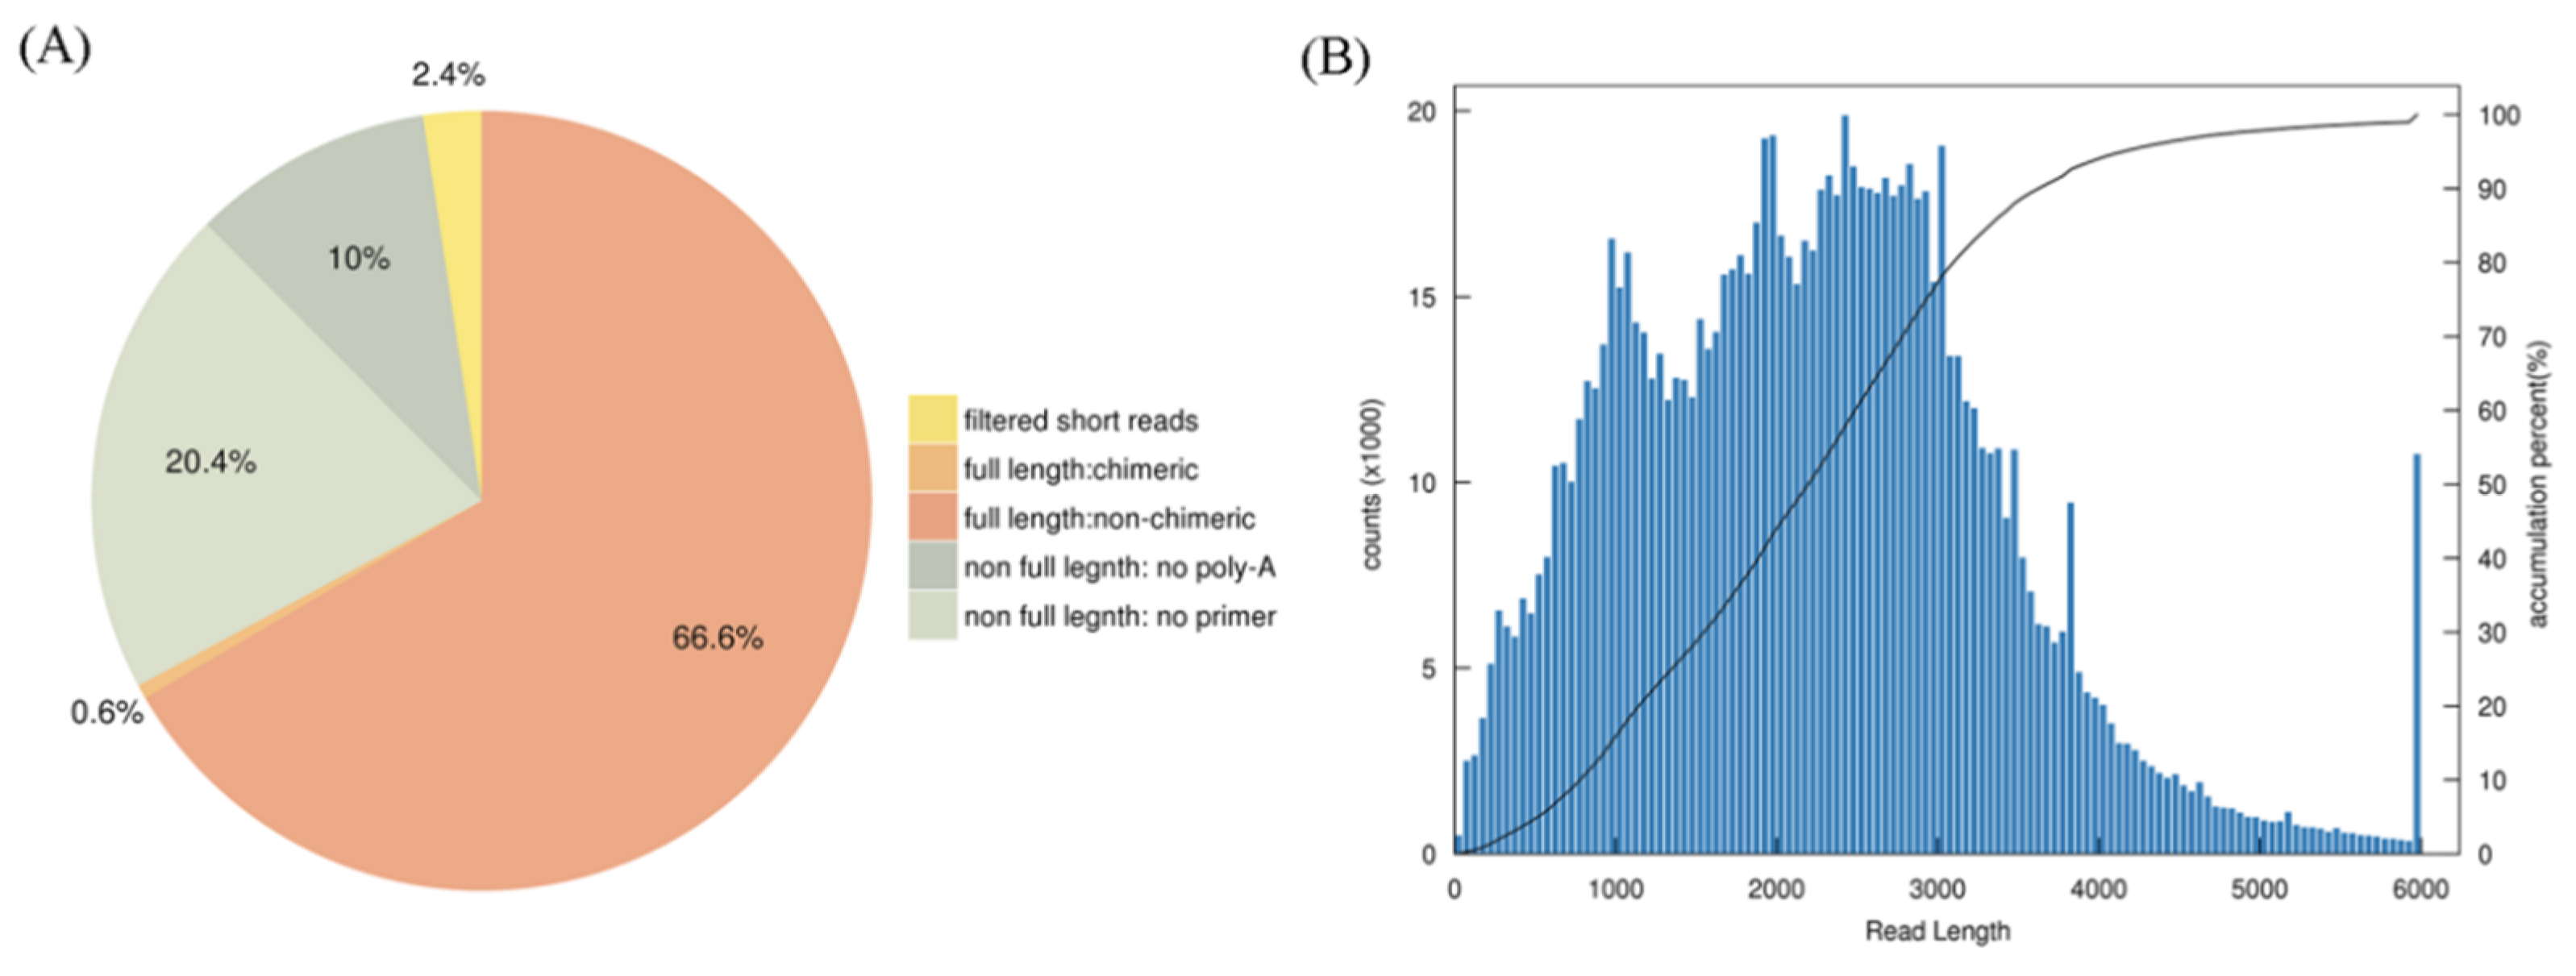
3.1. Third-Generation Sequencing of the Full-Length Transcriptome and the Second-Generation Sequencing

To obtain as many transcript isoforms as possible, the total RNA from five tissues of slash pine were pooled. A total of 1–6 K unfragmented cDNA libraries were synthesized, and single-molecular long-read sequencing was performed using PacBio sequencing. We obtained 35.8 Gb of clean data using two cells. After excluding short reads (<300 bp in length), we generated 1,058,173 reads of insert (ROIs), with a mean length of 2264, a quality of 0.94, and pass of 13. Here, 704,299 ROIs are full-length non-chimeric (FLNC) reads occupying 66.6% (Figure 1) of the total with an average length of 2230 bp. Based on the clustering algorithm of the IEC (iterative clustering for error correction), we extracted 286,685 consensus isoform sequences from 704,299 FLNC reads, which were divided into two formats: high-accuracy transcripts and lower-accuracy transcripts. The lower-accuracy transcripts were adjusted by the short xylem transcripts sequenced using SGS technologies. Ultimately, 80,339 high-quality transcripts were obtained after the redundancy of high-accuracy sequences and the adjusted transcripts were eliminated by Cd-hit [15].
The RNAs from xylem of another 11 adult P. elliottii with DBH ranging from 15.8 cm to 32.5 cm were sequenced using the Illumina NovaSeq 6000 platform (SGS). Clean data of 115.95 G with an average length of 299.2 bp for each clean read was generated. Then the reads were mapped to the adjusted, high quality and full-length TGS transcripts. A high percentage of reads, in the range of 76.66%–82.08%, were mapped to the full-length TGS transcripts. The mapping output was processed for differential gene expression analysis between any two samples within the 11 individuals. The analysis showed reasonable results on explaining the growth differences between the 11 trees. One of the analyses between the two individuals numbered S05 and S11 respectively with the smallest and largest DBH is shown in Appendix A, Figure A1, Figure A2, Figure A3 and Figure A4.

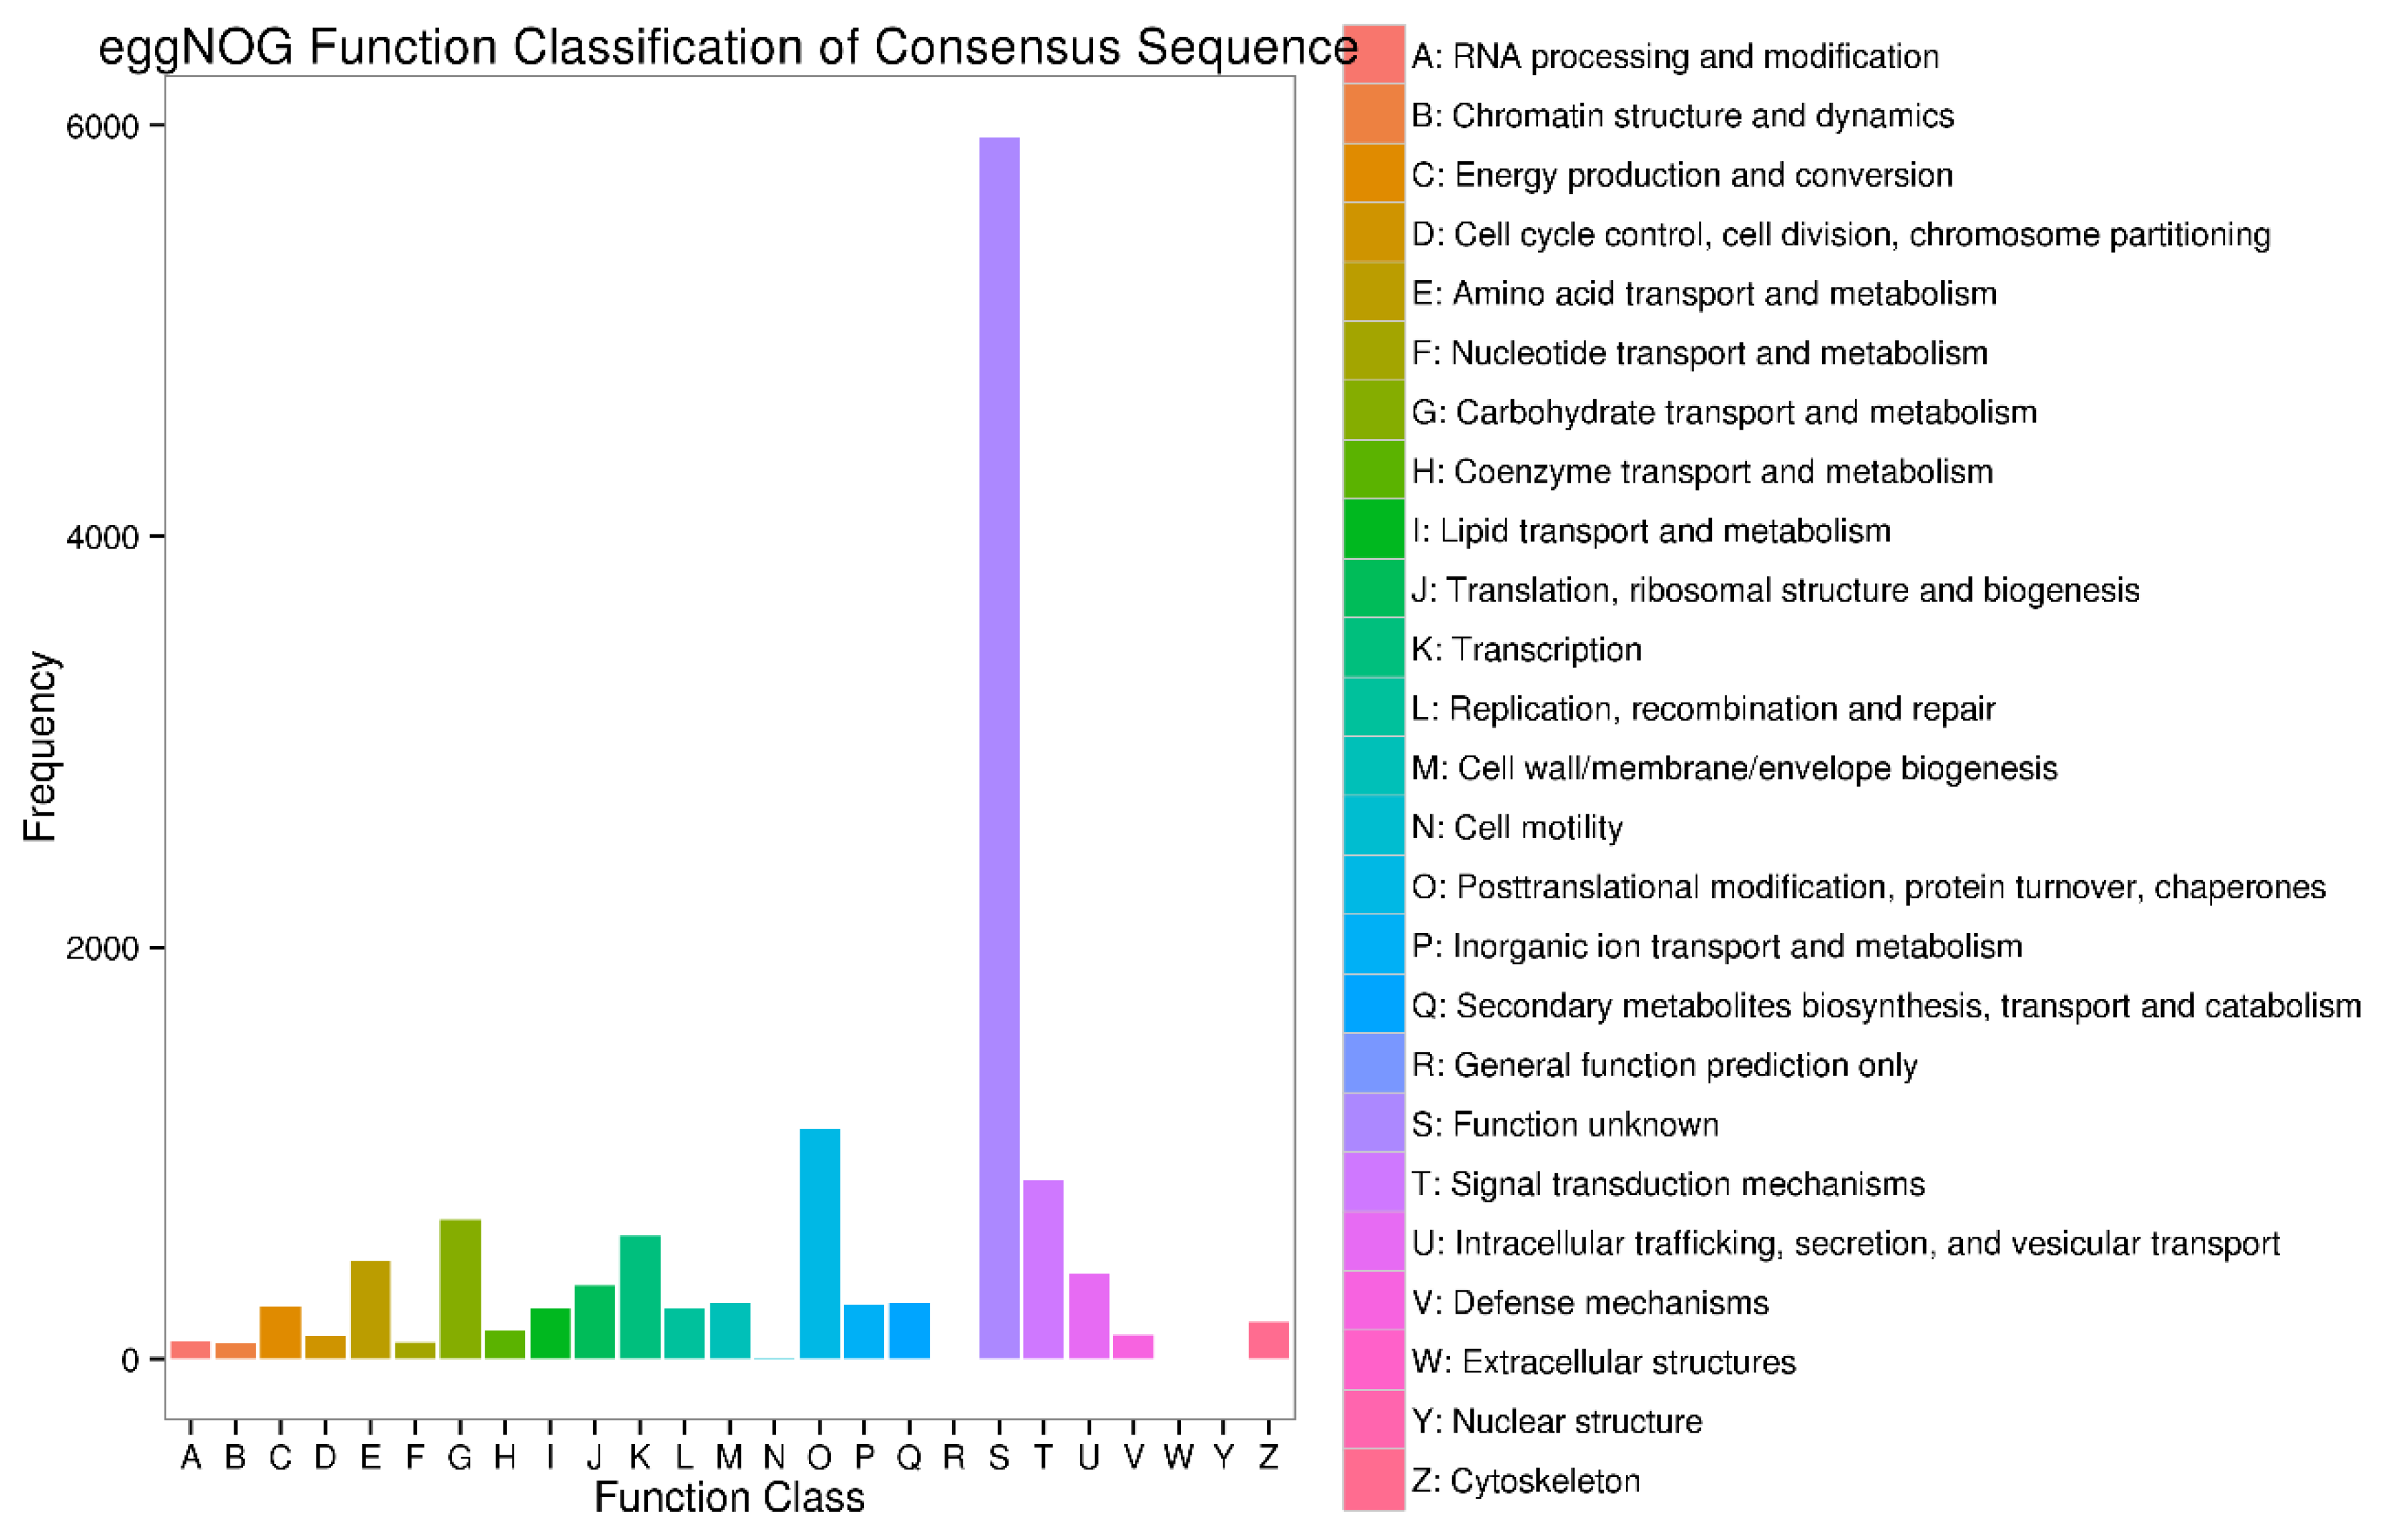
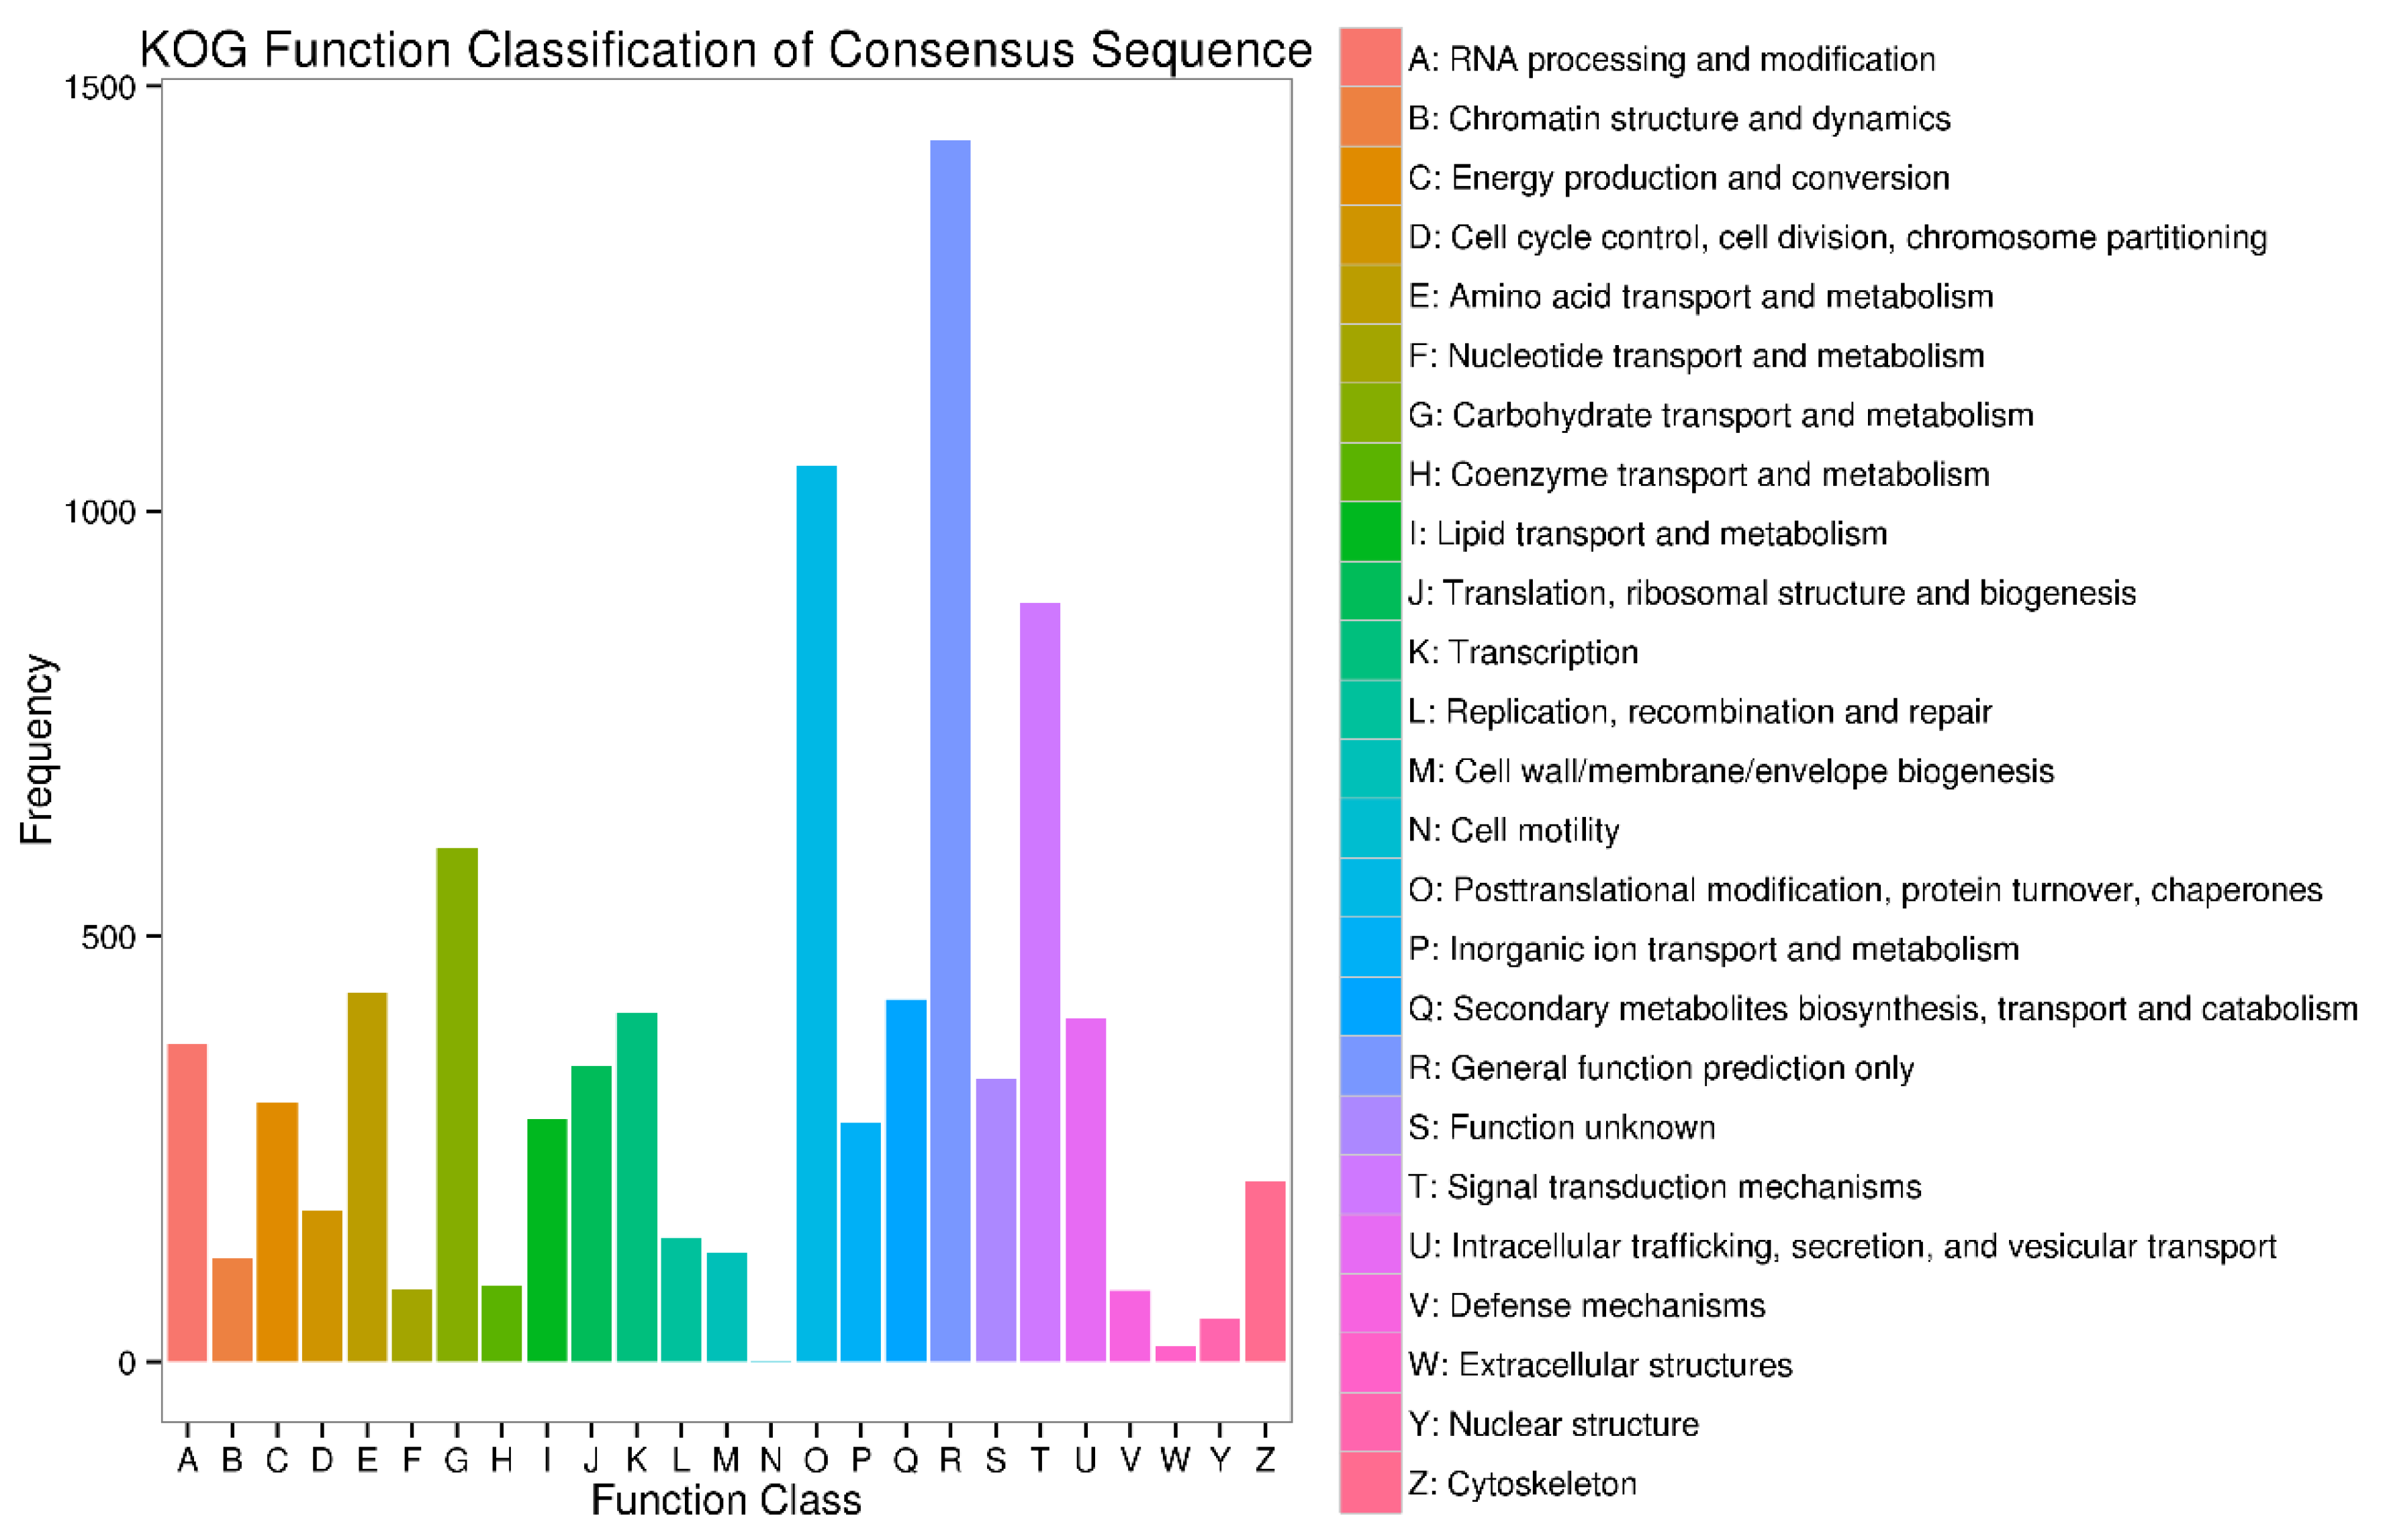
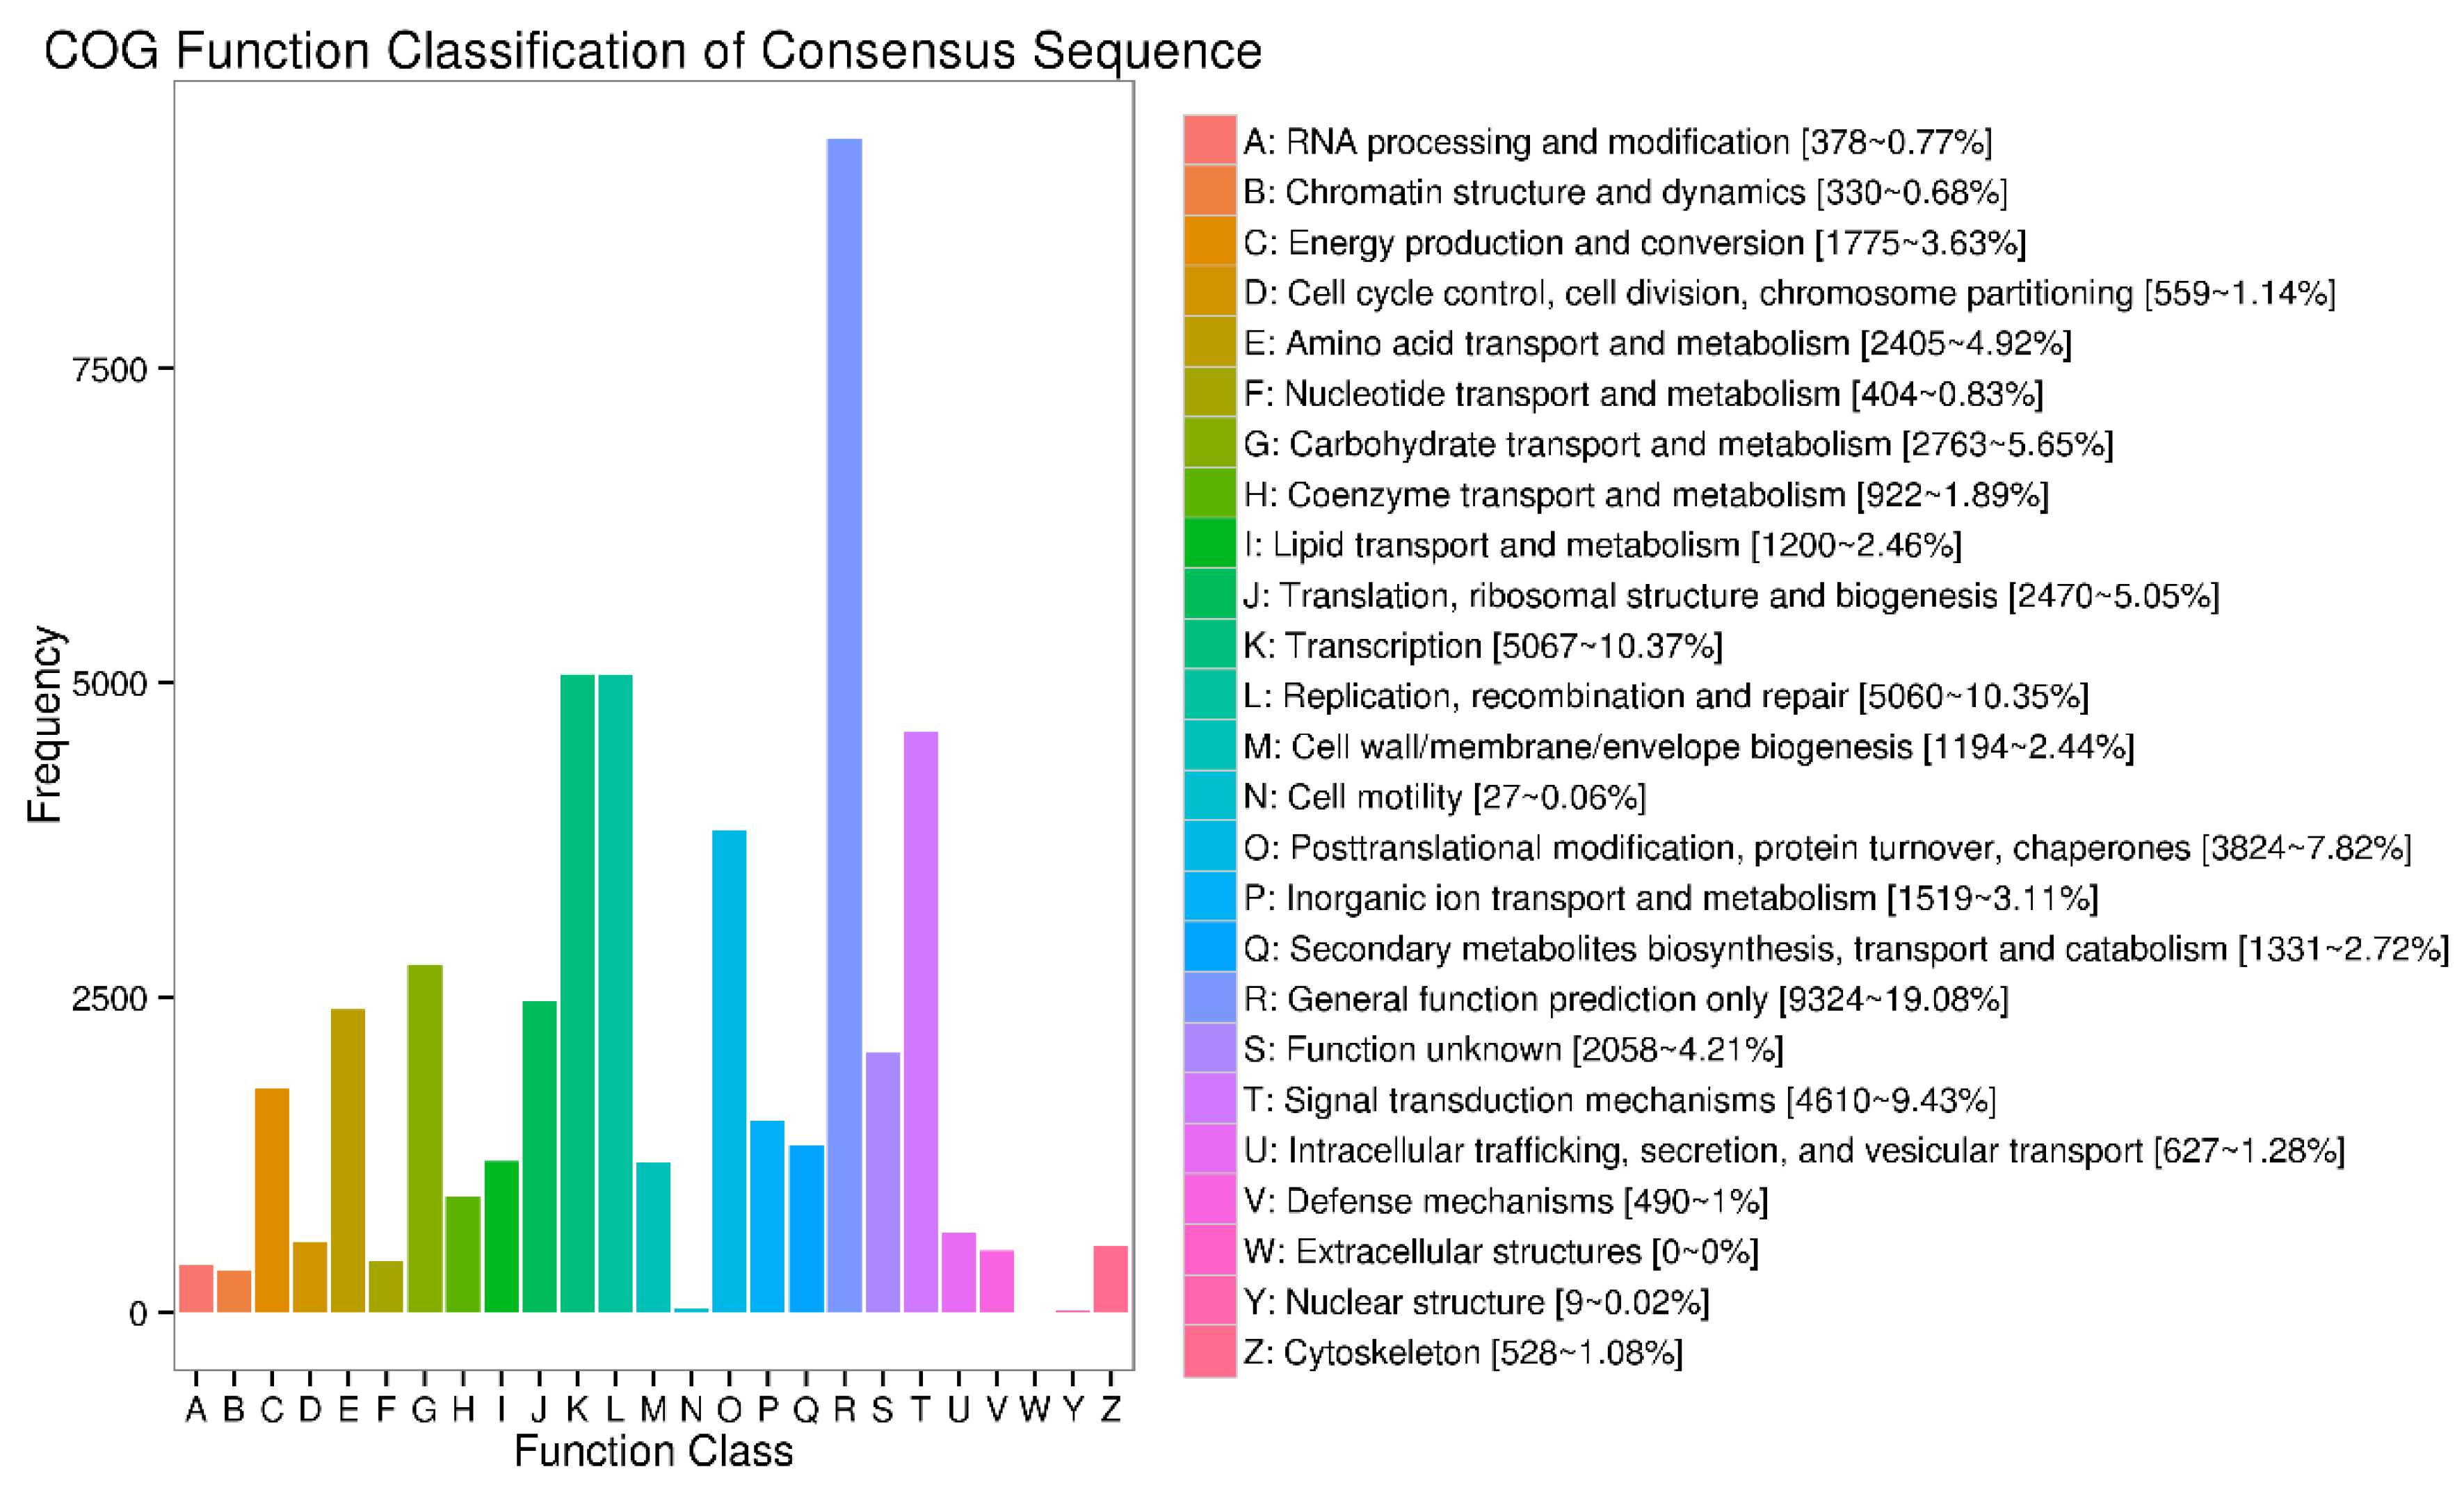
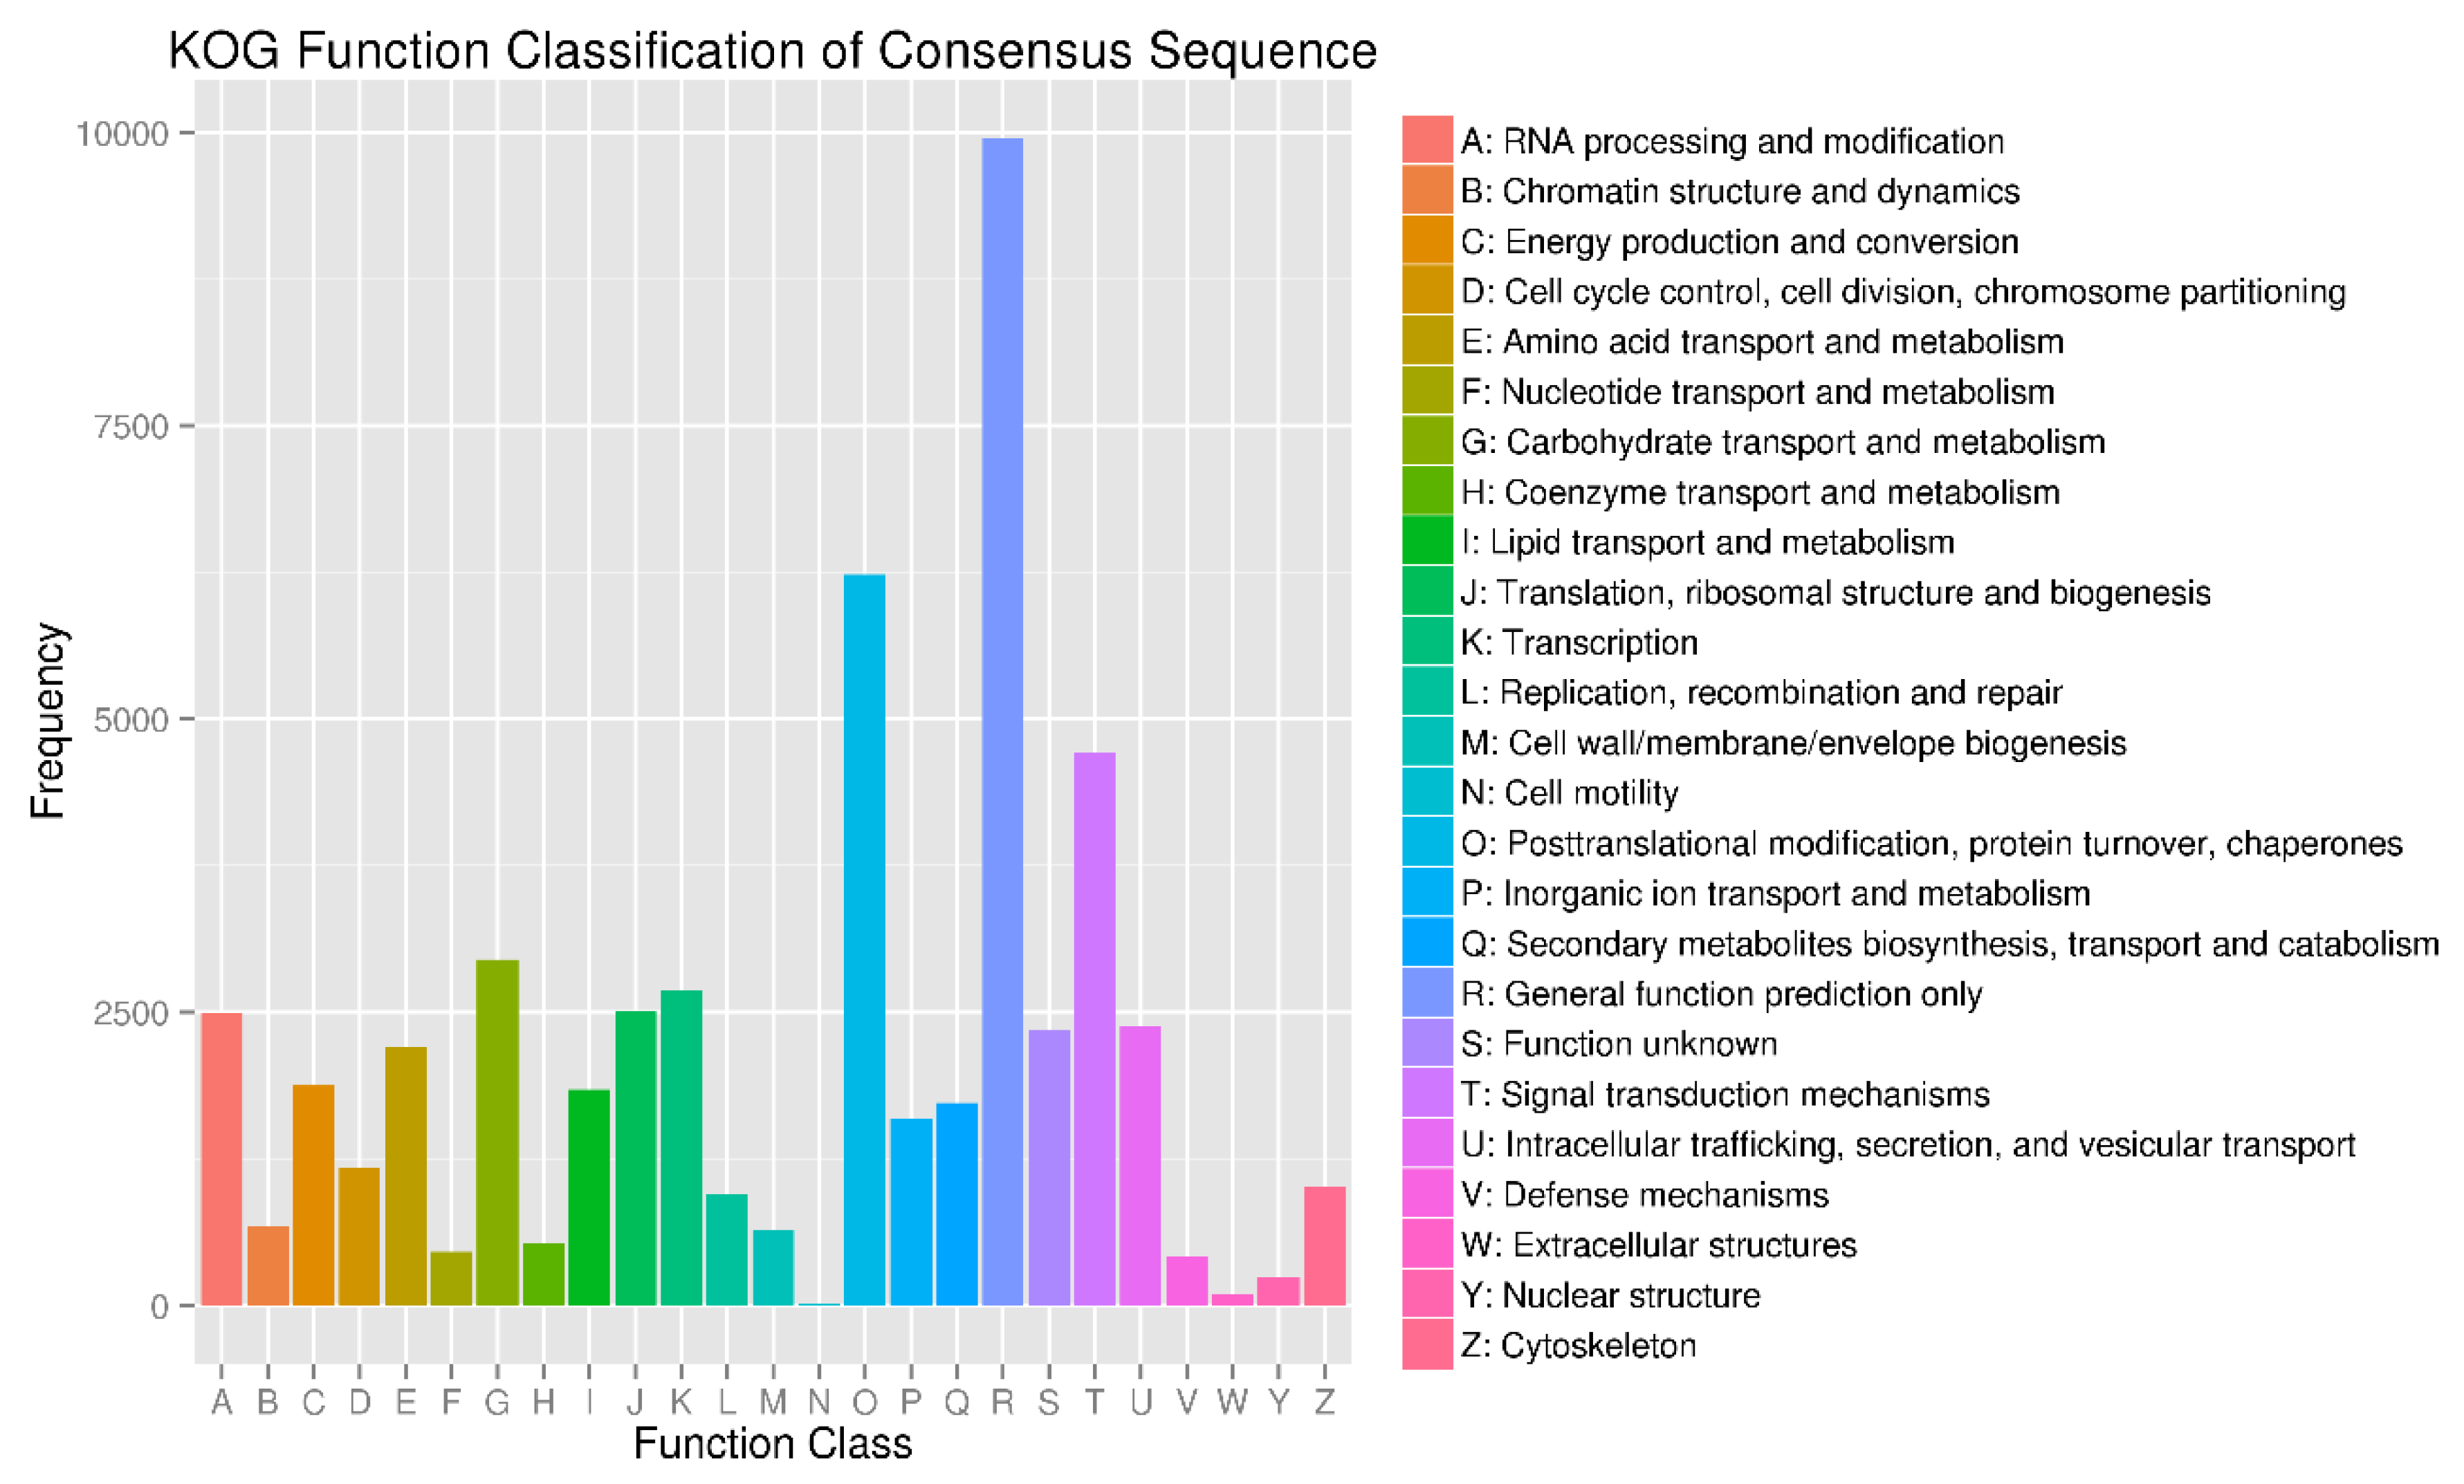
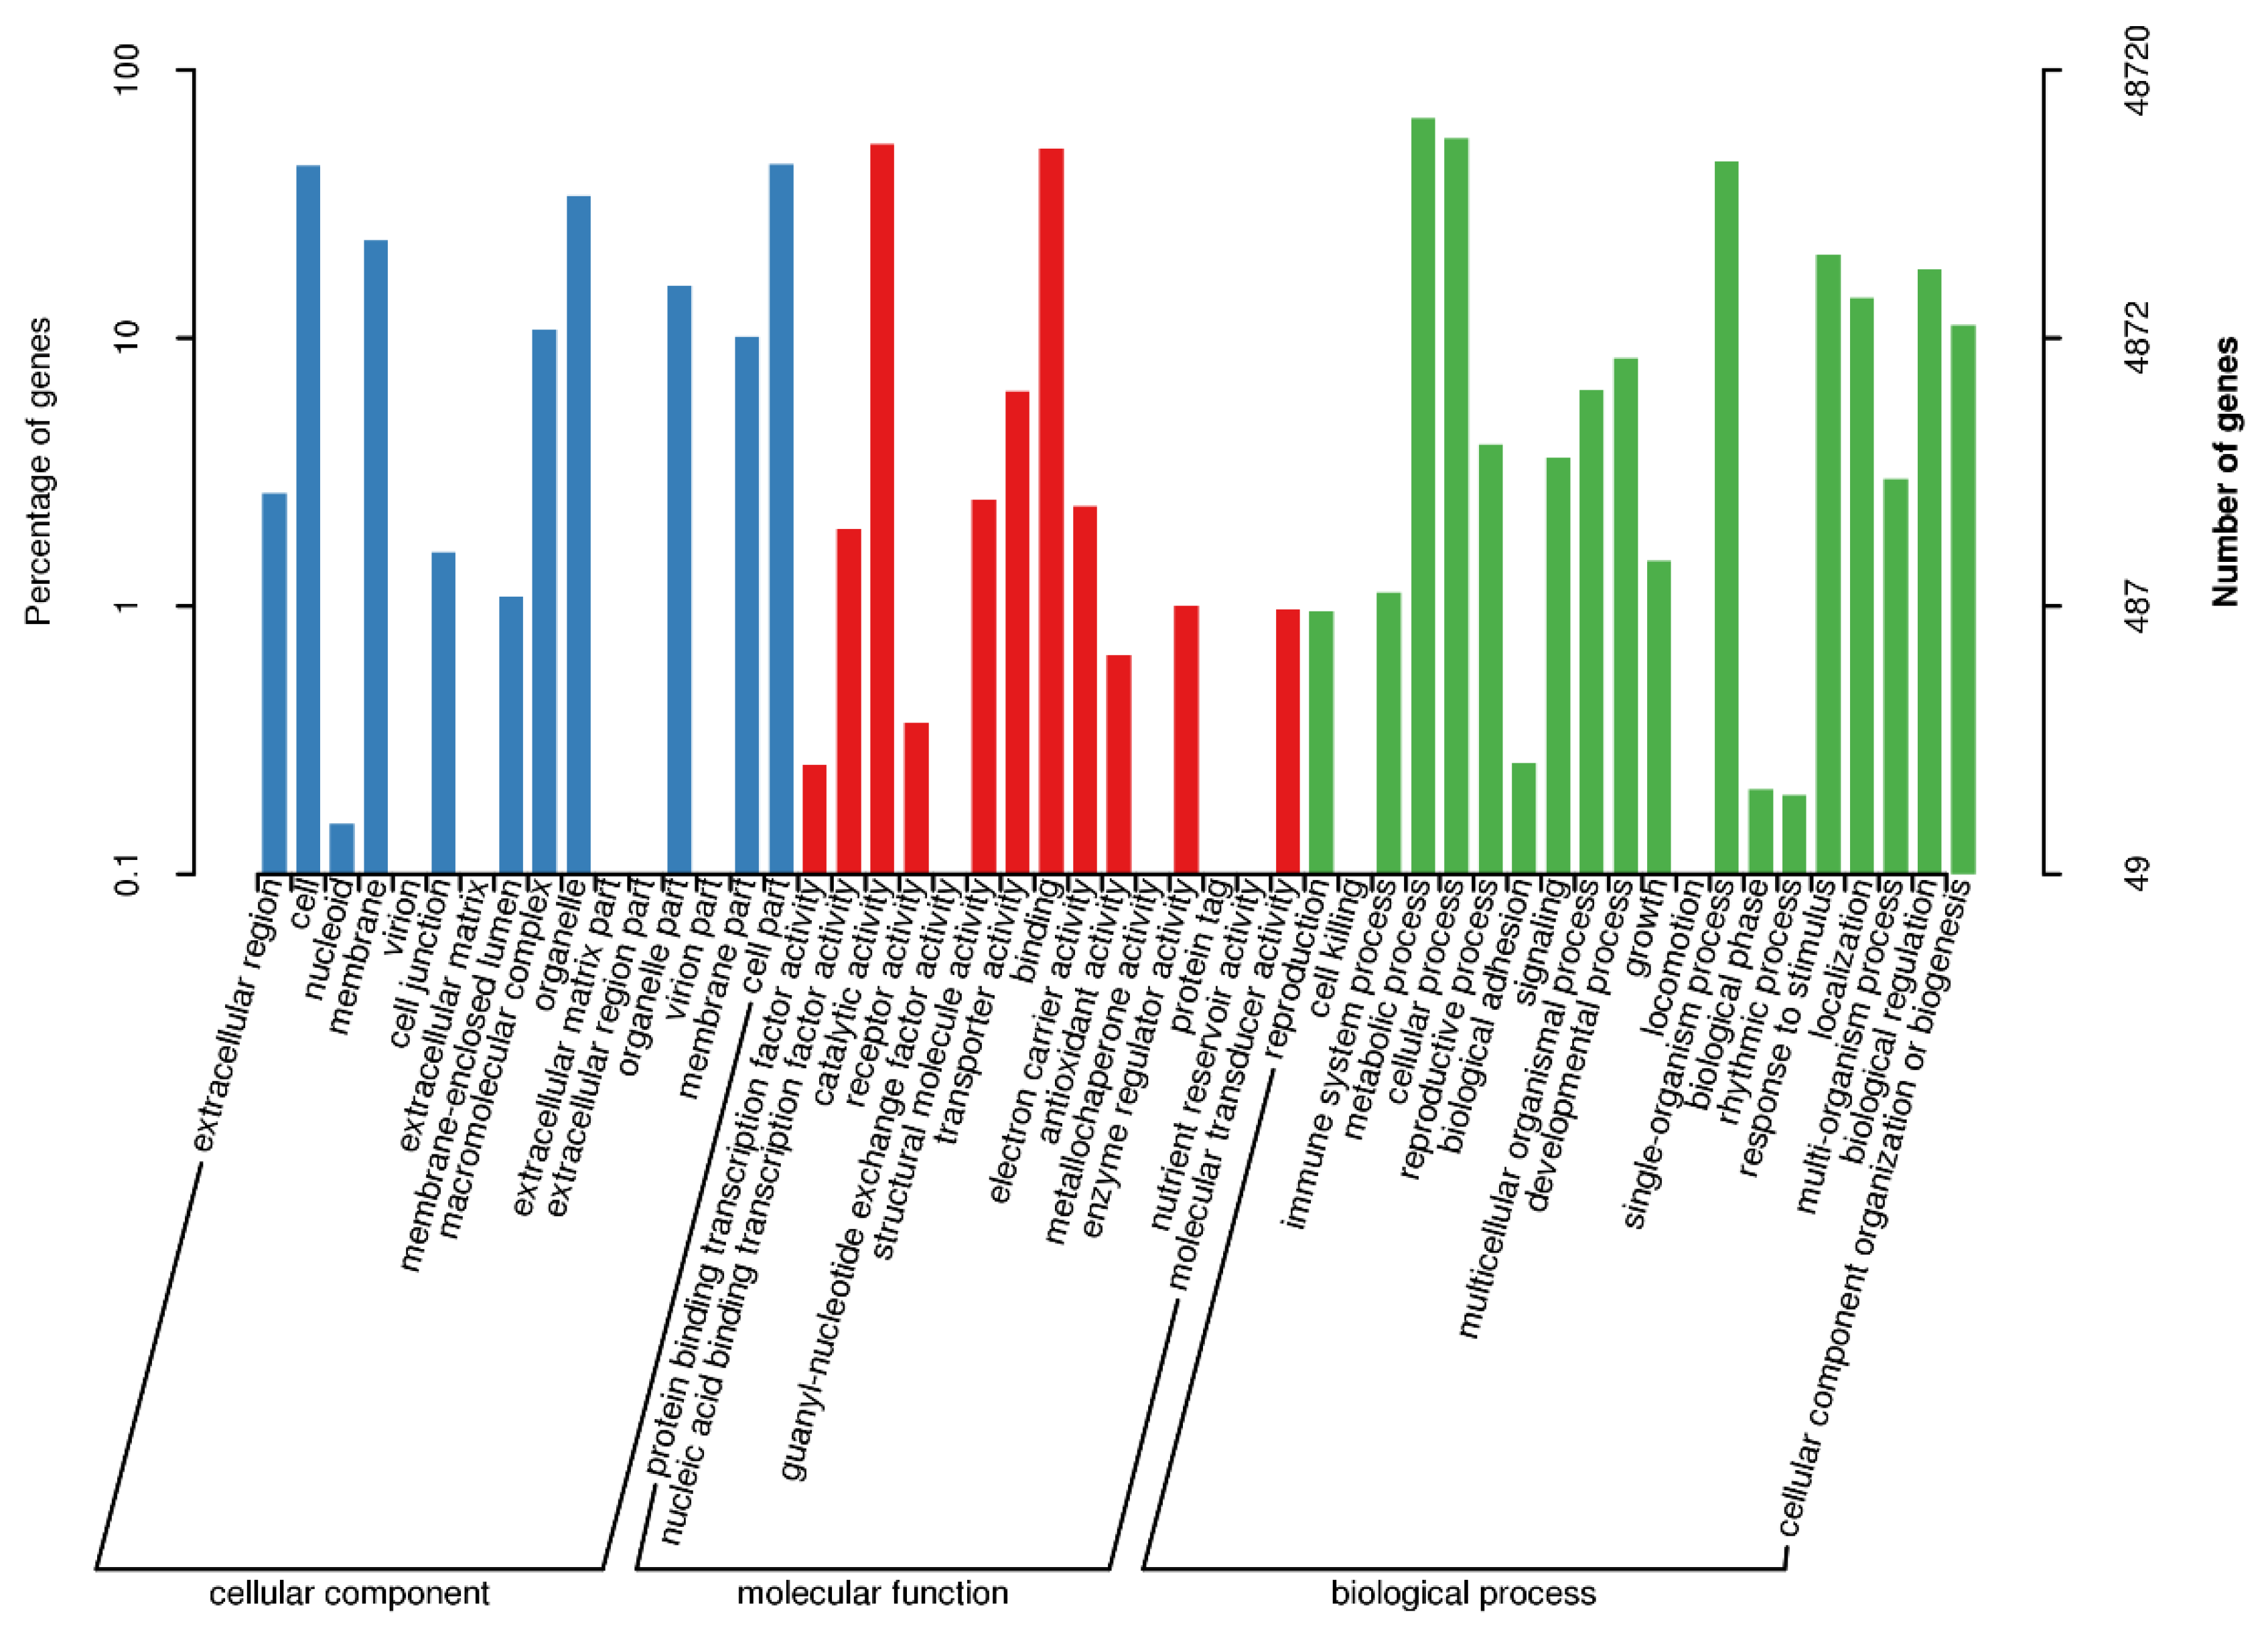
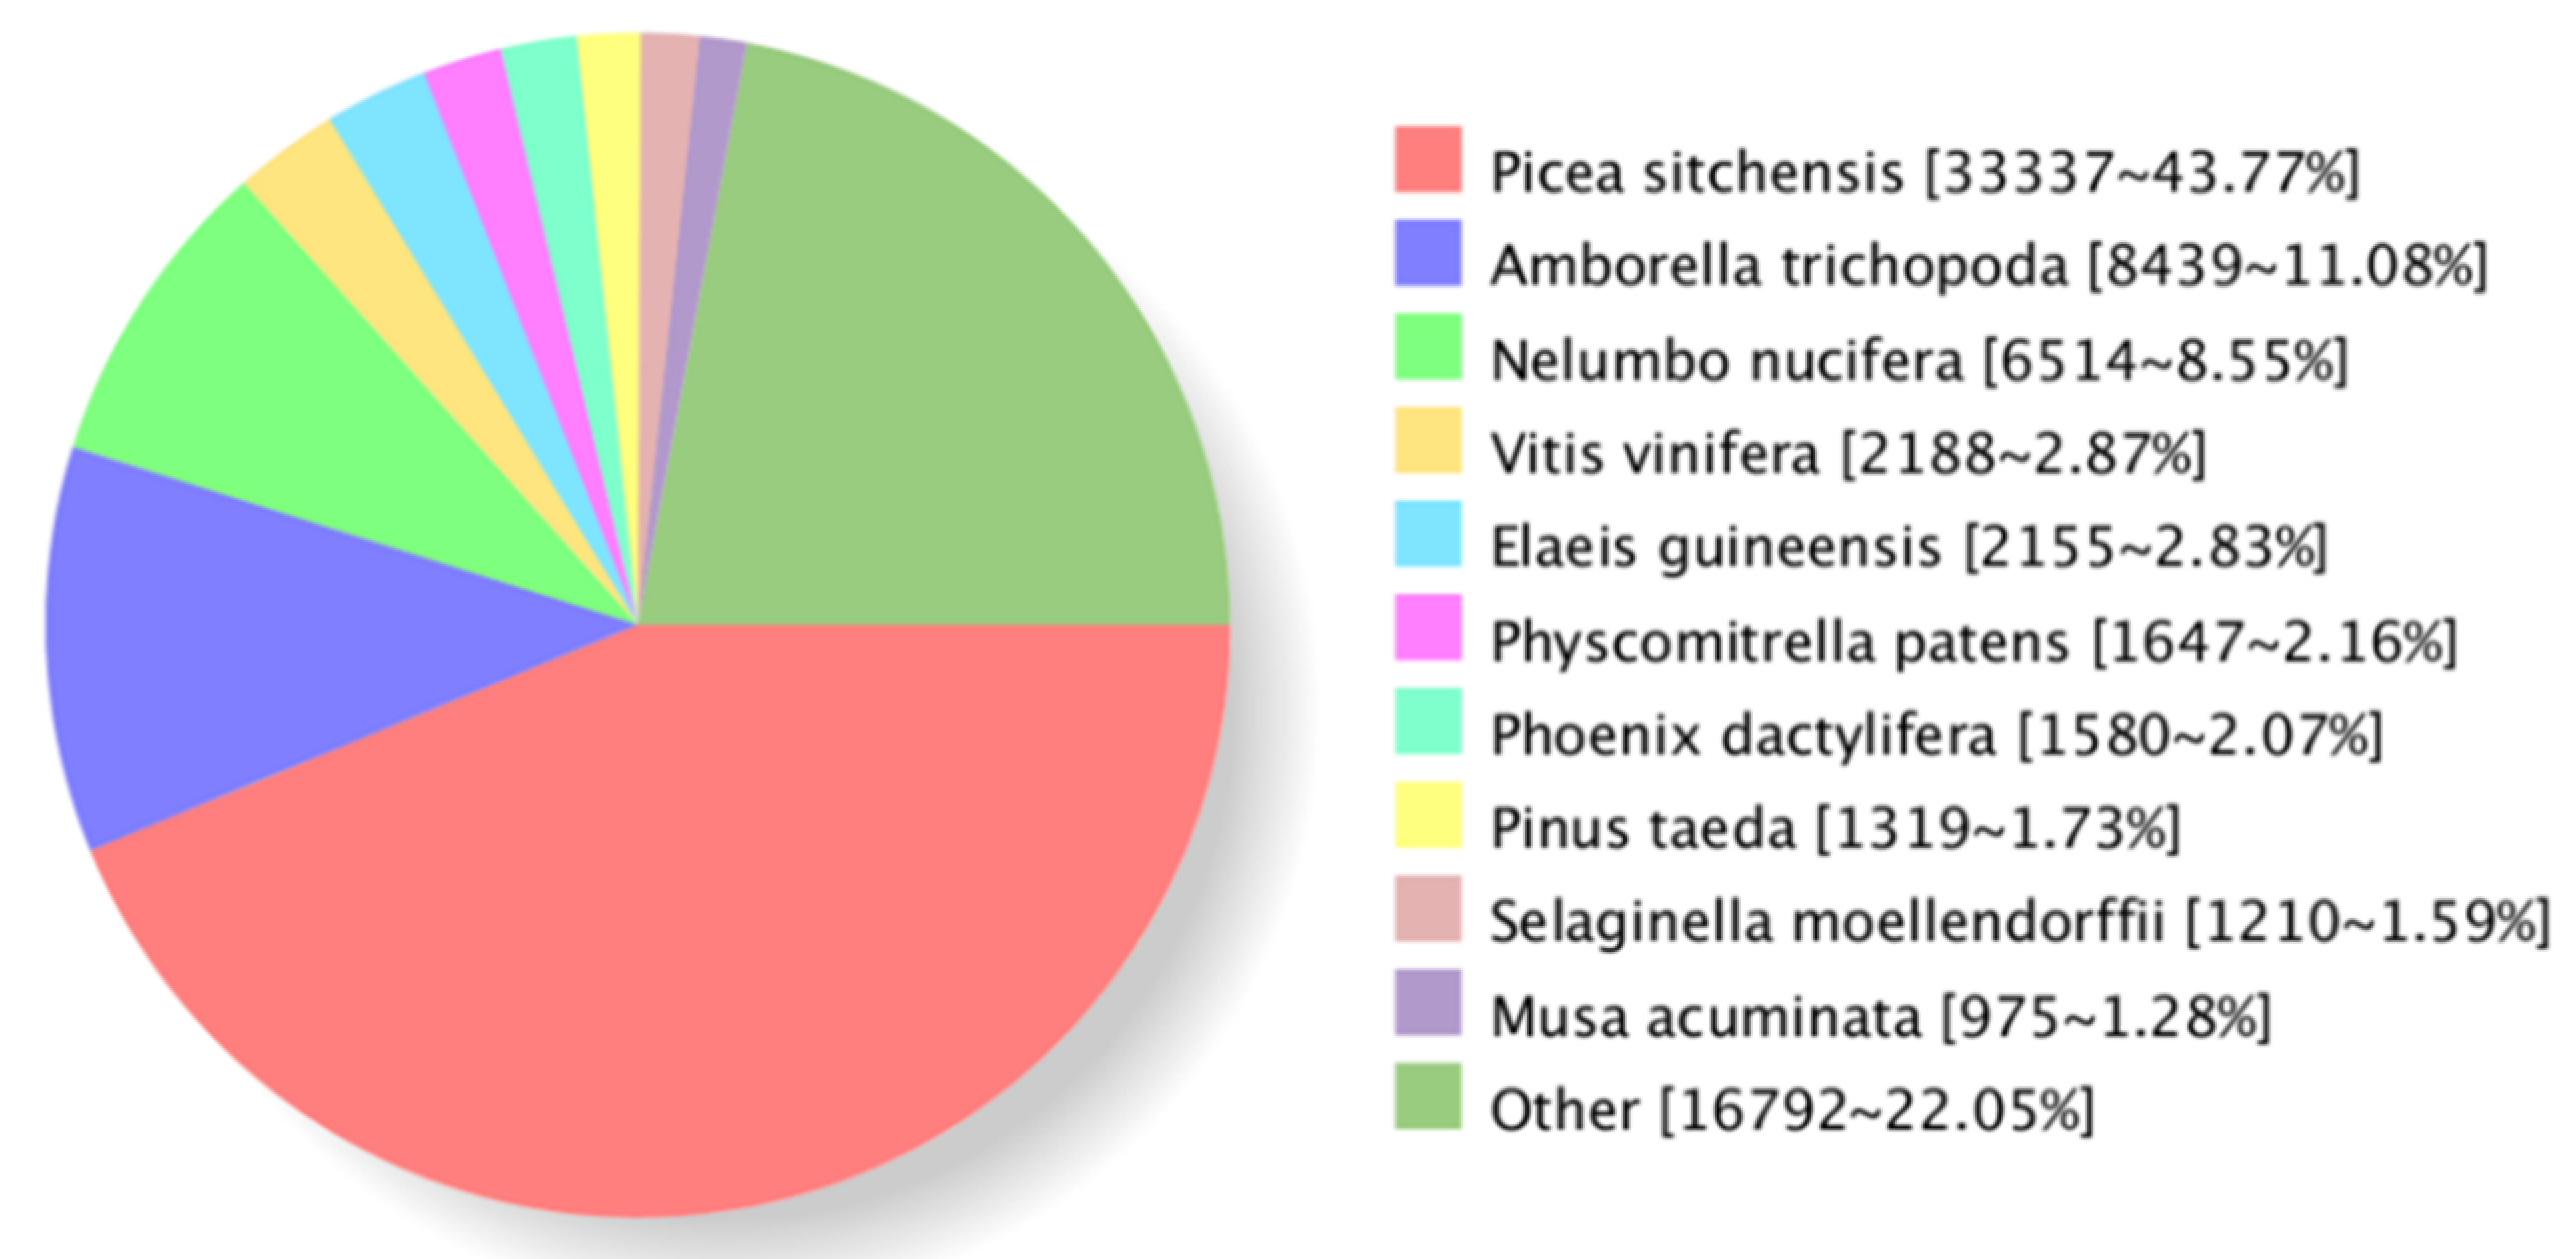
3.2. Functional Annotation of the Transcriptome

Annotating the high-quality isoforms by aligning the full-length transcriptome to the NCBI non-redundant (NR) protein database resulted in 76,173 out of 80,339 isoforms (94.81%) being homologous to known proteins in different species, including gymnosperm (~45.5%, Picea sitchensis, Pinus taeda), angiosperm (~28.68%, Amborella trichopoda, Nelumbo nucifera, Vitis vinifera, Elaeis guineensis, Phoenix dactylifera, Musa acuminate), bryophytes (~2.16%, Physomitrella patens), pteridophyte (~1.59%, Selaginella moellendorffii), and others (~22.05%) (Figure 2). The high-quality isoforms were also blasted to other public databases, including COG [19], GO [20], KEGG [21], KOG [22], Pfam [23], Swissprot [24], EggNOG [25], and NR databases. The number of annotated genes in each database is listed in Table 1. A total of 76,411 isoforms (95.11%) were blasted to these annotated databases (Appendix B, Figure A5, Figure A6, Figure A7 and Figure A8).

3.3. lncRNA, SSR, CDS, and Alternative Splice Identification

lncRNAs are transcripts longer than 200 nucleotides that are not translated into protein. lncRNAs play an important role in regulating the expression of neighboring protein-coding genes [32]. lncRNAs were predicted by screening the potentially encoded transcripts predicted using CPC, CNCI, CPAT, and hmmscan algorithm against Pfam database. A total of 1937 common non-coding sequences were predicted using these four methods (Figure 3A).
A total of 65,062 intact CDSs were identified by TransDecoder. The length distribution of the amino acids translated using CDS are shown in Figure 3C. The length of the amino acids is predominantly in the range of 0–3000. The number of proteins decrease as the length of the protein increases, ignoring 0–100 and >3000 (Figure 3C).
SSR, also known as a microsatellite, is a DNA tract consisting of short, tandemly repeated nucleotide motifs. In this study, 79,492 transcripts >500 bp were selected for SSR analysis using the microsatellite identification tool (MISA; http://pgrc.ipk-gatersleben.de/misa/) [17]. A total of 22,109 SSRs were identified, including mono-nucleotide, di-nucleotide, tri-nucleotide, tetra-nucleotide, penta-nucleotide, and hexa-nucleotide SSRs (Figure 3B). The number of mono-nucleotide SSRs (75.09%) is the greatest, followed by tri-nucleotide (14.93%) and di-nucleotide SSRs (8.69%). The number of penta-nucleotide SSRs was the lowest (0.08%).
AS is an important biological phenomenon that contributes to the production of different mature transcripts from the same primary RNA sequence [33]. AS is a major source of proteome diversity and thus is highly relevant to biological functions. In this study, we predicted 8916 AS events for the non-redundancy transcripts without reference to genomic information, occupying 11.10% of the total.

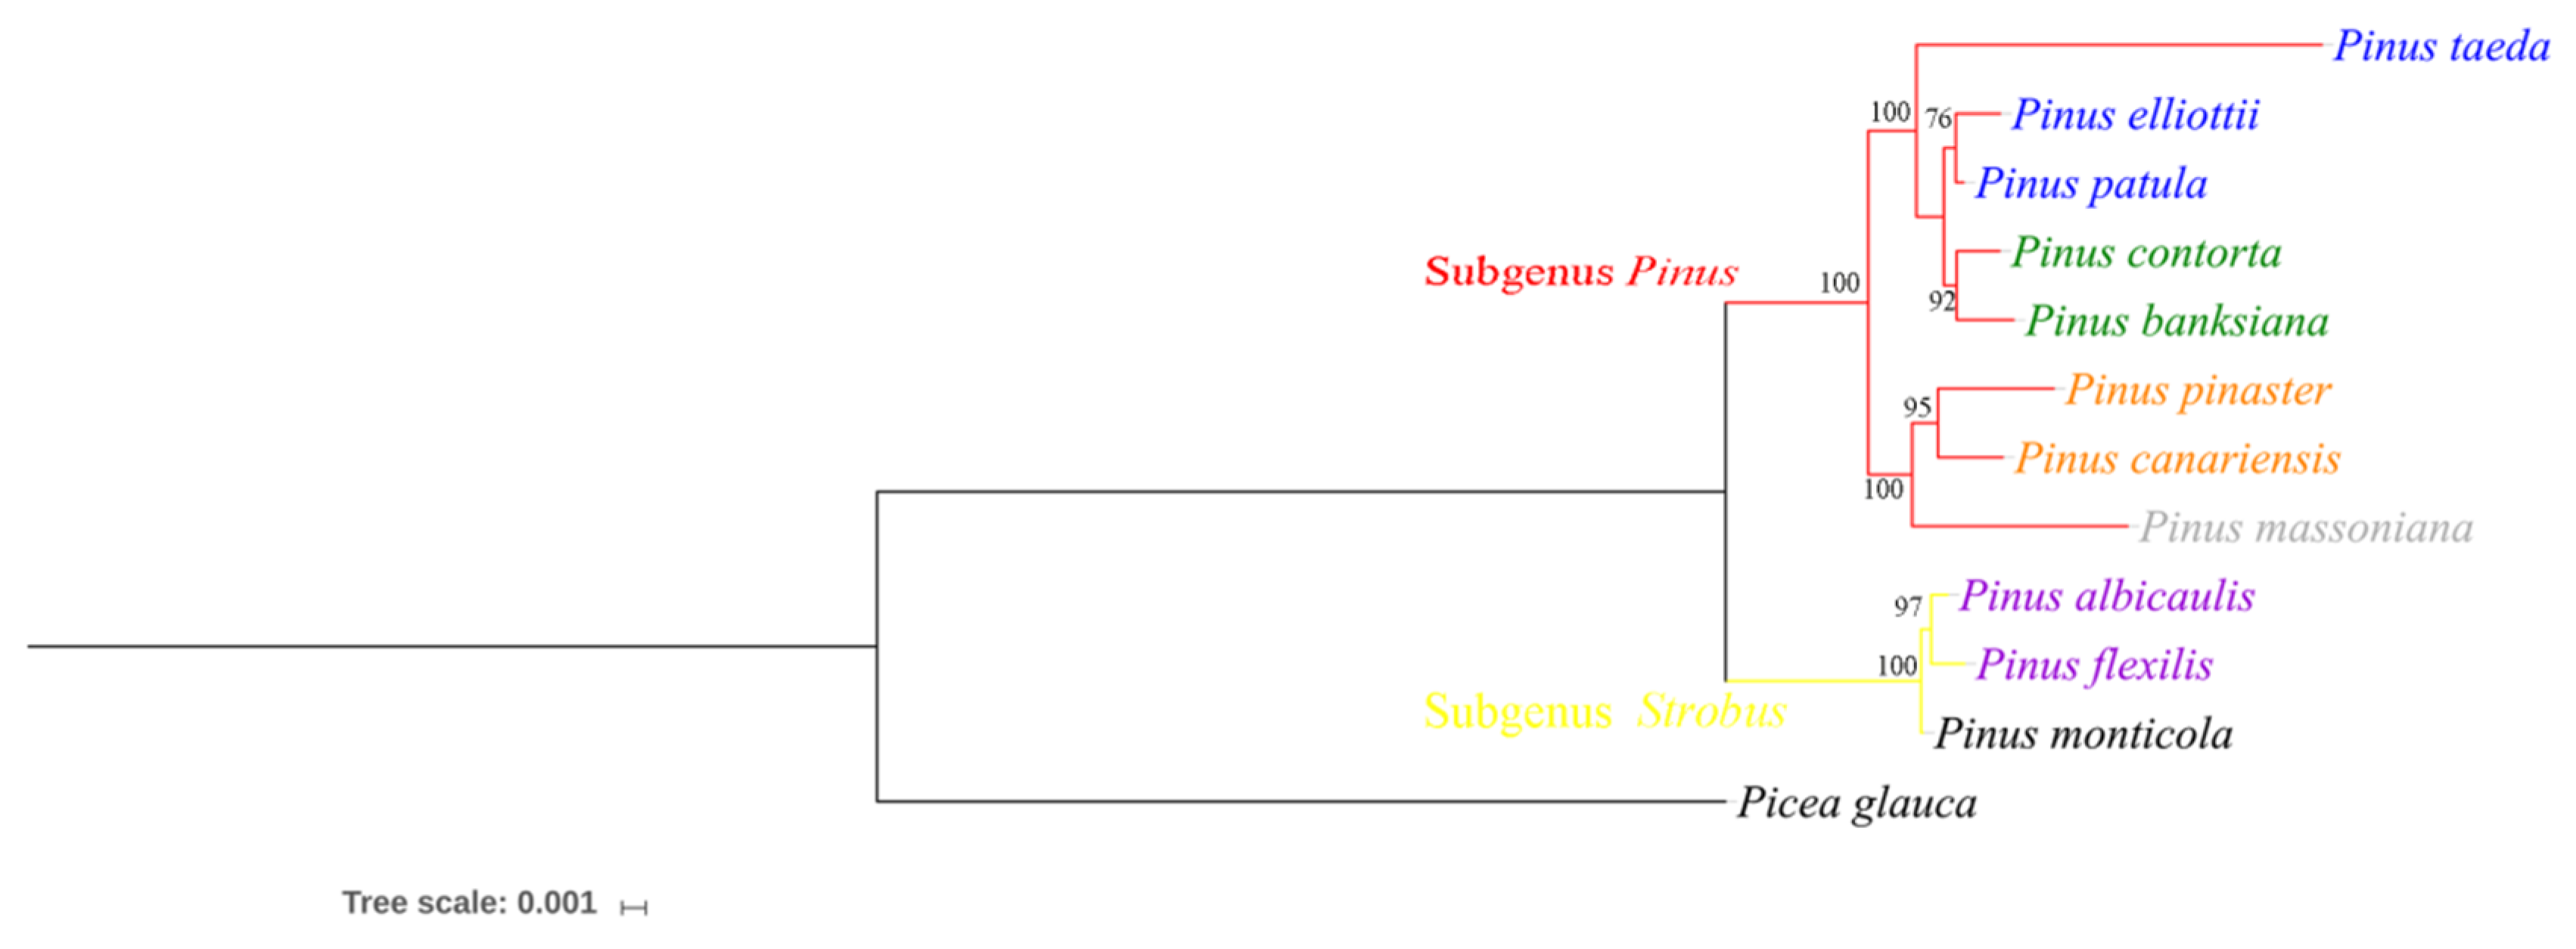
3.4. Phylogenetic Analysis of the Genus Pinus

The unigenes/genes of 10 pines and Picea glauca were obtained from public databases (Table 2). The unigenes/genes number of pines ranges from 13,040 (P. banksiana) to 194,821 (P. massoniana). The average length of the full-length transcripts detected in this study was about 2367 in P. elliottii. In other pines, the minimum mean length of the unigenes/genes was 547 bp (P. massoniana) and the maximum was 1368 bp (P. patula) (Table 2). In pines, the maximum number of orthologous gene pairs was 5907, compared to P. massoniana, and the minimum was 2245, compared to P. flexilis (Table 3). The orthologous gene pairs of the single-copy were identified between P. elliottii and 11 other conifers using OrthoMCL. Twenty-three single-copy orthologous genes were shared in all conifer species.
The 23 orthologous gene groups were used to analyze the phylogenetic relationships of 11 pines, using Picea glauca as the outgroup. Based on the multiple alignment results of 23 orthologous gene groups, a phylogenetic tree was drawn using the neighbor-joining method (Figure 4). Each node is supported by greater than 90% bootstrap values, except for one node with 76% bootstrap values. In total, 11 pine species were divided into two clades. Clade I includes two subclades: subclade I contains P. banksiana, P. elliottii, P. contorta, P. patula, and P. taeda; subclade II contains P. massoniana P. canariensis, and P. pinaster. Clade II includes P. flexilis, P. monticola, and P. albicaulis. Consistent with the previous study [34], the species grouped in clade I are in the subgenus Pinus, and subclades I and II correspond to the Trifoliae and Pinus sections, respectively. The species grouped in clade II are in the Quinquefoliae section of the subgenus Strobus. However, contrary to the previous classification, the Pinus taeda belonging to subsection Australes is separate from the pines in subsection Australes (P. elliottii, P. patula) and Contortae (P. banksiana and P. contorta).

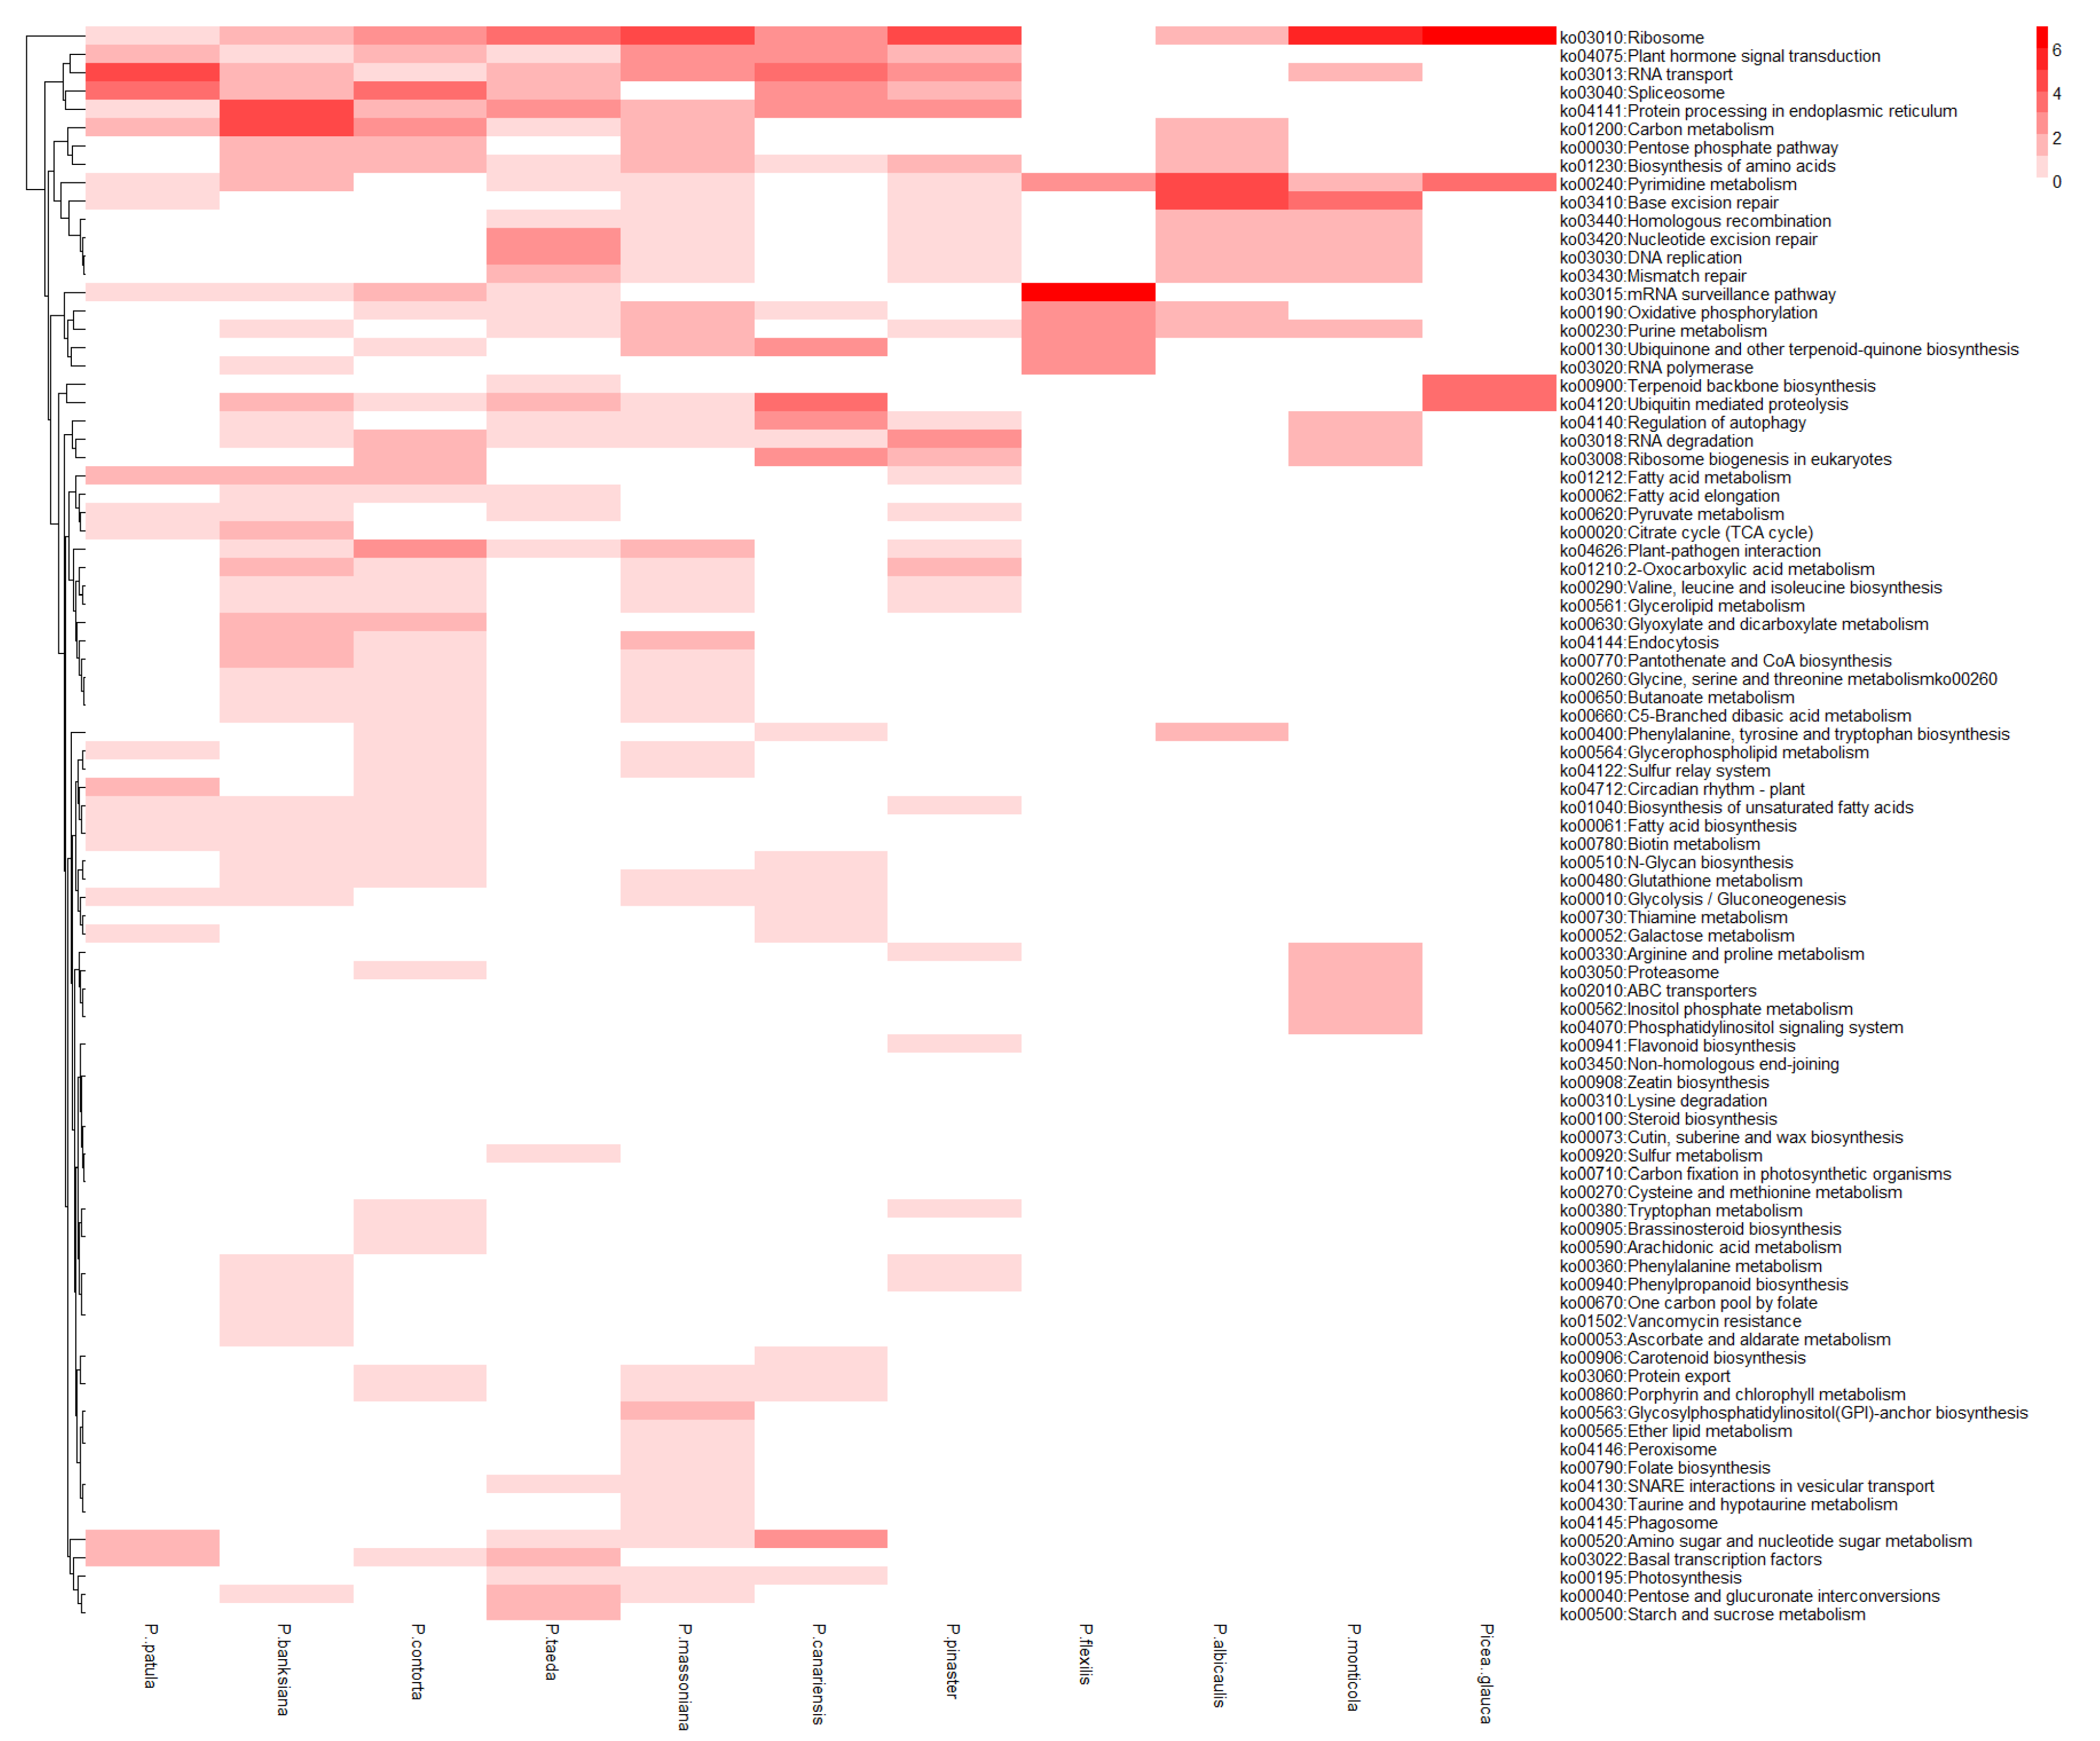
3.5. Functional Genes under a Positive Selection of P. elliottii

The ratio of the number of nonsynonymous substitutions per nonsynonymous site (Ka) to the number of synonymous substitutions per synonymous site (Ks) reflects the evolutionary patterns of the species [35]. Ka/Ks > 1 indicates that the gene has been involved in positive selection during evolution. The pairwise Ks values between P. elliottii and 11 other conifer species performed normal distribution (Figure 5). The results reveal the Ks peak values grouped as the clade and subclade of the phylogenetic tree, showing that the more distant the relationship, the greater the Ks peak values. The minimum and maximum Ks peaks were detected in P. patula and Picea glauca (minimum < 0.01 and maximum = 0.15), respectively (Figure 5, Table 3).
We identified the positive selection genes between P. elliottii and other 11 conifer species. There were 58–108 orthologous genes under positive selection between P. elliottii and pines in subgenus Strobus. There were 187–402 orthologous genes under positive selection between P. elliottii and pines in subgenus Pinus (Table 3). The ratios of positive selection gene numbers to ortholog numbers are the largest between P. taeda and P. elliottii. These positive selection genes were annotated from the public databases. Some positive selection genes were annotated to relate them to various important biological functions (Table 4). The positive selection genes were annotated into 88 KEGG pathways (Figure 6). Sixty-two of them were only annotated on the positive selection genes between P. elliottii and the pines in subgenus Pinus. Based on the other functional annotation, some positive selection genes were identified to be related to important biological processes, including a response to plant hormones, meristem activity, defense against biological and abiotic factors, and response to light (Table 4).

4. Discussion

The lack of reference genome of P. elliottii has impeded the application of molecular biotechnology on genotype selection and breeding and the research of basic genetics for this species and other related species. The published pine species genomes [9,10,11] provide important genetic information for Pinus genetic study. However, interspecific divergences make it difficult to reference these published genomes. Only 1.73% of the annotating the high-quality isoforms in this research (Figure 2) were homologous to Pinus taeda, which showed that the published Pinus taeda genome is not the good choice as P. elliottii reference. Resin tapping transcriptome generated using SGS in adult slash pine was just published [14], which provided hundreds of candidate genes for genetic study for the first time. However, the sequences are not suited for reference at exome level because the sequences using SGS mostly are random, short sequences and not full-length transcriptomes. The mean length of 80,339 high-accuracy transcripts generated using TGS in this research reached 2366.99 bp and the 1,058,173 reads (excluded <300 bp in length) reached 2264 bp, while the average length of unigenes using SGS in the other conifers is from 547.26bp to 1368.09bp (Table 2). The mean length of the first published slash pine resin tapping transcriptome generated using SGS is about several hundreds of bp [14]. There are 15,653 high-confidence transcripts covering >30 Mbp of the genome in P. taeda with an average coding sequence length of 1295 bp [10]. The compared results showed that PacBio SMRT, the newest available technology (TGS), can generate full-length transcriptomes of P. elliottii and could be a reference at exome level [12]. The 80,339 high-accuracy transcripts generated using TGS can be obtained in the NCBI (See Data Availability Statement), which should be very useful to the scientific community.
The plant tissues sampled for RNA preparation should cover different organs and different stages to generate enough expressed sequences as the candidates of reference-level transcriptomes. In this study, the samples for RNA preparation covered different organs with different physiological states and different individuals with the growth variation to the maximum, which increased the quantity of transcripts and cover stage expression transcripts’ forms. Here, the SGS technology with high throughput and accuracy advantages were used to adjust the low-quality full-length transcripts considering the disadvantages of TGS with a lower throughput and higher error rate. The redundant ROIs of high quality and adjusted Iso-Seq FL transcripts were removed using Cd-hit (identity > 0.99) [15]. Secondly, the SGS technology generated massive clean data (high-quality reads). The clean reads for the 11 individuals were from 31,881,645 to 37,954,177 with an average length of 299.2 bp. Then the reads were mapped to the adjusted, high quality and full-length TGS transcripts. Here, the TGS transcripts were the first as the exome reference of P. elliottii.
The results of differential gene expression analysis between the 11 open pollinated slash pine individuals gave thousands of upregulated and downregulated transcripts (p < 0.01, |log2(FC)| > 1). Figure A1 shows that 5961 upregulated and 7791 downregulated genes between S05 and S11 with the same age in the same field plot were found. Because the two individuals were open pollinated individuals with great genetic and environmental differences, it is difficult to find the relationship between the differentially expressed genes (DEG) and the different traits such as DBH, tree height, density and so on described in traditional breeding [3]. That is the defect to this point in this experiment, while the main aim of the TGS transcripts development was to serve our breeding in the field in the genomic selection using GWAS strategy [36,37]. More than two hundred individuals have been sequenced using SGS technology, and the target genes and trees could be selected using association analysis between phenotypic traits and DEG based on more samples. The differential gene expression analysis between the 11 individuals provided a good basis for the next research. The second-generation sequencing of the 11 individuals also enabled the development of single-nucleotide polymorphisms (SNPs) and SSR markers used in the genomic selection.
The third-generation sequencing enabled full-length transcripts of CDS, SSR, lncRNAs, and AS forms to be provided. The CDS, SSRs, and other sequences are good resources for marker-assisted selection, genomic selection, or genome-wide association selection in P. elliottii molecular breeding [36,37]. What is more, full-length, well-annotated, and high-accuracy transcriptomes of P. elliottii were good resources for research of the gene family and cloning of intact CDS sequences. We identified TPS-d-like sequences in P. elliottii full-length transcriptome using a blastp search with previously characterized conifer as query sequences. We are trying to clone the TPS-d family and have successfully obtained three intact CDS sequences based on the identified full-length transcripts, which showed that the full-length transcripts can provide a good database for gene family studies on important growth traits or metabolic processes, which would provide intact sequences, thus avoiding technical complexities.
Full-length transcripts would provide abundant nuclear genetic data for the study of pine evolution. Based on the sequenced data of P. elliottii, phylogenetical analyses comparing the unigenes of 11 pinus species were firstly provided, which showed that P. elliottii and P.patula belong to subsection Australes of section Trifolia, and the new position in the classification appeared for P. tadea. The genus Pinus is divided into subgenera Strobus (Haploxylon, soft pines) and Pinus (Diploxylon, hard pines) [38]. In this study, three pines are from subgenus Strobus and eight pines are from subgenus Pinus. The phylogenetic trees estimated by 23 orthologous genes successfully divided two subgenus pines into two branches, which was supported by the above 100% bootstrap values. Gernandt et al. [34] proposed a pines classification system combining the evidence from chloroplast DNA, nuclear ribosomal DNA, and morphology. Three pines from subgenus Strobus are in the subsection Strobus of section Quinquefoliae. Eight pines from subgenus Pinus originated from two monophyletic groups. In one group, P. massoniana is in the subsection Pinus, and P. canariensis and P. pinaster are in the subsection Pinaster of section Pinus, which is congruent with phylogenies based on 23 orthologous genes. In another group, P.banksina and P.contorta belong to the subsection Contortae, while P.taeda, P. elliottii, and P.patula belong to subsection Australes of section Trifolia. However, in conflict with this classification, the P. taeda outgroup remains with the other four pines based on 23 orthologous genes. This incongruency might be because the functions of the 23 orthologous genes tend to separate the P. taeda from other pines. This incongruency might also be due to the different methods used to obtain gene sequences. In this paper, the genes of P.taeda were obtained from the genome assembly and general feature format of P. taeda (version v1.01). More analysis should be performed using the new genome version. Unfortunately, the new version was not available in the open database.
Positive selection is the main driving force for increasing dominant traits in evolution. In this study, 2245–5907 orthologous gene pairs were identified between P. elliottii and 10 pines. 58–402 genes were under positive selection. These results are very helpful for tree geneticists to find the candidate genes contributing to the superior performance of P. elliottii. The natural range of P. elliottii is small. However, P. elliottii has been widely cultivated in the sub-tropical regions of southern Africa, eastern Australia, and southeast Asia, and both saplings and mature forests of P. elliottii are rarely infected by fungi and bacteria. Our results revealed that some important functional genes were under positive selection to help P. elliottii adapt to various environments. Few genes’ responses to biological and abiotic factors were under positive selection, including responses to fungus, responses to bacteria, responses to salt stress, responses to cold, and responses to water deprivation. Another superior performance of the slash pine is its high-speed, early growth. We found genes annotated to plant phytohormones, meristem activity, and responses to light are under positive selection, which might contribute to the slash pine’s high-speed and early growth. There were fewer positive selection genes between P. elliottii and subgenus Strobus than between P. elliottii and subgenus Pinus. Partial positive selection genes were annotated into 88 KEGG pathways (Figure 6). Sixty-two KEGG pathways were only annotated by the positive selection genes between P. elliottii and pines in subgenus Pinus. This result indicates that there are more metabolic pathways under positive selection between related species. This might be because the distant species have more synonymous substitutions. Thus, the Ks value is greater, and Ka/Ks is smaller.

5. Conclusions

This study is the first to reveal the full-length and well-annotated transcripts of P. elliottii via PacBio long-read sequencing technology, which could provide reference for short transcriptome sequences in the research of gene family, phylogenetics, and genetic improvement for the non-reference genome species. The lack of a sequencing with PacBio SMRT was supplemented by applying second-generation sequencing (SGS) technologies. Based on these high-quality isoforms, 65,062 intact CDSs, 8916 AS events, 1937 lncRNA, and 22,109 SSRs were predicted. Based on the sequenced data of P. elliottii, phylogenetical analyses comparing the unigenes of 11 Pinus species were provided. Some pairwise ortholog genes between P. elliottii and other pines were revealed to be under positive selection and are annotated to some important biological processes. The high-accuracy transcripts generated using TGS and clean reads (FASTQ data) using SGS can be obtained in the NCBI, which should be very useful to the scientific community.

Author Contributions

Conceptualization, Q.L. and S.D.; methodology, S.D. and X.D.; formal analysis, S.D. and X.D.; investigation, Q.L., X.D., and S.D. and J.J.; resources, Q.L. and J.J.; data curation, Q.L., X.D., and S.D.; writing—original draft preparation, S.D. and X.D.; writing—review and editing, Q.L.; supervision, Q.L.; project administration, Q.L.; funding acquisition, Q.L.

Funding

This research was funded by the Zhejiang Science and Technology Major Program on Agricultural New Variety Breeding and Forestry Industry Research Special Funds for Public Welfare Projects of China, grant numbers: 2016C02056-4, CAFYBB2017ZA001-2.

Acknowledgments

We would like to thank all the editors for their review and edits, which improved the manuscript. Thanks also go to the Chang Le Forestry farm in Yuhang district of Hangzhou for providing the experimental materials.

Conflicts of Interest

The authors declare no conflicts of interest.

Abbreviations

SMRTSequencing by single-molecule, real-time
TGSThird-generation sequencing
SGSSecond-generation sequencing
CSCoding sequences
SSRSimple sequence repeat
ASAlternative splicing
ROIsReads of insert
FLNCFull-length non-chimeric
IECIterative clustering for error correction
COGClusters of Orthologous Groups
GOGene Ontology
KEGGKyoto Encyclopedia of Genes and Genomes
KOGeuKaryotic Ortholog Groups
PfamProtein family
NRNCBI nonredundant protein sequences
EggNOGEvolutionary genealogy of genes: Non-supervised Orthologous Groups

Appendix A

Figure A1. The volcanic map of DEGs between the two individuals numbered S05 and S11. Each point in the volcanic map represents a transcript. The abscissa stands for the logarithm of the multiple change of the difference in expression of a given transcript between the two samples. The ordinate represents the negative log of statistically significant changes in transcript expression. The larger the ordinate value is, the more significant the differential expression is, and the more reliable the screened differential expression transcript is. The green dots represent down-regulated DEGs, the red dots represent up-regulated DEGs, and the black dots represent non-differentially expressed transcripts.
Forests 10 00942 g0a1
Figure A2. COG function classification of the annotated DEGs between the two individuals numbered S05 and S11. The horizontal axis represents the COG categories and horizontal axis represents the gene number.
Forests 10 00942 g0a2
Figure A3. EggNOG function classification of the annotated DEGs between the two individuals numbered S05 and S11. The horizontal axis represents the EggNOG categories and horizontal axis represents the gene number.
Forests 10 00942 g0a3
Figure A4. KOG function classification of the annotated DEGs between the two individuals numbered S05 and S11. The horizontal axis represents the KOG categories and horizontal axis represents the gene number.
Forests 10 00942 g0a4

Appendix B

Figure A5. COG function classification of the annotated high-quality transcripts obtained by TGS. The horizontal axis represents the COG categories and horizontal axis represents the gene number.
Forests 10 00942 g0a5
Figure A6. EggNOG function classification of the annotated high-quality transcripts obtained by TGS. The horizontal axis represents the EggNOG categories and horizontal axis represents the gene number.
Forests 10 00942 g0a6
Figure A7. KOG function classification of the annotated high-quality transcripts obtained by TGS. The horizontal axis represents the KOG categories and horizontal axis represents the gene number.
Forests 10 00942 g0a7
Figure A8. GO enrichment analysis of the annotated high-quality transcripts obtained by TGS. The horizontal axis represents three categories in GO, cellular component, molecular function, and biological processes. The vertical axis shows the percentage of genes that has been annotated.
Forests 10 00942 g0a8

References

  1. Clark, A., III; Daniels, R.F. In Wood quality of slash pine and its effect on lumber, paper, and other products. In Proceedings of the Slash Pine Symposium, Jekyll Island, GA, USA, 23–25 April 2002. [Google Scholar]
  2. Neale, D.B.; Wheeler, N.C. The Conifers: Genomes, Variation and Evolution; Springer: Berlin/Heidelberg, Germany, 2019; p. 271. [Google Scholar]
  3. Zhang, S.; Jiang, J.; Luan, Q. Index selection for growth and construction wood properties in Pinus elliottii open-pollinated families in southern China. South. For. A J. For. Sci. 2018, 80, 209–216. [Google Scholar]
  4. Birol, I.; Raymond, A.; Jackman, S.D.; Pleasance, S.; Coope, R.; Taylor, G.A.; Yuen, M.M.; Keeling, C.I.; Brand, D.; Vandervalk, B.P.; et al. Assembling the 20 Gb white spruce (Picea glauca) genome from whole-genome shotgun sequencing data. Bioinform. (Oxf. Engl.) 2013, 29, 1492–1497. [Google Scholar] [CrossRef]
  5. Jackman, S.D.; Warren, R.L.; Gibb, E.A.; Vandervalk, B.P.; Mohamadi, H.; Chu, J.; Raymond, A.; Pleasance, S.; Coope, R.; Wildung, M.R.; et al. Organellar Genomes of White Spruce (Picea glauca): Assembly and Annotation. Genome Biol. Evol. 2015, 8, 29–41. [Google Scholar] [CrossRef]
  6. Nystedt, B.; Street, N.R.; Wetterbom, A.; Zuccolo, A.; Lin, Y.C.; Scofield, D.G.; Vezzi, F.; Delhomme, N.; Giacomello, S.; Alexeyenko, A.; et al. The Norway spruce genome sequence and conifer genome evolution. Nature 2013, 497, 579–584. [Google Scholar] [CrossRef] [Green Version]
  7. Neale, D.B.; McGuire, P.E.; Wheeler, N.C.; Stevens, K.A.; Crepeau, M.W.; Cardeno, C.; Zimin, A.V.; Puiu, D.; Pertea, G.M.; Sezen, U.U.; et al. The Douglas-Fir Genome Sequence Reveals Specialization of the Photosynthetic Apparatus in Pinaceae. G3 (BethesdaMd.) 2017, 7, 3157–3167. [Google Scholar] [CrossRef] [Green Version]
  8. Leitch, I.; Johnston, E.; Pellicer, J.; Hidalgo, O.; Bennett, M. Plant DNA C-values database. Available online: https://cvalues.science.kew.org/ (accessed on 7 April 2019).
  9. Neale, D.B.; Wegrzyn, J.L.; Stevens, K.A.; Zimin, A.V.; Puiu, D.; Crepeau, M.W.; Cardeno, C.; Koriabine, M.; Holtz-Morris, A.E.; Liechty, J.D.; et al. Decoding the massive genome of loblolly pine using haploid DNA and novel assembly strategies. Genome Biol. 2014, 15, R59. [Google Scholar] [CrossRef]
  10. Zimin, A.; Stevens, K.A.; Crepeau, M.W.; Holtz-Morris, A.; Koriabine, M.; Marcais, G.; Puiu, D.; Roberts, M.; Wegrzyn, J.L.; de Jong, P.J.; et al. Sequencing and assembly of the 22-gb loblolly pine genome. Genetics 2014, 196, 875–890. [Google Scholar] [CrossRef]
  11. Stevens, K.A.; Wegrzyn, J.L.; Zimin, A.; Puiu, D.; Crepeau, M.; Cardeno, C.; Paul, R.; Gonzalez-Ibeas, D.; Koriabine, M.; Holtz-Morris, A.E.; et al. Sequence of the Sugar Pine Megagenome. Genetics 2016, 204, 1613–1626. [Google Scholar] [CrossRef]
  12. Rhoads, A.; Au, K.F. PacBio sequencing and its applications. Genom. Proteom. Bioinform. 2015, 13, 278–289. [Google Scholar] [CrossRef]
  13. Acosta, J.J.; Fahrenkrog, A.M.; Neves, L.G.; Resende, M.F.; Dervinis, C.; Davis, J.M.; Holliday, J.A.; Kirst, M. Exome Resequencing Reveals Evolutionary History, Genomic Diversity, and Targets of Selection in the Conifers Pinus taeda and Pinus elliottii. Genome Biol. Evol. 2019, 11, 508–520. [Google Scholar] [CrossRef]
  14. De Oliveira Junkes, C.F.; de Araújo Júnior, A.T.; de Lima, J.C.; de Costa, F.; Füller, T.; de Almeida, M.R.; Neis, F.A.; da Silva Rodrigues-Corrêa, K.C.; Fett, J.P.; Fett-Neto, A.G. Resin tapping transcriptome in adult slash pine (Pinus elliottii var. elliottii). Ind. Crop. Prod. 2019, 139, 111545. [Google Scholar] [CrossRef]
  15. Li, W.; Godzik, A. Cd-hit: A fast program for clustering and comparing large sets of protein or nucleotide sequences. Bioinform. (Oxf. Engl.) 2006, 22, 1658–1659. [Google Scholar] [CrossRef]
  16. Chen, S.; Yang, P.; Jiang, F.; Wei, Y.; Ma, Z.; Kang, L. De novo analysis of transcriptome dynamics in the migratory locust during the development of phase traits. PloS one. 2010, 5, e15633. [Google Scholar] [CrossRef]
  17. Beier, S.; Thiel, T.; Munch, T.; Scholz, U.; Mascher, M. MISA-web: A web server for microsatellite prediction. Bioinform. (Oxf. Engl.) 2017, 33, 2583–2585. [Google Scholar] [CrossRef]
  18. Liu, X.; Mei, W.; Soltis, P.S.; Soltis, D.E.; Barbazuk, W.B. Detecting alternatively spliced transcript isoforms from single-molecule long-read sequences without a reference genome. Mol. Ecol. Resour. 2017, 17, 1243–1256. [Google Scholar] [CrossRef]
  19. Tatusov, R.L.; Galperin, M.Y.; Natale, D.A.; Koonin, E.V. The COG database: A tool for genome-scale analysis of protein functions and evolution. Nucleic Acids Res. 2000, 28, 33–36. [Google Scholar] [CrossRef]
  20. Ashburner, M.; Ball, C.A.; Blake, J.A.; Botstein, D.; Butler, H.; Cherry, J.M.; Davis, A.P.; Dolinski, K.; Dwight, S.S.; Eppig, J.T.; et al. Gene ontology: Tool for the unification of biology. The Gene Ontology Consortium. Nat. Genet. 2000, 25, 25–29. [Google Scholar] [CrossRef]
  21. Kanehisa, M.; Goto, S.; Kawashima, S.; Okuno, Y.; Hattori, M. The KEGG resource for deciphering the genome. Nucleic Acids Res. 2004, 32, D277–D280. [Google Scholar] [CrossRef]
  22. Koonin, E.V.; Fedorova, N.D.; Jackson, J.D.; Jacobs, A.R.; Krylov, D.M.; Makarova, K.S.; Mazumder, R.; Mekhedov, S.L.; Nikolskaya, A.N.; Rao, B.S.; et al. A comprehensive evolutionary classification of proteins encoded in complete eukaryotic genomes. Genome Biol. 2004, 5, R7. [Google Scholar] [CrossRef]
  23. El-Gebali, S.; Mistry, J.; Bateman, A.; Eddy, S.R.; Luciani, A.; Potter, S.C.; Qureshi, M.; Richardson, L.J.; Salazar, G.A.; Smart, A.; et al. The Pfam protein families database in 2019. Nucleic Acids Res. 2019, 47, D427–D432. [Google Scholar] [CrossRef]
  24. Pundir, S.; Martin, M.J.; O’Donovan, C. UniProt Protein Knowledgebase. Methods Mol. Biol. (Clifton N.J.) 2017, 1558, 41–55. [Google Scholar] [Green Version]
  25. Huerta-Cepas, J.; Szklarczyk, D.; Forslund, K.; Cook, H.; Heller, D.; Walter, M.C.; Rattei, T.; Mende, D.R.; Sunagawa, S.; Kuhn, M.; et al. eggNOG 4.5: A hierarchical orthology framework with improved functional annotations for eukaryotic, prokaryotic and viral sequences. Nucleic Acids Res. 2016, 44, D286–D293. [Google Scholar] [CrossRef]
  26. Altschul, S.F.; Madden, T.L.; Schaffer, A.A.; Zhang, J.; Zhang, Z.; Miller, W.; Lipman, D.J. Gapped BLAST and PSI-BLAST: A new generation of protein database search programs. Nucleic Acids Res. 1997, 25, 3389–3402. [Google Scholar] [CrossRef]
  27. Edgar, R.C. MUSCLE: A multiple sequence alignment method with reduced time and space complexity. BMC Bioinform. 2004, 5, 113. [Google Scholar] [CrossRef]
  28. Saitou, N.; Nei, M. The neighbor-joining method: A new method for reconstructing phylogenetic trees. Mol. Biol. Evol. 1987, 4, 406–425. [Google Scholar]
  29. Felsenstein, J. Confidence limits on phylogenies: An approach using the bootstrap. Evol. Int. J. Org. Evol. 1985, 39, 783–791. [Google Scholar] [CrossRef]
  30. Kumar, S.; Stecher, G.; Tamura, K. MEGA7: Molecular Evolutionary Genetics Analysis Version 7.0 for Bigger Datasets. Mol. Biol. Evol. 2016, 33, 1870–1874. [Google Scholar] [CrossRef] [Green Version]
  31. Yang, Z. PAML 4: Phylogenetic analysis by maximum likelihood. Mol. Biol. Evol. 2007, 24, 1586–1591. [Google Scholar] [CrossRef]
  32. Mercer, T.R.; Dinger, M.E.; Mattick, J.S. Long non-coding RNAs: Insights into functions. Nat. Rev. Genet. 2009, 10, 155–159. [Google Scholar] [CrossRef]
  33. Sammeth, M.; Foissac, S.; Guigó, R. A general definition and nomenclature for alternative splicing events. PLoS Comput. Biol. 2008, 4, e1000147. [Google Scholar] [CrossRef]
  34. Gernandt, D.S.; López, G.G.; García, S.O.; Liston, A. Phylogeny and classification of Pinus. Taxon 2005, 54, 29–42. [Google Scholar] [CrossRef]
  35. Hurst, L.D. The Ka/Ks ratio: Diagnosing the form of sequence evolution. Trends Genet. TIG 2002, 18, 486. [Google Scholar] [CrossRef]
  36. Muranty, H.; Jorge, V.; Bastien, C.; Lepoittevin, C.; Bouffier, L.; Sanchez, L. Potential for marker-assisted selection for forest tree breeding: Lessons from 20 years of MAS in crops. Tree Genet. Genomes 2014, 10, 1491–1510. [Google Scholar] [CrossRef]
  37. Cappa, E.P.; El-Kassaby, Y.A.; Garcia, M.N.; Acuna, C.; Borralho, N.M.; Grattapaglia, D.; Marcucci Poltri, S.N. Impacts of population structure and analytical models in genome-wide association studies of complex traits in forest trees: A case study in Eucalyptus globulus. PLoS ONE 2013, 8, e81267. [Google Scholar] [CrossRef]
  38. David, M.R. Ecology and Biogeography of Pinus; Cambridge University Press: New York, NY, USA, 1998; pp. 69–91. [Google Scholar]
Figure 1. The reads of insert (ROI) classification (A) and ROI reads length distribution (B) for the 1–6 K selected library. (A) In a pie chart, the sectors with five colors represent filtered short reads, full-length chimeric reads, full-length non-chimeric reads, non-full-length reads with no poly-A and non-full-length reads with no primer, respectively. The ratio of each sector to circular area represents the ratio of the corresponding type. (B) The xlab stands for the length of ROIs. The left ylab represents the reads counts within the corresponding length range and the right ylab represents the cumulative frequency of the corresponding read length.
Forests 10 00942 g001
Figure 2. Homologous species distribution of Pinus elliottii annotated from the NR (NCBI nonredundant protein sequences) database.
Forests 10 00942 g002
Figure 3. The identification of long non-coding RNAs (lncRNAs), simple sequence repeats (SSRs), and coding sequences (CDSs) of the Pinus elliottii transcriptome. (A) A Venn diagram of the number of lncRNAs predicted using the Coding Potential Calculator (CPC), coding-non-coding index (CNCI), coding potential assessment tool (CPAT), and hmmscan algorithm against Pfam database. (B) The histogram representing the number of different types of SSRs. (C) The distribution of the protein length of predicted CDSs. The xlab represents the length range of the proteins, and the ylab stands for the number within each range.
Forests 10 00942 g003
Figure 4. Phylogenetic analysis of the genus Pinus. The pines in the red and yellow branches are the subgenera Pinus and Strobus, respectively. The pines with their Latin names given in the same color in this picture are in the same subsection in their classification. The tree scale represents the proportional scale.
Forests 10 00942 g004
Figure 5. The Ks value distribution of the orthologous pairs between P. elliottii and 11 other conifer species. The different colors represent the different species.
Forests 10 00942 g005
Figure 6. The heatmap representing the number of positive selection genes annotated to the Kyoto Encyclopedia of Genes and Genomes (KEGG) pathway. The colors from white (0) to red (8) represent the number.
Forests 10 00942 g006
Table 1. Functional annotation of P. elliottii’s full-length transcriptome. This table shows the number of high-quality isoforms that were blasted to public databases, including COG (Clusters of Orthologous Groups) [19], GO (Gene Ontology) [20], KEGG (Kyoto Encyclopedia of Genes and Genomes) [21], KOG (euKaryotic Ortholog Groups) [22], Pfam (Protein family) [23], Swissprot [24], EggNOG (Evolutionary genealogy of genes: Non-supervised Orthologous Groups) [25], and NR (NCBI nonredundant protein sequences) databases.
IsoformCOGGOKEGGKOGPfamSwiss-ProtEgg NOGNRAll
Isoform Number32,75548,72031,93946,17764,41356,54373,00476,17376,411
Percentage (%)40.7760.6439.7657.4880.1870.3890.8794.8195.11
Table 2. The unigenes/genes of Picea glauca and 11 Pinus (including the P. elliottii data of this study). The PlantGDB represents that unigenes were obtained from PlantGDB—Resources for Plant Comparative Genomics (http://www.plantgdb.org). The NCBI represents that unigenes/genes were obtained from National Center for Biotechnology Information (NCBI, https://www.ncbi.nlm.nih.gov/). Treegenesdb (v1.01) stands for that the genes of Pinus taeda were obtained according to genome assembly and general feature format of P. taeda (version v1.01).
GenusPinus/Picea spp.Data SourceNumber of
Unigenes/Genes
Total
Length(bp)
Mean Length(bp)
PinusPinus contortaPlantGDB13,57013,018,301959.34
PinusPinus banksianaPlantGDB13,04012,504,634958.94
PinusPinus taedaTreegenesdb(v1.01)84,52566,216,274783.39
PinusPinus patulaNCBI52,73572,146,4571368.09
PinusPinus elliottiiThis study80,339190,161,3982366.99
PinusPinus massonianaNCBI194,821106,618,461547.26
PinusPinus canariensisNCBI47,79243,957,406919.76
PinusPinus pinasterPlantGDB15,6488,925,915570.42
PinusPinus albicaulisNCBI129,522116,155,243896.8
PinusPinus monticolaNCBI54,66146,069,734842.83
PinusPinus flexilisNCBI14,27916,275,8481139.85
PiceaPicea glaucaNCBI354,861349,225,041984.12
Table 3. The peaks for the Ks value (the synonymous substitutions per site) and the number of orthologous pairs and genes under positive selection between P. elliottii and 11 other conifer species.
SpeciesOrthologous PairsPeaks of Ks ValuesNumber of Genes under Positive SelectionRatio
Picea glauca27520.148301541.96%
Pinus albicaulis41730.0726111062.54%
Pinus banksiana27580.01095829610.73%
Pinus canariensis48700.0303053026.20%
Pinus contorta30110.0087452518.34%
Pinus flexilis22450.075452582.58%
Pinus massoniana59070.0278073986.74%
Pinus monticola50470.0704121082.14%
Pinus patula54160.0050333937.26%
Pinus pinaster24960.0289131877.49%
Pinus taeda36950.01283140210.88%
Table 4. The number of positive selection genes annotated to some important biological processes between P. elliottii and 11 other conifers.
P.
patula
P.
banksiana
P.
contorta
P.
taeda
P.
massoniana
P.
pinaster
P.
canariensis
P.
monticola
P.
flexilis
P.
albicaulis
Picea
glauca
Response to plant phytohormone
Salicylic acid22021000000
Abscisic acid23021300000
Gibberellin21140110000
Jasmonic acid21021000000
Auxin12133310000
Meristem activity
meristem initiation00010000000
meristem growth00030000011
meristem determinacy00110000010
vegetative to reproductive
phase transition of meristem
00011100001
defense to biological
and abiotic factors
defense response
to fungus
10011001000
defense response
to bacterium
22110110000
response to salt stress23130220010
response to osmotic stress12000100000
response to oxidative stress11220100000
response to endoplasmic reticulum stress41201030000
antifungal00002000000
response to cold20211010000
response to water deprivation10011000000
response to light
response to blue light10010000000
response to high light intensity31112020000
response to red light10010000000
response to far red light10000000000
red, far-red light phototransduction00010000000

