Tree Species Classification by Integrating Satellite Imagery and Topographic Variables Using Maximum Entropy Method in a Mongolian Forest
Abstract
:1. Introduction
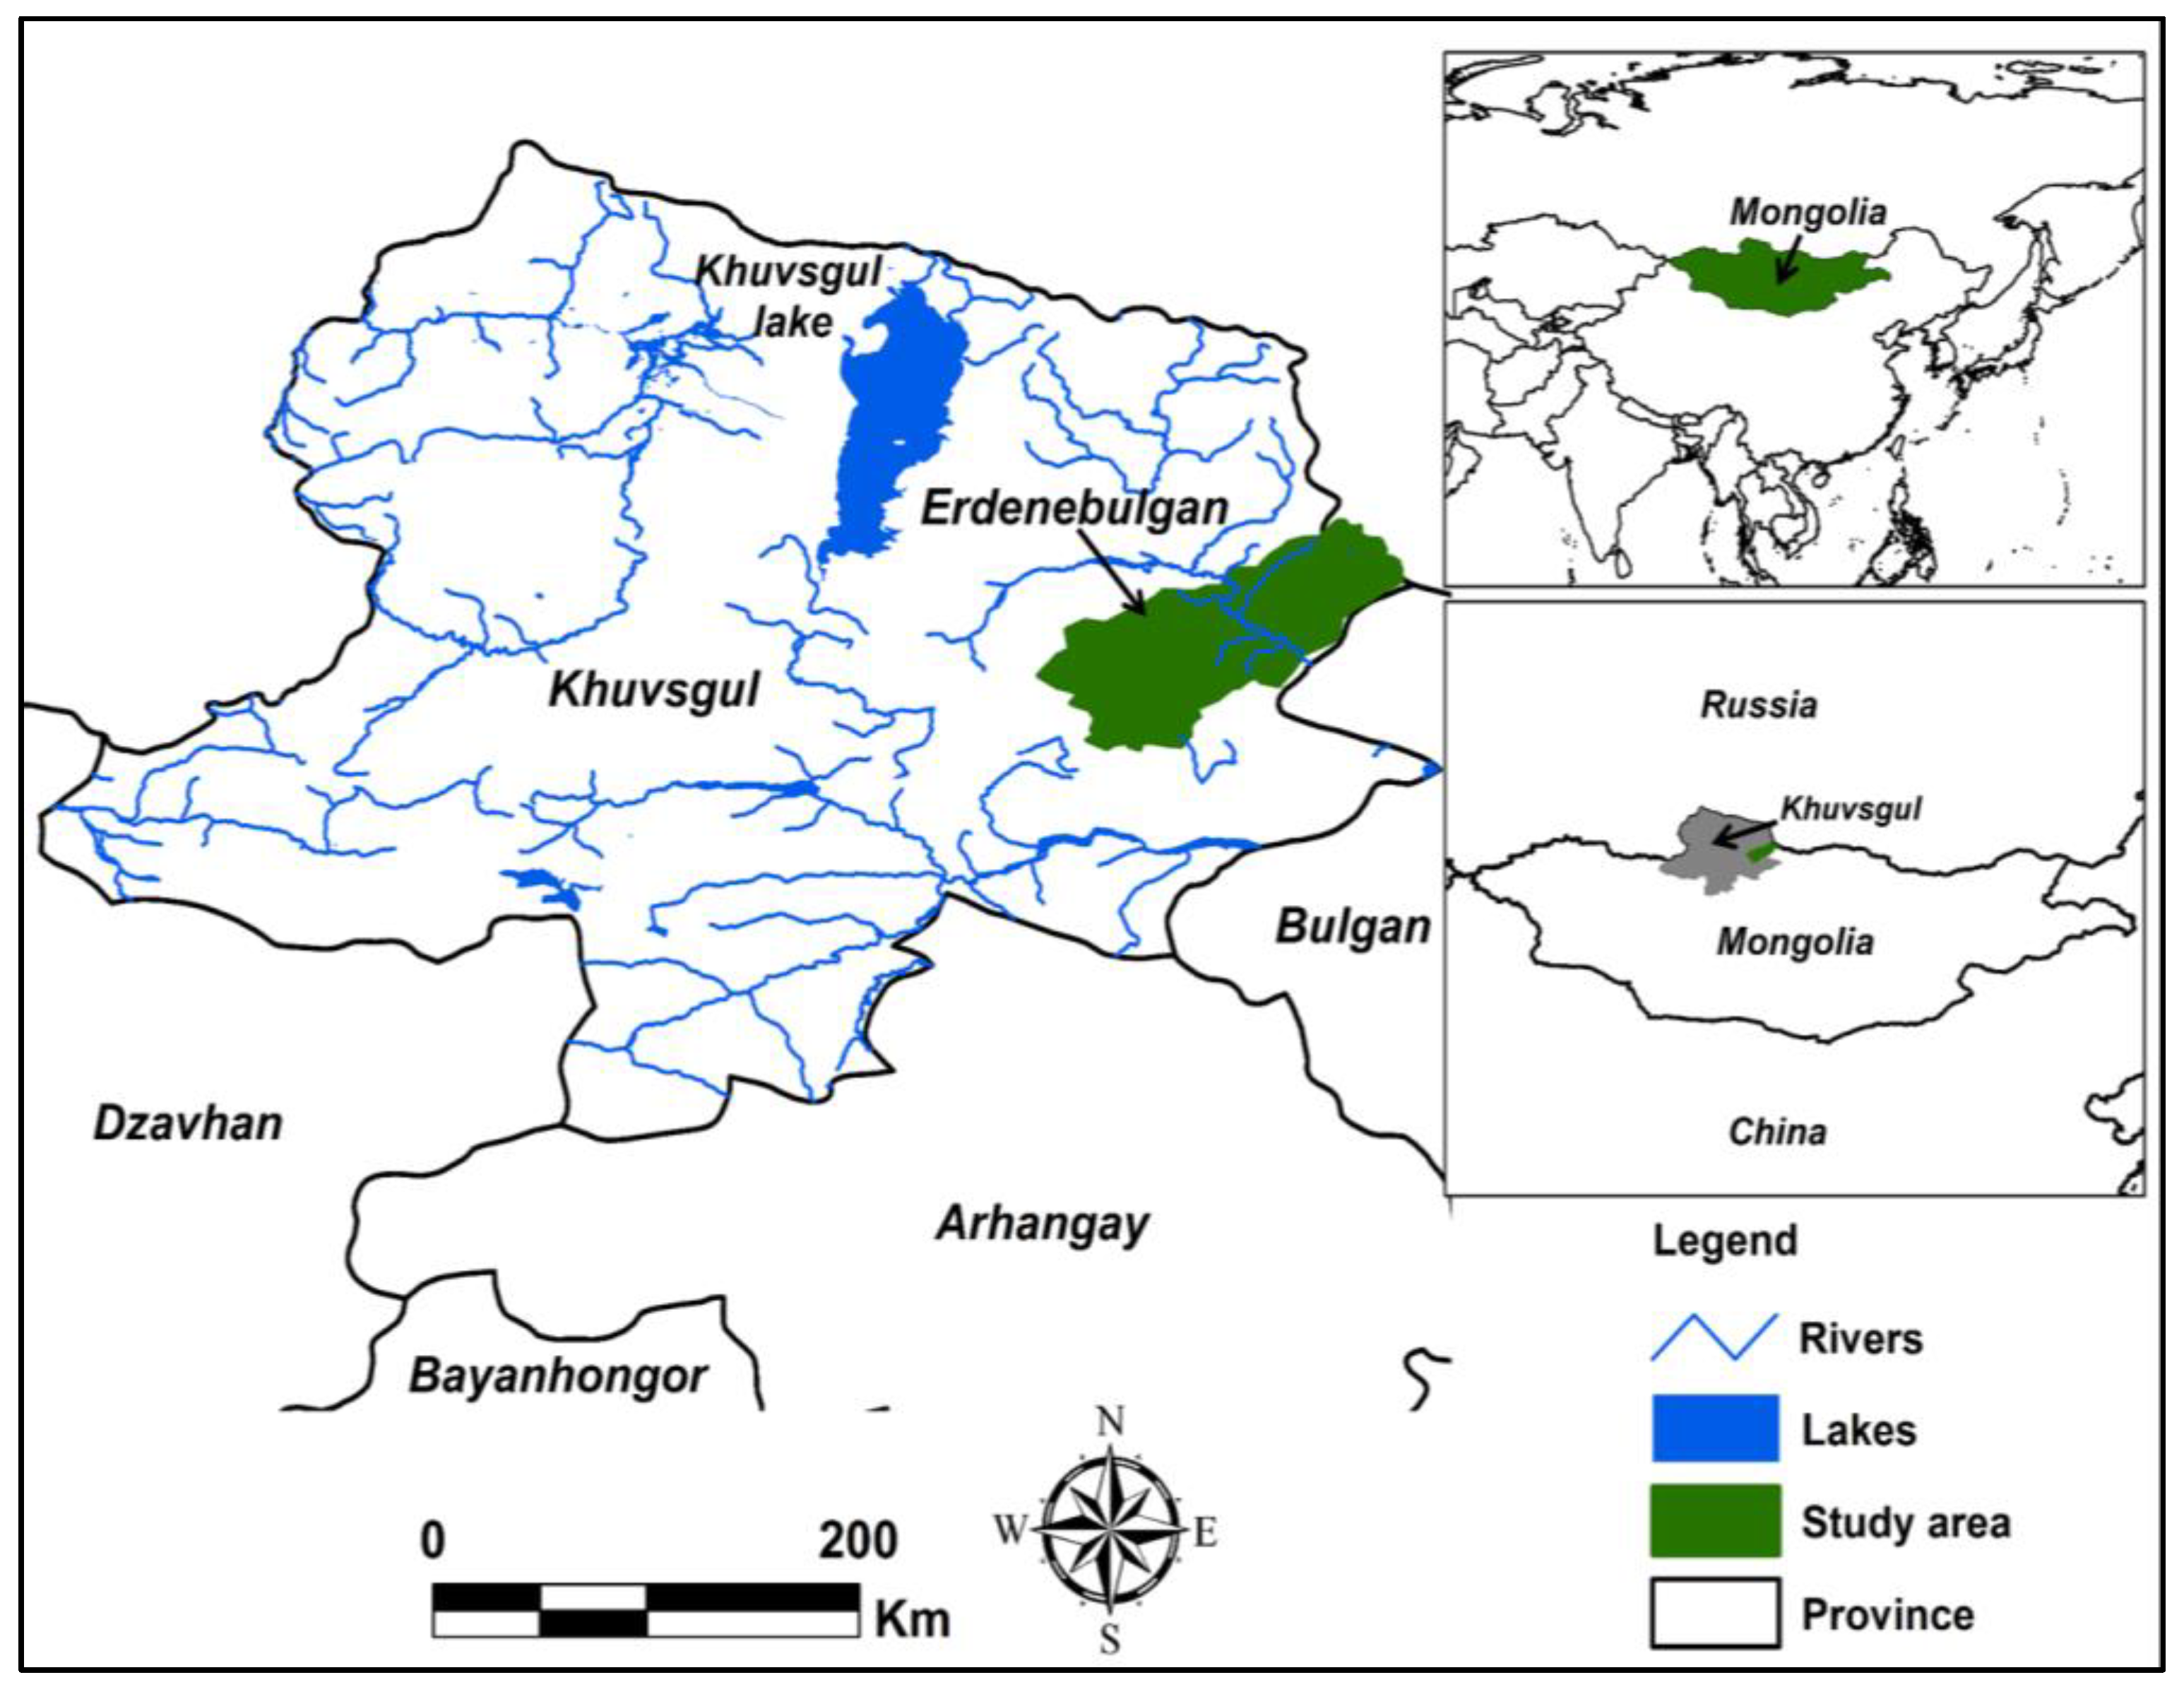
2. Study Area
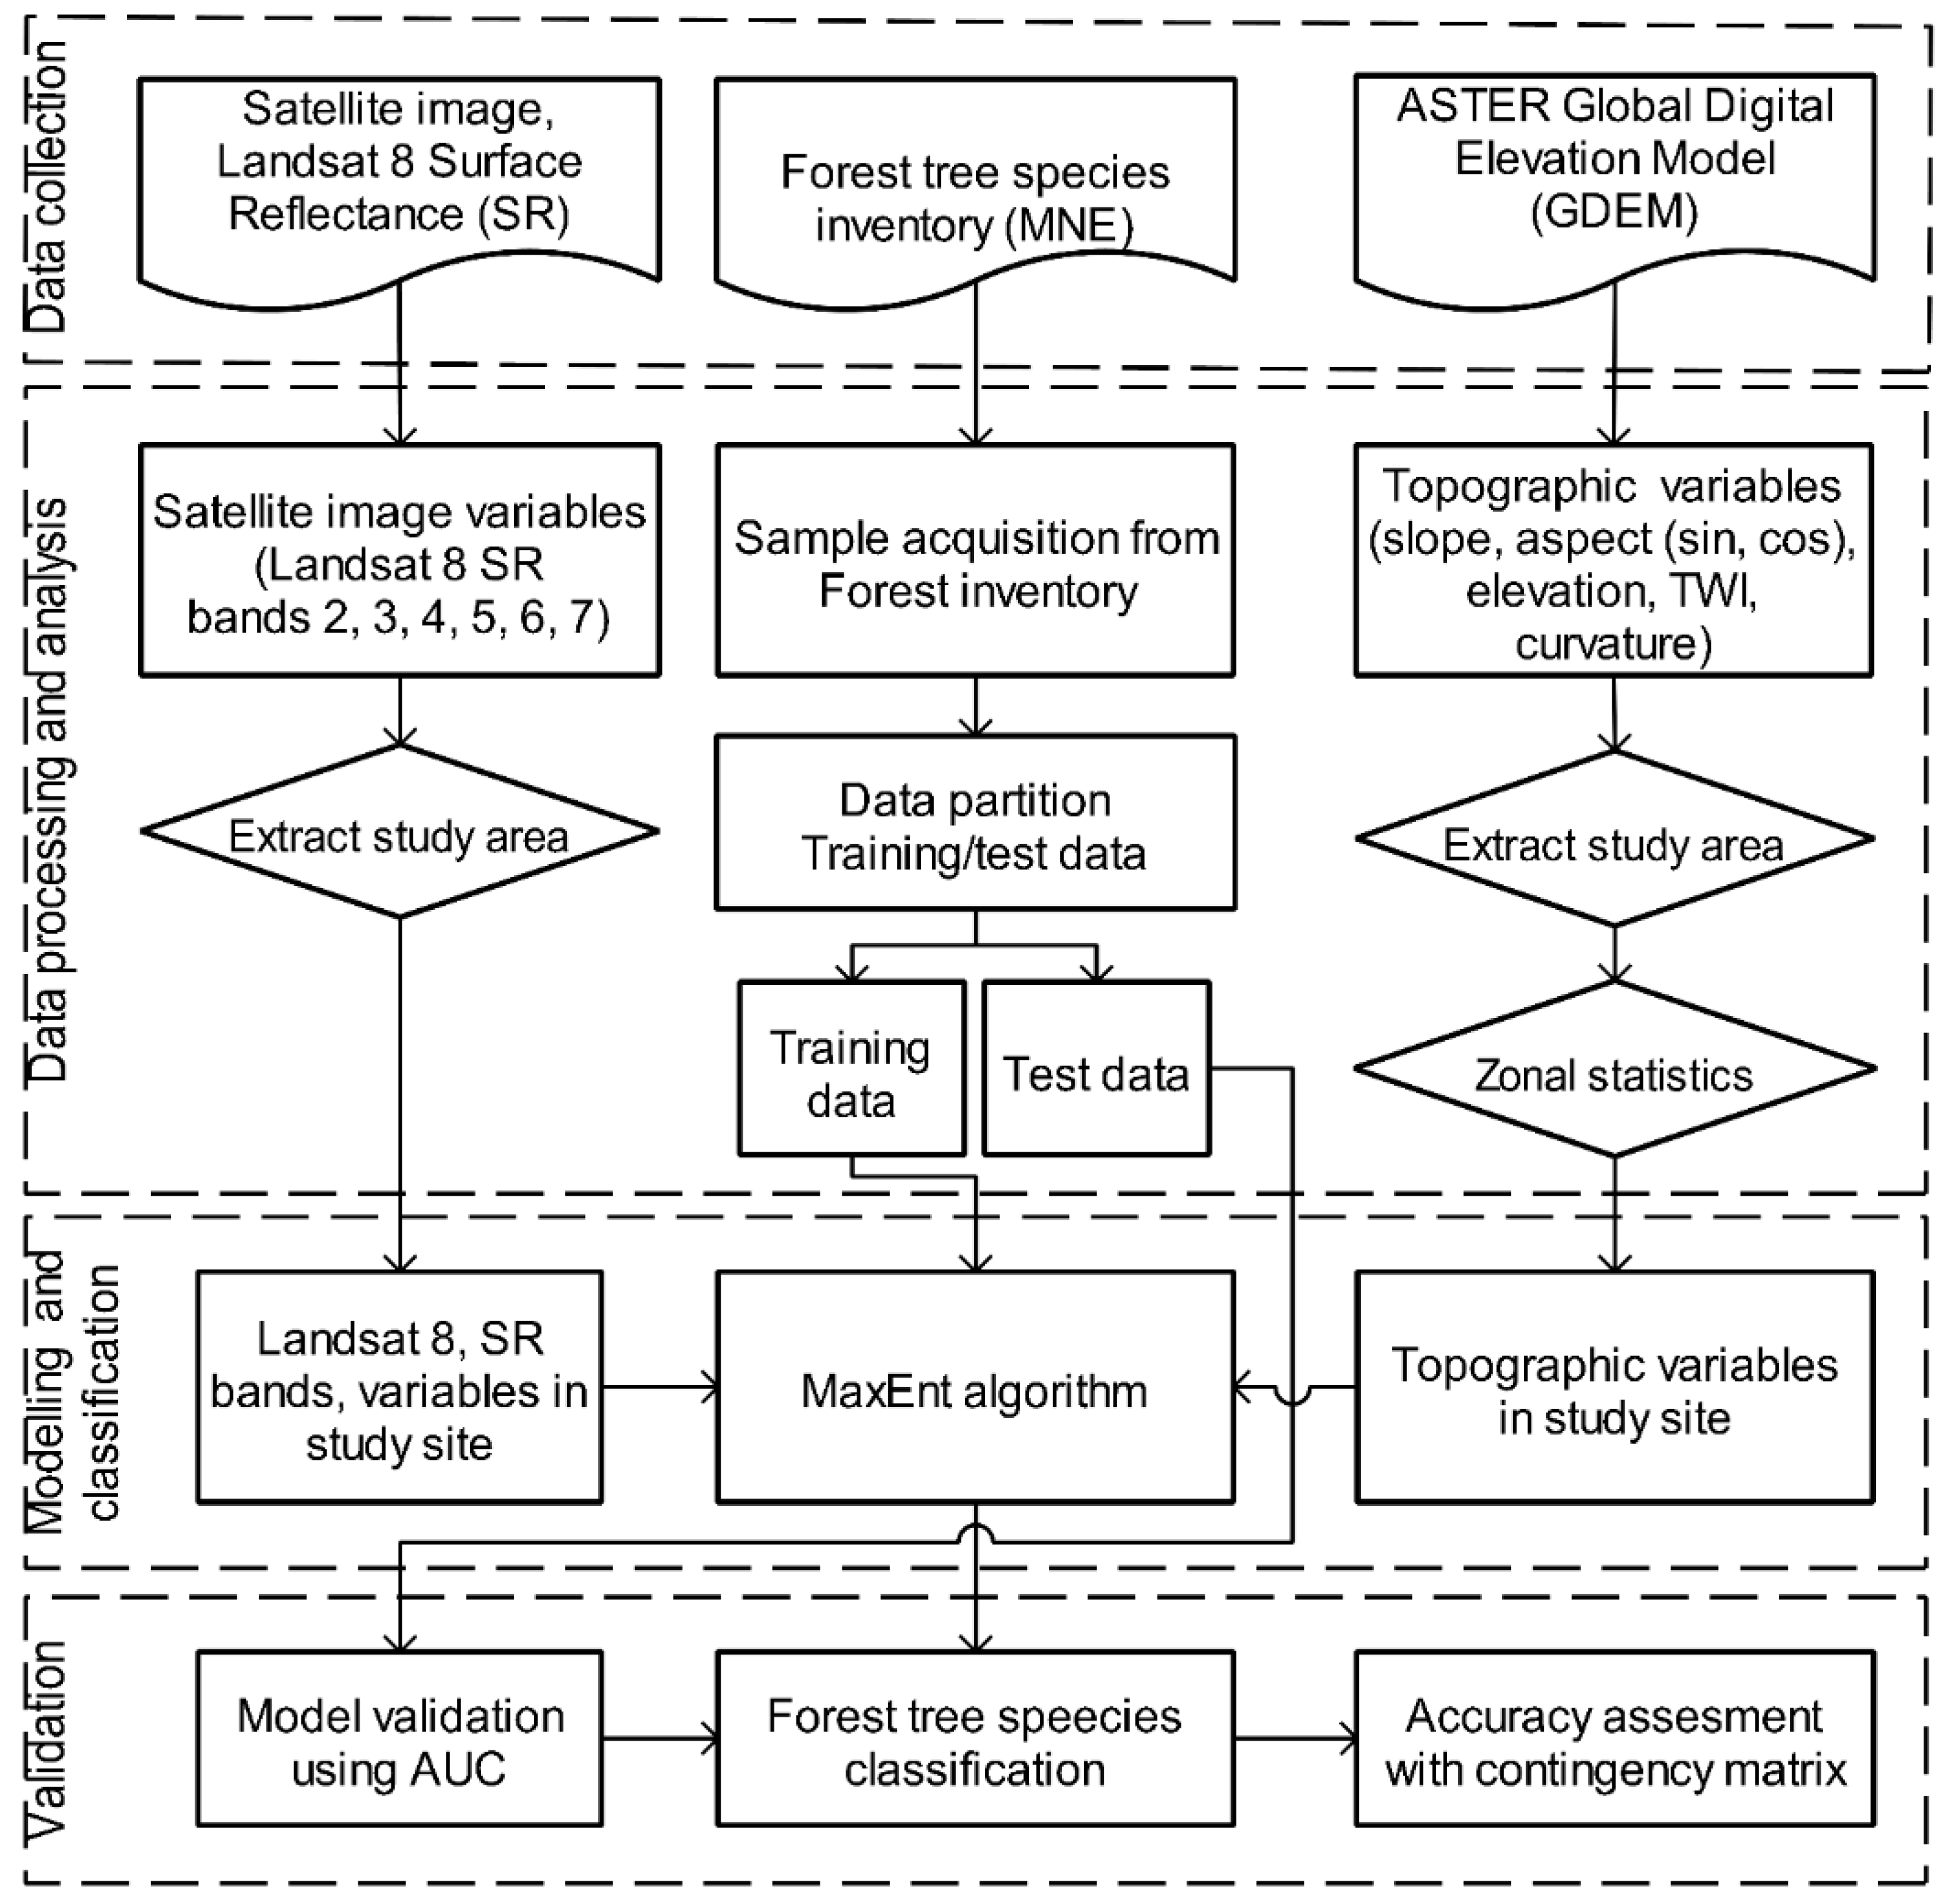
3. Materials and Methods
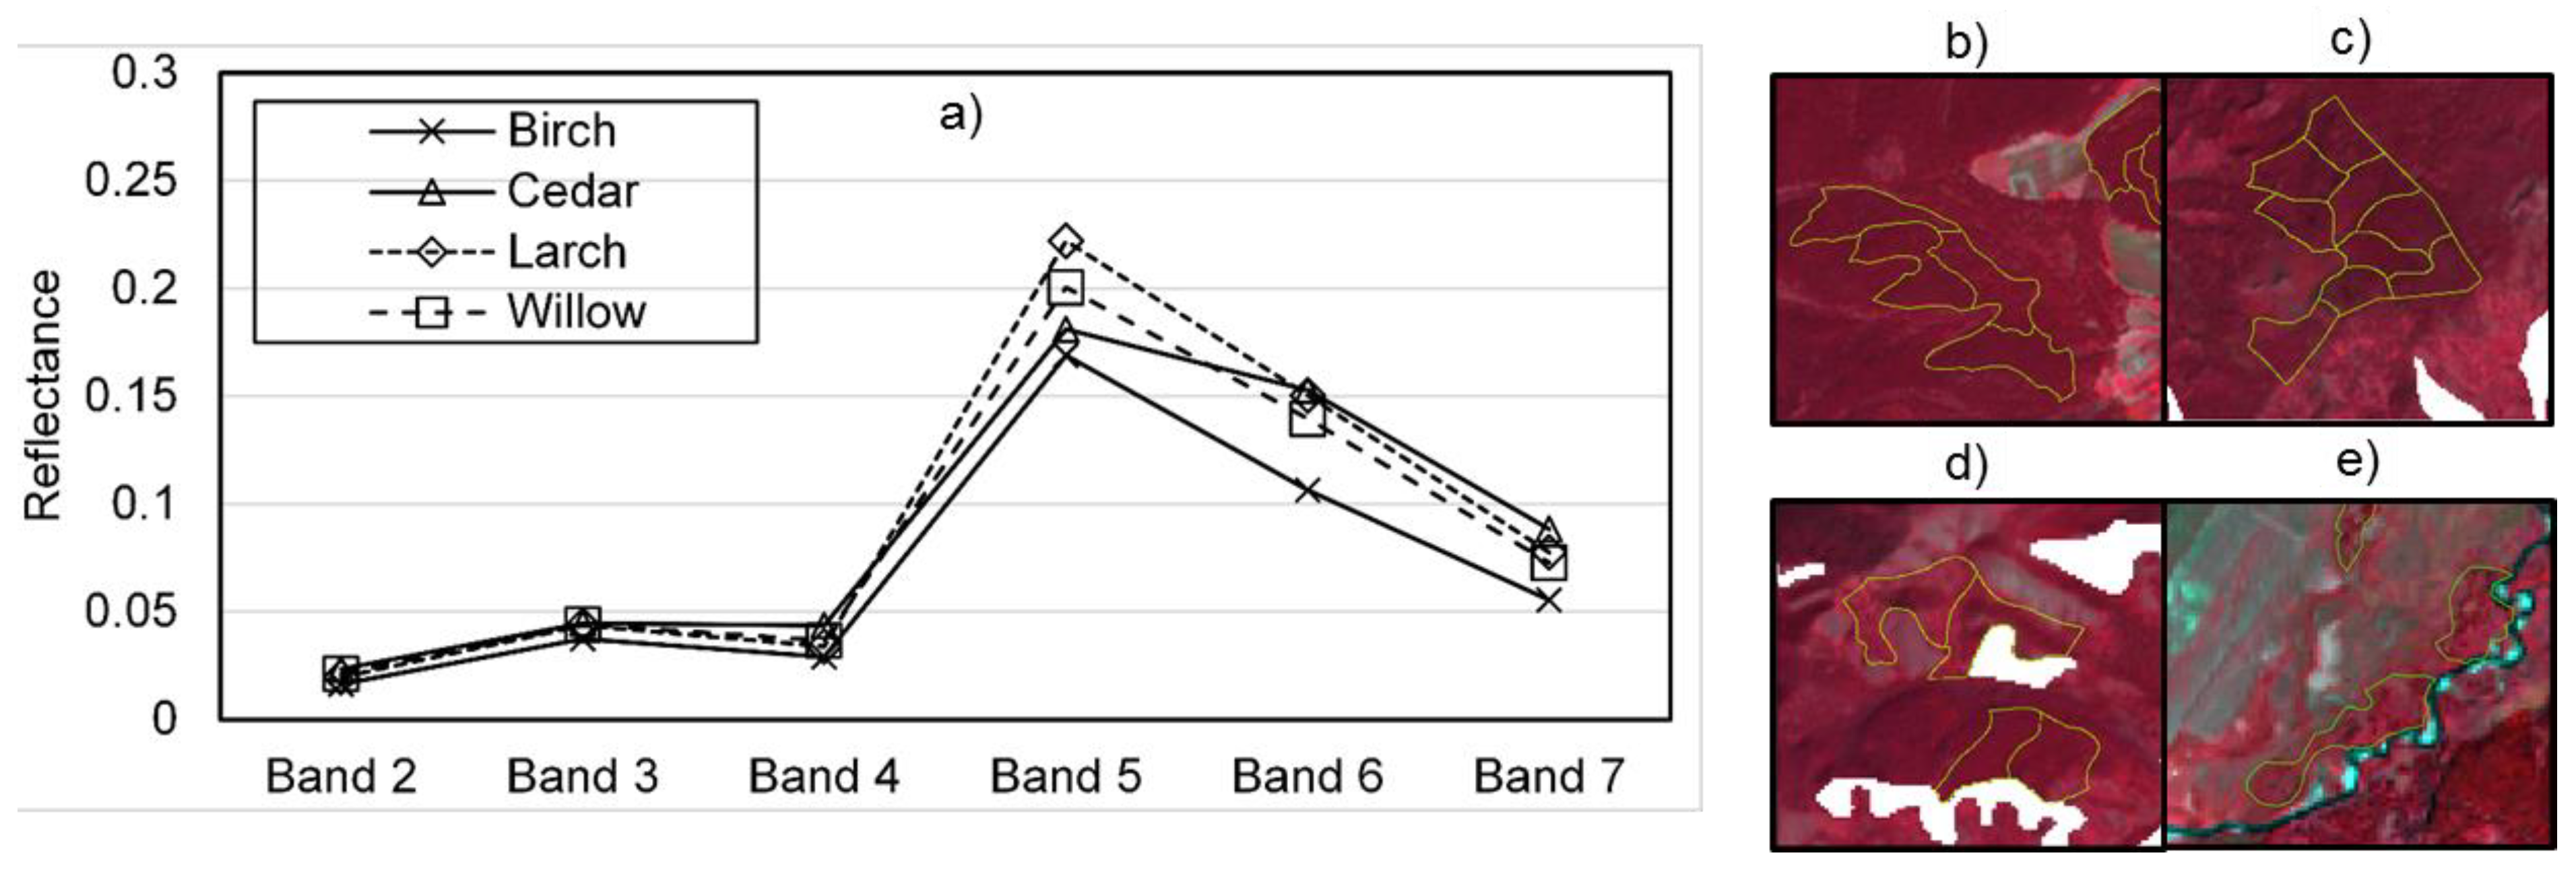
3.1. Data Collection
3.2. Data Processing and Analysis
3.3. Maximum Entropy
3.4. Validation Methods
4. Results and Discussion
4.1. Variable Importance Analysis
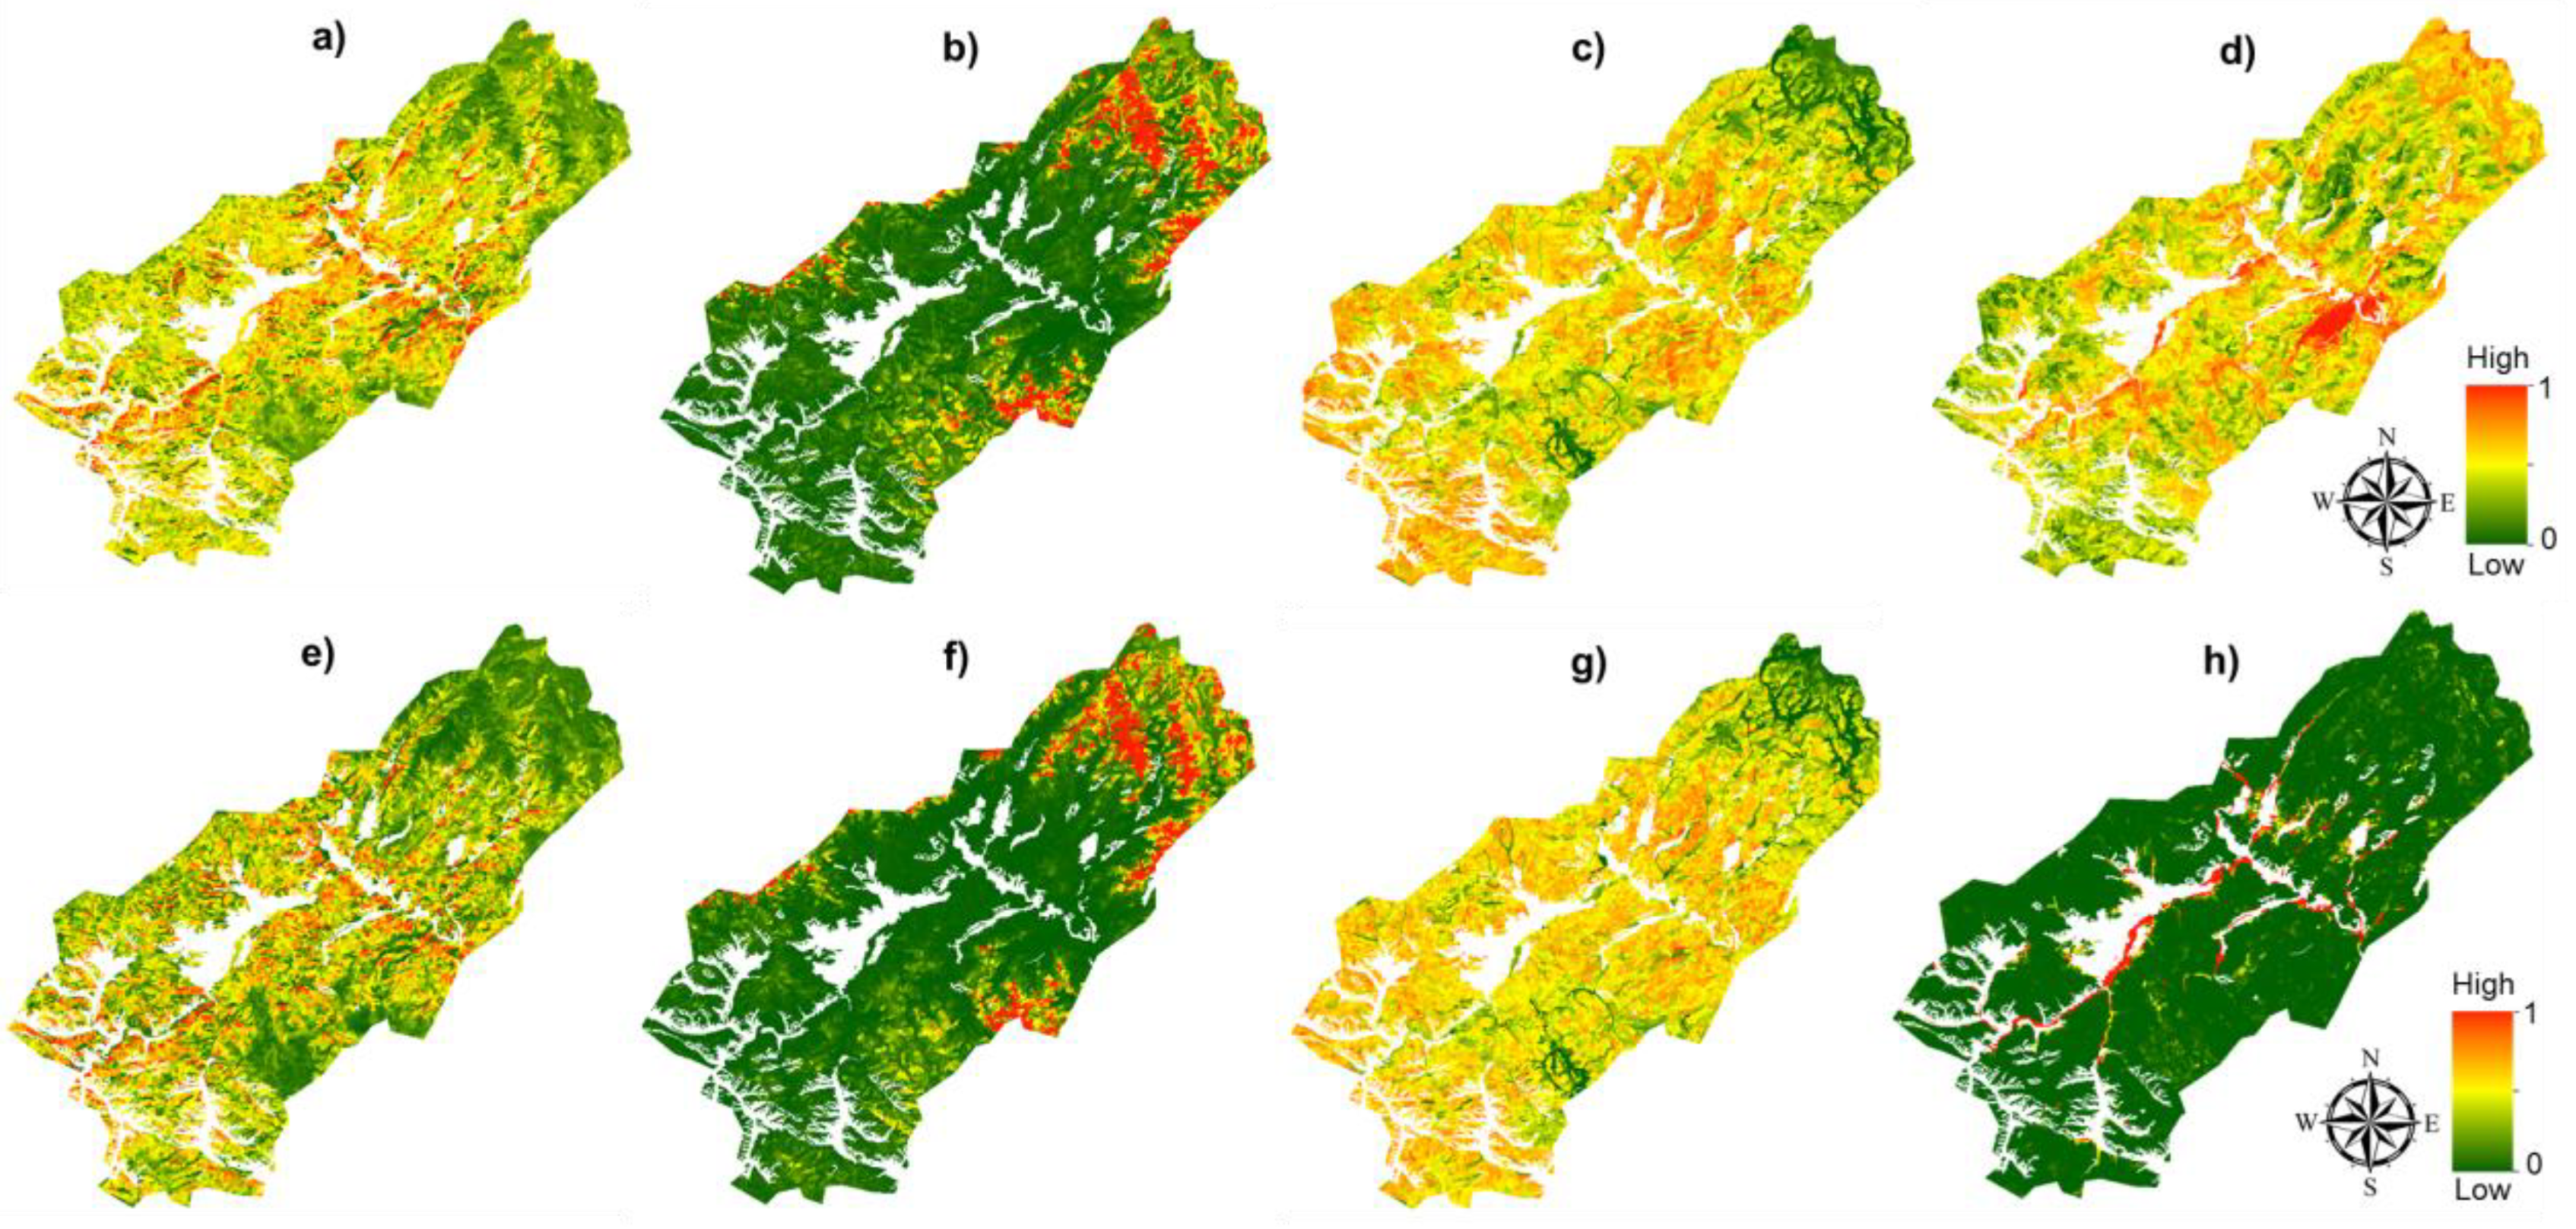
4.2. Tree Species Classification with MaxEnt
4.3. Validation
5. Conclusions
Author Contributions
Funding
Acknowledgments
Conflicts of Interest
References
- Torahi, A.A.; Rai, S.C. Land cover classification and forest change analysis, using satellite imagery—A case study in Dehdez area of Zagros Mountain in Iran. J. Geogr. Inf. Syst. 2011, 3, 1–11. [Google Scholar] [CrossRef]
- Dorjsuren, C. Mongolia Country Progress Report: Recommendation for Harmonization and Standardization of MAR Terms; Forest Water Research Centre, Ministry of Nature and the Environment of Mongolia: Ulaanbaatar, Mongolia, 2008. [Google Scholar]
- Leaman, D. The State of the World’s Land and Water Resources for Food and Agriculture (SOLAW)-Managing Systems at Risk. Econ. Bot. 2012, 66, 418–419. [Google Scholar]
- Immitzer, M.; Atzberger, C.; Koukal, T. Tree species classification with random forest using very high spatial resolution 8-band WorldView-2 satellite data. Remote Sens. 2012, 4, 2661–2693. [Google Scholar] [CrossRef]
- McDermid, G.; Hall, R.; Sanchez-Azofeifa, G.; Franklin, S.; Stenhouse, G.; Kobliuk, T.; LeDrew, E. Remote sensing and forest inventory for wildlife habitat assessment. For. Ecol. Manag. 2009, 257, 2262–2269. [Google Scholar] [CrossRef]
- Skjøth, C.A.; Geels, C.; Hvidberg, M.; Hertel, O.; Brandt, J.; Frohn, L.M.; Hansen, K.M.; Hedegaard, G.B.; Christensen, J.H.; Moseholm, L. An inventory of tree species in Europe—An essential data input for air pollution modelling. Ecol. Model. 2008, 217, 292–304. [Google Scholar] [CrossRef]
- Lindenmayer, D.B.; Margules, C.R.; Botkin, D.B. Indicators of biodiversity for ecologically sustainable forest management. Conserv. Biol. 2000, 14, 941–950. [Google Scholar] [CrossRef]
- Tsogtbaatar, J. Forest policy development in Mongolia. Geoecol. Inst. Mong. Acad. Sci. Ułan-Bator. In Institute for Global Environmental Strategies (IGES); Policy Trend Report; Sato Printing Co. Ltd.: Yokohama, Japan, 2000; pp. 60–69. [Google Scholar]
- Scott, C.; Gove, J. Forest Inventory. Encyclopedia of Environmetrics; John Wiley & Sons Ltd.: Chichester, UK, 2002; pp. 814–820. [Google Scholar]
- Chiang, S.H.; Valdez, M.; Chen, C.-F. Forest tree species distribution mapping using Landsat satellite imagery and topographic variables with the maximum entropy method in Mongolia. In ISPRS-International Archives of the Photogrammetry; Remote Sensing and Spatial Information Sciences: Prague, Czech Republic, 2016; Volume 8, pp. 593–596. [Google Scholar]
- Crisp, N.; Dick, J.; Mullins, M. Mongolia Forestry Sector Review; World Bank: Washington, DC, USA, 2004. [Google Scholar]
- Lu, D. Integration of vegetation inventory data and Landsat TM image for vegetation classification in the western Brazilian Amazon. For. Ecol. Manag. 2005, 213, 369–383. [Google Scholar] [CrossRef]
- Wulder, M. Optical remote-sensing techniques for the assessment of forest inventory and biophysical parameters. Prog. Phys. Geogr. 1998, 22, 449–476. [Google Scholar] [CrossRef]
- Foody, G.M.; Atkinson, P.M.; Gething, P.W.; Ravenhill, N.A.; Kelly, C.K. Identification of specific tree species in ancient semi-natural woodland from digital aerial sensor imagery. Ecol. Appl. 2005, 15, 1233–1244. [Google Scholar] [CrossRef]
- Schuck, A.; Päivinen, R.; Häme, T.; Van Brusselen, J.; Kennedy, P.; Folving, S. Compilation of a European forest map from Portugal to the Ural mountains based on earth observation data and forest statistics. For. Policy Econ. 2003, 5, 187–202. [Google Scholar] [CrossRef]
- Martin, M.; Newman, S.; Aber, J.; Congalton, R. Determining forest species composition using high spectral resolution remote sensing data. Remote Sens. Environ. 1998, 65, 249–254. [Google Scholar] [CrossRef]
- Carleer, A.P.; Debeir, O.; Wolff, E. Assessment of very high spatial resolution satellite image segmentations. Photogramm. Eng. Remote Sens. 2005, 71, 1285–1294. [Google Scholar] [CrossRef]
- Ke, Y.; Quackenbush, L.J.; Im, J. Synergistic use of QuickBird multispectral imagery and LIDAR data for object-based forest species classification. Remote Sens. Environ. 2010, 114, 1141–1154. [Google Scholar] [CrossRef]
- Wang, L.; Sousa, W.P.; Gong, P.; Biging, G.S. Comparison of IKONOS and QuickBird images for mapping mangrove species on the Caribbean coast of Panama. Remote Sens. Environ. 2004, 91, 432–440. [Google Scholar] [CrossRef]
- Dorren, L.K.; Maier, B.; Seijmonsbergen, A.C. Improved Landsat-based forest mapping in steep mountainous terrain using object-based classification. For. Ecol. Manag. 2003, 183, 31–46. [Google Scholar] [CrossRef]
- Franklin, J. Predicting the distribution of shrub species in southern California from climate and terrain-derived variables. J. Veg. Sci. 1998, 9, 733–748. [Google Scholar] [CrossRef]
- Liu, J.; Yunhong, T.; Slik, J.F. Topography related habitat associations of tree species traits, composition and diversity in a Chinese tropical forest. For. Ecol. Manag. 2014, 330, 75–81. [Google Scholar] [CrossRef]
- Evangelista, P.; Young, N.; Carter, L.; Jarnevich, C.; Birtwistle, A.; Groy, K. Mapping Habitat and Potential Distributions of Invasive Plant Species on USFWS National Wildlife Refuges; Colorado State University and Fort Collins Science Center: Fort Collins, CO, USA, 2012. [Google Scholar] [CrossRef]
- Gastón, A.; García-Viñas, J.I. Modelling species distributions with penalised logistic regressions: A comparison with maximum entropy models. Ecol. Model. 2011, 222, 2037–2041. [Google Scholar] [CrossRef]
- Guo, Q.; Kelly, M.; Graham, C.H. Support vector machines for predicting distribution of Sudden Oak Death in California. J. Ecol. Model. 2005, 182, 75–90. [Google Scholar] [CrossRef]
- Kumar, S.; Neven, L.G.; Yee, W.L. Assessing the potential for establishment of western cherry fruit fly using ecological niche modeling. J. Econ. Entomol. 2014, 107, 1032–1044. [Google Scholar] [CrossRef]
- Carpenter, G.; Gillison, A.N.; Winter, J. Domain—A Flexible Modeling Procedure for Mapping Potential Distributions of Plants and Animals. Biodivers. Conserv. 1993, 2, 667–680. [Google Scholar] [CrossRef]
- Elith, J. Quantitative methods for modeling species habitat: Comparative performance and an application to Australian plants. In Quantitative Methods for Conservation Biology; Springer: New York, NY, USA, 2000; pp. 39–58. [Google Scholar]
- Saqib, Z.; Malik, R.N.; Husain, S.Z. Modeling potential distribution of Taxus wallichiana in Palas Valley, Pakistan. Pak. J. Bot. 2006, 38, 539. [Google Scholar]
- Stockwell, D. The GARP modelling system: Problems and solutions to automated spatial prediction. Int. J. Geogr. Inf. Sci. 1999, 13, 143–158. [Google Scholar] [CrossRef]
- Vargas, J.; Consiglio, T.; Jørgensen, P.; Croat, T. Modelling distribution patterns in a species-rich plant genus, Anthurium (Araceae), in Ecuador. Divers. Distrib. 2004, 10, 211–216. [Google Scholar] [CrossRef]
- Lin, J.; Liu, X.; Li, K.; Li, X. A maximum entropy method to extract urban land by combining MODIS reflectance, MODIS NDVI, and DMSP-OLS data. Int. J. Remote Sens. 2014, 35, 6708–6727. [Google Scholar] [CrossRef]
- Phillips, S.J.; Anderson, R.P.; Schapire, R.E. Maximum entropy modeling of species geographic distributions. Ecol. Model. 2006, 190, 231–259. [Google Scholar] [CrossRef] [Green Version]
- Fourcade, Y.; Engler, J.O.; Rödder, D.; Secondi, J. Mapping species distributions with MAXENT using a geographically biased sample of presence data: A performance assessment of methods for correcting sampling bias. PLoS ONE 2014, 9, e97122. [Google Scholar] [CrossRef]
- Kumar, S.; Stohlgren, T.J. Maxent modeling for predicting suitable habitat for threatened and endangered tree Canacomyrica monticola in New Caledonia. J. Ecol. Nat. Sci. 2009, 1, 94–98. [Google Scholar]
- Merow, C.; Smith, M.J.; Silander, J.A., Jr. A practical guide to MaxEnt for modeling species’ distributions: What it does, and why inputs and settings matter. Ecography 2013, 36, 1058–1069. [Google Scholar] [CrossRef]
- Guo, Q.; Li, W.; Liu, Y.; Tong, D. Predicting potential distributions of geographic events using one-class data: Concepts and methods. Int. J. Geogr. Inf. Sci. 2011, 25, 1697–1715. [Google Scholar] [CrossRef]
- Li, W.; Guo, Q. A maximum entropy approach to one-class classification of remote sensing imagery. Int. J. Remote Sens. 2010, 31, 2227–2235. [Google Scholar] [CrossRef]
- Parisien, M.-A.; Snetsinger, S.; Greenberg, J.A.; Nelson, C.R.; Schoennagel, T.; Dobrowski, S.Z.; Moritz, M.A. Spatial variability in wildfire probability across the western United States. Int. J. Wildland Fire 2012, 21, 313–327. [Google Scholar] [CrossRef]
- Petrov, A.N.; Wessling, J.M. Utilization of machine-learning algorithms for wind turbine site suitability modeling in Iowa, USA. Wind Energy 2015, 18, 713–727. [Google Scholar] [CrossRef]
- Andreo, V.; Glass, G.; Shields, T.; Provensal, C.; Polop, J. Modeling Potential Distribution of Oligoryzomys longicaudatus, the Andes Virus (Genus: Hantavirus) Reservoir, in Argentina. Ecohealth 2011, 8, 332–348. [Google Scholar] [CrossRef] [PubMed]
- Florinsky, I.V. Combined analysis of digital terrain models and remotely sensed data in landscape investigations. Prog. Phys. Geogr. 1998, 22, 33–60. [Google Scholar] [CrossRef]
- Sesnie, S.E.; Gessler, P.E.; Finegan, B.; Thessler, S. Integrating Landsat TM and SRTM-DEM derived variables with decision trees for habitat classification and change detection in complex neotropical environments. Remote Sens. Environ. 2008, 112, 2145–2159. [Google Scholar] [CrossRef]
- Wright, C.; Gallant, A. Improved wetland remote sensing in Yellowstone National Park using classification trees to combine TM imagery and ancillary environmental data. Remote Sens. Environ. 2007, 107, 582–605. [Google Scholar] [CrossRef]
- Peterson, A.; Soberón, J.; Pearson, R.; Anderson, R.; Martínez-Meyer, E.; Nakamura, M.; Araújo, M. Ecological Niches and Geographic Distributions; Princeton University Press: Princeton, NJ, USA, 2011. [Google Scholar]
- Mühlenberg, M.; Appelfelder, J.; Hoffmann, H.; Ayush, E.; Wilson, K. Structure of the montane taiga forests of West Khentii, Northern Mongolia. J. For. Sci. 2012, 58, 45–56. [Google Scholar] [CrossRef] [Green Version]
- USGS. Landsat 8 Surface Relectance Code (LASRC) Product Guide Version 2. 2019. Available online: https://prd-wret.s3-us-west-2.amazonaws.com/assets/palladium/production/atoms/files/LSDS-1368_L8_SurfaceReflectanceCode-LASRC_ProductGuide-v2.pdf (accessed on 4 June 2019).
- Team, A.G.V. ASTER Global DEM Validation Summary Report. 2009. Available online: https://lpdaac.usgs.gov/documents/28/ASTER_GDEM_Validation_1_Summary_Report.pdf (accessed on 10 June 2019).
- Frey, H.; Paul, F. On the suitability of the SRTM DEM and ASTER GDEM for the compilation of topographic parameters in glacier inventories. Int. J. Appl. Earth Obs. Geoinf. 2012, 18, 480–490. [Google Scholar] [CrossRef]
- Trofaier, A.M.; Rees, W.G. The suitability of using ASTER GDEM2 for terrain-based extraction of stream channel networks in a lowland Arctic permafrost catchment. Fenn.—Int. J. Geogr. 2015, 193, 66–82. [Google Scholar]
- Aiba, S.; Kitayama, K.; Takyu, M. Habitat associations with topography and canopy structure of tree species in a tropical montane forest on Mount Kinabalu, Borneo. Plant Ecol. 2004, 174, 147–161. [Google Scholar] [CrossRef]
- Bao, H.; Wang, X.; Zhang, W. Relationship between the vegetation types and topographical factors from Wula mountain, Inner Mongolia: Based on ALOS data. In Proceedings of the 2011 International Conference on Remote Sensing, Environment and Transportation Engineering, Nanjing, China, 24–26 June 2011. [Google Scholar]
- Farjon, A. Pinus Sibirica. The IUCN Red List of Threatened Species 2013. Available online: https://www.iucnredlist.org/species/42415/2978539 (accessed on 10 June 2019).
- James, T.M. Temperature sensitivity and recruitment dynamics of Siberian larch (Larix sibirica) and Siberian spruce (Picea obovata) in northern Mongolia’s boreal forest. For. Ecol. Manag. 2011, 262, 629–636. [Google Scholar] [CrossRef]
- Lan, G.; Hu, Y.; Cao, M.; Zhu, H. Topography related spatial distribution of dominant tree species in a tropical seasonal rain forest in China. For. Ecol. Manag. 2011, 262, 1507–1513. [Google Scholar] [CrossRef]
- Oliveira-Filho, A.T.; Vilela, E.A.; Carvalho, D.A.; Gavilanes, M.L. Effects of soils and topography on the distribution of tree species in a tropical riverine forest in south-eastern Brazil. J. Trop. Ecol. 1994, 10, 483–508. [Google Scholar] [CrossRef]
- Tilley, D.; Ogle, D.; John, L.S.; Hoag, C.; Scianna, J. Native Shrubs and Trees for Riparian Areas in the Intermountain West; Natural Resources Conservation Service: Salt Lake City, UT, USA, 2012.
- Arefi, H.; Reinartz, P. Accuracy Enhancement of ASTER Global Digital Elevation Models Using ICESat Data. Remote Sens. 2011, 3, 1323–1343. [Google Scholar] [CrossRef] [Green Version]
- Olusina, J.; Chukwuma, O. Visualisation of Uncertainty in 30m Resolution Global Digital Elevation Models: SRTM v3.0 and ASTER v2. Niger. J. Technol. Dev. 2018, 15, 77–83. [Google Scholar] [CrossRef]
- Heumann, B.W. An object-based classification of mangroves using a hybrid decision tree—Support vector machine approach. Remote Sens. 2011, 3, 2440–2460. [Google Scholar] [CrossRef]
- Elith, J.; Phillips, S.J.; Hastie, T.; Dudík, M.; Chee, Y.E.; Yates, C.J. A statistical explanation of MaxEnt for ecologists. Divers. Distrib. 2011, 17, 43–57. [Google Scholar] [CrossRef]
- Phillips, S.J.; Dudík, M. Modeling of species distributions with Maxent: New extensions and a comprehensive evaluation. Ecography 2008, 31, 161–175. [Google Scholar] [CrossRef]
- Jaynes, E.T. Information theory and statistical mechanics. Phys. Rev. 1957, 106, 620. [Google Scholar] [CrossRef]
- Dudik, M.; Phillips, S.J.; Schapire, R.E. Performance Guarantees for Regularized Maximum Entropy Density Estimation. In International Conference on Computational Learning Theory; ACM Press: New York, NY, USA, 2004; pp. 655–662. [Google Scholar]
- Fielding, A.H.; Bell, J.F. A review of methods for the assessment of prediction errors in conservation presence/absence models. Environ. Conserv. 1997, 24, 38–49. [Google Scholar] [CrossRef]
- Jensen, J. Introductory Digital Image Processing: A Remote Sensing Perspective; Prentice Hall PTR: Upper Saddle River, NJ, USA, 1995; pp. 407–429. [Google Scholar]
- Tuomisto, H.; Ruokolainen, K.; Yli-Halla, M. Dispersal, environment, and floristic variation of western Amazonian forests. Science 2003, 299, 241–244. [Google Scholar] [CrossRef] [PubMed]
- Christensen, K.I.; Zieliński, J.; Petrova, A. Notes on the geographic distribution and ecology of Salix xanthicola (Salicaceae). Phytol. Balc. 2006, 12, 209–213. [Google Scholar]
- Douglas, G.; Meidinger, D.; Pojar, J. Illustrated Flora of British Columbia. Volume 5. Dicotyledons (Salicaceae to Zygophyllaceae) and Pteridophytes; British Columbia Ministry of Environment, Lands and Parks and British Columbia Ministry of Forests: Victoria, BC, Canada, 2000. [Google Scholar]


| Variables | Units | Utility |
|---|---|---|
| L8SR Bands | ||
| Band 2 | 0.45–0.51 μm (Blue) | Discern soil from vegetation & deciduous forest from coniferous trees |
| Band 3 | 0.53–0.59 μm (Green) | To assess plant vigour |
| Band 4 | 0.64–0.67 μm (Red) | Discrimination of vegetation slopes |
| Band 5 | 0.85–0.88 μm (NIR) | Emphasizes biomass content |
| Band 6 | 1.57–1.65 μm (SWIR 1) | Moisture content of soil and vegetation |
| Band 7 | 2.11–2.29 μm (SWIR 2) | Moisture content of soil and vegetation |
| Topographic variables | ||
| Elevation | 1023–2120 m | Species habitat |
| Slope | 0–67° | Stability of soil |
| TWI | 0–23 unit less | Soil water conditions |
| Aspect sine | (-)1–1 | Sun exposure |
| Aspect cosine | (-)1–1 | Sun exposure |
| Curvature | Complex |
| L8SR Bands | |||||||||||
|---|---|---|---|---|---|---|---|---|---|---|---|
| Birch | Cedar | Larch | Willow | ||||||||
| Variable | VI (%) | PI (%) | Variable | VI (%) | PI (%) | Variable | VI (%) | PI (%) | Variable | VI (%) | PI (%) |
| Band 3 | 54 | 63.3 | Band 4 | 38 | 31 | Band 4 | 76 | 66 | Band 5 | 46 | 57 |
| Band 5 | 17 | 7.7 | Band 5 | 37 | 1 | Band 5 | 19 | 19 | Band 2 | 31 | 8 |
| Band 4 | 13 | 7.3 | Band 2 | 10 | 13 | Band 6 | 2 | 3 | Band 6 | 14 | 0 |
| Band 7 | 8 | 4.1 | Band 6 | 9 | 33 | Band 2 | 2 | 10 | Band 3 | 6 | 33 |
| Band 2 | 6 | 11.7 | Band 3 | 6 | 6 | Band 3 | 0 | 2 | Band 4 | 4 | 2 |
| Band 6 | 2 | 5.9 | Band 7 | 1 | 16 | Band 7 | 0 | 0 | Band 7 | 0 | 0 |
| L8SR Bands Combined with Topographic Variables | |||||||||||
|---|---|---|---|---|---|---|---|---|---|---|---|
| Birch | Cedar | Larch | Willow | ||||||||
| Variable | VI (%) | PI (%) | Variable | VI (%) | PI (%) | Variable | VI (%) | PI (%) | Variable | VI (%) | PI (%) |
| Asp. cos | 23 | 13 | Elev. | 54 | 34 | Band 4 | 34 | 33 | Elev. | 65 | 47 |
| Slope | 20 | 21 | Band 5 | 14 | 2 | Curv. | 21 | 11 | Slope | 30 | 46 |
| Band 3 | 18 | 19 | TWI | 11 | 8 | Asp.sin | 18 | 19 | Band 5 | 4 | 4 |
| Band 5 | 9 | 2 | Slope | 5 | 3 | Asp.cos | 13 | 13 | Curv. | 1 | 3 |
| Elev. | 7 | 4 | Band 4 | 3 | 26 | Band 5 | 7 | 6 | TWI | 0 | 0 |
| Band 2 | 5 | 15 | Asp.cos | 3 | 4 | Band 6 | 3 | 3 | Band 7 | 0 | 0 |
| Band 4 | 5 | 9 | Curv. | 3 | 5 | Slope | 2 | 4 | Band 6 | 0 | 0 |
| TWI | 4 | 1 | Band 2 | 2 | 4 | Band 2 | 2 | 5 | Band 4 | 0 | 0 |
| Band 7 | 3 | 3 | Band 6 | 1 | 4 | Band 3 | 1 | 1 | Band 3 | 0 | 0 |
| Asp. sin | 3 | 6 | Asp.sin | 1 | 2 | TWI | 1 | 4 | Band 2 | 0 | 0 |
| Curv. | 2 | 2 | Band 3 | 1 | 7 | Elev. | 0 | 2 | Asp.sin | 0 | 0 |
| Band 6 | 1 | 5 | Band 7 | 0 | 1 | Band 7 | 0 | 0 | Asp.cos | 0 | 0 |
| Tree Species | L8SR Bands | L8SR Bands with Topographic Variables | Pairwise t-Test (Testing Set) | ||
|---|---|---|---|---|---|
| Training | Testing | Training | Testing | p-Value | |
| Birch | 0.74 | 0.67 | 0.81 | 0.70 | <0.01 |
| Cedar | 0.88 | 0.84 | 0.93 | 0.91 | <0.01 |
| Larch | 0.54 | 0.54 | 0.68 | 0.66 | <0.01 |
| Willow | 0.76 | 0.65 | 0.99 | 0.98 | <0.01 |
| L8SR Bands Only | L8SR Bands with Topographic Variables | |||||||
|---|---|---|---|---|---|---|---|---|
| Tree Species | Birch | Cedar | Larch | Willow | Birch | Cedar | Larch | Willow |
| Producer’s Accuracy | 0.28 | 0.66 | 0.95 | 0.85 | 0.55 | 0.75 | 0.96 | 0.93 |
| User’s Accuracy | 0.82 | 0.95 | 0.62 | 1.0 | 0.92 | 0.96 | 0.77 | 0.50 |
| Kappa coefficient = 0.52 | Kappa coefficient = 0.70 | |||||||
| Overall accuracy = 71.0% | Overall accuracy = 81.0% | |||||||
© 2019 by the authors. Licensee MDPI, Basel, Switzerland. This article is an open access article distributed under the terms and conditions of the Creative Commons Attribution (CC BY) license (http://creativecommons.org/licenses/by/4.0/).
Share and Cite
Chiang, S.-H.; Valdez, M. Tree Species Classification by Integrating Satellite Imagery and Topographic Variables Using Maximum Entropy Method in a Mongolian Forest. Forests 2019, 10, 961. https://doi.org/10.3390/f10110961
Chiang S-H, Valdez M. Tree Species Classification by Integrating Satellite Imagery and Topographic Variables Using Maximum Entropy Method in a Mongolian Forest. Forests. 2019; 10(11):961. https://doi.org/10.3390/f10110961
Chicago/Turabian StyleChiang, Shou-Hao, and Miguel Valdez. 2019. "Tree Species Classification by Integrating Satellite Imagery and Topographic Variables Using Maximum Entropy Method in a Mongolian Forest" Forests 10, no. 11: 961. https://doi.org/10.3390/f10110961
APA StyleChiang, S.-H., & Valdez, M. (2019). Tree Species Classification by Integrating Satellite Imagery and Topographic Variables Using Maximum Entropy Method in a Mongolian Forest. Forests, 10(11), 961. https://doi.org/10.3390/f10110961


