Abstract
Eucalyptus pellita has rapidly emerged as the species that has replaced Acacia mangium in broad-scale commercial plantations in Indonesia following widespread losses due to disease and in soils that have suffered a steady decline in phosphorus (P) under plantation forestry. Conversion from a nitrogen (N)-fixing to a non-N fixing species is expected to change the nutrient dynamics and the management required to maximise productivity. In this study in South Sumatra, responses of E. pellita to the application of N, P, potassium (K) and calcium (Ca) fertilisers were assessed at a number of trials on sites with varying site history; A. mangium was planted at one site to compare the species’ responses to N and P. The growth of E. pellita responded significantly (p < 0.01) to P’s application but not to N, K or Ca, with the addition of P increasing the stem volume by 32.6 m3 ha−1 at 3 years of age compared with no addition of P fertiliser; the demand for P in the first two years of growth was, respectively, 4.8 and 6.8 kg ha−1. This positive and large response appears to be because E. pellita has a lower efficiency in its use of P than A. mangium and is, therefore, more responsive than A. mangium to the addition of P. The reason for the lack of response to N remains unclear, although demand for N as well as K and Ca was high. These results suggest that sites recently converted to E. pellita from A. mangium and also new ex-native forest sites will be likely to only respond to P addition and that the response of E. pellita is likely to be greater than for A. mangium to maximise yield. At present, additional N, Ca or K fertilisers are not required, but this may change in the future.
1. Introduction
The mainstay of the plantation sector in Indonesia for over 20 years has been two acacia species, Acacia mangium on mineral soils and A. crassicarpa on peatland. However, since the mid-2000s, the A. mangium resource on mineral soils has been subject to substantial threats from two key diseases, Ganoderma philippii [1] and Ceratocystis spp. [2]. To maintain plantation productivity, the forest industry was forced to rapidly introduce a replacement species, Eucalyptus pellita [3]. This study addresses the potential challenges to nutrient management that are confronted when an N-fixing species is replaced with a non-N-fixing species.
Before the species switch, multiple (commonly at least three) previous rotations of A. mangium have already depleted the nutrient status of the soil, especially P [4], a key element associated with N fixation [5]. By contrast, the slash or harvesting residue and litter of A. mangium plantations contain high quantities of N [4]. This is recycled through the soil and linked to the capacity of this species to fix atmospheric N by up to 213 kg N ha−1 at 18 months of age [6]. This raises two questions. Are levels of soil P sufficient? Is this accumulation of N both sufficient and available, to support the growth of a fast-growing non-N fixing species, such as E. pellita, without additional P and N fertiliser supplementation?
The application of P fertiliser is required to maximise the productivity of A. mangium across a wide range of site conditions in South Sumatra [7,8]. This observation was supported by the finding that soil-extractable P had declined over the course of a second rotation of A. mangium, also in South Sumatra; exchangeable K and Ca also declined [9]. In Riau in Central Sumatra, extractable P and exchangeable Ca under an A. mangium plantation were about half their levels at planting by 5 years of age, and exchangeable K had declined by age 3 years [10]. This suggests that nutrients other than N and P may influence productivity following the conversion from a leguminous (Acacia) to a non-leguminous species (Eucalyptus).
Understanding the dynamics of nutrient loss from previous rotations and the capacity of soils to sustain productivity in subsequent rotations is essential. Previous studies have shown that P availability can limit the growth of eucalypts [11,12] with the degree of limitation decreasing with stand age; conversely with N and K, the degree of limitation increases with stand age [13]. Most research studies on the nutrient management of eucalypts have been undertaken in sub-tropical environments [12,14,15]. For E. pellita in the tropics, information about its nutrient management remains limited, and there is little available information for sites that have previously carried one or more rotations of A. mangium.
Commercial plantations which have been established to provide a sustainable supply of raw materials for the pulp and paper industry are a significant land use in Sumatra and Kalimantan. Forest industries contribute to around 3.5% of Indonesia’s GDP, and plantation harvesting alone contributes to around 1.3% of government’s taxation revenue [16]. Forestry is one of the key industries used to help develop rural and regional livelihoods in Indonesia; the pulp and paper plus the plantation sector employ over 1.5 million people [16]. Continued sustainability of this sector is critical for maintaining and enhancing wealth in the rural and regional areas.
In this study, we established a series of experiments to explore the growth responses of E. pellita on both ex-A. mangium and ex-E. pellita sites. The key objective was to evaluate responses to the application of P, N, K and Ca fertilisers to E. pellita following three rotations of A. mangium; a second objective was to evaluate differences in response according to site history. Our aim was to understand if any changes were required in nutrient management for maintaining productivity following the conversion from A. mangium to E. pellita in South Sumatra.
2. Materials and Methods
2.1. Site and Soil
Six experiments, subsequently referred to as the Core and five Satellite experiments (I–V), were established at Subanjeriji, South Sumatra (104°00′01″ E and 03° 41′00.2″ S). These sites belong to forest company, PT. Musi Hutan Persada (MHP). The topography is relatively flat and the elevation about 80 m above sea level. The climate is humid with a long-term average daily temperature of 29 °C; the mean annual maximum and minimum are 32 °C and 22 °C, respectively. The rainfall during the experimental period, measured at a nearby meteorological station, ranged from 2307 to 3186 mm y−1 with a mean of 2604 mm y−1. During the rainy season between October and May, the monthly average was 312 mm; during the dry season between May and September, it was 42 mm.
The soils at the Core and Satellite I, II and III sites are classified as Red Yellow Podsolics or Ultisols [17] derived from sedimentary rock consisting of sandy tuff and clay stone, with a dominant clay texture, acidic pH and low exchangeable K, Ca and Mg (Table 1). Extractable Bray P at the Core site was less than at the Satellite sites, although all had a low level; organic C varied between 2.8% and 3.5% and total N between 0.07% and 0.17% (Table 1).

Table 1.
Soil properties at 0–20 cm depth at the Core and Satellite I, II and III experiments.
2.2. Treatment and Design
The Core experiment was established on a site that had previously grown three rotations of A. mangium. The third rotation had been harvested at age 4 y when the mean tree height (H), diameter at breast height (D, 1.3 m) and standing volume (V) were 14.7 m, 13.3 cm and 94.2 m3 ha−1, respectively. The treatments were comprised of a factorial combination of three rates of N (0, 40 and 120 kg N ha−1, applied as urea) and two rates of P (0 and 30 kg P ha−1, applied as triple super phosphate) fertiliser. There were four additional treatments of K fertiliser (0, 35 and 70 kg K ha−1, applied as potassium chloride) and Ca as lime (2500 kg hydrated lime ha−1). The K fertiliser treatments also received 40 kg N ha−1 and 30 kg P ha−1; the Ca as lime treatment received no other fertilisers. The P fertiliser was applied at the base of the 20 × 20 × 20 cm planting hole at planting time. N and K fertilisers were given as a split dosage: one-third was applied at age 2 months and two-thirds at 4 months after planting, on each occasion buried at 10 cm depth in a semi-circular furrow, 30 cm from the tree. The Ca treatment was broadcast evenly across the plots one month after planting. In addition, two treatments planted to A. mangium were included, with P fertiliser applied at 0 and 30 kg P ha−1 (Table 2). The experiment was laid out as a randomised complete block design with five replicates. In total there were 49 trees per plot, with one buffer row surrounding a net measure plot of 25 trees. To quantify tree biomass and nutrient uptake, each replicate had one plot reserved for destructive sampling which was fertilised with 30 kg P ha−1, 40 kg N ha−1 and 35 kg K ha−1. Tree spacing was 3 × 3 m.
Table 2.
Treatments applied in the Core experiment.
The Satellite I experiment was established on a site that had formerly carried three rotations of A. mangium; and Satellite II on a site that had formerly carried one rotation of A. mangium and then one rotation of E. pellita; at harvest, the previous rotations were, respectively, 4 and 9 years old. Both experiments received two rates of N fertiliser (0 and 120 kg N ha−1). All treatments also received basal P at 30 kg P ha−1 and K at 35 kg K ha−1. The methods of fertiliser application, plot design and tree spacing were the same as for the Core experiment; each used a randomised complete block design with four replicates.
To better understand the responses of E. pellita to N and P fertiliser in an environment where acacias had not been grown previously, the Satellite III experiment was established on an ex-secondary forest site. The treatments were a factorial combination of two rates of P fertiliser (0 and 30 kg P ha−1) and three rates of N fertiliser (0, 40 and 120 kg N ha−1).
The Satellite IV and V experiments were established respectively, on ex-A. mangium and ex-E. pellita sites. These were respectively treated with N fertiliser at five rates (0, 30, 60, 90 and 120 kg N ha−1) and four rates (0, 30, 60 and 160 kg N ha−1). A basal rate of 12 kg ha−1 of P fertiliser was applied to all treatments at planting time.
The Core and Satellite I and II experiments were established in February 2012; the Satellite III–V experiments were established 1–2 years later. All experiments were planted with seedlings grown from first-generation seed harvested from a seedling seed orchard based on seed collected from South Serissa Village (Papua New Guinea) provenance for E. pellita and Muting-Merauke (Papua, Indonesia) provenance for A. mangium. Weeds were controlled through blanket application of 2.5 l ha−1 of glyphosate at age 3 months, and glyphosate + metsulfuron-methyl (150 g ha−1) at age 6 months; then, six-monthly until 2 years of age; then, annually until the end of rotation.
2.3. Measurements and Data Analysis
In the Core and Satellite experiments, total height, H (to 0.1 m) and diameter at breast height, D (to 0.1 cm) were measured annually up to 3 years of age. Individual stem volume, v, was calculated as:
where F is a form factor that accounts for the shape of the stem of A. mangium (0.45 [18]) and E. pellita (0.48 [19]), and V for each treatment are the sum of individual tree volume (v) per plot converted to a per hectare basis. The volume response to P fertiliser (m3 ha−1) was assessed as the difference between the productivity of non-fertilised and fertilised treatments. A proportional response expressed as percentage was calculated as the volume response to fertilised treatment divided by the volume of non-fertilised treatment.
v = 0.25 π D2 H F,
A two-way analysis of variance (ANOVA) of H, D, V and survival was performed using GenStat statistical software (VSN International, Rothamsted). The probability level used to determine significance was p < 0.05.
To estimate biomass and nutrient content, in the Core experiment, 8–10 trees representing the D distribution were harvested annually from the destructive sampling plots. Biomass components were separated into stem (>5 cm), bark, branches and leaves [4]. Sub-samples of each component were dried at 76 °C to constant weight then analysed by the R&D laboratory of PT.RAPP (Riau, Indonesia) using the following methods:
- N by H2SO4 digestion and then Kjeldahl analysis;
- P, K and Ca and Mg in HNO3 and HClO4 digests. P by spectrophotometer, K by flame photometer and Ca and Mg by atomic absorption spectrophotometer.
Allometric equations were developed to describe the relationships between diameter at breast height and biomass components (Table 3) which were then applied to the plot level to estimate above-ground biomass production and nutrient content.
Table 3.
Dry weight biomass prediction equations.
3. Results
3.1. Response to N Fertiliser
The survival rates across all treatments in the core and satellite experiments at age 3 y were ≥82% in the Core and ≥62% in the Satellite treatments. There were no responses to N fertiliser (Table 4 and Table 5). However, there was a consistent, though non-significant (p = 0.26) trend that resulted in 4–9.5 m3 ha−1 higher productivity following application of N in the Core experiment (Table 4). The Satellite experiments also had non-significant responses to N fertiliser (p = 0.32–0.78) across all sites (Table 5).
Table 4.
Growth and survival of Eucalyptus pellita to various fertiliser treatments at the Core experiment at Gemawang at 3 years of age.
Table 5.
Response to application of N fertiliser at the Satellite sites at 3 years of age.
3.2. Response to P Fertiliser
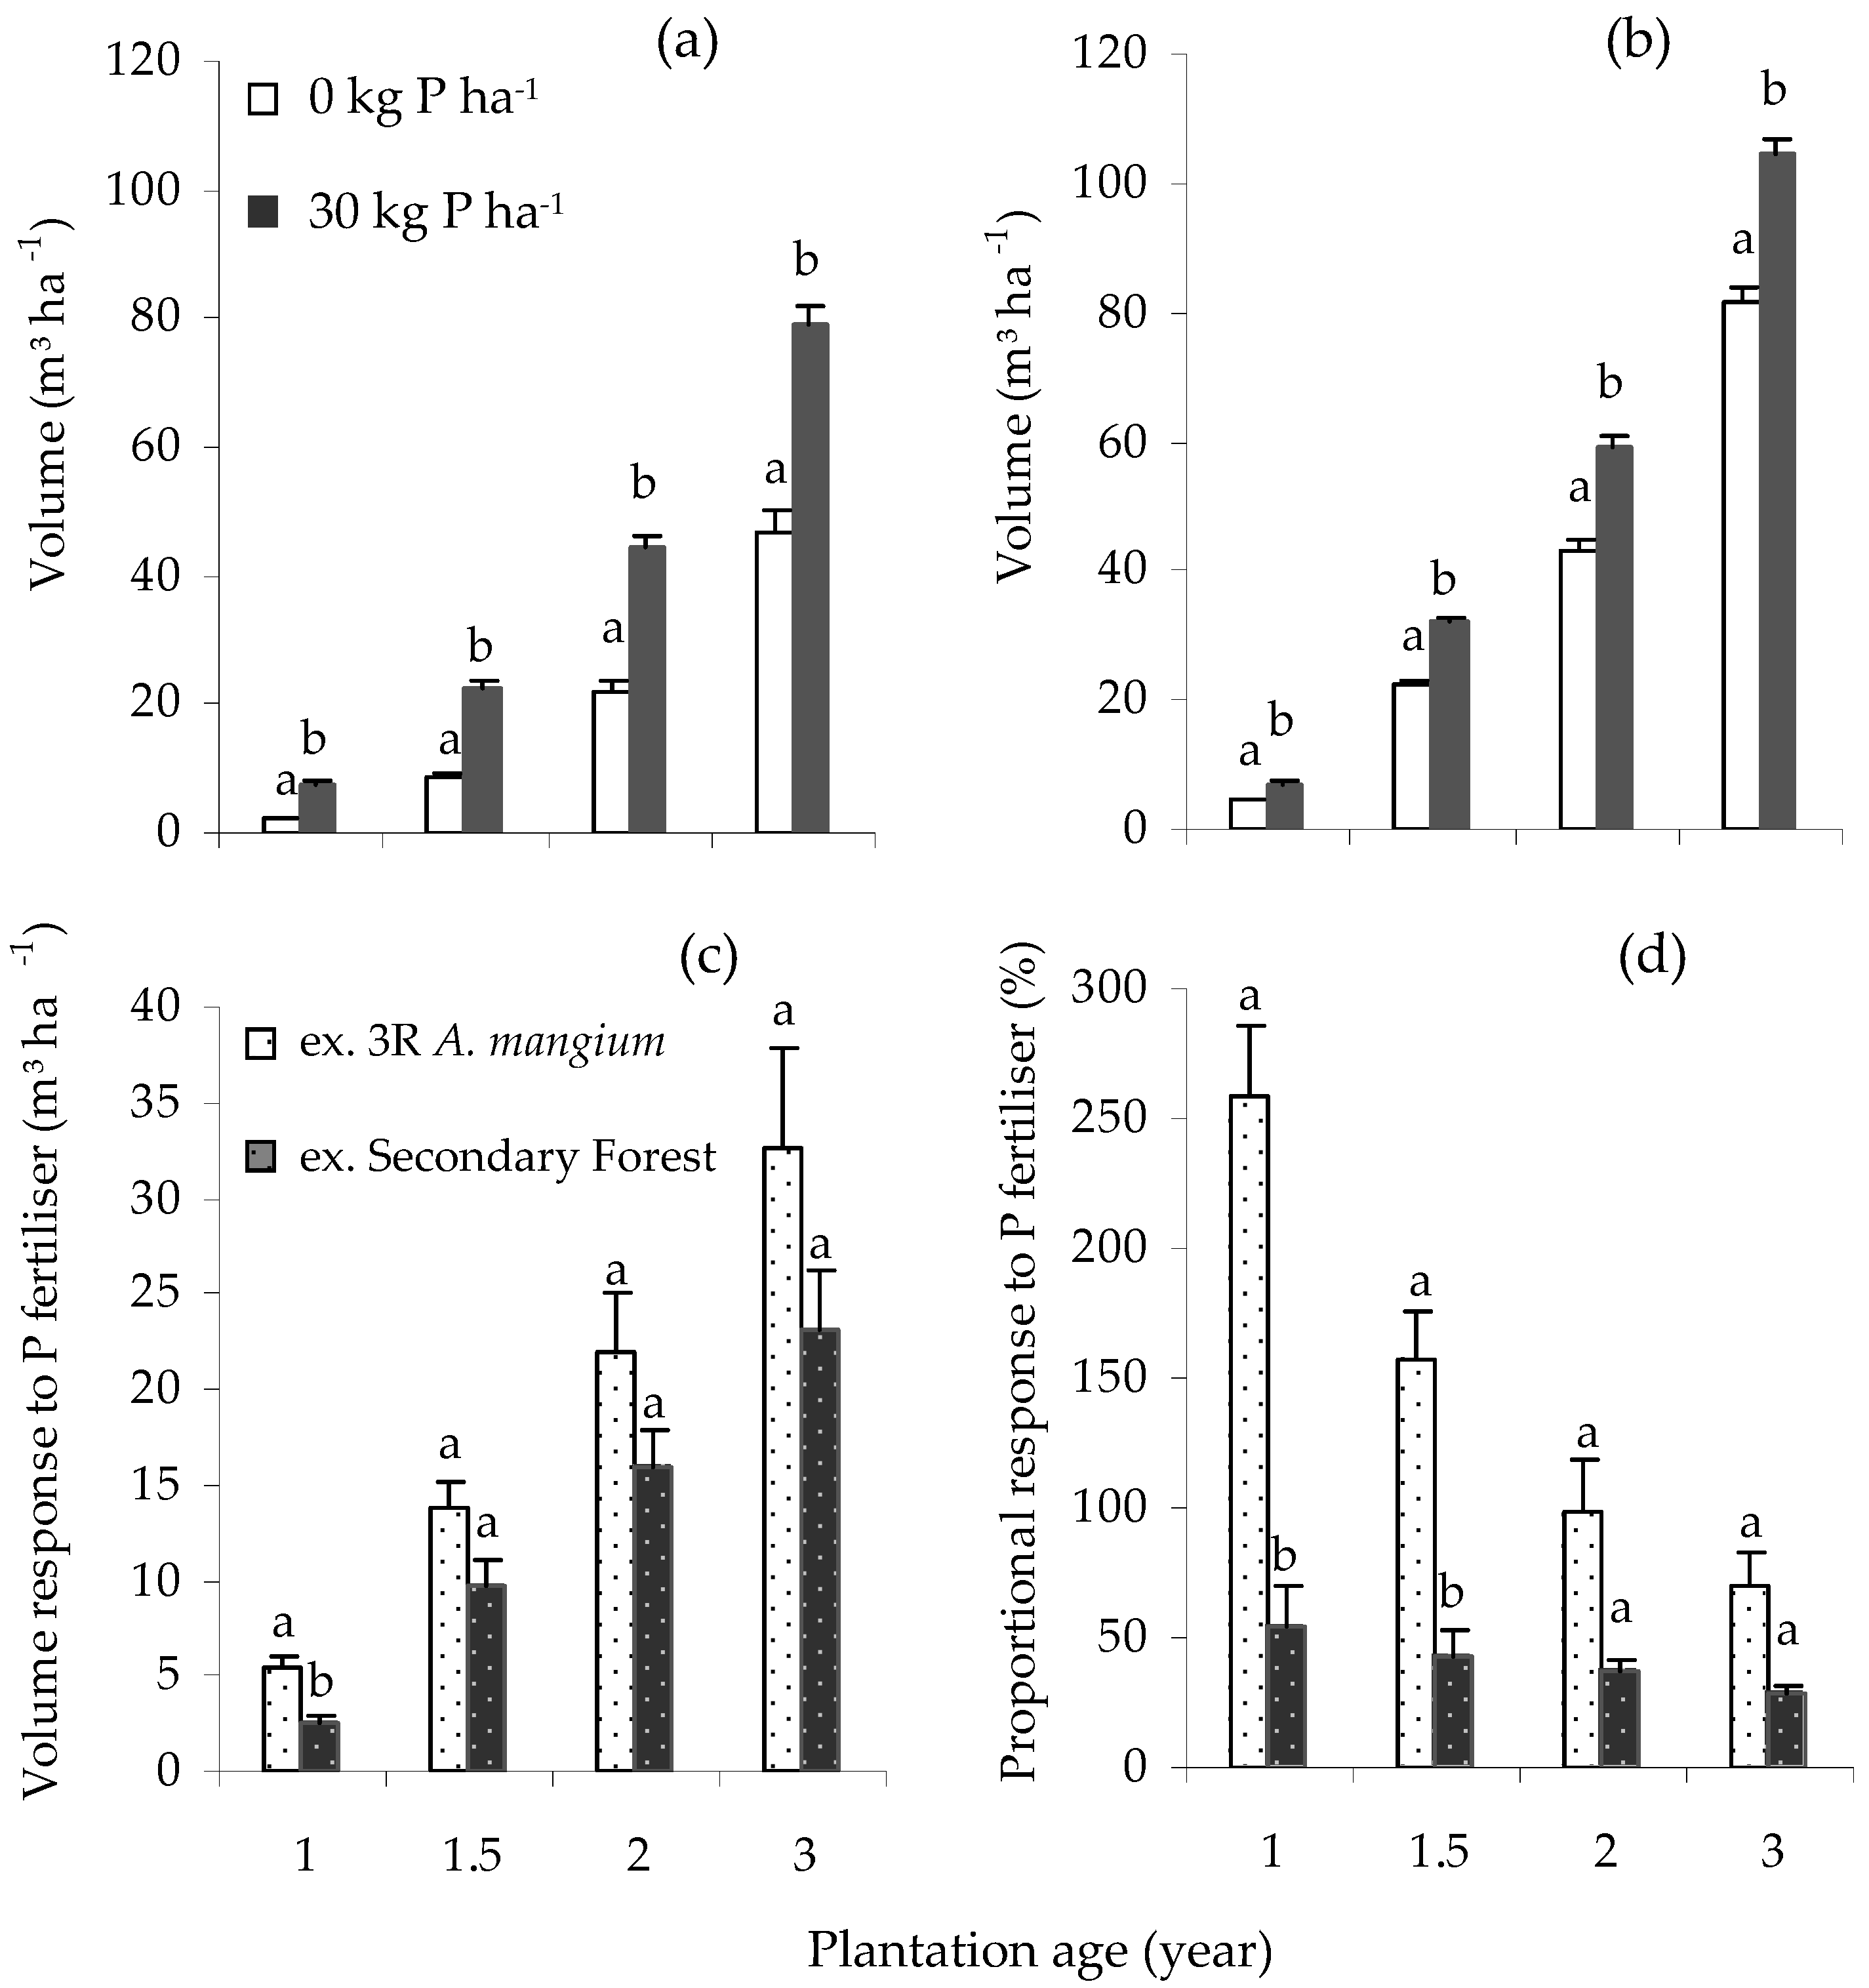
Application of P fertiliser led to a significant increase (p < 0.0001) in V in the Core and the ex-secondary forest Satellite III experiments between ages 1 and 3 years old (Figure 1a,b). At the Core site, after 3 y, the mean H, D and V were 13.5 m, 12.5 cm and 79.3 m³ ha−1, and 10.9 m, 9.5 cm and 46.7 m³ ha−1, respectively, in the 30 and 0 kg P ha−1 treatments (Table 4), equivalent to an increase in yield of 32.6 m³ ha−1 (Figure 1c). At ages 1 to 3 y, application of P fertiliser resulted in a 259% to 70% and 54% to 28% higher V in the Core and Satellite III experiments, respectively (Figure 1d). The interaction between N and P fertiliser was not significant at both the Core (p = 0.52), and the ex-secondary forest Satellite III (p = 0.065) experiments.

Figure 1.
Response to P across plantation ages: standing volume, V, between P0 and P30 at (a) Core Gemawang; (b) Satellite III secondary forest; (c) V response to P; (d) proportional V response to P. Error bars represent one standard error. Volume response is the difference between the volume of unfertilised and fertilised treatment, while proportional response is volume response divided by the volume of unfertilised treatment (expressed as a percentage). Within the same planting age, bars having the same letter did not differ significantly according to ANOVA (p < 0.05).
3.3. Response to K and Ca Applications
There were no significant responses to the applications of K and Ca fertilisers in the Core experiment (Table 4), although there was a non-significant increase in V between 1%–6% at age 3 y following application of 35 or 70 kg K ha−1; this was marginally greater than the N response (Table 4). Similarly, the treatment receiving 2500 kg lime ha−1 had a standing volume, V about 12.8% greater than in the unfertilised treatment. As these responses were non-significant, they are not discussed further.
3.4. Biomass and Nutrient Accumulation
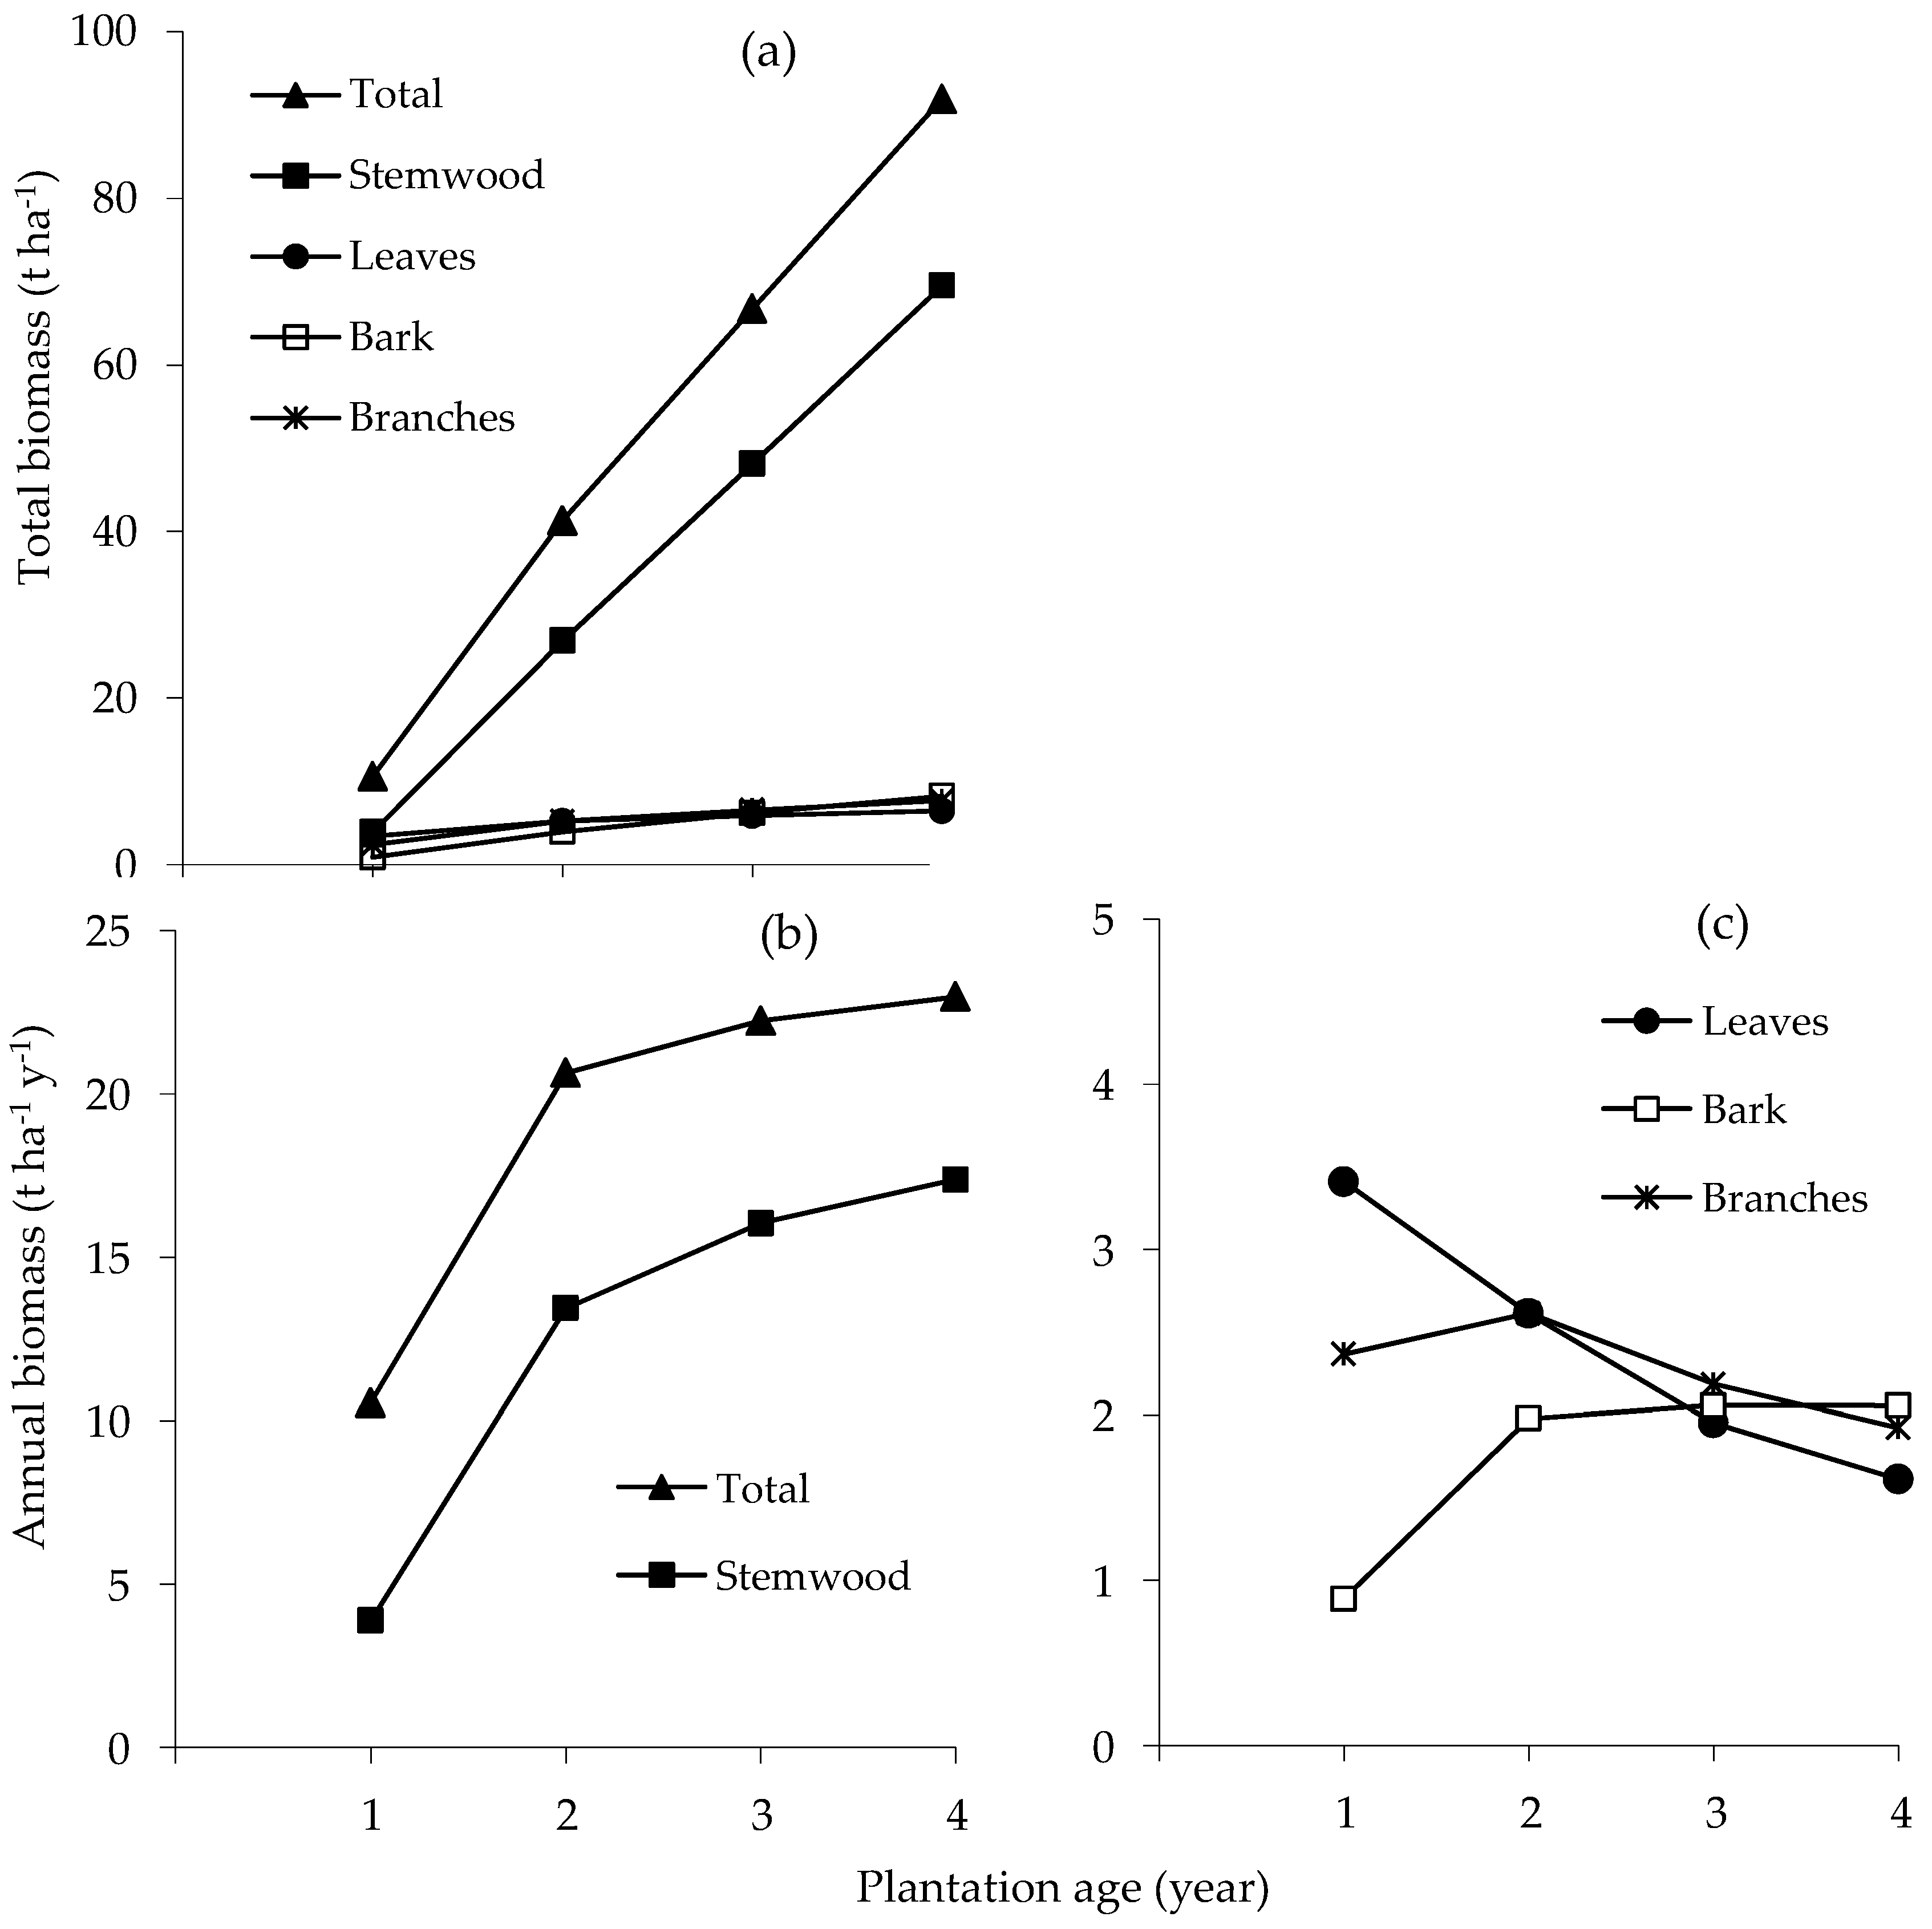
The total and mean annual rate of above-ground biomass production steadily increased during the first four years of growth (Figure 2a,b). Estimated total biomass at age 4 y was 91.9 t ha−1 of which stemwood contributed 75.6%, bark 9.0%, leaves 7.0% and branches 8.4%. The mean annual rate of biomass accumulation of stemwood and bark increased until age 4 y; for branches it increased until age 2 y and then declined, and for leaves it declined from age 1 y (Figure 2b,c).
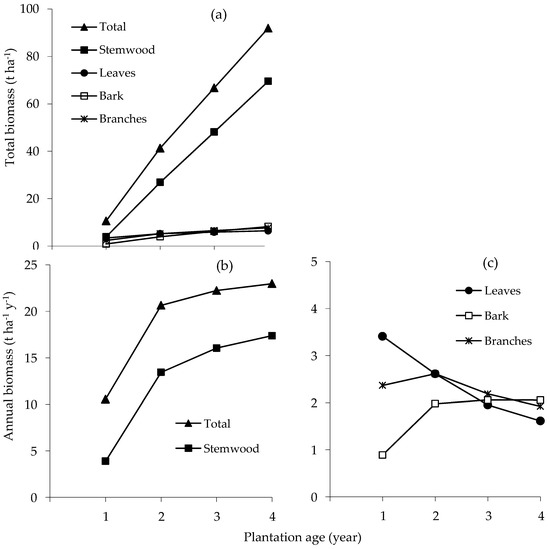
Figure 2.
Accumulation of total biomass (a); mean annual rate of accumulation of total and stemwood (b); and leaf, bark and branch biomasses (c) of E. pellita with stand age.
The nutrient accumulated in the greatest quantity by the stand was N, followed by K, Ca, Mg and P (Figure 3). These nutrients were predominantly stored in stems and leaves followed by the branches and bark. In the first year, leaves represented 84% of N, 54.9% of P, 44.6% of K, 62.1% of Ca and 68.1% of Mg accumulated; in the fourth year those values fell to 19.7%, 22.8%, 15.6%, 26.6% and 31.2%, respectively. In contrast, the proportions accumulated in stem and bark increased with age. In the first and fourth years, stem represented, respectively, 8.3%, 22.7%, 24.3%, 10.9% and 11.1%, and then 62.4%, 58.6%, 57%, 46.6% and 45.2% of N, P, K, Ca and Mg.
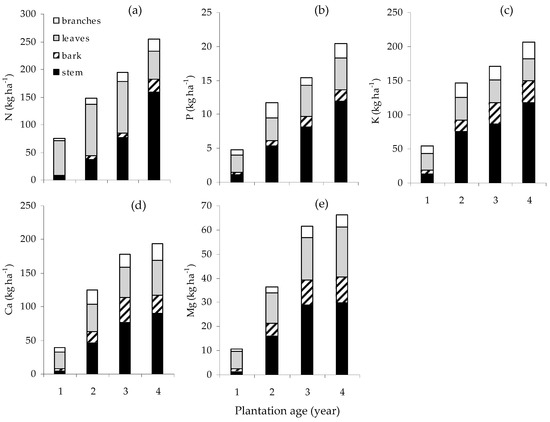
Figure 3.
Accumulation of N (a), P (b), K (c), Ca (d) and Mg (e) contents (kg ha−1) of E. pellita with plantation age.
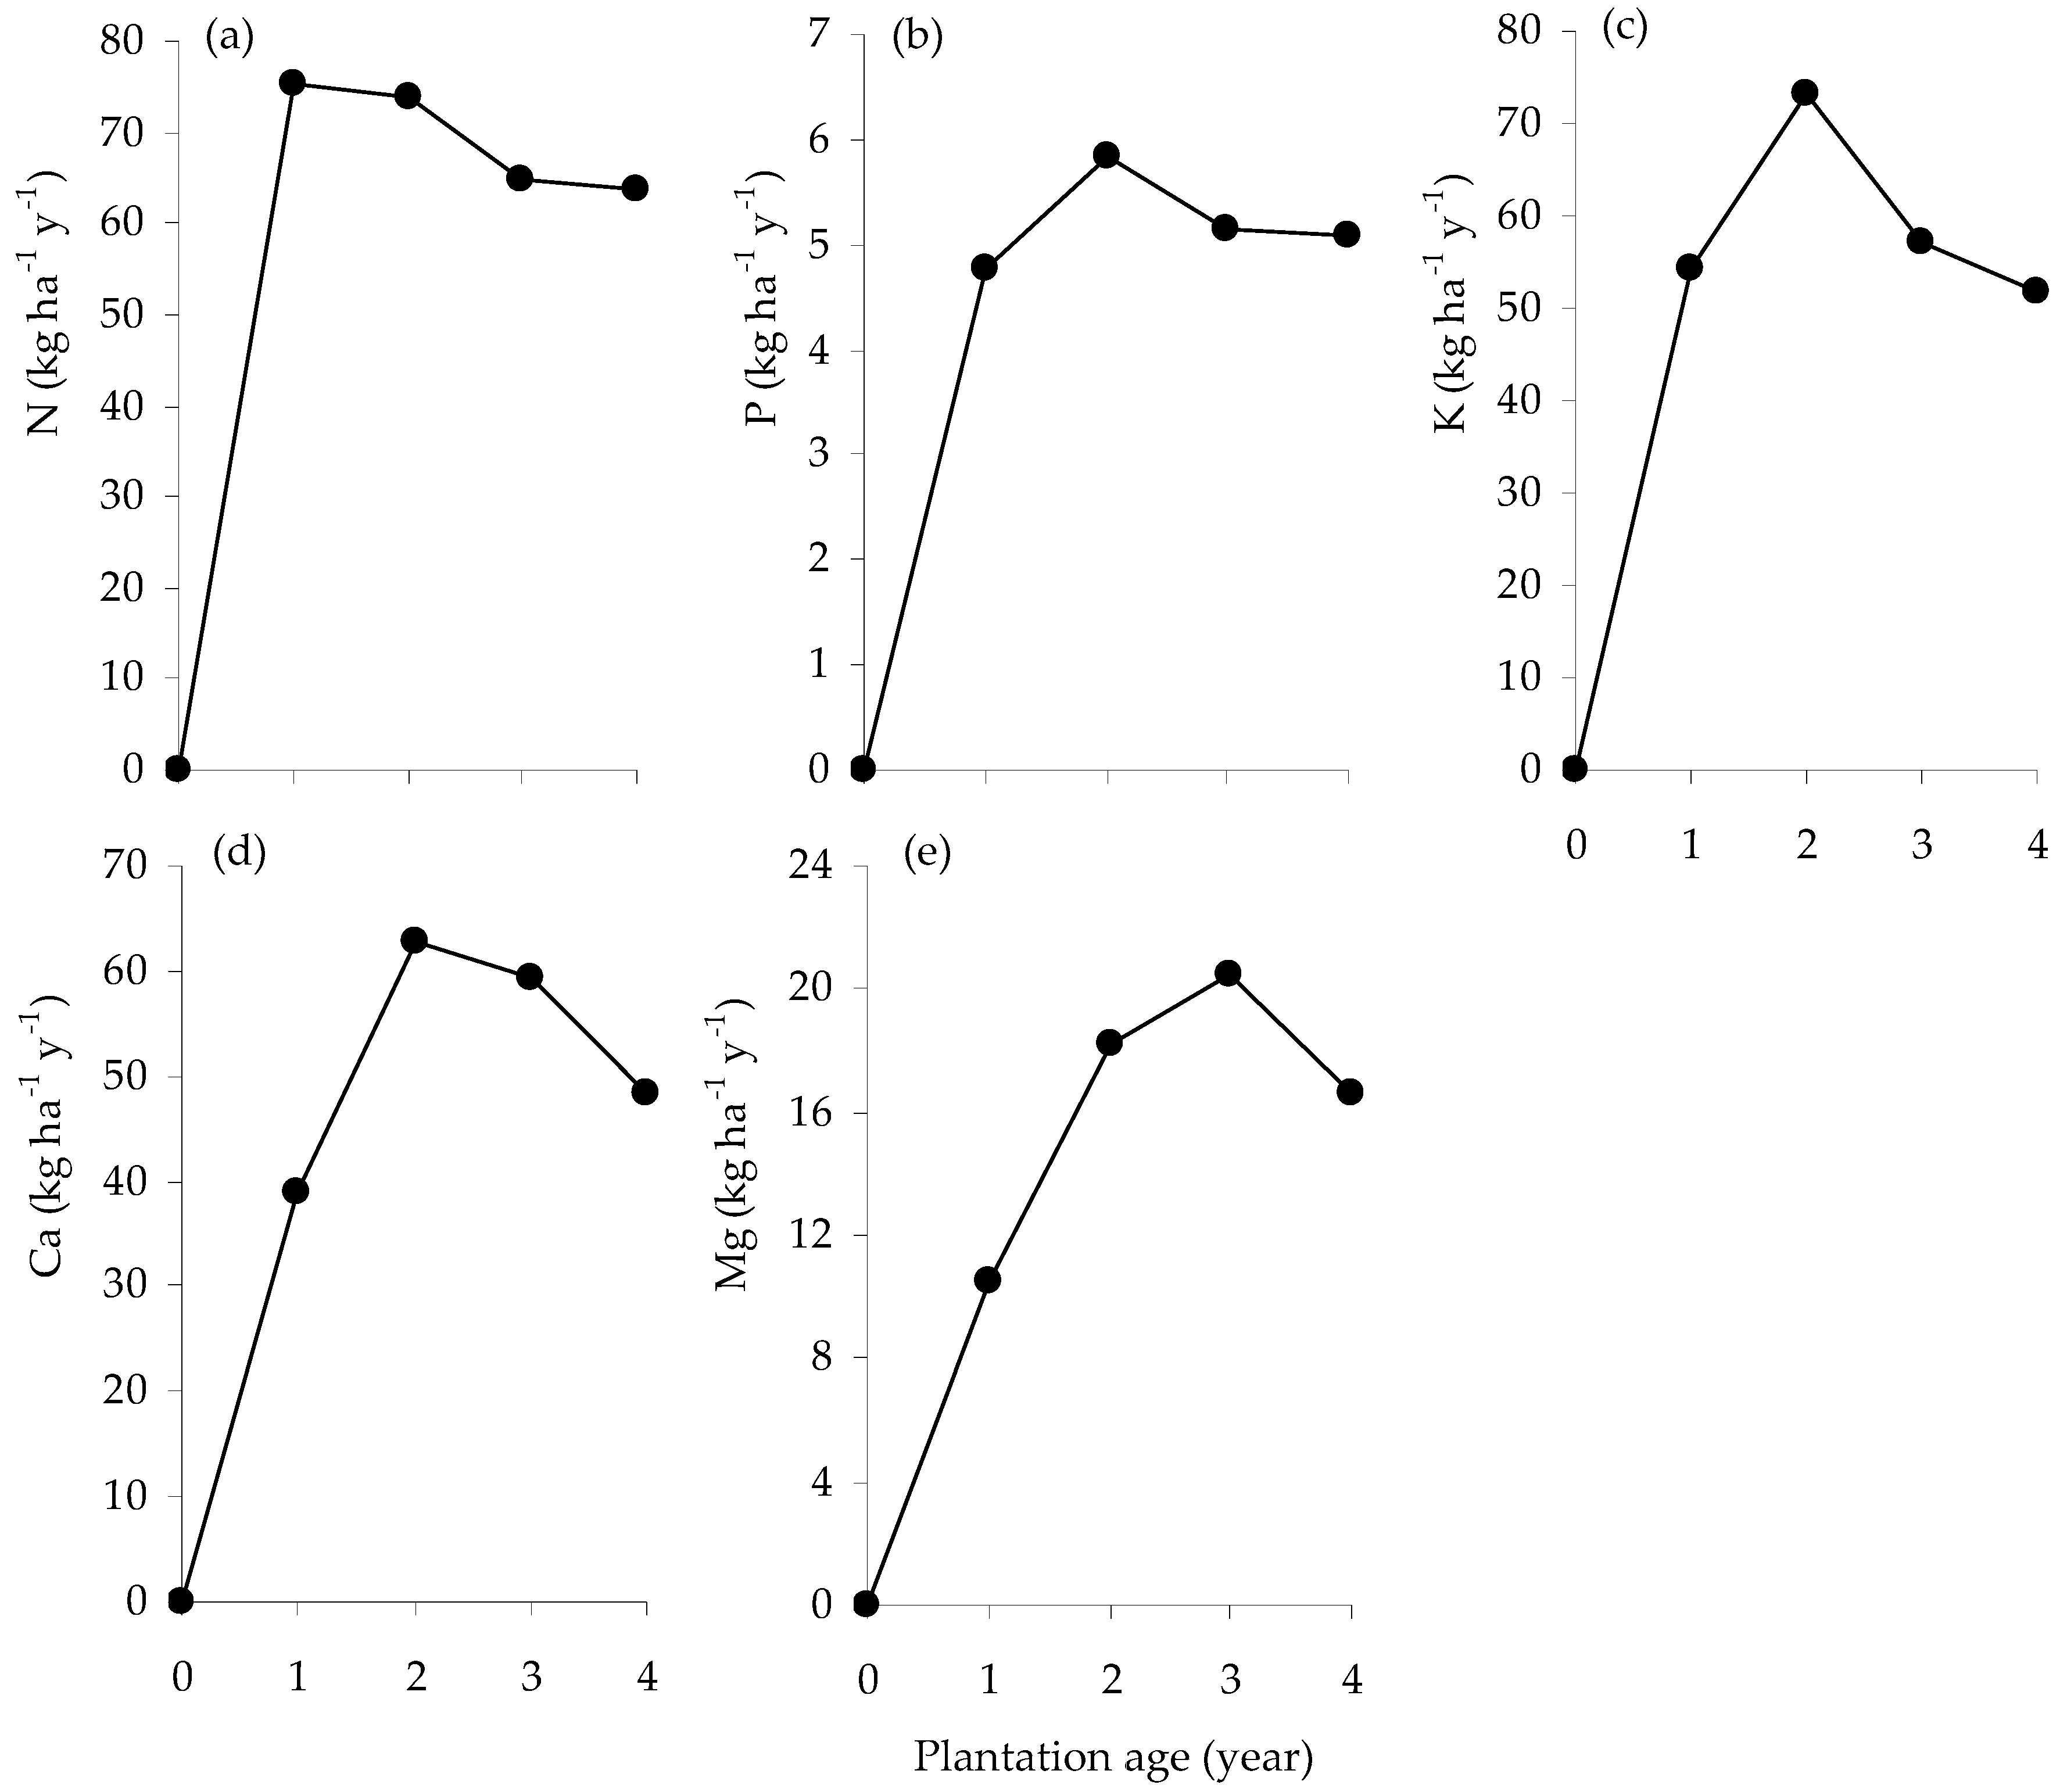
The annual rate of N uptake peaked at age 1 y at around 75 kg ha−1 y−1 (Figure 4a); P, K and Ca uptake continued to increase between age 1 and 2 y, and then declined (Figure 4b–d); Mg uptake peaked at age 3 y and then declined (Figure 4e).

Figure 4.
Mean annual rate of N (a), P (b), K (c), Ca (d) and Mg (e) accumulation (kg ha−1 y−1) in the standing biomass of E. pellita with plantation age.
3.5. A. mangium versus E. pellita Productivity
In the Core experiment, there were significant differences (p < 0.01) in the growth of A. mangium and E. pellita, with both demonstrating significant responses to P (p < 0.01) until age 1.5 y (Figure 5a). At this age, the stem volumes of A. mangium and E. pellita were 23.2 and 20.1 m3 ha−1, respectively, in the 30 kg P ha−1 treatments, and 17.5 and 8.5 m3 ha−1, respectively, in the 0 kg P ha−1 treatments. However, growth responses to P were up to three-fold greater for E. pellita than A. mangium (Figure 5b,c). Because of wilt disease caused by Ceratocysis sp., the survival of A. mangium was severely compromised towards the end of the second and in the third year of growth and was significantly less than for E. pellita from age 1.5 y (Figure 5d). By age 3 y, the survival of A. mangium was around 34%, while that of E. pellita was around 87%. Despite this difference, average individual tree sizes were similar between A. mangium treatments at age 3 y (0.063 m3 tree−1), suggesting that differences in standing volume were mainly due to survival.
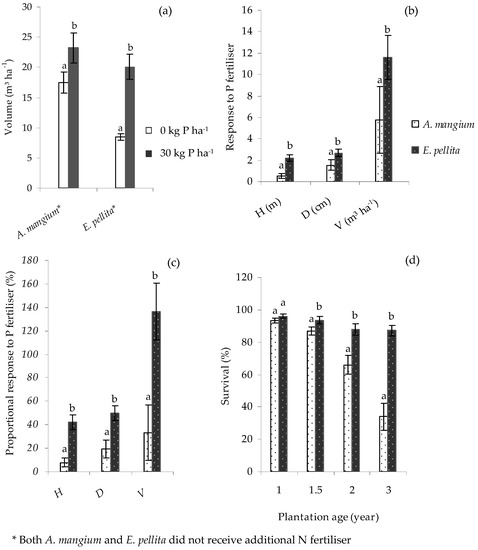
Figure 5.
Standing volume, V of Acacia mangium and E. pellita (a); and absolute (b) and proportional (c) growth responses to P fertiliser at age 1.5 y in the Core experiment; and survival rates at ages 1–3 y (d). An error bar represents one standard error. Volume response is the difference between the volume of unfertilised and fertilised treatment, while proportional response is volume response divided by the volume of unfertilised treatment, expressed as a percentage. Within the same species or planting age, bars having the same letter did not differ significantly according to ANOVA (p < 0.05).
4. Discussion
This study found that the application of fertiliser at establishment can increase the productivity of E. pellita at age 3 y by up to 70% and contribute to a total mean annual increment (MAI) of up to 26 m3 ha−1 y−1. This is lower than the MAI reported in other fertilised tropical eucalypt plantations (46 m3 ha−1 y−1 [20]) but substantially higher than reported for commercial E. pellita plantations at harvest in Sumatra (15.6 to 17.6 m3 ha−1 y−1 [21]). We now discuss the basis of the fertiliser responses reported here, how these differ from those previously observed with A. mangium and strategies for increasing and sustaining yield in this relatively new E. pellita plantation estate.
4.1. Phosphorus Response
Of the nutrients applied, P provided the greatest and only significant growth responses, which were carried through until age 3 y. This demand for P in E. pellita may be associated with its low availability that has been further compromised because of a previous site history of plantation forestry. Hardiyanto and Nambiar [9] found that the extractable P in surface soil declined by one-third over the course of a seven-year 2nd rotation of A. mangium, and that this trend continued into the 3rd rotation [22]. The E. pellita volume without P applied was lower than for A. mangium suggesting that E. pellita has a lower efficiency of use of soil P (i.e., wood volume productivity per unit of soil P), a finding supported in a parallel species comparison in Central Sumatra [23]. Eucalyptus pellita has a lower efficiency of retranslocation of P out of leaves before senescence (55%–73% [24]) than A. mangium (78–88% [4,25]). However, the volume gain of E. pellita per unit of P applied was greater than A. mangium, suggesting that E. pellita is more responsive to P applied at planting and more reliant on P for maximising its productivity.
Although the absolute volume response to P increased over time, the proportional response decreased, from 259% to 70% in the Core experiment and from 54% to 28% in ex-secondary forest experiment, between ages 1 and 3 y. Hence, E. pellita grown on a site that had previously supported three rotations of A. mangium had a higher response to P than on a site recently converted from secondary forest; this was presumably related to a lower nutrient stock in the soil (Table 1) and/or perhaps changes in soil properties during the three previous rotations at the Core site. In South Sumatra, the application of 36 kg P ha−1 early in the rotation at seven sites planted to E. pellita resulted in a 38%–198% increase in stand volume at age 3 y [26]; the application of a range of P rates at planting at ten sites planted to A. mangium resulted in a 40%–180% increase in stand volume at age 1 y [8]. In A. mangium, site responsiveness is linked to a range of soil characteristics and particularly the physical characteristics of subsoil [27]. Ferreira and Stape [28] have also linked responses to fertiliser application by tropical E. urophylla in south-eastern Brazil to soil type. Although this understanding of site characteristics can be very important for determining fertiliser responses, for P in South Sumatra a single rate of 10 kg ha−1 was considered sufficient to maximise the yield at harvest for A. mangium [8], a finding linked to the lack of any significant volume response to P fertiliser application by age 6 y [9]. However, as the potential response increases with the number of rotations and as the yield of E. pellita at age 3 y was 70% greater following P application in this study, more than 10 kg ha−1 may be required to maximise growth responses.
4.2. Response of N, K and Ca Fertilisers
Growth responses to N addition were not significant, and consequently, there was no apparent effect of site history. The Core site and all Satellite sites except SIII had a history of previous A. mangium rotations that had considerable potential to add N to the soil through the litter and harvest residue; N released from these was 533–557 and 400–474 kg N ha−1 in the first and second rotations of A. mangium respectively [4]. Acacia mangium has a very large capacity to fix atmospheric N. A study conducted at a site located near the current experiments found that an A. mangium plantation was able to fix up to 213 kg N ha−1 at 18 months old [6]. Thus, the planting of an N-fixing species in previous rotations may have provided sufficient N to support the growth of E. pellita for up to two rotations. It should be noted, however, that there was no response to N at SIII following secondary forest. No growth response of E. pellita to the addition of up to 126 kg N ha−1 was reported in a fertilizer study in Central Sumatra on a site that had a previous rotation of E. pellita [29].
In spite of the lack of response to N fertiliser, the annual rate of accumulation of N into above-ground biomass was about 75 kg ha−1 y−1 in the first year of growth and totalled 255 kg ha−1 at age 4 y. While the capacity to sustain these levels of supply may be closely associated with site history, high N mineralisation was also sufficient to maximise the growth of E. grandis and E. grandis × urophylla plantations in Brazil [30] without the benefit of previous rotations of an N-fixing species. In South Sumatra, the length of time that A. mangium residues can sustain the demand for N by E. pellita remains uncertain, and a future requirement for N fertiliser may be necessary once the residues have decomposed [31]. A decomposition study in this environment [4] demonstrated that most of the leaf material had decomposed within 1 year, and 36%–39% of the twigs had decomposed within the first year, suggesting that nutrient release from the decomposing slash material from the previous rotation is likely to have been reasonably well matched to the uptake by the growing stand.
Although also taken up in quantities similar to N, there were no responses to K or Ca fertilisers. Harvest residues contain substantial quantities of these nutrients. Uptake of K by age 4 y was 207 kg ha−1; harvest residue can contain 166–190 kg K ha−1 in A. mangium [4], and 102–115 kg K ha−1 in A. auriculiformis [32]. Bich et al. [33] reported that Ca and K released from the harvest residue of A. mangium occurred very rapidly, and at a faster rate than other nutrients. Application of K fertiliser has increased the productivity of eucalypt plantations in Brazil [34] but in that case the soils were highly weathered and low in primary minerals [35] and with low exchangeable K < 8 mg kg−1 [36] compared to >40 mg kg−1 in South Sumatra. Although the content of Ca in soil declines over multiple rotations of A. mangium in South Sumatra [4], its availability remained sufficient to support the growth of these early rotations of E. pellita. Whether the demand for Ca and possibly K in subsequent rotations can be met without further supplementation remains unclear.
4.3. Biomass and Nutrient Accumulation in Standing Trees
The nutrient accumulation in standing trees paralleled the increase in total above-ground biomass. Total above-ground biomass in this study was higher than in E. pellita studied in south-eastern Brazil with the same initial spacing but different provenance (27.2 kg tree−1 at age 41 months [37]), but relatively similar to E. grandis × pellita planted in Central Sumatra (39.7–41.5 t ha−1 at age 2 y [23]). Compared with the previous A. mangium plantation, the total above-ground biomass of E. pellita in this trial was much lower (92 vs. >120 t ha−1 at age 4 y [4,10]). The annual accumulation of stem and bark biomass paralleled that of total biomass per year; leaf biomass was relatively stable after age 2 y (5.2–6.5 t ha−1). Biomass production is influenced by species, age and spacing [37]. In E. pellita, low leaf and branch biomass at age 4 y, which is also likely at the end of a rotation, indicates that potential nutrient content of the harvest residues will be lower than in the previous A. mangium rotations.
The total N and P in the above-ground biomass increased with age as did its rate of accumulation until age 4 y; the above-ground total P was substantially greater than that of E. pellita at age 41 months in south-eastern Brazil (20.4 versus 6.9 kg P ha−1 [38]). However, the accumulation of P in the first two years of growth by E. pellita (4.8 and 6.8 kg ha−1, respectively) was less than that found previously for A. mangium at two adjacent sites (around 6 and 8 kg P ha−1, respectively [4]). The total N accumulated by E. pellita at age 4 y was much lower than for A. mangium at the same age (255 versus > 400 kg ha−1 [4,10]) but also considerably higher than that of E. pellita in Brazil (165 kg ha−1 at age 41 months [38]). Likewise, the rate of nutrient accumulation in E. pellita indicated that the higher nutrient demand occurred during this growth stage.
During the first two years of growth, nutrients accumulated primarily in leaves and branches; subsequently the relative proportion of nutrients in these components declined and stem and bark became the main pools. This change was correlated with declining annual biomass production of leaves and branches and increasing production of stem and bark to age 4 y. Similarly, to build photosynthetic capacity, the growth of crown components resulted in the highest accumulation of nutrients to age 2 y in a clonal Eucalyptus plantation in Congo. Accumulation in the crown subsequently declined with increasing age [15]; in this experiment, at age 4 y, the proportion of nutrients accumulated in the stem and bark was >60% of the total. Debarking on site is an important option to retain nutrients, but on an operational scale it has proven difficult to implement in all areas. With repeated harvests, and removal of nutrients, nutrient limitations are likely to become more evident over multiple rotations of E. pellita.
4.4. Comparison of E. pellita and A. mangium Productivity
Except for the Satellite V trial that was affected by fire, E. pellita had a high survival rate, 76%–91%; in A. mangium it was only 34% at age 3 y. In this Core trial, crown damage by monkeys created portals of entry for attack by Ceratocystis mangenicans, a wilt and canker disease that leads to the death of A. mangium [39]. This limited the viability of its comparison with E. pellita to age 1.5 y when A. mangium had a similar stocking rate and 16% more standing volume. This higher mortality may have contributed in part to the lower P response (around 33%) than in E. pellita (around 136%) that was also lower than found previously in South Sumatra [8], Central Sumatra [23] and in Kalimantan [40]. The proportional response of A. mangium to P gradually declines with age [8]; in these trials, E. pellita maintained a consistently higher response with age. This confirms that A. mangium is more efficient at utilising available soil P compared to E. pellita.
5. Conclusions
After multiple rotations of A. mangium, only P application at planting consistently increased productivity of E. pellita until 3 y of age; there was no significant response to N, K or Ca. That there was no response to N fertiliser was possibly linked in part to a history of N input from the previous A. mangium rotations, but the natural soil appears to be quite N rich as there was also no response to N input on an ex-native forest site. Eucalyptus pellita was more responsive to P fertiliser than A. mangium which is probably associated with its lower efficiency for using available soil P. Consequently, more P fertiliser than for A. mangium may need to be applied to E. pellita at planting to maximise its growth. The results from this and previous studies suggest that productivity is poorer for E. pellita than A. mangium. Nevertheless, the almost two-fold difference in productivity of E. pellita achieved experimentally compared to those reported for commercial plantations in Sumatra suggests that higher yields should be obtainable with better management, albeit still less than those achievable with A. mangium. However, because available levels of soil P are declining and large quantities of N, P and K are required to sustain high rates of growth, nutrient management needs to be monitored into the future in these tropical plantation systems.
Author Contributions
Conceptualization, M.A.I., E.B.H. and D.S.M.; methodology, M.A.I., E.B.H. and D.S.M.; validation, M.A.I., E.B.H. and D.S.M.; formal analysis, E.B.H.; investigation, M.A.I., E.B.H. and D.S.M.; data curation, M.A.I. and E.B.H.; writing—original draft preparation, M.A.I.; writing—review and editing, M.A.I., E.B.H. and D.S.M.; project administration, D.S.M. and E.B.H.; funding acquisition, D.S.M. and E.B.H.
Funding
This research was financially supported by the Australian Centre for International Agricultural Research (ACIAR) through ACIAR Project FST-2014-064.
Acknowledgments
The authors wish to acknowledge the Australian Centre for International Agricultural Research (ACIAR) for funding the study through ACIAR Project FST-2014-064, and the management of PT. Musi Hutan Persada for their commitment to its implementation. We would like to especially thank Chris Beadle for the comments and suggestions that have improved the paper. We also thank to Agus Wicaksono, Joko Heriyanto, Bambang Supriadi and the Silviculture Team at the Research and Development Department of PT. Musi Hutan Persada for their field assistance with the establishment, maintenance and measuring of these trials, and the two anonymous reviewers for their valuable comments and suggestions for the manuscript.
Conflicts of Interest
The authors declare no conflict of interest.
References
- Mohammed, C.L.; Rimbawanto, A.; Page, D.E. Management of basidiomycetes root- and stem-rot diseases in oil palm, rubber, and tropical hardwood plantation crops. For. Pathol. 2014, 44, 428–446. [Google Scholar] [CrossRef]
- Tarigan, M.; Roux, J.; van Week, M.; Tjahjono, B.; Wingfield, M.J. A new wilt and die-back disease of A. mangium associated with Ceratocystis manginecans and C. acaciicvora sp. nov. in Indonesia. S. Afr. J. Bot. 2011, 77, 292–304. [Google Scholar] [CrossRef]
- Nambiar, E.K.S.; Harwood, C.E.; Mendham, D.S. Paths to sustainable wood supply to the pulp and paper industry in Indonesia after diseases have forced a change of species from acacia to eucalypts. Aust. For. 2018, 81, 148–161. [Google Scholar] [CrossRef]
- Hardiyanto, E.B.; Wicaksono, A. Inter-rotation site management, stand growth and soil properties in Acacia mangium plantations in South Sumatra, Indonesia. In Site Management and Productivity in Tropical Plantation Forests. Proceedings of Workshops in Piracicaba (Brazil) 22–26 November 2004 and Bogor (Indonesia) 6–9 November 2006; Nambiar, E.K.S., Ed.; CIFOR: Bogor, Indonesia, 2008; pp. 107–122. [Google Scholar]
- Sun, J.S.; Sands, R.; Simpson, R.J. Genotypic variation in growth and nodulation by seedlings of acacia species. For. Ecol. Manag. 1992, 55, 209–223. [Google Scholar] [CrossRef]
- Wibisono, G.; Veneklaas, E.; Mendham, D.; Hardiyanto, E.B. Nitrogen fixation of Acacia mangium Willd. from two sources grown at different levels of phosphorus in an Ultisol, South Sumatra, Indonesia. South. For. J. For. Sci. 2015, 77, 59–64. [Google Scholar] [CrossRef]
- Mendham, D.; Hardiyanto, E.B.; Sjarkowi, F.; Nurudin, M.; Soeprijadi, D.; Wicaksono, A.; Untung, S.; White, D.; Drake, P.; Rimbawanto, A. Realising Genetic Gains in Indonesia and Australian Plantations through Water and Nutrient Management Final Report FR2004/058; Australian Center for International Agricultural Research (ACIAR): Canberra, Australia, 2011; p. 88. [Google Scholar]
- Mendham, D.S.; Hardiyanto, E.B.; Wicaksono, A.; Nurudin, M. Nutrient management of contrasting Acacia mangium genotypes and weed management strategies in South Sumatra, Indonesia. Aust. For. 2017, 80, 127–134. [Google Scholar] [CrossRef]
- Hardiyanto, E.B.; Nambiar, E.K. Productivity of successive rotations of Acacia mangium plantations in Sumatra, Indonesia: Impacts of harvest and inter-rotation site management. New For. 2014, 45, 557–575. [Google Scholar] [CrossRef]
- Siregar, S.T.H.; Nurwahyudi; Mulawarman, K. Effects of inter-rotation management on Site Productivity of Acacia mangium plantation in Riau Province, Sumatra, Indonesia. In Site Management and Productivity in Tropical Plantation Forests, Proceedings of the Seventh Workshop in Piracicaba (Brazil) 22–26 November 2004 and Bogor (Indonesia) 6–9 November 2006; Nambiar, E.K.S., Ed.; CIFOR: Bogor, Indonesia, 2008; pp. 93–106. [Google Scholar]
- Gonçalves, J.L.M.; Stape, J.L.; Laclau, J.P.; Smethurst, P.; Gava, J.L. Silvicultural effects on the productivity and wood quality of eucalypt plantations. For. Ecol. Manag. 2004, 193, 45–61. [Google Scholar] [CrossRef]
- Xu, D.; Dell, B.; Yang, Z.; Malajczuk, N.; Gong, M. Effects of phosphorus application on productivity and nutrient accumulation of Eucalyptus urophylla plantation. J. Trop. For. Sci. 2005, 17, 447–461. [Google Scholar]
- Melo, E.A.S.C.; Goncalves, J.L.M.; Rocha, J.H.T.; Hakamada, R.E.; Bazani, J.H.; Wenzel, A.V.A.; Arthur-Junior, J.C.; Borges, J.S.; Malheiros, R.; Lemos, C.C.Z.; et al. Responses of clonal eucalypt plantations to N, P and K fertilizer application in different edaphoclimatic conditions. Forests 2016, 7, 2. [Google Scholar] [CrossRef]
- Silva, P.H.M.; Poggiani, F.; Libardi, P.L.; Goncalves, A.N. Fertilizer management of eucalypt plantations on sandy soil in Brazil: Initial growth and nutrient cycling. For. Ecol. Manag. 2013, 301, 67–78. [Google Scholar] [CrossRef]
- Laclau, J.P.; Deleporte, P.; Ranger, J.; Bouillet, J.P.; Kazotti, G. Nutrient dynamic throughout the rotation of Eucalyptus clonal stands in Congo. Ann. Bot. 2003, 91, 879–892. [Google Scholar] [CrossRef] [PubMed]
- ITS. The Economic Contribution of Indonesia’s Forest-Based Industries; ITS Global: Melbourne, Australia, 2011. [Google Scholar]
- Soil Survey Staff. Keys to Soil Taxonomy SMSS Technical Monograph No. 19, 5th ed.; Pocahontas Press: Blacksburg, VA, USA, 1992; p. 541. [Google Scholar]
- Siregar, S.T.H.; Alpan, U.; Ryantoko, A. Bilangan bentuk batang Acacia mangium umur 5 tahun di Subanjeriji. Technical Notes R&D. PT Musi Hutan Persada 1997, 7, 1–5. [Google Scholar]
- Supriyadi, B. Form factor of Eucalyptus pellita. Technical Notes R&D. PT Musi Hutan Persada 2011, 21, 1–5. [Google Scholar]
- Stape, J.L.; Binkley, D.; Ryan, M.G.; Fonseca, S.R.L.; Takahashi, E.N.; Silva, C.R.; Hakamada, S.R.; Ferreira, J.M.; Lima, A.M.; Gava, J.L.; et al. The Brazil Eucalyptus Potential Productivity Project: Influence of water, nutrients and stand uniformity on wood production. For. Ecol. Manag. 2010, 259, 1684–1694. [Google Scholar] [CrossRef]
- Harwood, C.E.; Nambiar, E.K.S. Productivity of acacia and eucalypt plantations in Southeast Asia. 2. Trends and variations. Int. For. Rev. 2014, 16, 249–260. [Google Scholar] [CrossRef]
- Hardiyanto, E.B.; Nambiar, E.K.S.; Inail, M.A. Challenges to Site Management During Large-scale Transition from Acacia mangium to Eucalyptus pellita in Short Rotation Forestry on Mineral Soils in Sumatra, Indonesia. In Proceedings of the IUFRO Eucalypt Conference 2015, Zhanjiang, China, 21–24 October 2015; p. 9. [Google Scholar]
- Siregar, S.T.H.; Wawan; Adiwirman. Effect of fertilization on the growth and biomass of Acacia mangium and Eucalyptus hybrid (E. grandis × E. pellita). J. Trop. Soils 2015, 20, 157–166. [Google Scholar]
- Inail, M.A.; Hardiyanto, E.B.; Supriyadi, B. Inter-rotation site management of Eucalyptus pellita after three successive rotations of Acacia mangium. In Proceedings of the IUFRO INAFOR Joint International conference, Yogyakarta, Indonesia, 24–27 July 2017; p. 91. [Google Scholar]
- Inagaki, M.; Kamo, K.; Miyamoto, K.; Titin, J.; Jamalung, L.; Lapongan, J.; Miura, S. Nitrogen and phosphorus retranslocation and N:P ratios of litterfall in three tropical plantations: Luxurious N and efficient P use by Acacia mangium. Plant Soil 2011, 341, 295–307. [Google Scholar] [CrossRef]
- Inail, M.A.; Thaher, E. Dosis optimum TSP dalam memaksimalkan produktifitas Eucalyptus pellita. Technical Notes R&D. PT Musi Hutan Persada 2016, 26, 1–6. [Google Scholar]
- Nurudin, M.; Ohta, S.; Hardiyanto, E.B.; Mendham, D.; Wicaksono, A.; Heriyanto, J.; Watanabe, M. Relationships between soil characteristics and productivity of Acacia mangium in South Sumatra. Tropics 2013, 22, 1–12. [Google Scholar] [CrossRef]
- Ferreira, J.M.A.; Stape, J.L. Productivity gains by fertilisation in Eucalyptus urophylla clonal plantations across gradients in site and stand conditions. South. For. 2009, 71, 253–258. [Google Scholar] [CrossRef]
- Mendham, D.; Rimbawanto, A.; Mohammed, C.; Glen, M.; Hardie, M.; Beadle, C.; Greenhill, M.; Walker, I.; Hardiyanto, E.; Inail, M.A.; et al. Increasing Productivity and Profitability of Indonesian Smallholder Plantations Final Report FR2015-17; Australian Center for International Agricultural Research (ACIAR): Canberra, Australia, 2015; p. 129. [Google Scholar]
- Pulito, A.P.; Goncalves, J.L.M.; Smethurst, P.J.; Arthur-Junior, J.C.; Alvares, A.; Rocha, J.H.T.; Hubner, A.; Moraes, L.F.; Miranda, A.C.; Kamogawa, M.Y.; et al. Available nitrogen and responses to nitrogen fertilizer in Brazilian eucalypt plantations on soils of contrasting texture. Forests 2015, 6, 973–991. [Google Scholar] [CrossRef]
- Khanna, P.K. Nutrient cycling under mixed-species tree systems in Southeast Asia. Agrofor. Syst. 1998, 38, 99–120. [Google Scholar] [CrossRef]
- Huong, V.D.; Nambiar, E.K.S.; Quang, L.T.; Mendham, D.S.; Dung, P.T. Improving productivity and sustainability of successive rotations of Acacia auriculiformis plantations in South Vietnam. South. For. 2015, 77, 51–58. [Google Scholar] [CrossRef]
- Bich, N.V.; Eyles, A.; Mendham, D.; Dong, T.L.; Ratkowsky, D.; Evans, K.J.; Hai, V.D.; Thanh, H.V.; Thinh, N.V.; Mohammmed, C. Contribution of Harvest Residues to Nutrient Cycling in a Tropical Acacia mangium Willd. Plantation. Forests 2018, 9, 577. [Google Scholar] [CrossRef]
- Battie-Laclau, P.; Laclau, J.P.; Domec, J.C.; Christina, M.; Bouillet, J.P.; Piccolo, M.C.; Goncalves, J.L.M.; Moreira, R.M.; Krusche, A.V.; Bouvet, J.M.; et al. Effects of potassium and sodium supply on drought-adaptive mechanisms in Eucalyptus grandis plantations. New Phytol. 2014, 203, 401–413. [Google Scholar] [CrossRef]
- Goncalves, J.L.M.; Stape, J.L.; Laclau, J.P.; Bouillet, J.P.; Ranger, J. Assessing the effect of early silvicultural management on long-term site productivity of fast growing eucalyptus plantations: The Brazilian experience. South. For. 2008, 70, 105–118. [Google Scholar] [CrossRef]
- Almeida, J.C.R.; Laclau, J.P.; Gonçalves, J.L.M.; Ranger, J.; Saint-André, L. A positive growth response to NaCl applications in Eucalyptus plantations established on K-deficient soils. For. Ecol. Manag. 2010, 259, 1786–1795. [Google Scholar] [CrossRef]
- Bernardo, A.L.; Reis, M.G.F.; Reis, G.G.; Harrison, R.B.; Firme, D.J. Effect of spacing on growth and biomass distribution in Eucalyptus camaldulensis, E. pellita and E. urophylla plantations in southeastern Brazil. For. Ecol. Manag. 1998, 104, 1–13. [Google Scholar] [CrossRef]
- Harrison, R.B.; Reis, G.G.; Reis, M.D.G.F.; Bernardo, A.L.; Firme, D.J. Effect of spacing and age on nitrogen and phosphorus distribution in biomass of Eucalyptus camaldulensis, Eucalyptus pellita and Eucalyptus urophylla plantations in southeastern Brazil. For. Ecol. Manag. 2000, 133, 167–177. [Google Scholar] [CrossRef]
- Nasution, A.; Glen, M.; Beadle, C.; Mohammed, M. Ceratocystis wilt and canker—A disease that compromises the growing of commercial Acacia-based plantations in the tropics. Aust. For. 2019, 82, 80–93. [Google Scholar] [CrossRef]
- Turvey, N.D. Growth at age 30 months of Acacia and Eucalyptus species planted in Imperata grasslands in Kalimantan Selatan, Indonesia. For. Ecol. Manag. 1996, 82, 185–195. [Google Scholar] [CrossRef]


© 2019 by the authors. Licensee MDPI, Basel, Switzerland. This article is an open access article distributed under the terms and conditions of the Creative Commons Attribution (CC BY) license (http://creativecommons.org/licenses/by/4.0/).