Abstract
Phosphorus (P) deficiency in soil affects plant growth and primary production. Accelerated nitrogen (N) deposition can cause ecological carbon:nitrogen:phosphorus (C:N:P) stoichiometry imbalance and increase the degree of relative P deficiency in the soil. However, it remains unclear how N deposition affects P uptake and C:N:P stoichiometry in coniferous timber forests, and whether P addition diminishes the effect of N-induced P limitation on plant growth. From January 2017 to April 2018, we investigated the effects of nine different N and P addition treatments on 10-year old trees of Chinese fir, Cunninghamia lanceolata (Lamb.) Hook. Our results demonstrated that N and P additions at a high concentration could improve the photosynthetic capacity in Chinese fir by increasing the chlorophyll content and stimulating the photosynthesis activity. The C:N:P stoichiometry varied with the season under different N and P addition treatments, indicating that N addition at a moderate concentration could diminish the effect of the P limitation on the growth of Chinese fir. The soluble sugar content in the leaves displayed more stable seasonal variations, compared with those of starch. However, the non-structural carbohydrate (NSC) content in the leaves did not vary with the season under both P and N addition treatment. The data suggested that N and P combination treatment at moderate concentrations promoted carbon assimilation by accelerating the photosynthetic rate. Thus, our results provide new insights into the adaptation mechanisms of coniferous timber forest ecosystems to the effects of N deposition under P deficiency and can help to estimate the ecological effects of environmental changes linked to human management practices.
1. Introduction
Phosphorus (P) is an essential macronutrient for plant growth and development that plays an important role in photosynthesis, energy storage and transfer, and the development of new tissue [1]. Plants acquire P from the soil through the roots. Although P is often highly concentrated in the soil, it readily forms insoluble compounds with free iron (Fe) or aluminum (Al) oxides, which cannot be absorbed by the roots. This process reduces P availability, which impairs plant growth and primary production in most terrestrial ecosystems [2]. Nitrogen (N) is another essential macronutrient affecting plant growth. Human activities, especially fossil fuel combustion and fertilizer use, have resulted in increasing atmospheric N deposition. The global N input is estimated to increase from the historical level of 34 Tg N·yr−1 in 1860 to 200 Tg N·yr−1 in 2050 [3]. In southern China, the amount of N deposition has increased at the average rate of 35.6 kg N∙ha−1·yr−1, with a higher mean value than those in the United States and Europe [4]. Increasing N deposition accelerates N cycling and elevates the N:P ratios in ecosystems [5,6], which increases the degree of relative soil P deficiency. Reports indicate that N addition reduces the availability of soil labile P in tropical forests [7]. N deposition can also accelerate soil acidification [8,9], resulting in the decrease of soil P availability by binding of phosphate ions with Al [10,11].
Thus, under increased N deposition and low P availability, plant growth and P uptake efficiency can reveal the impact of N deposition under low P stress. The ratios between carbon (C), N, and P in plant leaves are influenced by the soil N and P [12]. There are some studies which have investigated how N deposition affects P uptake [13] and the carbon:nitrogen:phosphorus (C:N:P) stoichiometry in plants [14]. However, it remains unclear whether P addition can diminish the effect of N-induced P limitation on plant growth. Therefore, studies about the effects of N deposition and P addition on plants should focus on the physiological changes and C:N:P stoichiometry in leaves. N and P are essential for photosynthesis. Studies showed that a large proportion of leaf N is invested in the photosynthetic machinery [15,16] and influences the carboxylation capacity and electron transport rates [17]. Leaf P is one of the most critical components related to photosynthesis [18], and P deficiency can affect light-use efficiency [19]. Studies showed that the relationship between photosynthetic capacity and leaf N could be modified by P under increasing P limitation [20].
The C:N:P stoichiometry is an important indicator for the C, N, and P balance in plants [21]. However, an increase in N deposition and P deficiency in the soil can disrupt the balance of the C:N:P stoichiometry in soils and plant leaves [22]. N and P additions can potentially change the N:P ratio in plants and affect their C status, resulting in disproportionate C:N:P relationships in plants which are predicted to affect the plant growth. Non-structural carbohydrates (NSC) are another important indicator for the physiological adjustment to the stress in plants [23,24]. The NSC content in leaves is critical for plant growth. The carbon source capacity and the sink capacity of the plant [25], as well as the N deposition and P addition [26,27], can affect the plant NSC content. To date, the effects of N deposition and P addition have been studied in many plant species and communities but only focusing on coniferous timber forests in temperate forest, e.g., Mediterranean-fir (Abies pinsapo Boiss.) [28], Larix principis-rupprechtii [29] and Pinus koraiensis [14]. The responses of physiology and C:N:P stoichiometry to changing N and P conditions in subtropical coniferous timber forests are still not well known.
Chinese fir, Cunninghamia lanceolata (Lamb.) Hook, is an evergreen coniferous tree. As a fast-growing tree species with the finest timber in subtropical China, the Chinese fir has been cultivated for more than 3000 years [30]. It is estimated that its plantation is to be ca. 8.5 million hectares, about 20–30% of the total commercial timber production in China [31]. Most of the soils in the distribution area of the Chinese fir are P-deficient, and the P levels in these forest soils will decrease over successive rotations (20–25 years for each Chinese fir rotation period) [32]. Concurrently, the average N deposition in subtropical China has increased in recent decades [33]. Increasing P deficiency and N excess in Chinese fir forest soils have become the dominating factors that limit the fast growth and high productivity in Chinese fir [5].
In this study, we performed nine different N:P treatments on selected Chinese fir trees during 2017–2018 and analyzed the photosynthetic capacity, stoichiometry, and NSC content of the trees in relation to the different treatments. Our objectives were to explore (1) how N deposition and P addition affect photosynthesis and stoichiometry in different seasons and (2) whether P addition diminishes the effect of N-induced P limitation on plant growth in subtropical coniferous timber forest.
2. Material and Methods
2.1. Study Site
This study was conducted in Gaokan town, Lin’an city, Zhejiang Province, China (119°67′ E, 30°21′ N). This region is characterized by a subtropical monsoon climate with four distinct seasons. The mean annual temperature at the site is 15.6 °C, and the mean annual precipitation is 1420 mm. The soil is classified as yellow soil with pH 4.4, 2.1 mg·kg−1 available P (AP), 400 mg·kg−1 total P, 60 mg·kg−1 available N (AN), 900 mg·kg−1 total N, and 27.8 mg·g−1 soil organic C. The local N deposition is 30.9 kg N∙ha−1·yr−1 [34].
2.2. Plant Material
The Chinese fir plantation was established in 2007. The average tree height and diameter at breast height (measured at 1.3 m above ground level) in 2017 were about 3 m and 12–14 cm, respectively. A total of 27 Chinese fir trees that were 10 years old were selected in this study. A total of 27 plots with areas of 3 m × 3 m were set up and one selected Chinese fir tree occupied the center of each plot. The plots were at least 6 m apart from each other. Samples from three plots of one treatment were regarded as three independent replicates.
2.3. Experimental Design
According to the method used in previous studies simulating N deposition [35,36,37] and the local N deposition value, three N levels, i.e., no N addition (N0), N addition of 30 kg N·ha−1·yr−1 (N30), and a high-N addition of 60 kg N·ha−1·yr−1 (N60), were applied as the N treatment in this study. Correspondingly, according to the local average concentration of P in the subtropical forest of southern China, three P levels, i.e., no P addition (P0), low-P addition of 20 mg·kg−1 (P20), and a high-P addition of 40 mg·kg−1 (P40) [38,39], were chosen for the treatment. A 3 × 3 factorial design experiment was conducted to study the effect of three N level (N0, N30 and N60) and three P level (P0, P20 and P40) on the chlorophyll fluorescence, C:N:P stoichiometry and NSC of Chinese Fir during the experiment year. In total, nine different treatments were designed, and three independent replicates were performed per treatment. Plots were randomly selected to receive treatment. There were a control treatment without additional N or P (CK, N0 + P0), two treatments with separate N addition (N30 and N60), two treatments with separate P addition (P20 and P40), low P addition under N treatment (N30 + P20, and N60 + P20) and high P addition under N treatment (N30 + P40, and N60 + P40).
In January 2017, calcium-magnesium phosphate fertilizer was evenly sprayed in each quadrat after plowing at 30 cm depth to ensure that the AP content in the upper layer of soil reached the desired levels (P20 or P40). From April 2017 to April 2018, N fertilizers were uniformly applied to each quadrat to achieve the desired level of N deposition (N30 or N60). Following the N addition method described by Song, et al. [40], NH4NO3 was weighed, dissolved in 0.225 L water, and sprayed from above on the trees using an electric sprayer. The procedure was performed at the beginning of every month for a total of 12 equal applications throughout the study period of one year. The total volume was equal to an annual increase of 0.3 mm rainfall [35,36]. Control trees were sprayed with the same volume of N-free water to avoid effects of water N transfer. All plots were in a flat field and exposed to the same temperature, light, precipitation, and other environmental factors.
In the study area, Chinese fir trees usually grow new branches in March and April. The main shoot grows quickly both from May to June and from September to October; and grows slowly in November and December. Thus, the sampling times were scheduled for July (summer), October (autumn), and the following January (winter) and April (spring) from 2017–2018. The average monthly air temperature and the total monthly precipitation (Figure 1) were provided by the Lin’an Meteorological Bureau.
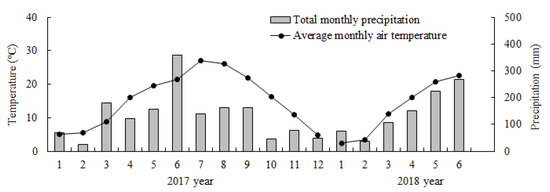
Figure 1.
Average monthly climatic data of the study site during experiment periods in 2017 and 2018.
2.4. Measurements and Sampling
Chlorophyll fluorescence and SPAD (soil and plant analyzer development): Maximum net photosynthesis rate (Pn max) was measured from 09:00 to 12:00 am in a sunny day every three months starting in July 2017, then in October 2017, January 2018, and April 2018, using a Li-6400 portable photosynthesis measuring system with conifer chamber (Li-Cor Inc. Lincoln, NE, USA) on the current-year leaves in the middle part of canopy of the selected trees in each experimental plot. The measurement conditions were as follows: leaf temperature, 25 °C; leaf-air vapor pressure deficit, 1.5 ± 0.5 kPa; photosynthetic photon flux, 2000 μmol·m−2·s−1; relative air humidity, 80%; and ambient CO2 concentration, 400 ± 5 μmol·mol−1.
Chlorophyll fluorescence parameters were measured on the same leaves at the same time, using a portable chlorophyll fluorometer (PAM-2000 WALZ, Germany). The sampled leaves were dark-adapted for 20 minutes using a dark leaf clip. After the dark adaptation, the initial fluorescence (F0) was recorded using an analytical light of 0.05 μmol·m–2·s–1 photon flux density (PFD). Then, a saturating pulse (6000 μmol·m–2·s–1 PFD, 2s) was given to measure the maximal fluorescence yield (Fm). The steady state value of fluorescence (Fs), the maximal fluorescence in the light-adapted state (Fm′), and the basal fluorescence after far-red illumination (F0′) were determined with six measurements per sample. The effective quantum yield of photochemical energy conversion in photosystem II (PSII) was calculated by the formula [41]:
Variable fluorescence Fv was calculated by the following formula:
The maximum quantum yield (Fv/Fm) was determined by the following formula:
Non-photochemical quenching of fluorescence (qN) was calculated as:
The leaf color value (SPAD value) was measured by performing five measurements using a chlorophyll meter (SPAD-502, KONICA MINOLTA, INC., Tokyo, Japan) on the same leaf at the same time.
Sampling: From July 2017, the soil and the leaf samples were collected every three months. Rhizosphere soil was randomly sampled using an auger at a depth range of 0–20 cm. The soil samples were stored in an insulated can and immediately taken to the laboratory for further analysis. After air-drying, soil samples were sieved through a 60 mesh to remove coarse material before measuring the AP and AN content. Thirty sun-exposed needles of current age-class from the upper, middle, and lower parts of each tree were collected. After deactivation of enzymes at 105 °C for 30 min, the leaf samples were oven-dried at 65 °C to a constant weight. Oven-dried leaves were ground with a grinder (DFT-50A, Wenling LINDA Machinery Co., Ltd., Wenling, China), then sieved through a 100 mesh before measuring the C, N, P, starch, soluble sugar, and NSC content in leaves.
Chemical measurement: The organic C content was measured using the potassium dichromate volumetric method with external heating. The total N content was analyzed according to the semi-micro-Kjeldahl acid-digestion method using an Alpkem AutoAnalyzer (Kjektec System 2300 Distilling Unit, Sweden), and total P content was determined by H2SO4-H2O2 decoction and molybdenum-antimony colorimetry. Soil AN was determined by the alkaline hydrolysis diffusion method [42], and soil AP was extracted by diacid method and determined by molybdenum-antimony colorimetry [43].
The total NSC was the sum of soluble sugars and starch. Soluble sugars were extracted from 0.1 g ground material in 10 ml 80% (v/v) ethanol. The extraction was conducted in a shaking water bath at 80 °C. After centrifugation for 10 min at 4000 r·min–1, the supernatant was collected. The pellet was added to 5 mL 80% (v/v) ethanol, then centrifugated for 5 min at 4000 r·min–1, and the supernatant was collected. The concentration of soluble sugars in the supernatant was determined colorimetrically at 650 nm using the phenol-sulfuric method [44]. Starch remained in the pellet after the soluble sugars were extracted and hydrolyzed to glucose. After incubation in sodium acetate and amyloglucosidase solution, the concentration of starch was determined colorimetrically at 650 nm using the modified phenol-sulfuric method as described by Newell, Mulkey and Wright [44].
2.5. Data Analysis
SPSS version 22.0 (SPSS Inc., Chicago, IL, USA) was used for statistical analyses. The one-way analysis of variance (ANOVA) was performed to assess the effects of N deposition and P addition treatments on chlorophyll fluorescence, SPAD, and leaf ecological stoichiometry. The two-way ANOVA was conducted to evaluate the effects of N + P combination treatments on physiological parameters and leaf C:N:P stoichiometry. Pearson linear correlation analysis was used to evaluate the relationships between physiological parameters and contents of N and P in the leaf. Before performing the ANOVA, the data were tested for normal distribution and variance homogeneity, and when necessary, data were log transformed. Data are presented as means ± standard error (SE, n = 3). A p value of less than 0.05 was considered statistically significant.
3. Results
3.1. Soil N and P Addition Affected Leaf Chlorophyll Fluorescence
SPAD decreased under separate N or P addition treatment in October (p < 0.001) (Figure 2b), but increased in those treatments the following April (Figure 2d). No significant differences in Pn max of Chinese fir were detected in July under separate N addition, separate P addition or N + P combinations (p > 0.05) (Figure 3a). In the April, Pn max was significantly higher in trees under P40 and N30 + P40 combination treatments than under control treatment (p < 0.05) (Figure 3d). A significant decline was detected in Fv/Fm of trees under separate P or N addition treatment in January and April (p < 0.05) (Supplementary file Figure S1c,d). The qN value was increased in most trees under separate P20 and N30 treatment (p < 0.05), but decreased in most trees under separate P40 or N60 treatment (p < 0.05) (Supplementary file Figure S2). No significant difference was detected in Y(II) in most trees under separate N addition treatment, but decreased from October to spring under P20 treatment (p < 0.05) (Supplementary file Figure S3). One-way ANOVA analysis showed that there was a significant positive correlation in July and a negative correlation in October between leaf N content and SPAD values (p < 0.05). A positive correlation between leaf P content and Pn max was detected in most trees (p < 0.05). In April, there was a negative correlation between leaf N content and qN, as well as leaf P content and qN (p < 0.05). A significant negative correlation was identified between soil AP content and most of the leaf chlorophyll fluorescence parameters (except SPAD) in October (p < 0.05). However, there was a significant positive correlation between Pn max and soil AN content in most cases.
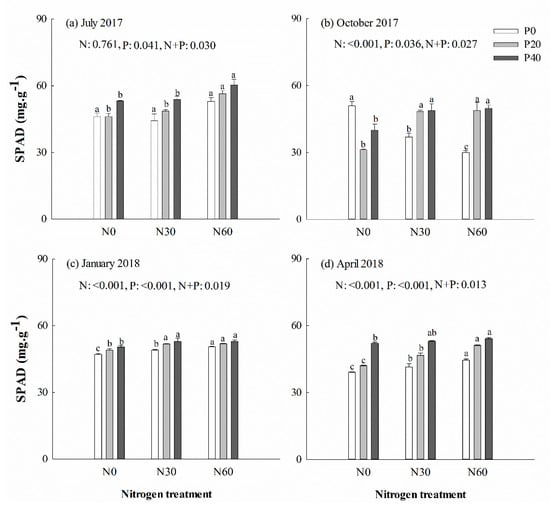
Figure 2.
Leaf color value (SPAD, soil and plant analyzer development) of Chinese fir in July 2017 (a), October 2017 (b), January 2018 (c), and April 2018 (d) under different N and P addition treatment (N0: no N addition; N30: 30 kg N·ha−1·yr−1; N60: 60 kg N·ha−1·yr−1; N90: 90 kg N·ha−1·yr−1; P0: no P addition; P20: 20 mg·kg−1; P40: 40 mg·kg−1) (n = 3). N: N addition effect; P: P addition effect; N + P: interaction effect of N and P addition. Different lowercase letters indicate significant differences among N deposition treatments at the identical P addition (p < 0.05). Error bars indicate standard errors.
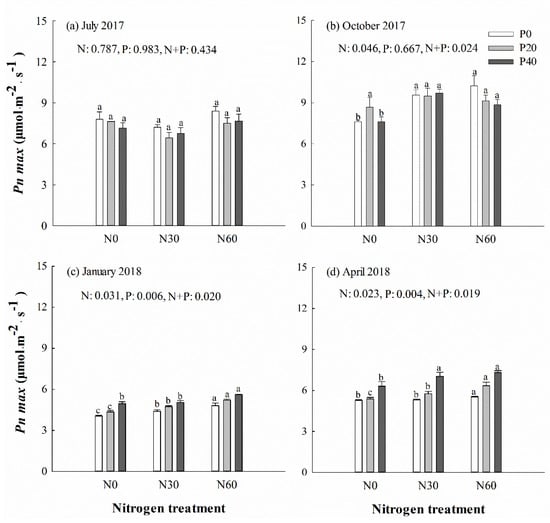
Figure 3.
Maximum net photosynthetic rate (Pn max) of Chinese fir in July 2017 (a), October 2017 (b), January 2018 (c), and April 2018 (d) under different N and P addition treatment (N0: no N addition; N30: 30 kg N·ha−1·yr−1; N60: 60 kg N·ha−1·yr−1; N90: 90 kg N·ha−1·yr−1; P0: no P addition; P20: 20 mg·kg−1; P40: 40 mg·kg−1) (n = 3). N: N addition effect; P: P addition effect; N + P: interaction effect of N and P addition. Different lowercase letters indicate significant differences among N deposition treatments at the identical P addition (p < 0.05). Error bars indicate standard errors.
3.2. Response of Soil Available N (AN) and Available P (AP) to Soil N and P Addition
In July 2017, N60 significantly increased soil AN in combination with P40 treatment (p < 0.05) (Supplementary file Figure S4a). In October, under N addition treatment, soil AN increased significantly in combination with an increase of the P addition concentration (p < 0.05). In April 2018, N30 addition decreased soil AN without P addition (p < 0.05). Without P addition, soil AP was increased under N60 in July, October, and the next January (p < 0.05) (Supplementary file Figure S5). Without N addition, soil AP was increased with an increase of the P addition concentration in July, October, and the next January (p < 0.05). In most cases, soil AP was higher under combined N + P treatment than under control treatment without N or P addition (p < 0.01).
3.3. Response of C:N:P Stoichiometry in the Leaf to Soil N and P Addition
There was no significant difference in the content of C, N, and P, along with the C:N, N:P (Figure 4) and C:P (Figure 5) ratios, in leaves under P addition treatment in July 2017 (p > 0.05). However, separate N30 addition and N30 + P40 treatments increased the N:P ratio in leaves in the next January (p < 0.05) (Figure 4c). Single N30 treatment increased the C:P ratio in leaves in October (Figure 5b) and the next January (Figure 5c) (p < 0.05). In general, the averages of the C:N and C:P ratios in green leaves were higher in October and April than in July and the next January. Two-way ANOVA analysis showed that N + P combination treatment had no significant effect on the content of C, N, and P, or the ratio of C:N, N:P, and C:P in leaves in July (p > 0.05) (Table 1). N + P combination treatment affected the P content and the ratios of C:P and N:P in leaves the following January and spring (p < 0.05) (Table 1).
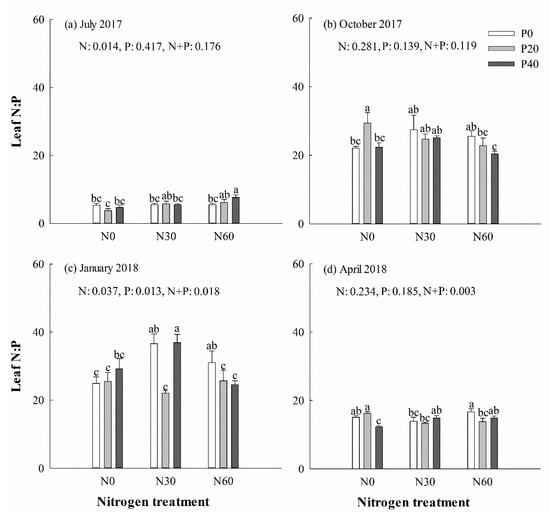
Figure 4.
Chinese fir leaf N:P ratio in July 2017 (a), October 2017 (b), January 2018 (c), and April 2018 (d) under different N and P addition treatment (N0: no N addition; N30: 30 kg N·ha−1·yr−1; N60: 60 kg N·ha−1·yr−1; N90: 90 kg N·ha−1·yr−1; P0: no P addition; P20: 20 mg·kg−1; P40: 40 mg·kg−1) (n = 3). N: N addition effect; P: P addition effect; N + P: interaction effect of N and P addition. Different lowercase letters indicate significant differences among different treatments (p < 0.05).
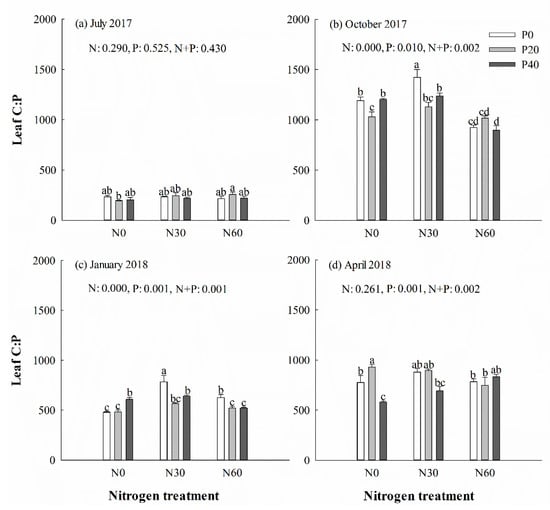
Figure 5.
Chinese fir leaf C:P ratio in July 2017 (a), October 2017 (b), January 2018 (c), and April 2018 (d) under different N and P addition treatment (N0: no N addition; N30: 30 kg N·ha−1·yr−1; N60: 60 kg N·ha−1·yr−1; N90: 90 kg N·ha−1·yr−1; P0: no P addition; P20: 20 mg·kg−1; P40: 40 mg·kg−1) (n = 3). N: N addition effect; P: P addition effect; N + P: interaction effect of N and P addition. Different lowercase letters indicate significant differences among different treatments (p < 0.05).

Table 1.
The significance levels calculated by two-way analysis of variance (ANOVA) for the effects of N addition, P addition and their combinations on leaf nitrogen (N), leaf phosphorus (P), leaf carbon (C), and ecological stoichiometry of Chinese fir.
3.4. Response of Non-Structural Carbohydrate (NSC) in the Leaf to Soil N and P Addition
Separate P addition treatment had a positive effect on leaf starch content in April (Table 2). Nitrogen addition significantly increased starch concentration in leaf under P addition treatment (p < 0.05). The leaf starch concentration was higher in April and October than in July and the following January. In October, the soluble sugar concentration in the leaves was significantly reduced under separate N addition treatment (p < 0.05), but significantly increased under N + P addition treatment (p < 0.05). Overall, there was no detectable change in the NSC concentration during the experiment (Figure 6). Two-way ANOVA analysis showed that N + P treatment had no significant effect on the content of starch, soluble sugar, and NSC in leaves in July and the next January (p > 0.05). However, N + P treatment had measurable effects on soluble sugar and NSC in leaves in October (p < 0.05). In the following April, the starch concentration in leaves was affected significantly by N + P treatment (p < 0.05) (Table 2).
Table 2.
The significance levels in two-way ANOVA for the effects of N addition, P addition, and their combinations on leaf soluble sugar, starch, and non-structural carbohydrates (NSC) in Chinese fir.
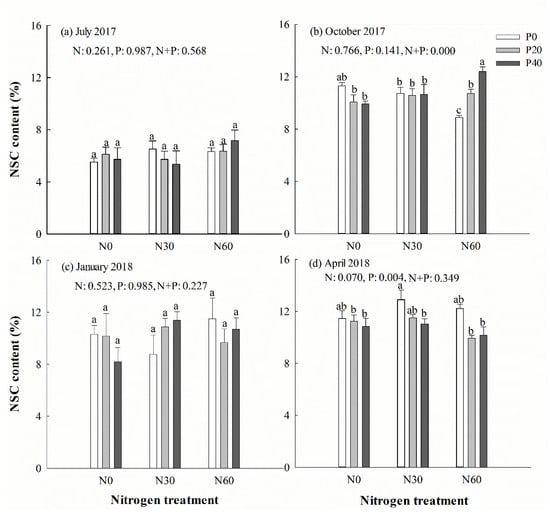
Figure 6.
Chinese fir leaf non-structural carbohydrates (NSC) concentration in July 2017 (a), October 2017 (b), January 2018 (c), and April 2018 (d) under different N and P addition treatment (N0: no N addition; N30: 30 kg N·ha−1·yr−1; N60: 60 kg N·ha−1·yr−1; N90: 90 kg N·ha−1·yr−1; P0: no P addition; P20: 20 mg·kg−1; P40: 40 mg·kg−1) (n = 3). N: N addition effect; P: P addition effect; N + P: interaction effect of N and P addition. Different lowercase letters indicate significant differences among different treatments (p < 0.05).
4. Discussion
4.1. Positive Effect of N and P Addition on Photosynthetic Fluorescence Parameters
Photosynthetic fluorescence is an indicative parameter for assessing changes in the excitation energy and the status of PSII. This study showed that separate N or P addition treatment significantly increased Pn max in Chinese fir during January and April, which is consistent with other studies, e.g., Zhang, et al. [45]. These two key nutrients, N and P, affect the light use efficiency of PSII. Fluorescence parameters are indicators of several important regulatory processes within the photosynthetic apparatus. N is involved in photosynthetic capacity, and leaf N content is typically positively associated with the photosynthetic capacity because a large portion of N is involved in the photosynthetic machinery [15,16]. Nitrogen deposition increases carboxylation capacity and electron transport rates [17]. In July (summer) and October (autumn) in particular, qN was increased significantly under N30 + P40 treatment, which implied that the photoprotection mechanism was activated to prevent the damage to PSII and N involves in preventing the damage of the photosynthetic apparatus by excessive excitation energy. As another key plant nutrient, P is also critical for photosynthesis [18]. The electron transport rates and light-use efficiency can be reduced by P deficiency [19], which also lowers the fraction of leaf N allocated to the photosynthetic machinery [46]. Several studies found that P deficiency could cause detectable fluctuations of the kinetic parameters of photosynthetic fluorescence [47,48,49]. Except in summer and autumn, Fv/Fm and Y(II) were increased significantly under N60+P20 treatment, indicating an enhanced potential activity of PSII and a significantly increased proportion of open PSII reaction centers, which elevated the photosynthetic electron transfer capacity of the PSII reaction center and led to increased photosynthetic efficiency. These results indicated that moderate N + P addition treatment can improve photosynthetic fluorescence parameters in Chinese fir by improving the potential activity of PSII, the maximum energy conversion efficiency of PSII, the actual quantum yield, and the electron transfer efficiency, while reducing the non-radiation energy dissipation. Therefore, under N + P addition, the light absorbed by plant leaves was efficiently used in photosynthesis [50].
Chlorophyll is the most important photosynthetic pigment, and its content is an indicator of the photosynthetic capacity, nutrient status, and growth status of plants [51]. Furthermore, there is a significant positive correlation between chlorophyll content and SPAD values [52]. In this study, the SPAD values in Chinese fir were increased under separate P addition in April, while the chlorophyll content was also increased, which was similar to other studies [53,54]. However, the SPAD value was decreased under separate P or N addition in autumn, showing a seasonal variation. Furthermore, the leaf P content was more decreased in autumn than in summer, and high N addition inhibited the chlorophyll synthesis, which caused the decrease in chlorophyll content, which was also observed in Pinus densiflora [55]. Hence, in this study, the N addition under P treatment increased the SPAD value and chlorophyll content in Chinese fir, indicating an improved photosynthetic capacity.
4.2. Seasonal Response of Ecological Stoichiometry under N and P Addition
Stoichiometric nutrient ratios were used to infer changes in the relative availability of N and P, assessing the likelihood of a shift in the limiting nutrient from N to P [6,56]. Previous research indicated that increasing the N deposition can promote plant growth by improving the soil N supply, whereas increasing the P addition can stimulate the growth of plants limited by P deficiency [57]. We observed that different N and P addition treatments, along with seasonal changes, had measurable effects on the C:N:P stoichiometry in Chinese fir, which was reported in other species [58]. In summer, separate N or P addition did not affect the content and stoichiometry of C, N, and P in leaves; probably because of the relatively short treatment time, the nutrients were distributed with more priority to the roots than the aboveground organs, leading to no significant changes in the leaves. In autumn, separate N60 and separate P20 treatment increased the AP and AN in the soil but decreased the C content, and the C:N and C:P ratios in leaves, indicating that high nitrogen deposition reduced the carbon assimilation capacity but promoted the absorption of N and P, which was also reported in Moso bamboo [40,59]. Separate P20 treatment resulted in an increase in leaf N, P, and N:P, indicating that P addition improved the availability of soil N and P, while the decrease of leaf C, C:N, and C:P was consistent with the negative correlation between leaf C and leaf N and P, and the positive correlation between leaf N and P in higher terrestrial plants [21]. Separate high N treatment can increase the available P in the soil and diminish the stress induced by P deficiency in Chinese fir, which affects the distribution of P absorbed by plants, resulting in changes in the C, N, and P contents in leaves [59]. Under prolonged treatment, separate N addition accelerated the N absorption, and separate P addition improved the absorption of N and P. Several reports concluded that the C:N:P ratios in plant leaves can decouple under increasing nutrient enrichment [22,60,61]. Our results might suggest that plant stoichiometry becomes more complex under the N + P combination treatment. Plant leaves are sensitive to environmental changes. Therefore, the C:N:P stoichiometry of Chinese fir leaves was assumed to be affected by the N and P treatment in this study. However, we observed clear seasonal changes in the C:N:P stoichiometry of leaves across all treatments. The N deposition under P20 treatment improved the N absorption and C assimilation capacity in summer, but the N + P combinations did not significantly affect the leaf C, C:N, and C:P ratios under short-term treatment. According to Koerselman and Meuleman [62] and Güsewell [6], an N:P ratio <14 may imply N limitation to plant growth, and an N:P ratio >16 may indicate P limitation to plant growth. The N:P ratio in summer was <14 under all treatments, indicating that the growth of Chinese fir was restricted by N supply, which also affected P uptake. Increasing N deposition and soil P concentration increased the N and P utilization efficiency of Chinese fir in autumn. The N:P in leaves of all treatments was higher than 16 from autumn, suggesting that the growth-limiting nutrient had shifted from N to P. However, the C:N and C:P were decreased under high N treatment, indicating that the nutrient utilization efficiency was reduced under high N treatment, and P addition can diminish the soil P deficiency. The increased leaf P content under treatments suggested that the N addition improved the P absorption in January and April. The P content was less under N60 + P40 combination treatment than under N30 + P40, indicating that high N deposition inhibited P absorption in Chinese fir after the P deficiency in soil was alleviated. However, P addition and N deposition treatment did not affect the C:N and N:P ratios of leaves, but the C:P ratio increased under high N + P addition, indicating that N deposition treatment increased the nutrient utilization rate in Chinese fir at this time. One possible explanation would be that the soil in the field was initially poor in P availability, but it was improved during the study by P addition. Moreover, the sampled soil was highly acidic (pH: 4.4), in which P is rapidly bound to Fe and Al oxides. Thus, P20 treatment might not be enough to overcome the Fe and Al barrier. With increasing P addition, soil P availability increased, which facilitated the P absorption as reported previously [63]. The increased P uptake also indicated that a reduction in P deficit was induced by N addition, resulting in increases in plant growth, leaf P (in spring), and Pn max. This indicated that moderate N addition is beneficial for the growth of Chinese fir by diminishing N-induced P limitation. Our results also support the observation that the stoichiometric balance can be modified by environmental changes [64]. The C:N:P stoichiometry would provide critical feedback to plant productivity and C assimilation by affecting leaf nutrient uptake, soil nutrient availability, and other ecological processes [64].
4.3. Non-Seasonal Variation in NSC Concentrations
NSC are substrates for plant growth and metabolism [65] and, therefore, play an important role in the plant life cycle [66]. NSC variations can be an indicator for the adjustment of the C metabolism in plants to environmental stress [23,24] and the carbon source and sink capacity of vegetation [25]. The higher starch content was found in October and April, fast-growing seasons, showing starch is involved in long-term energy storage in plants [67]. Soluble sugars serve as signal substances to enable adaptation to environmental changes and are involved in the osmotic adjustment of cells [66]. However, soluble sugars exhibited more stable seasonal change patterns compared to those of starch in this study, which is in agreement with other reports [23,44]. Hoch et al. (2003) [68] reported that evergreen conifer trees had barely any change in the soluble sugar content in the leaves throughout the season. The higher soluble sugar concentration in January and April may be attributed to higher photosynthesis. Previous studies already reported seasonal variations of the NSC component concentrations in forest species [23,44]. The dynamic changes of NSC in 17 tropical plants reported by Würth, et al. [69] showed that the NSC content in tissues and organs of 9 species was higher in the dry season than in the wet season. The lack of water directly limits the investment of carbon (i.e., the formation of new tissues), resulting in the accumulation of NSC components in the dry season. However, some evergreen species may have stable NSC concentration because seasonal variation in carbon gain may be lower in evergreen species in subtropical forests than in temperate forests [44,68,70]. In our study, the NSC content was relatively stable over the entire experimental period, but it had atypical seasonal changes under both P and N addition treatment. Soluble sugars and NSC concentrations were decreased under N60 treatment. However, higher soluble sugar and NSC concentrations were observed under N60 + P40 combination treatment in autumn, indicating a positive response to high N + P combination treatment, which accelerated the carbon assimilation by a higher photosynthetic rate. Decreased starch and NSC concentrations were observed under N60 + P20 and N60 + P40 treatment in April, which could be attributed to a higher growth rate that resulted in accelerated carbohydrate consumption in April. Higher nutrient availability can drive plant growth activity. Most starch and NSC were used to support new tissue production (such as new shoots and new fine roots) in spring. Similar results have been reported by others [71,72,73], indicating that more carbohydrates were invested in growth in spring.
Chinese fir is an evergreen conifer, and the universality of our conclusions drawn from the present study to other plants need to be further assessed. Additionally, other environmental factors, temperature, precipitation, light, etc., with the seasonal fluctuations, can also influence the physiological parameters and nutrient absorption of plant. Rhizosphere microbes are also impacted by these factors and thus likely influence nutrient uptake by influencing the root system, especially mycorrhizae [74]. These might be influencing nutrient uptake and plant responses. These factors and underlying mechanisms will be the focus of our next study.
5. Conclusions
Our results suggested that N + P combination treatment at a high concentration can enhance the photosynthetic capacity in Chinese fir by increasing the chlorophyll content and photosynthesis activity. The C:N:P stoichiometry varied with the season under different N and P addition treatments. These results indicated that moderate N addition could diminish the N-induced P limitation on the growth of Chinese fir. Thus, the stoichiometric balance can be affected by environmental changes. The soluble sugars in the leaves had more stable seasonal variations, compared to those of starch. In contrast, the NSC content in the leaves was relatively stable throughout the one-year experiment, and there was no measurable seasonal variation in NSC under both P and N addition treatment. The results revealed that the N + P combination treatment used at a moderate concentration increased carbon assimilation by accelerating the photosynthetic rate. Our findings about the Chinese fir provide new insights into the adaptation mechanisms of coniferous timber forest ecosystems to N deposition under P deficiency and can help to estimate the ecological effects of environmental changes caused by human management practices.
Supplementary Materials
The following are available online at https://www.mdpi.com/1999-4907/10/12/1068/s1.
Author Contributions
X.S. designed the study and was responsible for funding acquisition and resources. Y.W. and Q.L. performed experiments and analyzed data. M.L., X.S. and W.X. discussed and wrote the manuscript.
Funding
This research was funded by National Key Research and Development Program of China, grant number 2016YFD0600201, the National Natural Science Foundation of China, grant number 31971623, and the Natural Science Foundation of Zhejiang Province, grant number LY19C160005.
Acknowledgments
The thanks were also given to Qiao Wang and Shuyue Qian for their help during the experiment.
Conflicts of Interest
The authors declare no conflict of interest.
References
- Marschner, P. Marschner’s Mineral Nutrition of Higher Plants, 3rd ed.; Academic Press: London, UK, 2012. [Google Scholar]
- Radersma, S.; Grierson, P.F. Phosphorus mobilization in agroforestry: Organic anions, phosphatase activity and phosphorus fractions in the rhizosphere. Plant Soil 2004, 259, 209–219. [Google Scholar] [CrossRef]
- Galloway, J.N.; Townsend, A.R.; Jan Willem, E.; Mateete, B.; Zucong, C.; Freney, J.R.; Martinelli, L.A.; Seitzinger, S.P.; Sutton, M.A. Transformation of the nitrogen cycle: Recent trends, questions, and potential solutions. Science 2008, 320, 889–892. [Google Scholar] [CrossRef] [PubMed]
- Lü, C.; Tian, H. Spatial and temporal patterns of nitrogen deposition in China: Synthesis of observational data. J. Geophys. Res. 2007, 112, D22S05. [Google Scholar] [CrossRef]
- Zhang, Y.; Zhou, Z.; Yang, Q. Nitrogen (N) Deposition impacts seedling growth of Pinus massoniana via N: P ratio effects and the modulation of adaptive responses to low P (Phosphorus). PLoS ONE 2013, 8, e79229. [Google Scholar] [CrossRef] [PubMed]
- Güsewell, S. N: P ratios in terrestrial plants: Variation and functional significance. New Phytol. 2004, 164, 243–266. [Google Scholar] [CrossRef]
- Deng, Q.; Hui, D.; Dennis, S.; Reddy, K.C. Responses of terrestrial ecosystem phosphorus cycling to nitrogen addition: A meta-analysis. Glob. Ecol. Biogeogr. 2017, 26, 713–728. [Google Scholar] [CrossRef]
- Lu, X.; Mao, Q.; Gilliam, F.S.; Luo, Y.; Mo, J. Nitrogen deposition contributes to soil acidification in tropical ecosystems. Glob. Chang. Biol. 2014, 20, 3790–3801. [Google Scholar] [CrossRef]
- Tian, D.; Niu, S. A global analysis of soil acidification caused by nitrogen addition. Environ. Res. Lett. 2015, 10, 024019. [Google Scholar] [CrossRef]
- DeForest, J.L.; Scott, L.G. Available organic soil phosphorus has an important influence on microbial community composition. Soil Sci. Soc. Am. J. 2010, 74, 2059–2066. [Google Scholar] [CrossRef]
- Holzmann, S.; Missong, A.; Puhlmann, H.; Siemens, J.; Bol, R.; Klumpp, E.; Wilpert, K.V. Impact of anthropogenic induced nitrogen input and liming on phosphorus leaching in forest soils. J. Plant Nutr. Soil Sci. 2016, 179, 443–453. [Google Scholar] [CrossRef]
- Zhao, X.D.; Zeng, Q.C.; An, S.S.; Fang, Y.; Ma, R.T. Ecological stoichiometric characteristics of grassland soils and plant roots relative to enclosure history on the Loess Plateau. J. Plant Nutr. Soil Sci. 2016, 53, 1541–1551. [Google Scholar]
- Fujita, Y.; Robroek, B.J.M.; De Ruiter, P.C.; Heil, G.W.; Wassen, M.J. Increased N affects P uptake of eight grassland species: The role of root surface phosphatase activity. Oikos 2010, 119, 1665–1673. [Google Scholar] [CrossRef]
- Yang, D.; Song, L.; Jin, G. The soil C: N: P stoichiometry is more sensitive than the leaf C:N:P stoichiometry to nitrogen addition: A four-year nitrogen addition experiment in a Pinus koraiensis plantation. Plant Soil 2019, 442, 183–198. [Google Scholar] [CrossRef]
- Guan, L.L.; Wen, D.Z. More nitrogen partition in structural proteins and decreased photosynthetic nitrogen-use efficiency of Pinus massoniana under in situ polluted stress. J. Plant Res. 2011, 124, 663–673. [Google Scholar] [CrossRef] [PubMed]
- Kattge, J.; Knorr, W.; Raddatz, T.; Wirth, C. Quantifying photosynthetic capacity and its relationship to leaf nitrogen content for global-scale terrestrial biosphere models. Glob. Chang. Biol. 2009, 15, 976–991. [Google Scholar] [CrossRef]
- Hikosaka, K. Interspecific difference in the photosynthesis-nitrogen relationship: Patterns, physiological causes, and ecological importance. J. Plant Res. 2004, 117, 481–494. [Google Scholar] [CrossRef]
- Crous, K.; O’Sullivan, O.S.; Zaragoza-Castells, J.; J Bloomfield, K.; Alves Negrini, A.C.; Meir, P.; Turnbull, M.; Griffin, K.; Atkin, O. Nitrogen and phosphorus availabilities interact to modulate leaf trait scaling relationships across six plant functional types in a controlled-environment study. New Phytol. 2017, 215, 992–1008. [Google Scholar] [CrossRef]
- Conroy, J.P.; Smillie, R.M.; Kuppers, M.; Bevege, D.I.; Barlow, E.W. Chlorophyll a fluorescence and photosynthetic and growth responses of Pinus radiata to phosphorus deficiency, drought stress, and high CO2. Plant Physiol. 1986, 81, 423–429. [Google Scholar] [CrossRef]
- Walker, A.P.; Beckerman, A.P.; Gu, L.; Kattge, J.; Cernusak, L.A.; Domingues, T.F.; Scales, J.C.; Wohlfahrt, G.; Wullschleger, S.D.; Woodward, F.I. The relationship of leaf photosynthetic traits-Vcmax and Jmax- to leaf nitrogen, leaf phosphorus, and specific leaf area: A meta-analysis and modeling study. EOL 2014, 4, 3218–3235. [Google Scholar]
- Sterner, R.W.; Elser, J.J. Ecological Stoichiometry: The Biology of Elements from Molecules to the Biosphere; Princeton University Press: Princeton, NJ, USA, 2002. [Google Scholar]
- Yuan, Z.Y.; Chen, H.Y.H. Decoupling of nitrogen and phosphorus in terrestrial plants associated with global changes. Nat. Clim. Chang. 2015, 5, 465–469. [Google Scholar] [CrossRef]
- Liu, W.; Su, J.; Li, S.; Lang, X.; Huang, X. Non-structural carbohydrates regulated by season and species in the subtropical monsoon broad-leaved evergreen forest of Yunnan Province, China. Sci. Rep. 2018, 8, 1083. [Google Scholar] [CrossRef] [PubMed]
- Xie, H.; Yu, M.; Cheng, X. Leaf non-structural carbohydrate allocation and C: N: P stoichiometry in response to light acclimation in seedlings of two subtropical shade-tolerant tree species. Plant. Physiol. Biochem. 2018, 124, 146–154. [Google Scholar] [CrossRef] [PubMed]
- Wiley, E.; Huepenbecker, S.; Casper, B.B.; Helliker, B.R. The effects of defoliation on carbon allocation: Can carbon limitation reduce growth in favour of storage? Tree Physiol. 2013, 33, 1216. [Google Scholar] [CrossRef] [PubMed]
- Xiao, L.; Liu, G.; Li, P.; Xue, S. Nitrogen addition has a stronger effect on stoichiometries of non-structural carbohydrates, nitrogen and phosphorus in Bothriochloa ischaemum than elevated CO2. Plant Growth Regul. 2017, 83, 325–334. [Google Scholar] [CrossRef]
- Gautam, P.; Nayak, A.K.; Lal, B.; Bhattacharyya, P.; Tripathi, R.; Shahid, M.; Mohanty, S.; Raja, R.; Panda, B.B. Submergence tolerance in relation to application time of nitrogen and phosphorus in rice (Oryza sativa L.). Environ. Exp. Bot. 2014, 99, 159–166. [Google Scholar] [CrossRef]
- Blanes, M.C.; Emmett, B.A.; Viñegla, B.; Carreira, J.A. Alleviation of P limitation makes tree roots competitive for N against microbes in a N-saturated conifer forest: A test through P fertilization and 15N labelling. Soil Biol. Biochem. 2012, 48, 51–59. [Google Scholar] [CrossRef]
- Deng, M.; Liu, L.; Sun, Z.; Piao, S.; Ma, Y.; Chen, Y.; Wang, J.; Qiao, C.; Wang, X.; Li, P. Increased phosphate uptake but not resorption alleviates phosphorus deficiency induced by nitrogen deposition in temperate Larix principis-rupprechtii plantations. New Phytol. 2016, 212, 1019–1029. [Google Scholar] [CrossRef]
- Chen, Y.; Nguyen, T.H.N.; Qin, J.; Jiao, Y.; Li, Z.; Ding, S.; Lu, Y.; Liu, Q.; Luo, Z.-B. Phosphorus assimilation of Chinese fir from two provenances during acclimation to changing phosphorus availability. Environ. Exp. Bot. 2018, 153, 21–34. [Google Scholar] [CrossRef]
- Fang, X.M.; Zhang, X.L.; Zong, Y.Y.; Zhang, Y.; Wan, S.Z.; Bu, W.S.; Chen, F.S. Soil phosphorus functional fractions and tree tissue nutrient concentrations influenced by stand density in subtropical Chinese fir plantation forests. PLoS ONE 2017, 12, e0186905. [Google Scholar] [CrossRef]
- Wu, P.; Ma, X.; Tigabu, M.; Wang, C.; Liu, A.; Oden, P. Root morphological plasticity and biomass production of two Chinese fir clones with high phosphorus efficiency under low phosphorus stress. Can. J. For. Res. 2011, 41, 228–234. [Google Scholar] [CrossRef]
- Li, Q.; Song, X.; Chang, S.X.; Peng, C.; Xiao, W.; Zhang, J.; Xiang, W.; Li, Y.; Wang, W. Nitrogen depositions increase soil respiration and decrease temperature sensitivity in a Moso bamboo forest. Agric. For. Meteorol. 2019, 268, 48–54. [Google Scholar] [CrossRef]
- Xie, Y.; Zhang, S.; Zhao, X.; Xiong, Z.; Xing, G. Seasonal variation patterns of NH4+-N/NO3−-N ratio and δ15 NH4+ value in rainwater in Yangtze river delta. Chin. J. Appl. Ecol. 2008, 19, 2035–2041. [Google Scholar]
- Fang, H.; Mo, J.; Peng, S.; Li, Z.; Wang, H. Cumulative effects of nitrogen additions on litter decomposition in three tropical forests in southern China. Plant Soil 2007, 297, 233–242. [Google Scholar] [CrossRef]
- Mo, J.; Brown, S.; Xue, J.; Fang, Y.; Li, Z.; Li, D.; Dong, S. Response of nutrient dynamics of decomposing pine (Pinus massoniana) needles to simulated N deposition in a disturbed and a rehabilitated forest in tropical China. Ecol. Res. 2007, 22, 649–658. [Google Scholar] [CrossRef]
- Song, X.; Li, Q.; Gu, H. Effect of nitrogen deposition and management practices on fine root decomposition in Moso bamboo plantations. Plant Soil 2017, 410, 207–215. [Google Scholar] [CrossRef]
- Chen, Z.; Wu, P.; Zou, X.; Wang, P.; Ma, J.; Ma, X. Relationship between growth and endogenous hormones of Chinese fir seedlings under low phosphorus stress. Sci. Silvae Sin. 2016, 52, 57–66. [Google Scholar]
- Leng, H.; Chen, Y.; Duan, H.; Rao, L.; Y, W.; Hu, Y. Effects of phosphorus stress on the growth and nitrogen and phosphorus absorption of different Formosan sweet gum provenances. Chin. J. Appl. Ecol. 2009, 20, 754–760. [Google Scholar]
- Song, X.; Zhou, G.; Gu, H.; Qi, L. Management practices amplify the effects of N deposition on leaf litter decomposition of the Moso bamboo forest. Plant Soil 2015, 395, 391–400. [Google Scholar] [CrossRef]
- Genty, B.; Briantais, J.M.; Baker, N.R. The relationship between the quantum yield of photosynthetic electron transport and quenching of chlorophyll fluorescence. BBA-Gen. Subj. 1989, 990, 87–92. [Google Scholar] [CrossRef]
- Xiao, Y.; Peng, Y.; Peng, F.; Zhang, Y.; Yu, W.; Sun, M.; Gao, X. Effects of concentrated application of soil conditioners on soil–air permeability and absorption of nitrogen by young peach trees. Soil. Sci. Plant Nutr. 2018, 64, 423–432. [Google Scholar] [CrossRef]
- Murphy, J.; Riley, J. A modified single solution method for the determination of phosphate in natural waters. Anal. Chim. Acta 1962, 27, 31–36. [Google Scholar] [CrossRef]
- Newell, E.A.; Mulkey, S.S.; Wright, S.J. Seasonal patterns of carbohydrate storage in four tropical tree species. Oecologia 2002, 131, 333–342. [Google Scholar] [CrossRef] [PubMed]
- Zhang, L.; Hoshika, Y.; Carrari, E.; Cotrozzi, L.; Pellegrini, E.; Paoletti, E. Effects of nitrogen and phosphorus imbalance on photosynthetic traits of poplar Oxford clone under ozone pollution. J. Plant Res. 2018, 131, 915–924. [Google Scholar] [CrossRef] [PubMed]
- Warren, C.; McGrath, J.F.; Adams, M.A. Differential effects of N, P and K on photosynthesis and partitioning of N in Pinus pinaster needles. Ann. For. Sci. 2005, 62, 1–8. [Google Scholar] [CrossRef]
- Carstensen, A.; Szameitat, A.E.; Frydenvang, J.; Husted, S. Chlorophyll a fluorescence analysis can detect phosphorus deficiency under field conditions and is an effective tool to prevent grain yield reductions in spring barley (Hordeum vulgare L.). Plant Soil 2019, 434, 79–91. [Google Scholar] [CrossRef]
- Frydenvang, J.; van Maarschalkerweerd, M.; Carstensen, A.; Mundus, S.; Schmidt, S.B.; Pedas, P.R.; Laursen, K.H.; Schjoerring, J.K.; Husted, S. Sensitive detection of phosphorus deficiency in plants using chlorophyll a fluorescence. Plant Physiol. 2015, 169, 353–361. [Google Scholar] [CrossRef]
- Carstensen, A.; Herdean, A.; Schmidt, S.B.; Sharma, A.; Spetea, C.; Pribil, M.; Husted, S. The impacts of phosphorus deficiency on the photosynthetic electron transport chain. Plant Physiol. 2018, 177, 271–284. [Google Scholar] [CrossRef]
- Demmig-Adams, B.; Adams, W.W., III; Barker, D.H.; Logan, B.A.; Bowling, D.R.; Verhoeven, A.S. Using chlorophyll fluorescence to assess the fraction of absorbed light allocated to thermal dissipation of excess excitation. Physiol. Plant. 1996, 98, 253–264. [Google Scholar] [CrossRef]
- Daughtry, C.S.T.; Walthall, C.L.; Kim, M.S.; de Colstoun, E.B.; McMurtrey, J.E. Estimating corn leaf chlorophyll concentration from leaf and canopy reflectance. Remote Sens. Environ. 2000, 74, 229–239. [Google Scholar] [CrossRef]
- Samdur, M.Y.; Singh, A.L.; Mathur, R.K.; Manivel, P.; Chikani, B.M.; Gor, H.K.; Khan, M.A. Field evaluation of chlorophyll meter for screening groundnut (Arachis hypogaea L.) genotypes tolerant to iron-deficiency chlorosis. Curr. Sci. India 2000, 79, 211–214. [Google Scholar]
- Du, J.; Liu, J.; Lu, H.; Hansell, D.; Zhang, Q.; Wang, W.; Yan, C. Effect of external phosphate addition on solid-phase iron distribution and iron accumulation in Mangrove Kandelia obovata (S. L.). Environ. Sci. Pollut. Res. 2015, 22, 13506–13513. [Google Scholar] [CrossRef] [PubMed]
- Rahman, M.A.; Lee, S.H.; Ji, H.C.; Kabir, A.H.; Jones, C.S.; Lee, K.W. Importance of mineral nutrition for mitigating aluminum toxicity in plants on acidic soils: Current status and opportunities. Int. J. Mol. Sci. 2018, 19, 3073. [Google Scholar] [CrossRef] [PubMed]
- Nakaji, T.; Fukami, M.; Dokiya, Y.; Izuta, T. Effects of high nitrogen load on growth, photosynthesis and nutrient status of Cryptomeria japonica and Pinus densiflora seedlings. Trees 2001, 15, 453–461. [Google Scholar]
- Elser, J.J.; Sterner, R.W.; Gorokhova, E.; Fagan, W.F.; Markow, T.A.; Cotner, J.B. Biological stoichiometry from genes to ecosystems. Ecol. Lett. 2000, 3, 540–550. [Google Scholar] [CrossRef]
- Huang, J.; Yu, H.; Liu, J.; Luo, C.; Sun, Z.; Ma, K.; Kang, Y.; Du, Y. Phosphorus addition changes belowground biomass and C:N:P stoichiometry of two desert steppe plants under simulated N deposition. Sci. Rep. 2018, 8, 3400. [Google Scholar] [CrossRef] [PubMed]
- Li, H.; Crabbe, M.J.C.; Xu, F.; Wang, W.; Ma, L.; Niu, R.; Gao, X.; Li, X.; Zhang, P.; Ma, X. Seasonal variations in carbon, nitrogen and phosphorus concentrations and C: N: P stoichiometry in different organs of a Larix principis-rupprechtii Mayr. plantation in the Qinling Mountains, China. PLoS ONE 2017, 12, e0185163. [Google Scholar] [CrossRef] [PubMed]
- Song, X.; Gu, H.; Wang, M.; Zhou, G.; Li, Q. Management practices regulate the response of Moso bamboo foliar stoichiometry to nitrogen deposition. Sci. Rep. 2016, 6, 24107. [Google Scholar] [CrossRef]
- Jiang, J.; Wang, Y.P.; Yang, Y.; Yu, M.; Wang, C.; Yan, J. Interactive effects of nitrogen and phosphorus additions on plant growth vary with ecosystem type. Plant Soil 2019, 440, 523–537. [Google Scholar] [CrossRef]
- Yang, Y.; Fang, J.; Ji, C.; Datta, A.; Li, P.; Ma, W.; Mohammat, A.; Shen, H.; Hu, H.; Knapp, B.; et al. Stoichiometric shifts in surface soils over broad geographical scales: Evidence from China’s grasslands. Glob. Ecol. Biogeogr. 2014, 23, 947–955. [Google Scholar] [CrossRef]
- Koerselman, W.; Meuleman, A.F. The vegetation N: P ratio: A new tool to detect the nature of nutrient limitation. J. Appl. Ecol. 1996, 33, 1441–1450. [Google Scholar] [CrossRef]
- Mao, R.; Chen, H.M.; Zhang, X.H.; Shi, F.X.; Song, C.C. Effects of P addition on plant C: N: P stoichiometry in an N-limited temperate wetland of Northeast China. Sci. Total Environ. 2016, 559, 1–6. [Google Scholar] [CrossRef] [PubMed]
- Li, W.; Jin, C.; Guan, D.; Wang, Q.; Wang, A.; Yuan, F.; Wu, J. The effects of simulated nitrogen deposition on plant root traits: A meta-analysis. Soil Biol. Biochem. 2015, 82, 112–118. [Google Scholar] [CrossRef]
- Quentin, A.G.; Pinkard, E.A.; Ryan, M.G.; Tissue, D.T.; Baggett, L.S.; Adams, H.D. Non-structural carbohydrates in woody plants compared among laboratories. Tree Physiol. 2015, 35, 1–20. [Google Scholar] [CrossRef] [PubMed]
- Li, N.; He, N.; Yu, G.; Wang, Q.; Sun, J. Leaf non-structural carbohydrates regulated by plant functional groups and climate: Evidences from a tropical to cold-temperate forest transect. Ecol. Indic. 2016, 62, 22–31. [Google Scholar] [CrossRef]
- Zhang, H.; Wang, C.; Wang, X. Spatial variations in non-structural carbohydrates in stems of twelve temperate tree species. Trees 2014, 28, 77–89. [Google Scholar] [CrossRef]
- Hoch, G.; Richter, A.; Körner, C. Non-structural carbon compounds in temperate forest trees. Plant Cell Environ. 2003, 26, 1067–1081. [Google Scholar] [CrossRef]
- Würth, M.K.R.; Peláez-Riedl, S.; Wright, S.J.; Körner, C. Non-structural carbohydrate pools in a tropical forest. Oecologia 2005, 143, 11–24. [Google Scholar] [CrossRef]
- Palacio, S.; Maestro, M.; Montserrat-Martí, G. Seasonal dynamics of non-structural carbohydrates in two species of mediterranean sub-shrubs with different leaf phenology. Environ. Exp. Bot. 2007, 59, 34–42. [Google Scholar] [CrossRef]
- Kavanová, M.; Grimoldi, A.A.; Lattanzi, F.A.; Schnyder, H. Phosphorus nutrition and mycorrhiza effects on grass leaf growth. P status- and size-mediated effects on growth zone kinematics. Plant Cell Environ. 2006, 29, 511–520. [Google Scholar] [CrossRef]
- Wang, X.; Xu, Z.; Yan, C.; Luo, W.; Wang, R.; Han, X.; Jiang, Y.; Li, M.H. Responses and sensitivity of N, P and mobile carbohydrates of dominant species to increased water, N and P availability in semiarid grasslands in northern China. J. Plant Ecol. 2017, 10, 486–496. [Google Scholar] [CrossRef]
- Al-Hamdani, S.H.; Sirna, C.B. Physiological responses of Salvinia minima to different phosphorus and nitrogen concentrations. Am. Fern J. 2008, 98, 71–82. [Google Scholar] [CrossRef]
- Köhler, J.; Yang, N.; Pena, R.; Raghavan, V.; Polle, A.; Meier, I.C. Ectomycorrhizal fungal diversity increases phosphorus uptake efficiency of European beech. New Phytol. 2018, 220, 1200–1210. [Google Scholar] [CrossRef] [PubMed]


© 2019 by the authors. Licensee MDPI, Basel, Switzerland. This article is an open access article distributed under the terms and conditions of the Creative Commons Attribution (CC BY) license (http://creativecommons.org/licenses/by/4.0/).