Figure 1.
Location, land-cover map, and variation of climatic factors. (
a) The location of the study area and average Enhanced Vegetation Index (EVI) in the growing season in central Loess Plateau from 2000 to 2015. (
b) The land-cover map in central Loess Plateau in 2015. The land-cover data was provided by the Resource Environment Cloud Platform of the Institute of Geosciences and Resources and Environment of the Chinese Academy of Sciences (
http://www.resdc.cn/Default.aspx). (
c) The spatial distribution of mean temperature (TMP, °C) in central Loess Plateau from 2000 to 2015. (
d) The spatial distribution of total mean precipitation (PRE, mm) in central Loess Plateau from 2000 to 2015.
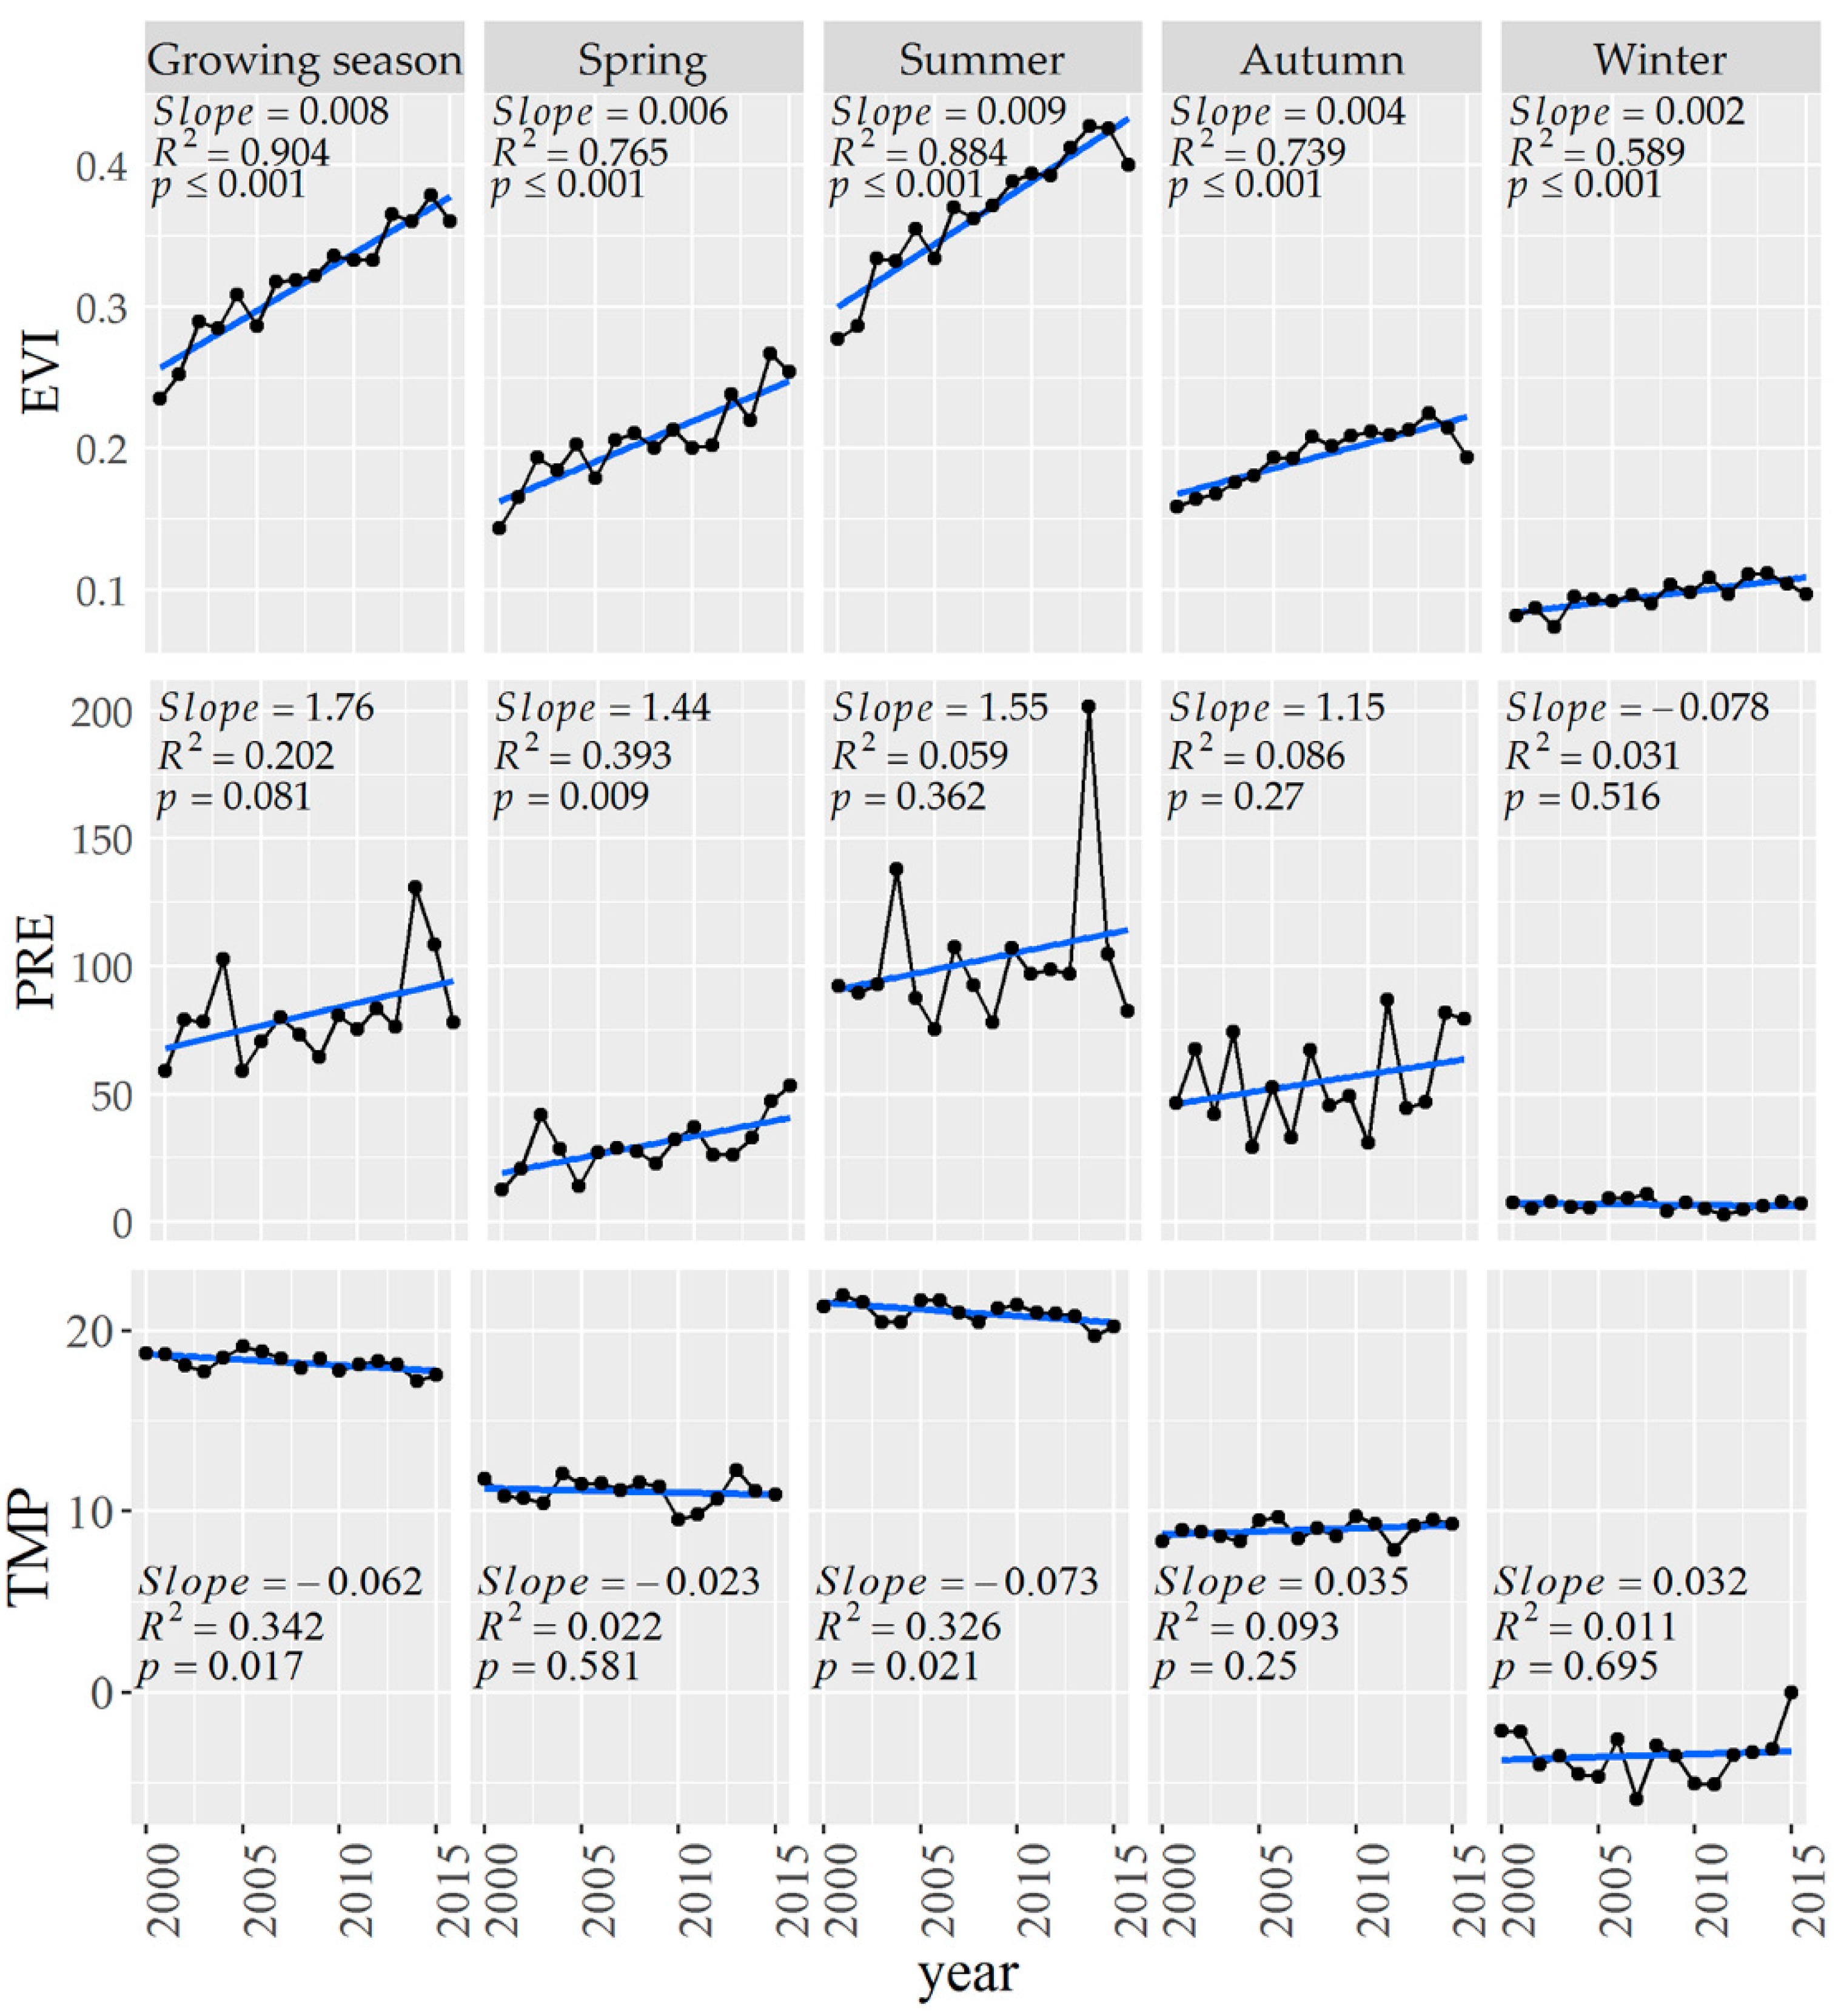
Figure 2.
Interannual variation of EVI, mean annual precipitation (PRE, mm), and mean annual temperature (TMP, °C) over 2000–2015 for central Loess Plateau. The seasons include the growing season (April–September), spring (March–May), summer (June–August), autumn (September–November), and winter (December–February). The linear trends were fit by the ordinary least squares method.
Figure 3.
Spatial distribution of EVI (/year), precipitation (mm/year) and temperature (°C/year) trends in the study area during the period 2000–2015. (a)–(d) show the EVI trend for the growing season, spring, summer, and autumn, respectively. (e)–(h) and (i)–(m) are respective precipitation and temperature trends for the same four study periods as (a)–(d). Regions with red hatching in (e)–(m) designate the trends are significant trends.
Figure 4.
Spatial distribution of EVI dynamics consistency during 2000–2015. (a–d) show consistency types of EVI dynamics for the growing season, spring, summer, and autumn, respectively. (e–h) are spatial distributions of the Hurst exponent for the growing season, spring, summer, and autumn, respectively.
Figure 5.
Variations of the correlation coefficient and partial correlation coefficient between EVI and climatic factors among different months (January–December) with a 16-year moving window in 2000–2015. (a) Correlations between EVI and PRE (precipitation, mm/year). (b) Correlations between EVI and TMP (temperature, °C/year). * and ** represent a p-value < 0.05 and p-value < 0.01, respectively.
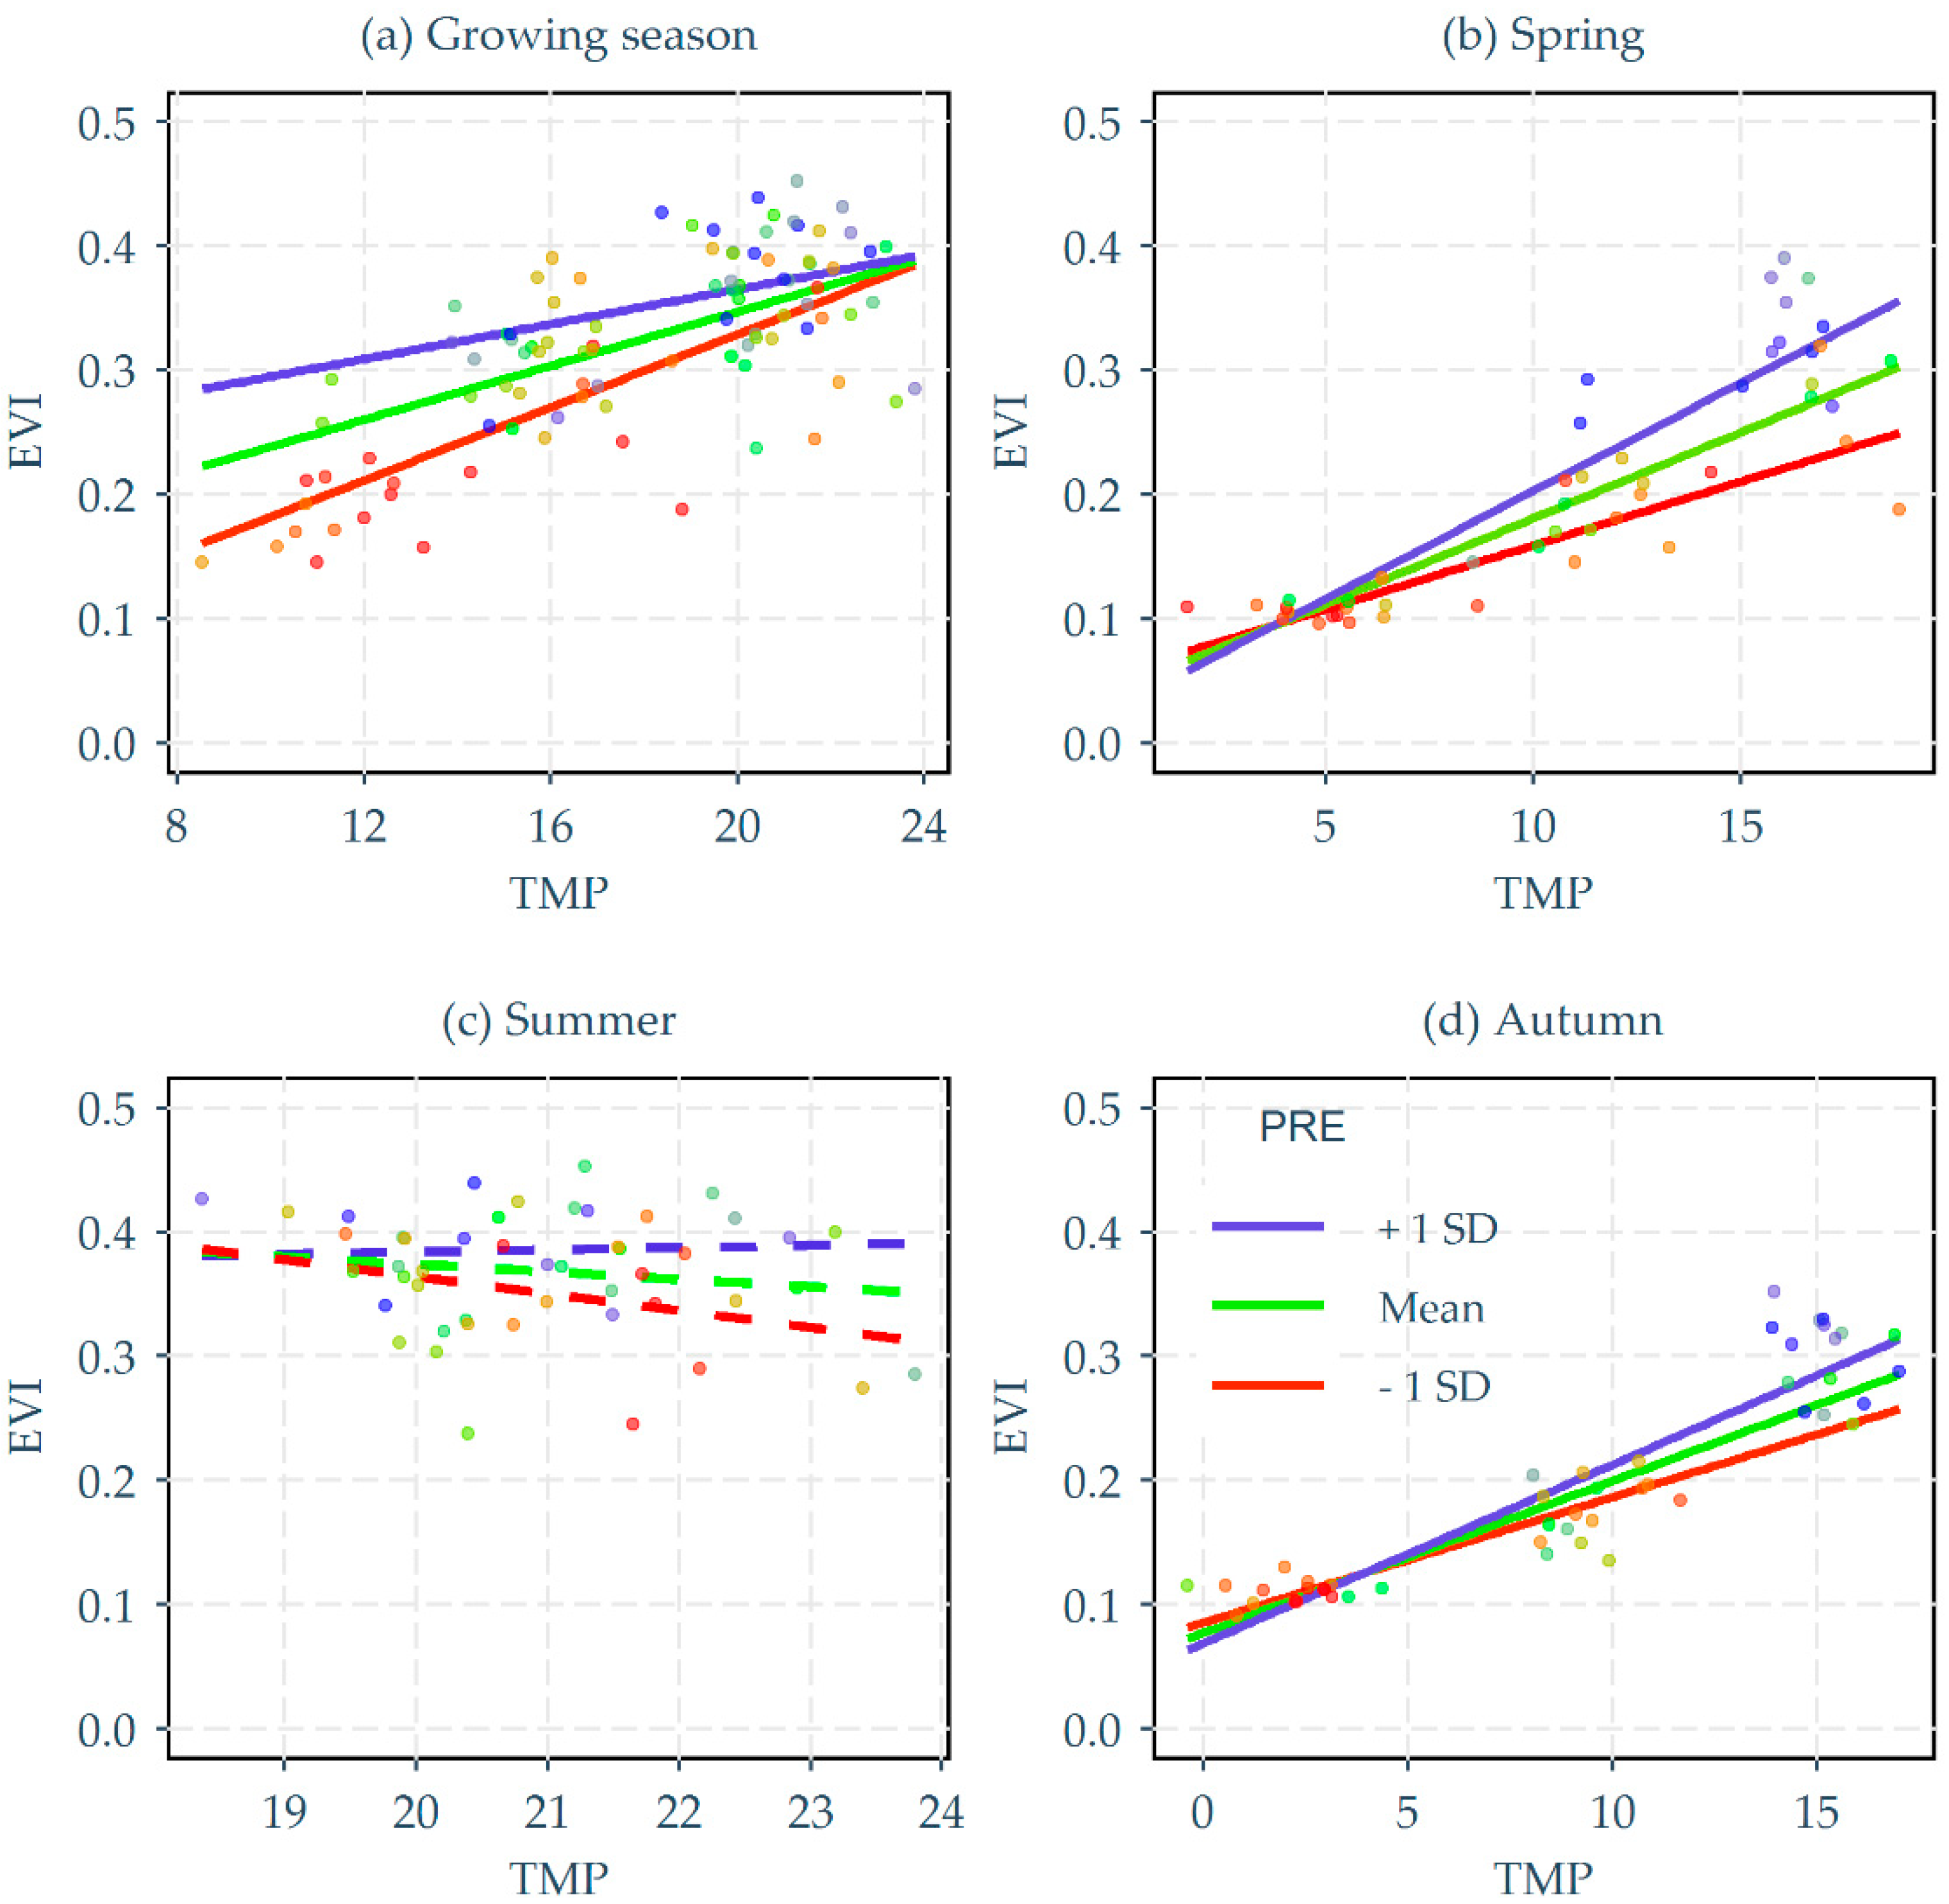
Figure 6.
Predicted effects of the interactions between temperature (TMP, °C) and precipitation (PRE, mm) on EVI for the growing season, spring, summer, and autumn, respectively using simple-slope analysis for 2000–2015. Precipitation was treated as a continuous moderator and depicts the mean of precipitation, and the mean minus and plus one standard deviation (SD). The dashed lines represent non-significant simple slopes. The points are the monthly values averaged across the entire study area.
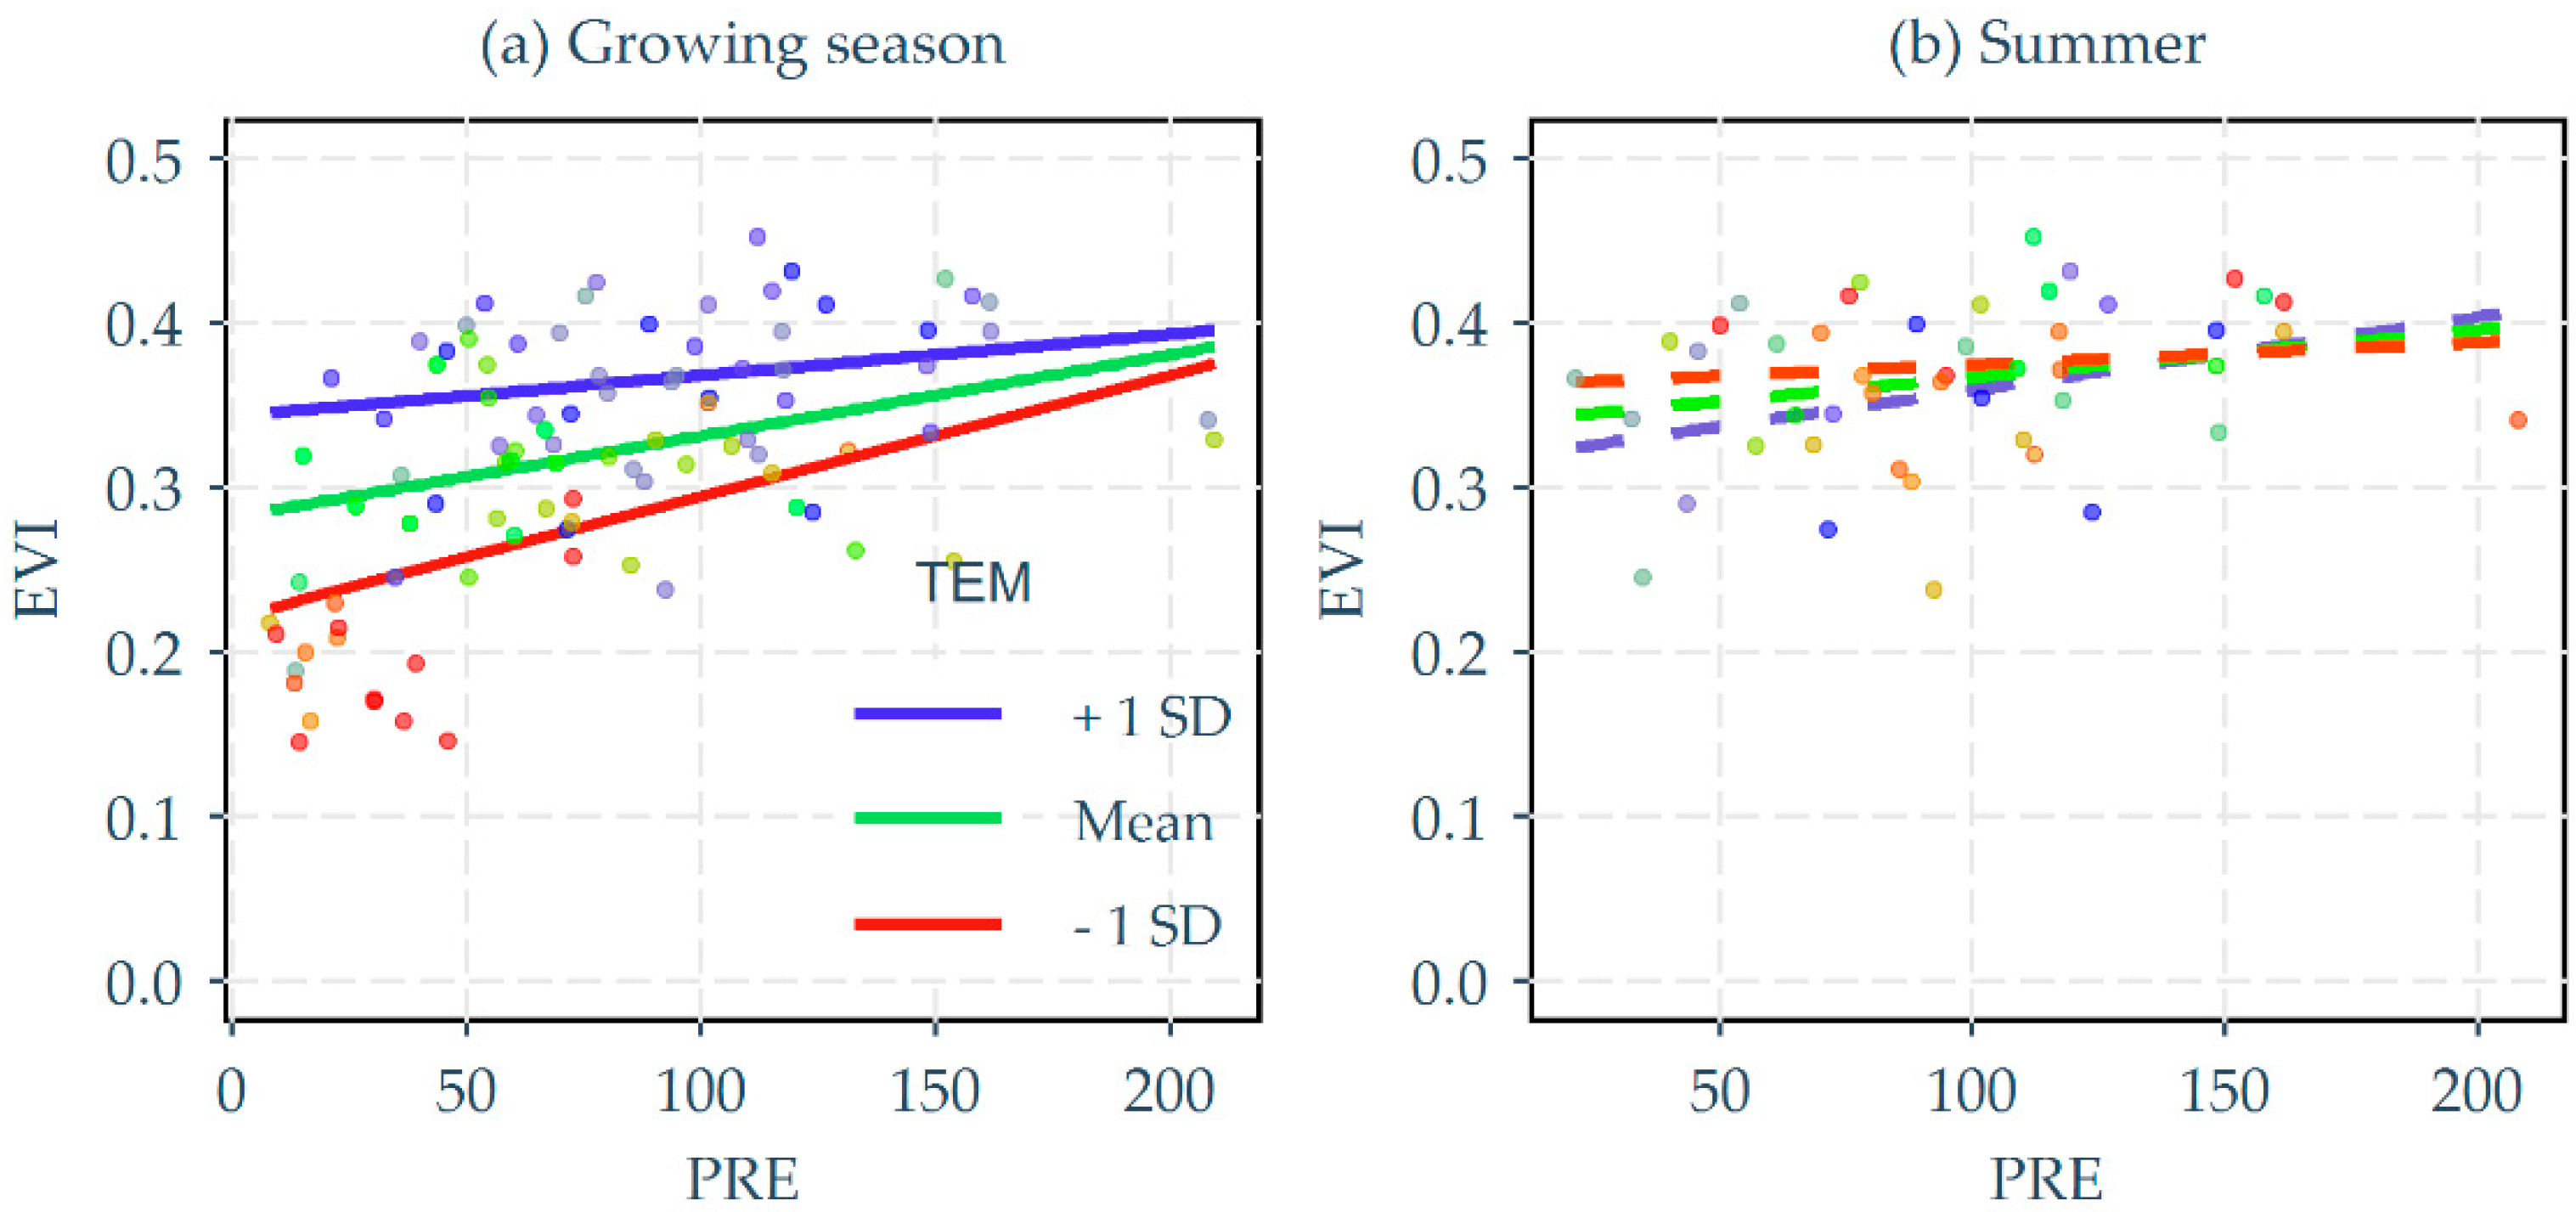
Figure 7.
Predicted effects of the interactions between precipitation (PRE, mm) and temperature (TMP, °C) on EVI for the growing season, spring, summer, and autumn respectively using simple-slope analysis for 2000–2015. Temperature was treated as a continuous moderator and depicts the mean of temperature, and the mean minus and plus one standard deviation (SD). The points are the monthly values averaged across the entire study area.
Figure 8.
Spatial distribution of correlation coefficients between EVI and climate factors in the study area during 2000–2015. (a–d) show the correlation coefficients between EVI and precipitation (PRE, mm) for the growing season, spring, summer, and autumn, respectively. (e–h) portray the correlation coefficients between EVI and temperature (TMP, °C) with the same four study periods as (a–d).
Figure 9.
Predicted effects of the interaction between temperature (TMP, °C) and precipitation (PRE, mm) on EVI for growing season and summer respectively without the extreme precipitation values (>400 mm) using simple-slope analysis for 2000–2015. The temperature was treated as a continuous moderator and depicted the mean of temperature, the mean minus and plus one standard deviation (SD). The points are the monthly values averaged across the entire study area.
Table 1.
Classification criteria for consistency in vegetation growth dynamics.
Table 1.
Classification criteria for consistency in vegetation growth dynamics.
| SEVI | Z | Hurst Exponent | Variation Types |
|---|
| ≥0.0005 | <−1.96 | >0.5 | Consistency and significant increase |
| ≥0.0005 | −1.96 to 1.96 | >0.5 | Consistency and slight increase |
| −0.0005 to 0.0005 | −1.96 to 1.96 | >0.5 | Consistency and stability |
| <−0.0005 | −1.96 to 1.96 | >0.5 | Consistency and slight degradation |
| <−0.0005 | ≥1.96 | >0.5 | Consistency and severe degradation |
| – | – | <0.5 | Undetermined future variation trend |
Table 2.
The significant differences in the distribution of Hurst exponents between land cover classes using a one-way simple ANOVA test for the growing season, spring, summer, and autumn, respectively. Compared land cover classes included forest and crop, forest and grassland, and crop and grassland. *** represents a p-value < 0.001.
| Seasons | Compared Land Covers | F Values | p-Values |
|---|
| Growing season | Forest and crop | 850.2 | <0.001 *** |
| Forest and grassland | 3091 | <0.001 *** |
| Crop and grassland | 475.3 | <0.001 *** |
| Spring | Forest and crop | 3585 | <0.001 *** |
| Forest and grassland | 5493 | <0.001 *** |
| Crop and grassland | 23.7 | <0.001 *** |
| Summer | Forest and crop | 160.1 | <0.001 *** |
| Forest and grassland | 247.9 | <0.001 *** |
| Crop and grassland | 907.1 | <0.001 *** |
| Autumn | Forest and crop | 9941 | <0.001 *** |
| Forest and grassland | 10506 | <0.001 *** |
| Crop and grassland | 139.6 | <0.001 *** |
Table 3.
Average Hurst exponent of forest, grassland, and crop for the growing season, spring, summer, and autumn respectively during 2000–2015.
Table 3.
Average Hurst exponent of forest, grassland, and crop for the growing season, spring, summer, and autumn respectively during 2000–2015.
| Hurst Exponent | Growing Season | Spring | Summer | Autumn |
|---|
| Forest | 0.6507 | 0.6107 | 0.6398 | 0.6142 |
| Grassland | 0.6569 | 0.6217 | 0.6440 | 0.6305 |
| Crop | 0.6545 | 0.6210 | 0.6417 | 0.6324 |
Table 4.
The significant differences in the distribution of EVI at the selected precipitation levels (i.e., mean + SD, mean, mean − SD) using one-way ANOVA analysis for the growing season, spring, summer, and autumn, respectively. Precipitation was considered as the moderator. *** represents a p-value < 0.001.
| Seasons | F Value | p-Value |
|---|
| Growing season | 12 | <0.001 *** |
| Spring | 14.73 | <0.001 *** |
| Summer | 2.52 | 0.09 |
| Autumn | 17.62 | <0.001 *** |
Table 5.
The significant differences in the distribution of EVI between the selected precipitation levels (i.e., mean + SD, mean, mean − SD) using one-way simple ANOVA analysis for the growing season, spring, summer, and autumn, respectively. Precipitation was considered as the moderator. Compared precipitation levels include mean + SD and mean, mean + SD and mean − SD, and mean and mean − SD. * and *** represent a p-value < 0.05 and p-value < 0.001, respectively.
| Seasons | Compared PRE Levels | F Value | p-Value |
|---|
| Growing season | Mean + SD and mean | 0.22 | 0.64 |
| Mean + SD and mean − SD | 21.41 | <0.001 *** |
| Mean and mean − SD | 4.13 | 0.047 * |
| Spring | Mean + SD and mean | 1.41 | 0.25 |
| Mean + SD and mean − SD | 29.28 | <0.001 *** |
| Mean and mean − SD | 2.27 | 0.14 |
| Summer | Mean + SD and mean | 0 | 0.98 |
| Mean + SD and mean − SD | 4.76 | 0.03 * |
| Mean and mean − SD | 0.69 | 0.41 |
| Autumn | Mean + SD and mean | 0.07 | 0.80 |
| Mean + SD and mean − SD | 35.48 | <0.001 *** |
| Mean and mean − SD | 14.81 | <0.001 *** |
Table 6.
The significant differences in the distribution of EVI at the selected precipitation levels (i.e., mean + SD, mean, mean − SD) using one-way ANOVA analysis for the growing season, spring, summer, and autumn, respectively. Temperature was considered as the moderator. The selected temperature levels include mean + SD, mean, and mean − SD. *** represents a p-value < 0.001.
| Seasons | F Value | p-Value |
|---|
| Growing season | 39.32 | <0.001 *** |
| Spring | 26.29 | <0.001 *** |
| Summer | 1.03 | 0.37 |
| Autumn | 46.99 | <0.001 *** |
Table 7.
The results of one-way ANOVA test on EVI at three selected temperature values (i.e., mean + SD, mean, mean − SD) in the growing season, spring, summer, and autumn, respectively. Temperature was considered as the moderator. *** represents a p-value < 0.001.
Table 7.
The results of one-way ANOVA test on EVI at three selected temperature values (i.e., mean + SD, mean, mean − SD) in the growing season, spring, summer, and autumn, respectively. Temperature was considered as the moderator. *** represents a p-value < 0.001.
| Seasons | Compared PRE Levels | F Value | p-Value |
|---|
| Growing season | Mean + SD and mean | 1.12 | 0.29 |
| Mean + SD and mean − SD | 60.1 | <0.001 *** |
| Mean and mean − SD | 71.2 | <0.001 *** |
| Spring | Mean + SD and mean | 10.5 | <0.001 *** |
| Mean + SD and mean − SD | 158 | <0.001 *** |
| Mean and mean − SD | 20.57 | <0.001 *** |
| Summer | Mean + SD and mean | 0.002 | 0.96 |
| Mean + SD and mean − SD | 1.44 | 0.25 |
| Mean and mean − SD | 2.11 | 0.16 |
| Autumn | Mean + SD and mean | 23.15 | <0.001 *** |
| Mean + SD and mean − SD | 400.5 | <0.001 *** |
| Mean and mean − SD | 23.04 | <0.001 *** |


