Article

Functional Diversity of the Soil Culturable Microbial Community in Eucalyptus Plantations of Different Ages in Guangxi, South China

1
Key Laboratory of Agro-Ecological Processes in Subtropical Region, Institute of Subtropical Agriculture, Chinese Academy of Sciences, Changsha 410125, China
2
College of Agriculture, Guangxi University, Nanning 530005, China
3
Agricultural Resources and Environment Research Institute Guangxi Academy of Agricultural Sciences, Nanning 530007, China
4
Huanjiang Observation and Research Station for Karst Ecosystem, Chinese Academy of Sciences, Huanjiang 547100, China
*
Authors to whom correspondence should be addressed.
Forests 2019, 10(12), 1083; https://doi.org/10.3390/f10121083
Submission received: 24 September 2019 / Revised: 18 November 2019 / Accepted: 19 November 2019 / Published: 28 November 2019
(This article belongs to the Section Forest Ecology and Management)

Abstract

:
We selected five different ages of eucalyptus plantation sites to understand the culturable microbial functional diversity and the ecological functions of the soil from the eucalyptus plantations in Guangxi. We investigated the carbon source metabolic activity and diversity features of surface soil microbes using the Biolog EcoPlate method (Biolog Inc., Hayward, CA, USA), along with the microbial functional diversity and physicochemical properties of the soil. The results suggest that the carbon source utilization capacity of the soil microbes at various forest ages manifested as 3-year-old > 5-year-old > 2-year-old > 1-year-old > 8-year-old. The abundance, Shannon–Weiner, Pielou, Simpson, and McIntosh diversity indices of the soil microbes initially increased and then decreased with further increase in forest age, with the highest levels in 3- and 5-year-old forests. As per the heatmap analysis, the 3-year-old forest could metabolize the most carbon source species, while the 1- and 8-year-old forests could metabolize the least. Carbohydrates were the most frequently metabolized carbon source. The principal component analysis (PCA) shows that PC1 and PC2 extracted from the 31 factors have 52.42% and 13.39% of the variable variance, respectively. Carbohydrates contributed most to PCA, followed by amino acids and carboxylic acids, and phenolic acids and amines, the least. Canonical correspondence analysis shows that total carbon, alkali-hydrolyzable nitrogen, total nitrogen, total potassium, and pH negatively correlate with soil microbial functional diversity, whereas total and available phosphorus positively correlate with it. To sum up, the soil microbial community structure of eucalyptus plantations at various ages reflects the soil environmental conditions and nutrient availability, which is of great significance in the efficient management and high-quality operation of their plantations in Guangxi.

1. Introduction

Soil is a complex and dynamic ecosystem, composed of several abiotic and biotic components that constantly interact with each other. Microbes are important biological components of the soil [1] and play a crucial role in maintaining and facilitating the geochemical cycles [2], organic matter decomposition, and soil mineralization, which are the main drivers of pedological mass circulation and indispensable soil quality assessment indices [3]. Understanding the correlation between microbial diversity and soil function is still unclear and therefore, at present, this topic has garnered great interest in forest soil research [4]. Microbial diversity comprises of three aspects, namely, community diversity, genetic diversity, and functional diversity [5]; among these, functional diversity is an indicator of the soil microflora status and function and can reflect the ecological features of microbes in soil [6]. Several methods are known for measuring microbial functional diversity, such as phospholipid fatty acid analysis, high-throughput sequencing, Biolog EcoPlate assay, and conventional dilution plating [7], of which, the Biolog EcoPlate assay is currently one of the most used [8]. The principle of this assay is based on the utilization of a carbon substrate, present together with a redox dye, by the microbial communities [9] in a microplate to develop a colored product, which is then used to obtain the physiological traits [10] and functional diversity [11] of the microbial community. The advantages of this technique are that it is simple to use, does not need isolated cultures, and can maintain the microbial metabolic characteristics at its maximum [12]. Moreover, the assay is very sensitive in reflecting the dynamic changes in culturable functional microflora, therefore, it is widely used for assessing the metabolic functional diversity of forest soil microbial communities with different management models [13,14], soil types [15,16,17], land-use patterns [18], vegetation forms and revegetation methods [19,20], and altitudes [21]. The existing studies indicate that microbial community structure and diversity are closely correlated with various soil environmental factors, such as pH, organic matter, nitrogen, phosphorus, and potassium. Therefore, analyzing the structure and functional features of microbial communities can help in understanding the ecological environment quality and trend of the forest stand [22,23,24].
Eucalyptus plantations, a general name given to eucalyptus species (family Myrtaceae), have one of the largest areas under its cultivation in South China, with 1,712,968 hm2 in Guangxi [25]. The genus is characterized by a broad distribution, large cultivation area, high yield, and great benefits [26]. Although it is a fast-growing tree species, its development has been debated among various circles and no consensus has been reached as to whether the soil productivity declines in the course of eucalyptus plantation development. Behera et al. claimed that the soil productivity gradually declines with the increasing forest age [27], while Liu et al. reported a gradual improvement in the soil fertility with the increasing forest age, without soil degradation [28]. The decline in soil productivity disrupts the dynamic equilibrium of soil microbial communities, which in turn further exacerbates soil degradation. Hence, research on the functional diversity of soil microbial communities can help in understanding the forest soil quality, preventing soil degradation, and improving the cultivation and management of the plantations [29]. The existing studies about the eucalyptus plantations in Guangxi mostly focus on biological diversity [30,31], ecological benefit evaluation [32], soil degradation and fertility [33], and biomass and productivity [34]; in addition, there are also a few studies on the microbial functional diversity comparing different forest stands [35,36]. However, the trends in the soil microflora structure with the increasing age of eucalyptus plantations have rarely been reported.
Therefore, we explored the community functional diversity of soil culturable microbes in eucalyptus plantations of different ages (1-year-old, 2-year-old, 3-year-old, 5-year-old, 8-year-old) in Guangxi using Biolog EcoPlate assay to analyze the various features of soil culturable microbial communities and the ecological effects of edaphic factors in the plantation. The findings of this study will help identify the differences in soil microflora characteristics between eucalyptus plantations of different ages and uncover the "soil–plant–microbe" relationship in the plantation’s ecosystem [36].

2. Materials and Methods

2.1. Profile of the Study Site

The study area was located in the southeastern Guangxi’s main eucalyptus production area (22°38′–24°24′N, 107°34′–111°33′E), which falls in the monsoon climate zone with a transition from south subtropical to mid-subtropical. It has an average annual temperature of 21.5–22 °C, an average January temperature of 12.8–13.5 °C, average July temperature of 27.9–28.3 °C, a total annual accumulated temperature of 7190–8030 °C, an average annual precipitation of 1300–1800 mm, average annual evaporation of 1600 mm, and average relative humidity of 74.8%. The soil here has five subtypes (red, yellow, yellow-red, brown calcareous, and black calcareous). For our study we used latosolic red soil developed from sand shales [37,38,39].

2.2. Plot Selection and Soil Collection

Eucalyptus plantation sampling points were set up at five forest ages in southeastern Guangxi’s main eucalyptus production area. Three replicate plots separated by more than 200 m were established for each forest age [38]. With an individual size of 20 × 50 m, the plots shared identical site conditions and operational management measures. The surface soil (0–20 cm deep) from each sample plot was collected quincuncially using a 5-cm diameter soil auger in accordance with the forestry industry standards methodologies for field long-term observation of forest ecosystems (GB/T 33027-2016) [40] and mixed to obtain the test samples. After sieving the soil samples through quartering, they were divided into two portions, one stored in a 4 °C refrigerator for subsequent functional diversity measurement of soil microbial communities, and the other dried naturally and sieved for the analysis of soil physicochemical properties [41]. In Table 1, the basic chemical properties of experimental soils are listed.

2.3. Chemical Analysis and Biolog EcoPlate Technique

2.3.1. Soil Chemical Analysis

Soil pH was determined by electrode potentiometry. Its total carbon (TC) and total nitrogen (TN) were analyzed with an elemental analyzer (VARIOMAX CN, Elementar, Langenselbold, Germany). Total phosphorus (TP) was measured by NaOH fusion, Mo-Sb colorimetry, and ultraviolet spectrophotometry. Total potassium (TK) was measured by NaOH fusion and atomic absorption spectrometry. Available nitrogen (AN) was measured by alkaline hydrolysis diffusion and available phosphorus (AP) was measured by NaHCO3 (0.5 mol·L−1) extraction, Mo-Sb colorimetry, and ultraviolet spectrophotometry. Available potassium (AK) was measured by NH4CH3CO2 extraction and atomic absorption spectrometry [42,43].

2.3.2. Soil Microbial Metabolic Activity Analysis

Functional diversity of the soil microbes was determined by Biolog EcoPlate assay [10]. The plate has 96 wells and 31 different carbon source substrates (Table 2); the experiment was performed in triplicates by dividing the plate into three groups (n = 32 wells), with each group containing 31 carbon sources and one control well. Initially, 10 g of fresh soil was weighed and activated for 24 h at 25 °C, then placed in a triangular flask containing 100 mL of sterile NaCl solution (0.85%), sealed, shaken at 170 r/min on a 4 °C shaker for 30 min, and allowed to stand for 30 min [44]. After clarification, the suspension was diluted to 1000-fold, followed by inoculating 150 μL of the sample suspension into each well of the plate [45]. The inoculated plate was incubated in the dark at 25 °C, and the optical density was measured at 590 nm at 0, 24, 48, 72, 96, 120, 144, 168, 192, 216, and 240 h after incubation with a Biolog reader [10].

2.4. Statistical Analyses

The metabolic activity of soil microbes was expressed by the average well color development (AWCD) [13].
A W C D = i 31 ( C i R ) / n ,
where Ci denotes the absorbance of each medium containing well; R denotes the absorbance of the blank control well; and n is the number of carbon source types (n = 31).
The AWCD values reached the stationary phase after 192 h of incubation for all the forest age groups. Hence, the OD value after 192 h of incubation was used to calculate the metabolic functional diversity indices of the microbial community structure, which included the Shannon–Weiner index (H), Pielou index (J), Simpson’s index (DS), McIntosh index (U), and abundance (R) [46,47].
H = i = 1 31 P i ln P i ,
J = H ln n ,
D s = 1 P i 2 ,   and
U = ( n i 2 ) ,
where S is the total number of carbon sources utilized, Pi denotes the ratio of the absorbance difference between the ith and the control wells to the total absorbance of the entire plate, and ni denotes the relative absorbance of the ith well.
Microsoft Excel (Version 2013, Redmond, WA, USA) was used for statistically analyzing and mapping the data. The SPSS software (Version 21.0, Chicago, IL, USA) was used for performing the one-way analysis of variance (ANOVA), LSD (least significant difference) significance test of difference, and microbial hierarchical cluster analysis and plotting. The Origin (Version 9.1, Hampton, MA, USA) was employed for heatmap analysis, and the Canoco software (Version 5, Ithaca, NY, USA) was used for principal component and canonical correspondence analyses.

3. Results

3.1. Changes in Soil Microbial AWCD at Different Forest Age with Time

The AWCD values of soil microbiota at different forest ages gradually increased with time, suggesting that soil microbiota has an enhanced capacity to utilize the single carbon source when there is an extended interaction time between them (Figure 1). Notably, the AWCD values were small for the first 24 h, indicating that the carbon source was not utilized at all; between 24–48 h, the AWCD values of the 2-, 3- and 5-year-old forests began to increase slightly, whereas no clear changes were observed in the AWCD values of 1- and 8-year-old forests. The AWCD values rapidly increased between 48–192 h because during this period, the microbiotas were at their growth phase and the carbon sources were greatly utilized; after the growth phase, they entered the stationary phase stage at 192 h, with slow growth. During the entire culture period, the AWCD values at each forest age manifested as 3-year-old > 5-year-old > 2-year-old > 1-year-old > 8-year-old with the extension in incubation time; the AWCD values in the soil microbiota showed the greatest variation in 3- and 5-year-old forests, whereas they showed the least variation in 1- and 8-year-old forests, suggesting that the utilization rate of carbon source by the soil microbiota increased and then decreased with the increase in forest age.

3.2. Changes in Soil Microbial Diversity Index at Different Forest Age

The difference in the type of carbon source utilized by a soil microbial community reflects the microbial diversity index and namely, the ecological characteristics of the soil microbes. As the inflection point for the AWCD values was 192 h, the data after 192 h of incubation were used to calculate the R, H, J, DS, and U (Table 3). The H and J of the soil microbial community in eucalyptus plantations manifested as 3-year-old > 5-year-old > 2-year-old > 1-year-old > 8-year-old. Meanwhile, the DS, R, and U manifested as 3-year-old > 5-year-old > 2-year-old > 8-year-old > 1-year-old. Among the different forest ages, the 3-year-old forest had the highest levels for all the indices. When compared with the 1-, 2-, 5-, and 8-year-old forests, it was found that the soil H of the 3-year-old forest increased by 5.03%, 4.74%, 0.69%, and 8.55%, respectively, on average; J increased by 8.27%, 4.73%, 0.69%, and 8.54%, respectively, on average; DS increased by 3.68%, 1.43%, 0.11%, and 1.83%, respectively, on average; U increased by 109.20%, 39.84%, 2.02%, and 96.20%, respectively, on average; and R increased by 31.88%, 21.33%, 2.25%, and 26.39%, respectively, on average. In addition, differences in all the indices were significant in soil microbial communities at various forest ages, except for the DS. The diversity indices and AWCD values at various forest ages were used to perform a cluster analysis, and the results showed that the five forest ages were clustered into two parts (Figure 2); namely, 2-, 3-, and 5-year-old forests were clustered together, whereas 1- and 8-year-old forests were clustered together.

3.3. Carbon Source Utilization Level by Soil Microbiota

There were 31 types of carbon sources in the Biolog EcoPlate, including carbohydrates (12 types), polymers (4 types), carboxylic acids (5 types), phenolic acids (2 types), amino acids (6 types), and amines (2 types) (Table 2). The utilization of these six categories of carbon sources by soil microbiota in eucalyptus plantations at various forest ages was distinctly different; the 3- and 5-year-old forests had significantly greater utilization rates of carbon sources than the other forests (Figure 3). The carbon source utilization rates in the 1-, 3-, and 5-year-old forests followed the order of carbohydrates > amino acids > carboxylic acids > polymers > amines > phenolic acids; whereas those in the 2- and 8-year-old forests followed the order of carbohydrates > amino acids > polymers > carboxylic acids > amines > phenolic acids. Thus, carbohydrates were the major carbon source utilized by eucalyptus rhizosphere soil culturable microbiota, while phenolic acids and amines were the least utilized.

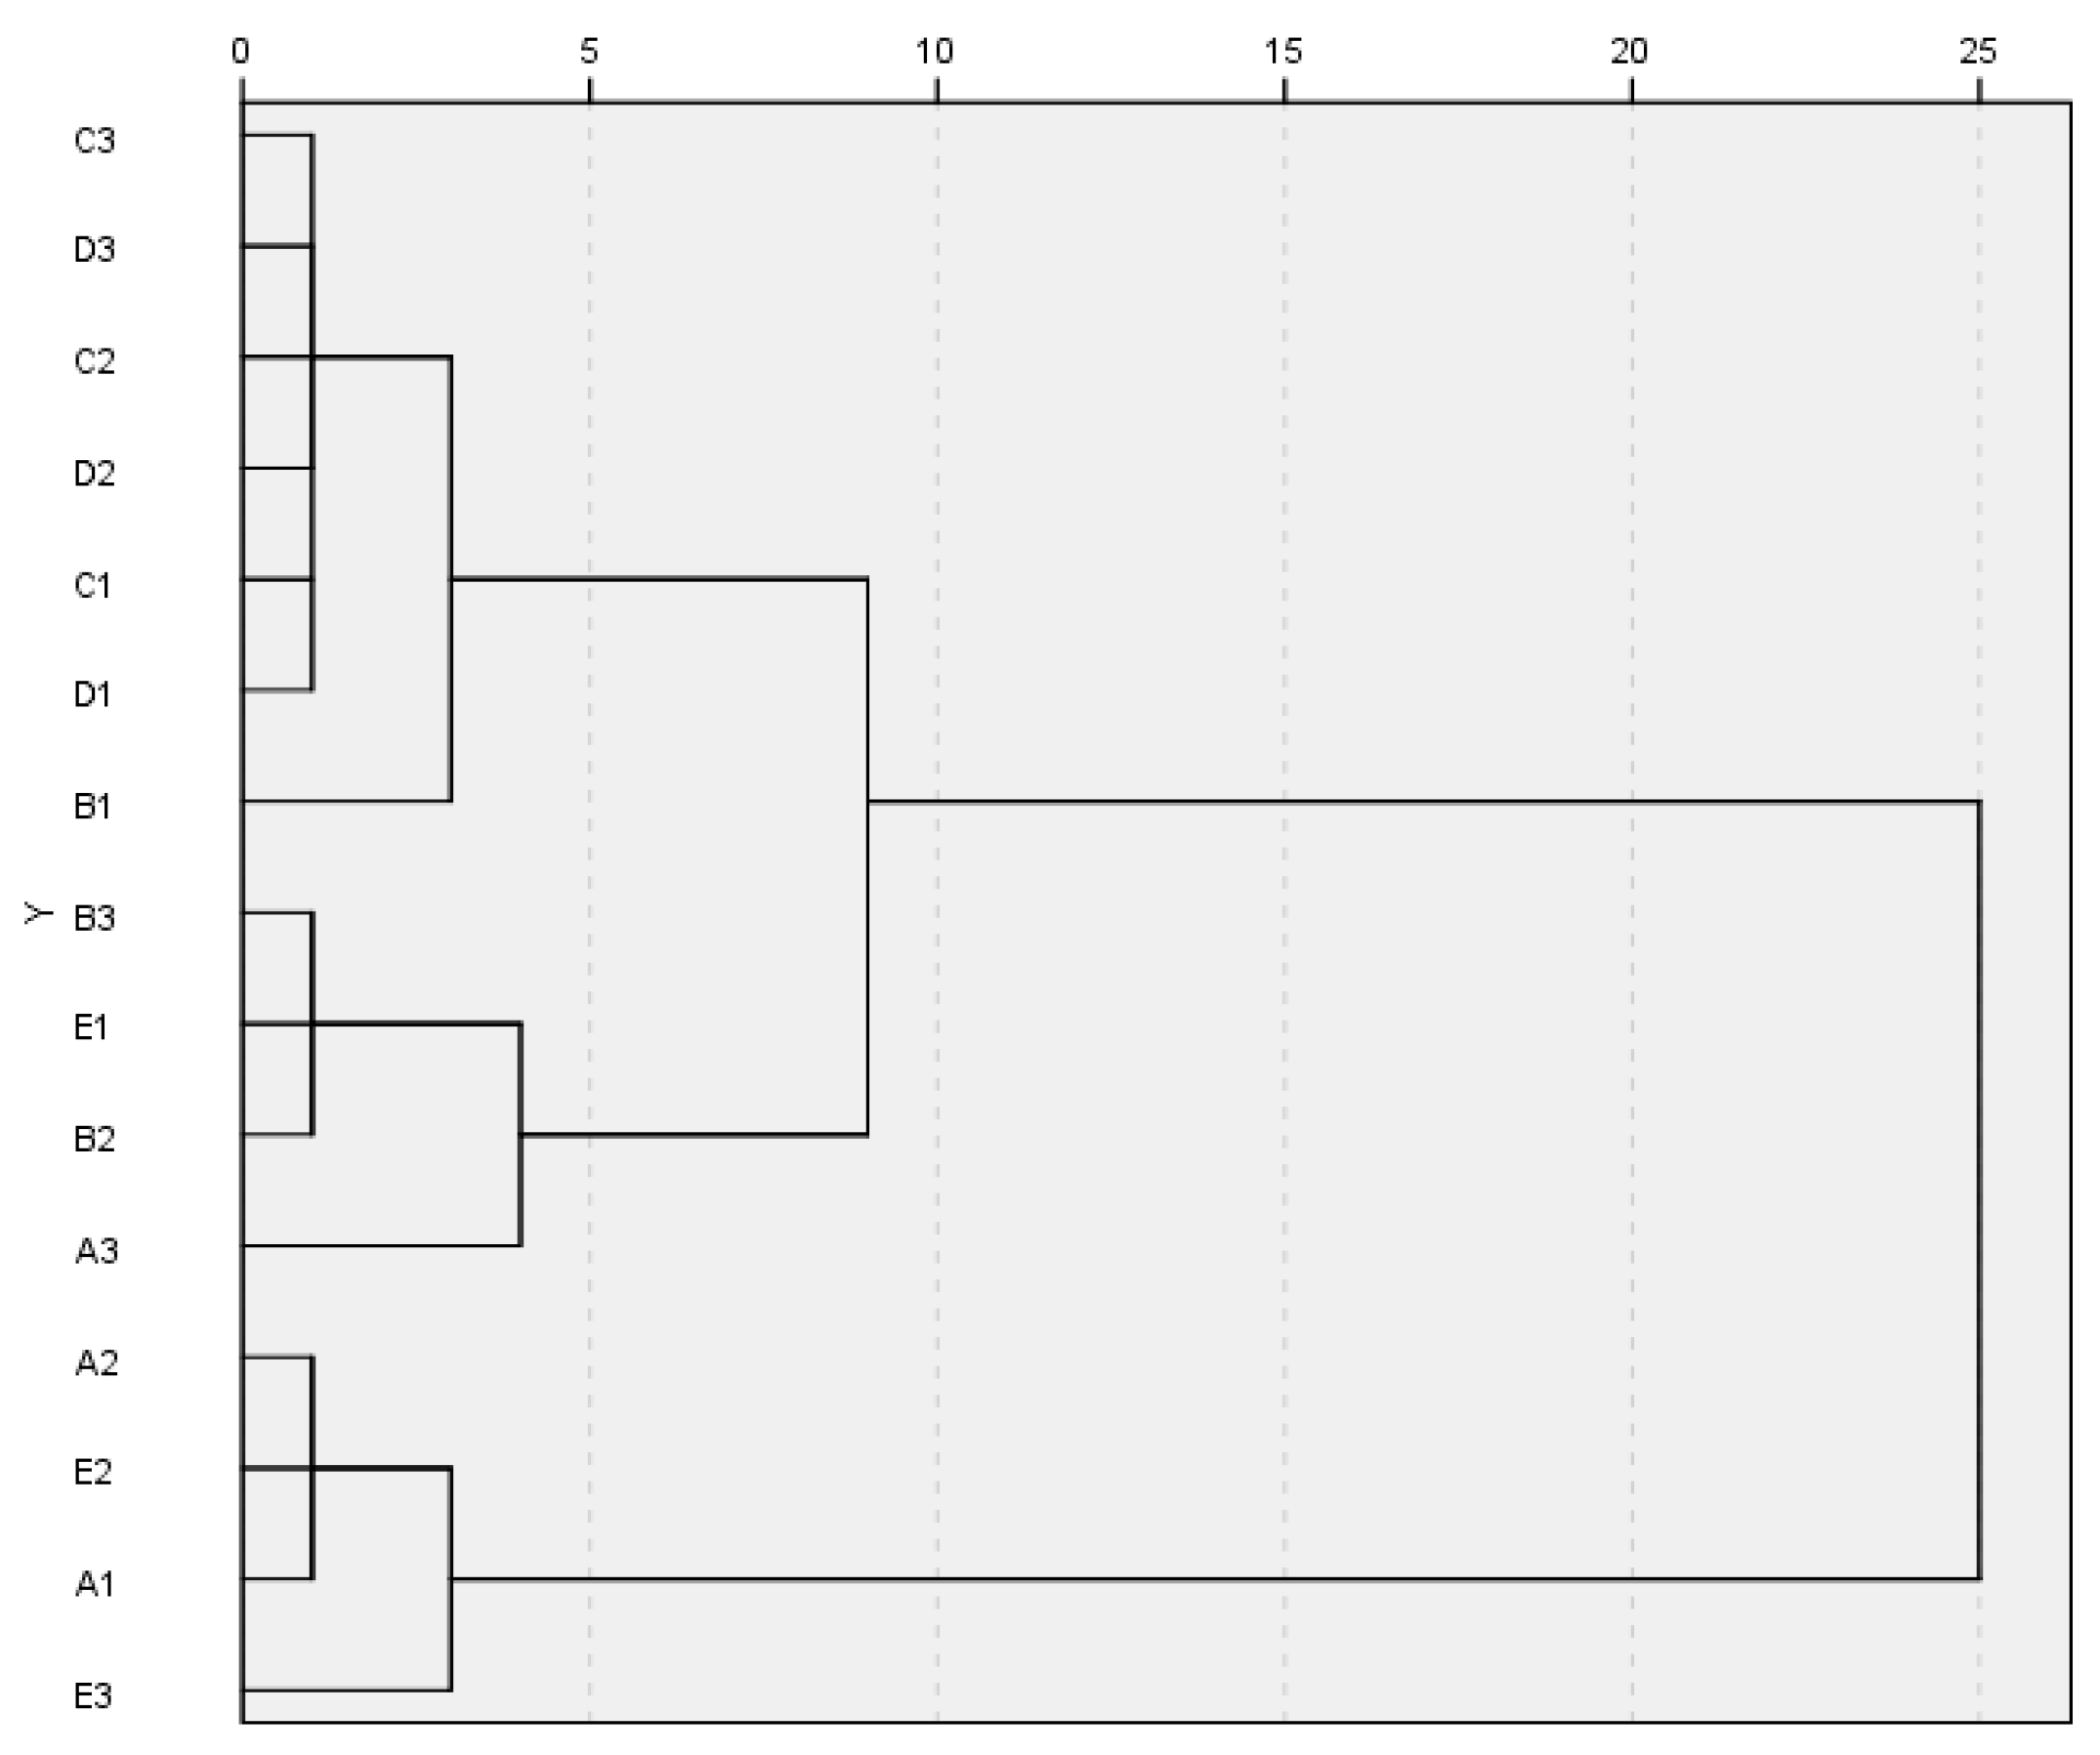
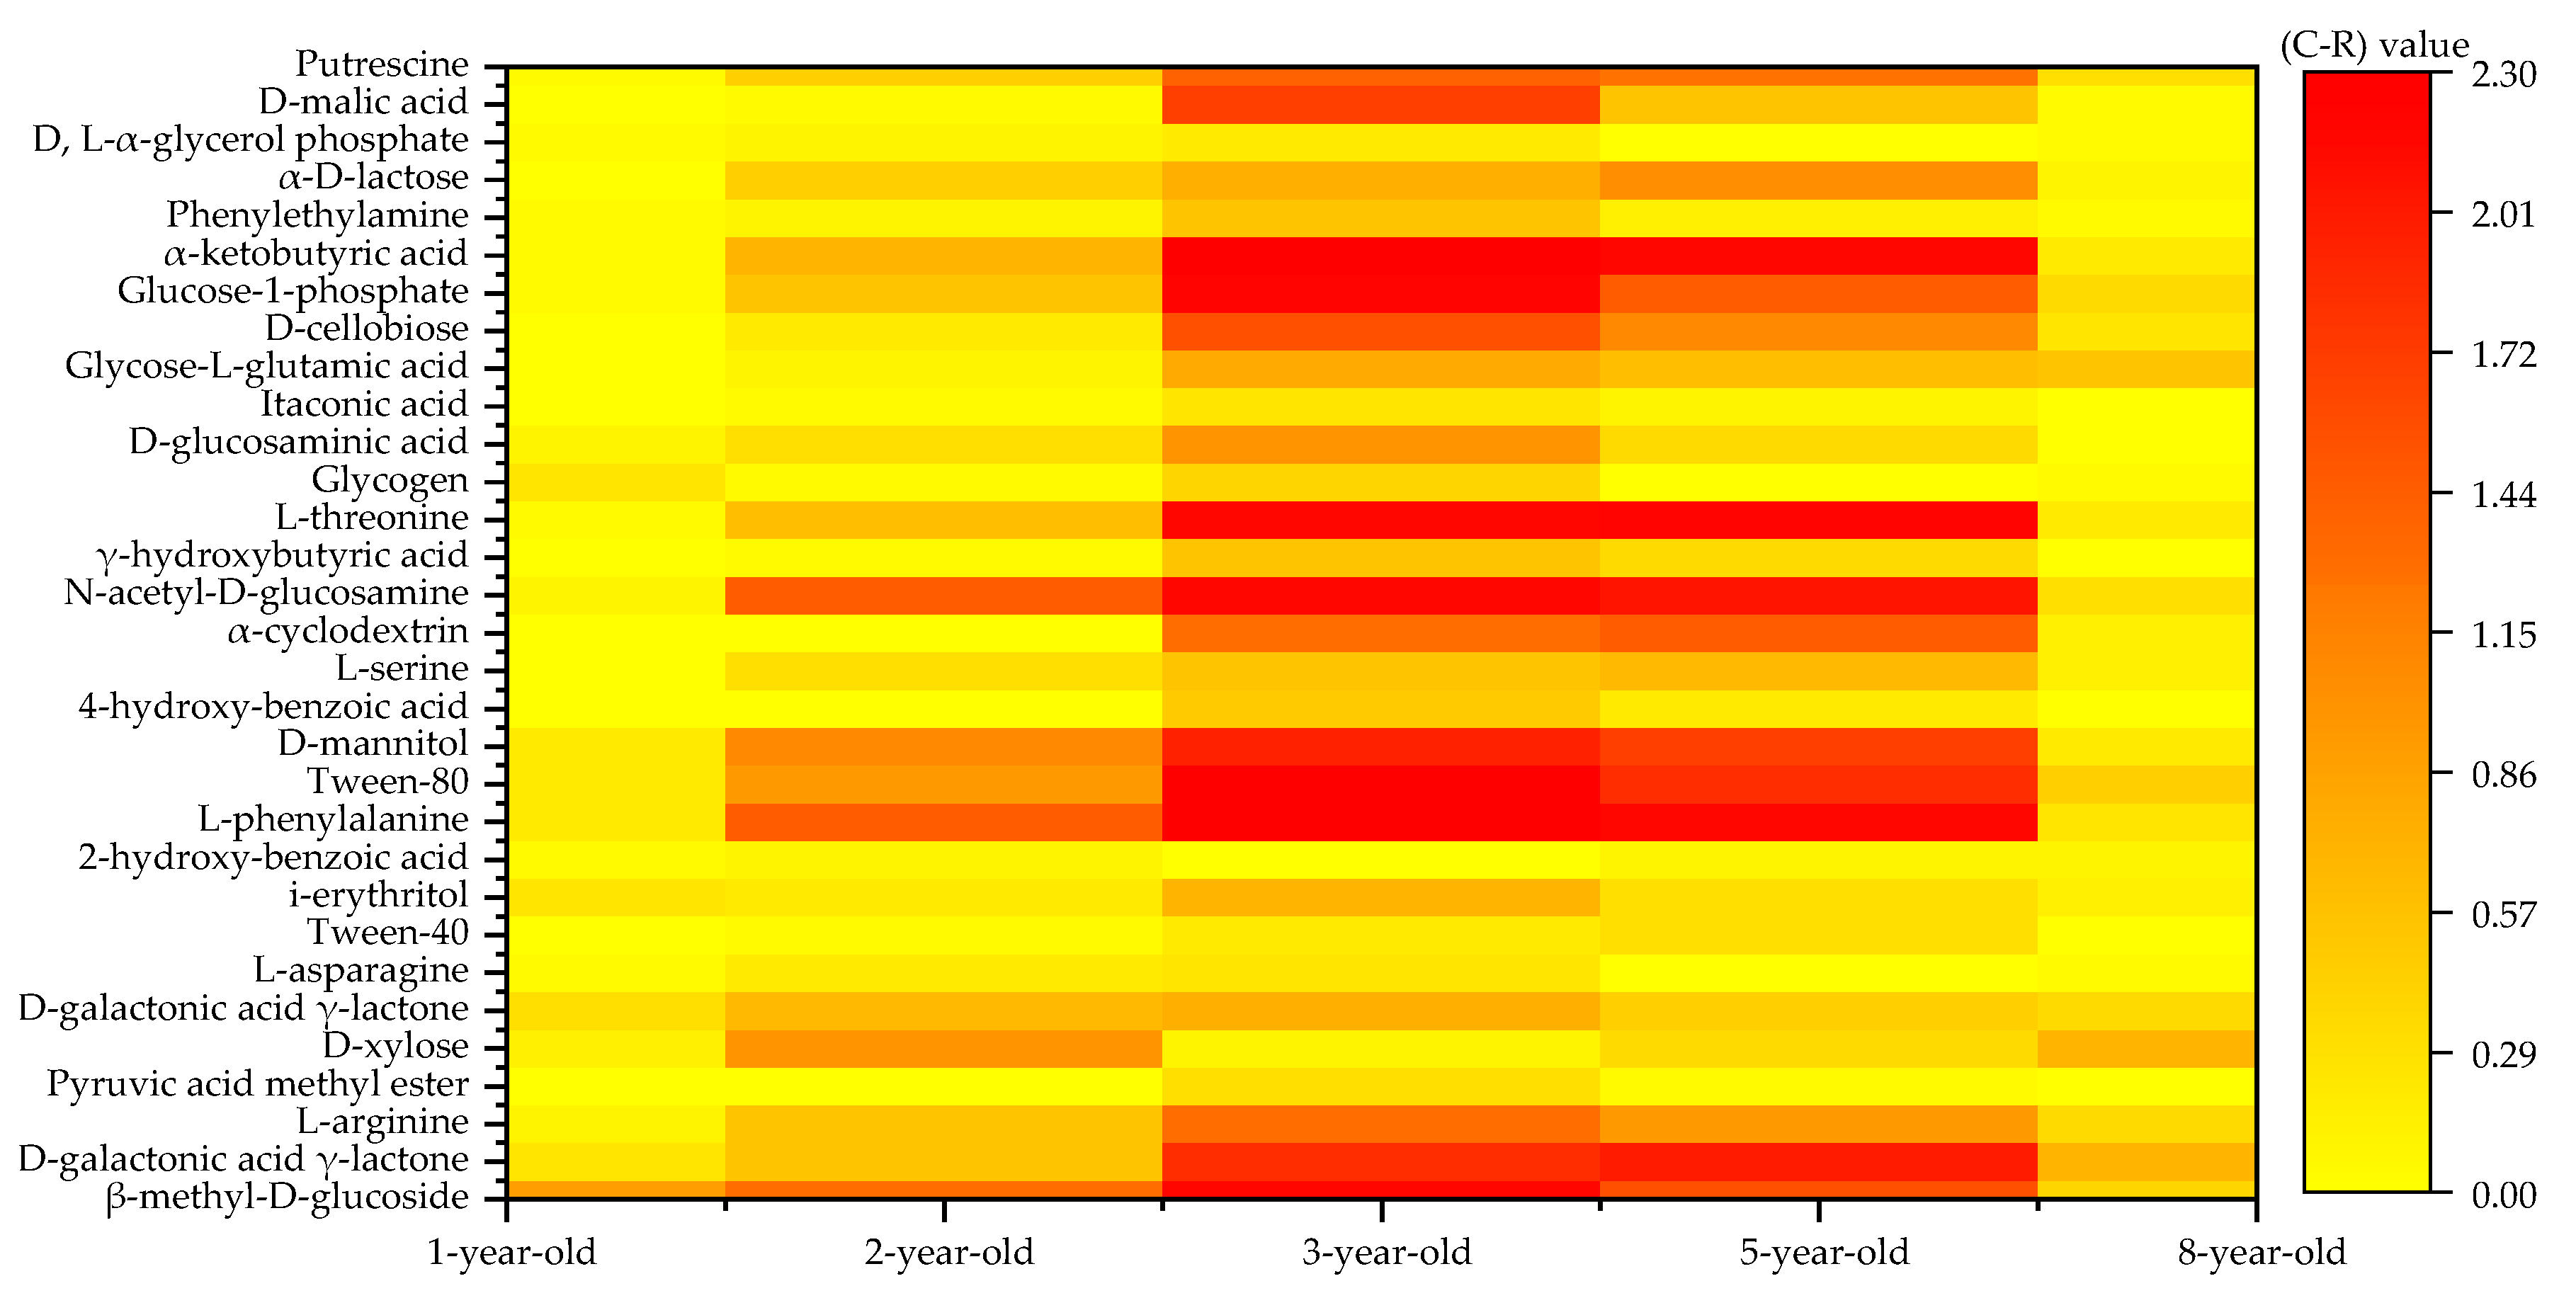
3.4. Carbon Source Species Utilized by the Soil Microbial Community in Eucalyptus Plantations at Various Forest Ages

The (C-R) values of 31 carbon source species from the 192 h eucalyptus soil samples at various forest ages were used to create a heatmap (Figure 4). The results suggest that there was a great difference in the carbon source species metabolized by the soil microbiota at various forest ages, among which, the 1-year-old forest could only metabolize β-methyl-D-glucoside. The 2-year-old forest could only metabolize L-arginine, D-galactonic acid γ-lactone, β-methyl-D-glucoside, D-xylose, D-galacturonic acid, L-phenylalanine, Tween-80, D-mannitol, N-acetyl-D-glucosamine, L-threonine, glucose-1-phosphate, and α-ketobutyric acid. The 3-year-old forest could utilize all the carbon sources except pyruvic acid methyl ester, D-xylose, L-asparagine, Tween-40, 2-hydroxy-benzoic acid, 4-hydroxy-benzoic acid, glycogen, itaconic acid, and D, L-α-glycerol phosphate. The 5-year-old forest could utilize 17 carbon sources, which were β-methyl-D-glucoside, D-galactonic acid γ-lactone, L-arginine, L-phenylalanine, Tween-80, D-mannitol, L-serine, α-cyclodextrin, N-acetyl-D-glucosamine, L-threonine, glycose-L-glutamic acid, D-cellobiose, glucose-1-phosphate, α-ketobutyric acid, α-D-lactose, D, L-α-glycerol phosphate, and putrescine. The 8-year-old forest could only utilize three carbon sources, which were D-galactonic acid γ-lactone, D-xylose, and glycose-L-glutamic acid. Thus, it was observed that the 3-year-old forest could metabolize the most number of carbon source species, whereas the 1- and 8-year-old forest could metabolize the least number of carbon source species. In addition, carbohydrates were the most frequently metabolized carbon source.

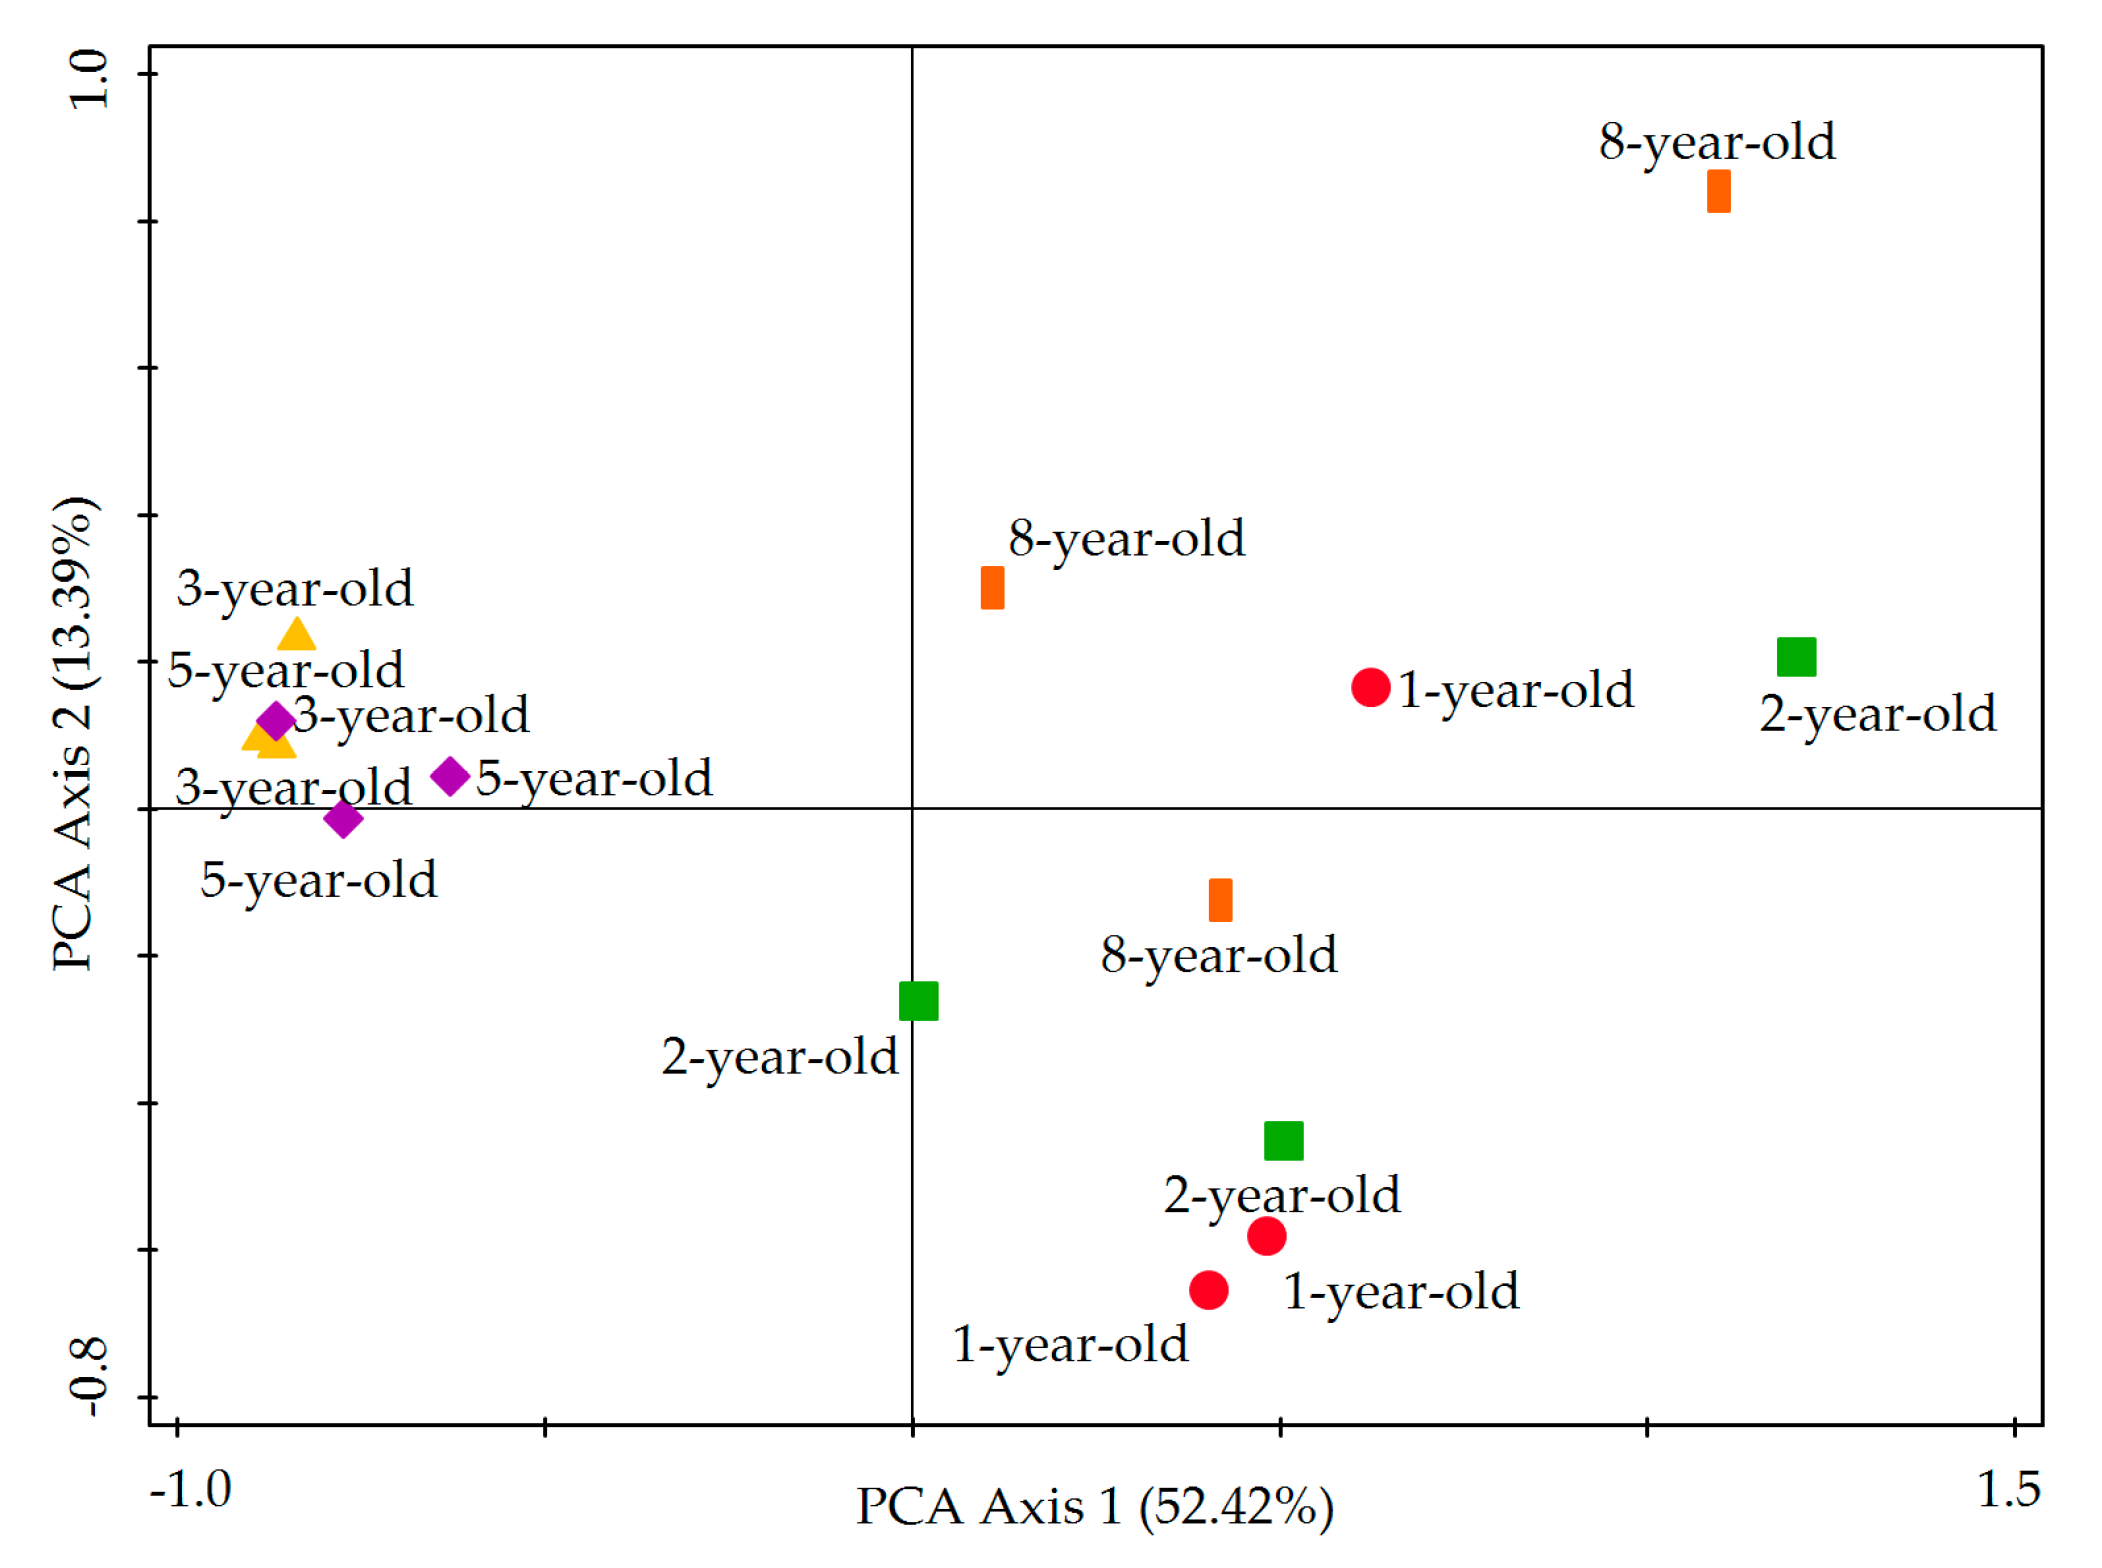
3.5. Principal Component Analysis (PCA) of Carbon Source Utilization by Soil Microbiota

Using PCA, four principal components were extracted from the 31 factors, which had the eigenvalues of 0.5242, 0.1339, 0.0943, and 0.0661, respectively, with the cumulative variance contribution rate as high as 81.86%. Among these, the top two principal components PC1 and PC2 had contribution rates of 52.42% and 13.39%, respectively, and both these components were used to analyze the microbial community functional diversity (Figure 5). There were distinct differences in the soil microbial communities from the eucalyptus plantations at five different forest ages. Typically, the data points of the 1-, 2-, and 8-year-old forests were dispersed, demonstrating great variations in their soil metabolic diversity type; the data points of 3- and 5-year-old forests were concentrated, suggesting their similar soil metabolic functions. The differences in the utilization of the same carbon source at various forest ages were also significant. After analyzing the factor loading of the top two principal components (Table 3), 14 kinds of single carbon sources were found to contribute greatly to PC1 (with the factor loading >0.8), including α-cyclodextrin, phenylethylamine, γ-hydroxybutyric acid, 4-hydroxy-benzoic acid, D-malic acid, L-serine, itaconic acid, D-glucosaminic acid, Tween-80, glycyl-L-glutamic acid, putrescine, L-arginine, Tween-40, and glucose-1-phosphate; whereas, carbohydrates, including D-xylose/aldopentose, N-acetyl-D-glucosamine, and D-mannitol made great contributions to PC2 (with the factor loading >0.5). Thus, carbohydrates made major contributions in principal component separation.

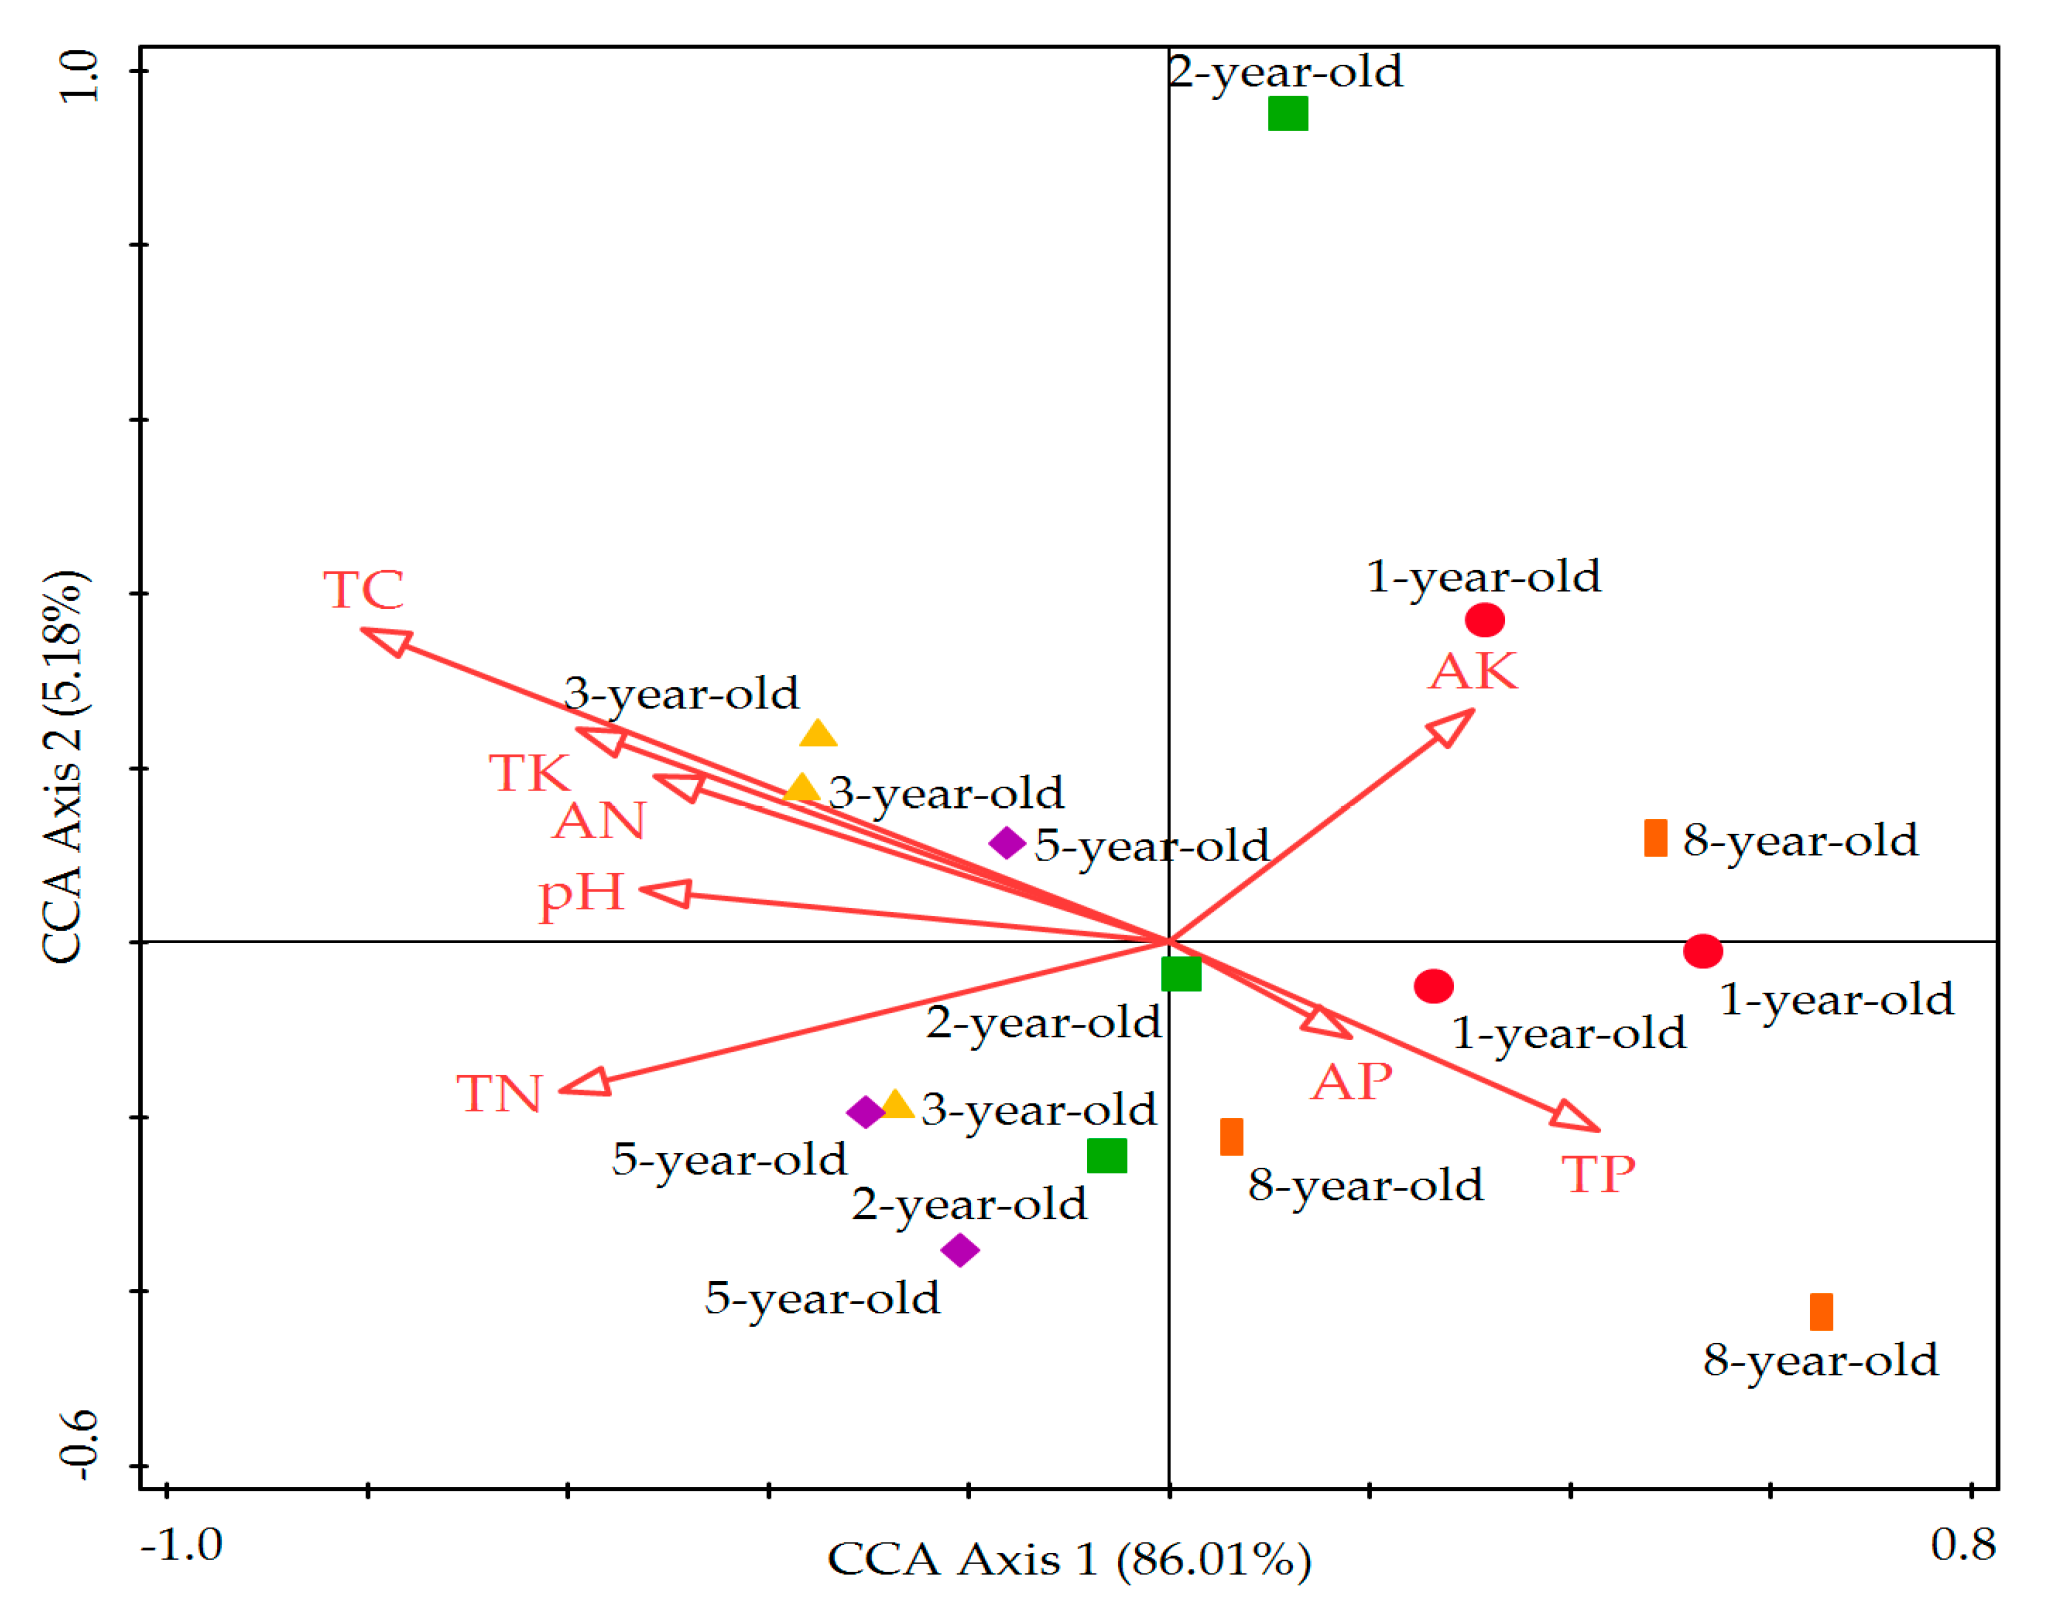
3.6. Relationship between Soil Microbial Community Functional Diversity with Soil Chemical Factors

The diversity index and soil factor data in the experimental plots were subjected to canonical correspondence analysis (CCA) (Figure 6). The cumulative degree of interpretation of the first two axes was as high as 91.19%, indicating that the first two axes in CCA could well reflect the relationship between the community species and environment in the researched region. The included angles of pH, TN, and AN with the primary shaft were small, followed by the angles of TK and TC with the primary shaft, suggesting a great correlation of these factors with the primary shaft, and in this case, a markedly negative correlation. The included angles of TP and AP had a great correlation with the secondary shaft, indicating a close correlation of these factors with the soil microbial functional diversity.

4. Discussion

4.1. Variations of Soil Microbial Carbon Source Utilization Activity in Eucalyptus Forests at Various Forest Ages

AWCD is related to the number and species of microbiota that can utilize the single carbon source in a soil microbial community, and it reflects the overall capacity of the microbial community to utilize the carbon source [48,49] (Figure 1). In this experiment, the AWCD of the soil microbes from eucalyptus plantations at various forest ages displayed the conventional microbial growth curve (from the adaptation to the stable phase) with an increase in the culture time [50] and was consistent with the results from other similar studies [47,51,52]. The higher the AWCD value, the higher the soil microbial metabolic activity [13]. During the entire culture incubation period, the AWCD values of 3- and 5-year-old forests were markedly higher than that of the other forest ages; the soil microbial species and number were also remarkably greater in the 3- and 5-year-old forests than that of the other forest ages. Thus, the soil microbial activities at these two forest ages are higher than that at the other forest ages. The 3- and 5-year-old forests have low absorption and high return of nutrients as compared to the forests of other ages because these forests have a greater amount of litter accumulation, which improves the nutrient availability to the soil microbes by increasing the number of carbon species available to them, consequently leading to an increase in the soil microbes [53]. Bending et al. and Günther have also suggested that the organic carbon content and the carbon to nitrogen ratio of the soil markedly correlate with the metabolic activity of the soil microbes [54,55]. In addition, with the increase in forest age, the secretion of certain allelochemicals, like metabolic intermediates and secondary metabolites, increases; these secretions greatly affect the soil microbes and could promote their activities. However, various metabolites, when they accumulate to a certain amount, have been reported to kill the soil microbes by suppressing their growth [56]. Additionally, the application of herbicides in an artificial forest also reduces the surface soil microbial biomass diversity [57].

4.2. Soil Microbial Functional Diversity of Eucalyptus Plantations at Different Ages

We calculated the soil microbial diversity indices, through PCA and CCA, using the data obtained from the cultures at 192 h. The H reflects the species diversity and evenness within the community, the DS characterizes the species diversity and coverage within the community by determining the probability of a species in the community meeting the other, the J characterizes the abundance distribution evenness of various species in the community, and the U measures the homogeneity of the community [50]. These diversity indices reflect the different aspects of soil microbial community composition and can analyze the functional diversity of the soil microbial community [55]. All diversity indices in this study initially increased with the eucalyptus forest age until the near-mature stage and then decreased with further increase in the forest age (Table 3), which was different from the findings of Gu et al. [58]. This could be because of human activities, such as mountain cleaning, leveling, and digging at the early plantation stage of the eucalyptus that greatly affect the soil and reduce its microbial diversity. At the subsequent stages, because of no man-made disturbance, the environmental conditions were conducive for microbial survival, hence, the microbial diversity gradually increased. Eucalyptus forests are cultivated for their economic value in large areas in Guangxi and their harvesting reduces the microbial diversity at the late stage since the mountain soil gets cleared because of cutting down of trees [31]. Moreover, the cluster analysis results suggest that the 2-, 3-, and 5-year-old forests were clustered together, whereas 1- and 8-year-old forests were clustered together (Figure 2). These results conclusively prove that the species diversity in eucalyptus plantations has an influence on the soil microbial composition and functional activity. For the soil samples from all five plantation areas, the differences in all the indices were statistically significant among various forest ages, except for H, suggesting that forest age had marked influence on the forest soil microbial community structure, which was similar to the finding of a previous study [59]. Among all the forest ages, the diversity indices in the 3-year-old forest were the highest, indicating that the 3-year-old forest had the optimal soil microbial community functional diversity, followed by the 5-year-old forest. In addition, the U in 3- and 5-year-old forests was significantly different from those in the other forest ages, revealing that soil microbes in the other forest ages show high homogeneity.

4.3. PCA and CCA of Soil Microbial Utilization

The TC, AN, TN, and TK were found to negatively correlate with the soil microbial functional diversity through the CCA analysis, suggesting that these nutrients were one of the important causes of obtaining different soil microbial community diversity in the plantations at various ages. The TP and AP positively correlated with microbial functional diversity; phosphorus deficiency in the soil in south China is common, so phosphate fertilizer can be applied in afforestation. Soil nutrients provide an important carbon source and nitrogen source for soil microbes [60]. In this study, soil nutrients at various forest ages were lower than that in the study performed by Xu [57], which could be because of the differences in the soil depths, forest ages, site conditions, substrate qualities, and the number of litters in the research area. As a result, attention should be paid to the soil nutrient status in eucalyptus forest operation, and appropriate and effective fertilizer application must be carried out. Apart from the nutrients, pH is also an important factor influencing the soil microbial community. In this study, the soil pH at each forest age was mildly acidic, which might be related to the local climate in Guangxi, soil type or the acidic compounds secreted by the eucalyptus root system; the soil microbial functional diversity negatively correlates with pH, as a majority of microbes grow in neutral or weak alkaline environments [61].
In this study, the soil microbes in eucalyptus plantations at various ages had different utilization capacities of the six types of carbon sources (Figure 3), which might be ascribed to the different soil microbial community structures under different forest age conditions. However, the major carbon source utilized at various forest ages was carbohydrates, and PCA also showed that the highest contribution to PC1 and PC2 was by carbohydrates, followed by amino and carboxylic acids. These results were similar to the results obtained by Xu et al. on the soil microbial functional diversity in eucalyptus artificial forests at various forest ages on Hainan Island [57]. There were significant differences in the carbon sources utilized by soil microbes in eucalyptus plantations at various ages, which indicate that there were differences in the type and content of the compounds released by the eucalyptus at various ages into the soil. Specifically, if more carbohydrates are secreted by the plants into the soil, the capacity of the soil microbes to utilize the carbon substrates should become strong at least for the culturable fraction of the microflora [62].

5. Conclusions

The microbial metabolic functions, diversity indices, and soil physicochemical properties in eucalyptus plantations at various ages in Guangxi are different, and the forest age has a marked influence on the forest soil microbial community structure. The carbon source utilization capacity of soil microbes at various forest ages follows the order of 3-year-old > 5-year-old > 2-year-old > 1-year-old > 8-year-old. The carbon source with the highest microbial utilization rate is carbohydrates, followed by amino acids and carboxylic acids. In addition, the total nutrients and pH of the soil are the leading ecological factors affecting the soil microbial community structure; during the eucalyptus afforestation programs, measures such as applying organic and microbial fertilizers and increasing plant diversity should be taken to relieve the soil productivity recession by regulating the soil microbial community structure and metabolic activity [60]. The results obtained by the Biolog EcoPlate method only represent a part of the entire microbial community to some extent, as microbes that do not utilize the carbon sources in the plates and those that were at a dormant state could not be manifested in the microbial community functional diversity; thus, the entire information of the microbial community structure could not be directly and completely obtained [39]. To intensively investigate the soil microbial community functional diversity, techniques such as soil metagenomics and phospholipid fatty acid analysis should be used in combination. Additionally, factors including soil depth, stand density, site sea level, slope, and slope aspect should also be taken into consideration, to profoundly illustrate the relationship between soil microbial diversity in eucalyptus forests and their surrounding environment.

Author Contributions

Conceptualization, H.D. and W.P.; methodology, Z.F., T.S. and Q.S.; investigation, H.D., Y.L., X.L., and Z.F.; writing—original draft preparation, X.L. and H.D.; writing—review and editing, T.S., Q.S. and W.P.; funding acquisition, X.L.

Funding

This work was supported by the Guangxi Key Research and Development Program (AB16380255, AB17129009), the National Key Research and Development Program of China (2016YFC0502405), the National Natural Science Foundation of China (31660141, 31770495, 31971487), the Program of Guangxi Provincial Distinguished Expert, and the Program of Hechi City Distinguished Expert.

Conflicts of Interest

The authors declare no conflicts of interest.

References

  1. Harris, J.; Birch, P. Soil microbial activity in opencast coal mine restorations. Soil Use Manag. 1989, 5, 155–160. [Google Scholar] [CrossRef]
  2. Guan, X.; Wang, J.; Zhao, H.; Wang, J.; Luo, X.; Liu, F.; Zhao, F. Soil bacterial communities shaped by geochemical factors and land use in a less-explored area, Tibetan Plateau. BMC Genom. 2013, 14, 820. [Google Scholar] [CrossRef] [PubMed]
  3. Shi, Y.; Grogan, P.; Sun, H.; Xiong, J.; Yang, Y.; Zhou, J.; Chu, H. Multi-Scale variability analysis reveals the importance of spatial distance in shaping Arctic soil microbial functional communities. Soil Biol. Biochem. 2015, 86, 126–134. [Google Scholar] [CrossRef]
  4. Zhang, B.; Yang, Y.-S.; Zepp, H. Effect of vegetation restoration on soil and water erosion and nutrient losses of a severely eroded clayey Plinthudult in southeastern China. Catena 2004, 57, 77–90. [Google Scholar] [CrossRef]
  5. Gałązka, A.; Grządziel, J. Fungal Genetics and Functional Diversity of Microbial Communities in the Soil under Long-Term Monoculture of Maize Using Different Cultivation Techniques. Front. Microbiol. 2018, 9, 76. [Google Scholar] [CrossRef] [PubMed]
  6. Cao, Y.C.; Tan, X.P.; He, W.X.; Geng, Z.C.; Liu, S.; She, D.; Hou, L. The metabolism characteristics of microbial community in different forest soil in Qinling Mountains Area. Acta Ecol. Sin. 2016, 36, 2978–2986. [Google Scholar] [CrossRef]
  7. Zhong, W.H.; Cai, Z.C. Diversity of carbon source metabolism of microbial community in farmland soils in an arsenic mining area. Chin. J. Appl. Ecol. 2013, 24, 473–480. [Google Scholar]
  8. Zheng, H.; Ouyang, Z.; Wang, X.; Fang, Z.; Zhao, T.; Miao, H. Effects of regenerating forest cover on soil microbial communities: A case study in hilly red soil region, Southern China. For. Ecol. Manag. 2005, 217, 244–254. [Google Scholar] [CrossRef]
  9. Smalla, K.; Wachtendorf, U.; Heuer, H.; Liu, W.-T.; Forney, L. Analysis of BIOLOG GN Substrate Utilization Patterns by Microbial Communities. Appl. Environ. Microbiol. 1998, 64, 1220–1225. [Google Scholar] [CrossRef]
  10. Garland, J.L.; Mills, A.L. Classification and characterisation of heterotrophic microbial communities on the basis of patterns of community-level sole-carbon-source utilization. Appl. Environ. Microbiol. 1991, 57, 2351–2359. [Google Scholar]
  11. Zak, J.; Willig, M.; Moorhead, D.; Wildman, H. Functional diversity of microbial communities: A quantitative approach. Soil Biol. Biochem. 1994, 26, 1101–1108. [Google Scholar] [CrossRef]
  12. Preston-Matham, J.; Boddy, L.; Randerson, P.F. Analysis of microbial community functional diversity using sole-carbon-source utilization profiles—acritique. FEMS Microbiol. Ecol. 2002, 42, 1–14. [Google Scholar] [CrossRef]
  13. Wang, Y.; Ouyang, Z.; Zheng, H.; Wang, X.; Chen, F.; Zeng, J. Carbon metabolism of soil microbial communities of restored forests in Southern China. J. Soils Sediments 2011, 11, 789–799. [Google Scholar] [CrossRef]
  14. Huang, X.; Liu, S.; Wang, H.; Hu, Z.; Li, Z.; You, Y. Changes of soil microbial biomass carbon and community composition through mixing nitrogen-fixing species with Eucalyptus urophylla in subtropical China. Soil Biol. Biochem. 2014, 73, 42–48. [Google Scholar] [CrossRef]
  15. Chen, X.L.; Wang, D.; Chen, X.; Wang, J.; Diao, J.J.; Zhang, J.Y.; Guan, Q.W. Soil microbial functional diversity and biomass as affected by different thinning intensities in a Chinese fir plantation. Appl. Soil Ecol. 2015, 92, 35–44. [Google Scholar] [CrossRef]
  16. Grządziel, J.; Gałązka, A. Microplot long-term experiment reveals strong soil type influence on bacteria composition and its functional diversity. Appl. Soil Ecol. 2018, 124, 117–123. [Google Scholar] [CrossRef]
  17. Grządziel, J.; Furtak, K.; Gałązka, A. Community-Level Physiological Profiles of Microorganisms from Different Types of Soil That Are Characteristic to Poland—A Long-Term Microplot Experiment. Sustainability 2019, 11, 56. [Google Scholar] [CrossRef]
  18. Deng, J.J.; Zhu, W.X.; Zhou, Y.B.; Yin, Y.; Bai, X.J.; Zhang, H.Z.; Zhang, Y.M.; Qin, S.J. Effects of different land use patterns on the soil microbial community diversity in montane region of eastern Liaoning Province, China. J. Appl. Ecol. 2018, 29, 2269–2276. [Google Scholar] [CrossRef]
  19. Yin, R.; Deng, H.; Wang, H.-L.; Zhang, B. Vegetation type affects soil enzyme activities and microbial functional diversity following re-vegetation of a severely eroded red soil in sub-tropical China. Catena 2014, 115, 96–103. [Google Scholar] [CrossRef]
  20. Hu, X.; Yin, P.; Zeng, S.; Tong, C. Responses of Soil Macrofaunal Community and Diversity under Different Types of Vegetation on Soil Nutrient Pools in winter in Emei Mountain, China. IOP Conf. Ser. Earth Environ. Sci. 2018, 170, 022125. [Google Scholar] [CrossRef]
  21. Han, D.-X.; Wang, N.; Wang, N.-N.; Sun, X.; Feng, F.-J. Soil microbial functional diversity of different altitude Pinus koraiensis forests. J. Appl. Ecol. 2015, 26, 3649–3656. [Google Scholar] [CrossRef]
  22. Fierer, N.; Jackson, R.B. The diversity and biogeography of soil bacterial communities. Proc. Natl. Acad. Sci. USA 2006, 103, 626–631. [Google Scholar] [CrossRef] [PubMed]
  23. Drenovsky, R.; Vo, D.; Graham, K.; Scow, K. Soil Water Content and Organic Carbon Availability Are Major Determinants of Soil Microbial Community Composition. Microb. Ecol. 2004, 48, 424–430. [Google Scholar] [CrossRef] [PubMed]
  24. Grayston, S.J.; Prescott, C.E. Microbial communities in forest floors under four tree species in coastal British Columbia. Soil Biol. Biochem. 2005, 37, 1157–1167. [Google Scholar] [CrossRef]
  25. Zhu, Y.F.; Xiao, Z.H.; Peng, W.X.; Du, H.; Song, M.; Liu, Y.X. Dynamics of plant diversity and community structure of Eucalyptus plantation at different ages class in Guangxi. J. Cent. South Univ. For. Technol. 2018, 38, 38–44. [Google Scholar] [CrossRef]
  26. Huang, G.Q.; Zhao, Q.G. The history, status quo, ecological problems and countermeasures of Eucalyptus plantations in Guangxi. Acta Ecol. Sin. 2014, 34, 5142–5152. [Google Scholar] [CrossRef]
  27. Behera, N.; Sahani, U. Soil microbial biomass and activity in response to Eucalyptus plantation and natural regeneration on tropical soil. For. Ecol. Manag. 2003, 174, 1–11. [Google Scholar] [CrossRef]
  28. Liu, H.Y. The Relationship of Soil Enzyme Activities between Soil Nutrients in A Long-Term Continuous Planting Eucalyptus Plantation; Guangxi University: Nanning, China, 2013. [Google Scholar]
  29. Mendes, R.; Kruijt, M.; De Bruijn, I.; Dekkers, E.; Van Der Voort, M.; Schneider, J.H.M.; Piceno, Y.M.; DeSantis, T.Z.; Andersen, G.L.; Bakker, P.A.H.M.; et al. Deciphering the Rhizosphere Microbiome for Disease-Suppressive Bacteria. Science 2011, 332, 1097–1100. [Google Scholar] [CrossRef]
  30. Miltiadou, M.; Campbell, N.D.; Aracil, S.G.; Brown, T.; Grant, M.G. Detection of dead standing Eucalyptus camaldulensis without tree delineation for managing biodiversity in native Australian forest. Int. J. Appl. Earth Obs. Geoinf. 2018, 67, 135–147. [Google Scholar] [CrossRef]
  31. Leroy, G.; Bradley, L.; Rachel, B. Experimental evaluation of the initial effects of large-scale thinning on structure and biodiversity of river red gum (Eucalyptus camaldulensis) forests. Wildl. Res. 2018, 45, 397. [Google Scholar] [CrossRef]
  32. Li, F.Y.; Liang, Y.Y.; Shi, M.X. Ecological Benefit Analysis and Evaluation of Eucalyptus robusta Plantations in Guangxi. J. Anhui Agric. Sci. 2017, 45, 161–165. [Google Scholar] [CrossRef]
  33. Yang, X.; Li, D.; Mcgrouther, K.; Long, W.X.; Li, Y.L.; Chen, Y.K.; Lv, X.B.; Niazi, N.K.; Song, Z.L.; Wang, H.L. Effect of Eucalyptus forests on understory vegetation and soil quality. J. Soils Sediments 2017, 17, 2383–2389. [Google Scholar] [CrossRef]
  34. Hubbard, R.M.; Ferraz, S.; Stape, J.L.; Lemos, C.; Hakamada, R. Biomass production and potential water stress increase with planting density in four highly productive clonal Eucalyptus genotypes. South. For. A J. For. Sci. 2017, 79, 251–257. [Google Scholar] [CrossRef]
  35. Zhang, H.; Wang, K.; Zeng, Z.; Du, H.; Zeng, F. Biomass and Carbon Sequestration by Juglans regia Plantations in the Karst Regions of Southwest China. Forests 2017, 8, 103. [Google Scholar] [CrossRef]
  36. Song, X.C.; Xiang, D.Y.; Yang, Z.N.; Zhang, Z.Y.; Cao, J.Z. Microbial functional diversity of rhizosphere soil of Eucalyptus plantation in Guangxi. J. Cent. South Univ. For. Technol. 2017, 37, 58–61. [Google Scholar] [CrossRef]
  37. Fu, W.B.; Peng, W.X.; Song, T.Q.; Zeng, F.P.; Du, H.; Wan, Y.G.; Xu, H.F. Biomass and its allocation characteristics of Eucalyptus urophylla × E. grandis plantations at different stand ages. Acta Ecol. Sin. 2014, 34, 5234–5241. [Google Scholar] [CrossRef] [Green Version]
  38. Du, H.; Song, T.Q.; Zeng, F.P.; Wang, K.L.; Fu, W.B.; Peng, W.X.; Li, S.S. Carbon storage and its controlling factors under different vegetation types in depressions between karst hills, Southwest China. Acta Ecol. Sin. 2015, 35, 4658–4667. [Google Scholar] [CrossRef] [Green Version]
  39. Zhang, C.; Zhang, W.; Chen, H.S.; Nie, Y.P.; Ye, Y.Y.; Wang, K.L. Temporal and spatial variation in surface soil moisture content of karst slopes in the dry season. Acta Ecol. Sin. 2015, 35, 6326–6334. [Google Scholar] [CrossRef]
  40. State Forestry Administration of the People’ s Republic of China. Methodology for Field Longterm Observation of Forest System (GB/T 33027-2016); China Standards Press: Beijing, China, 2017.
  41. Du, H.; Zeng, F.; Peng, W.; Song, T.; Hu, F. Plant community characteristics and their relationships with soil properties in a karst region of southwest China. Contemp. Probl. Ecol. 2017, 10, 707–716. [Google Scholar] [CrossRef]
  42. State Forestry Administration of the People’ s Republic of China. Determination of Available Phosphorus in Forest Soil (LY/T 1232-2015); China Standards Press: Beijing, China, 2016.
  43. Bao, S.D. Soil Agrochemical Analysis, 3rd ed.; China Agriculture Press: Beijing, China, 2000; pp. 145–196. ISBN 9787109066441. [Google Scholar]
  44. Li, S.S.; Ma, D.L.; Zang, S.Y.; Wang, L.L.; Sun, H.Z. Structural and functional characteristics of soil microbial community in the Songjiang wetland under different interferences. Acta Ecol. Sin. 2018, 38, 7979–7989. [Google Scholar]
  45. Boyle, S.I.; Haskins, K.E.; Overby, S.T.; Hart, S.C.; Classen, A.T. Community-level physiological profiles of bacteria and fungi: plate type and incubation temperature influences on contrasting soils. FEMS Microbiol. Ecol. 2003, 44, 319–328. [Google Scholar] [CrossRef] [Green Version]
  46. Ratcliff, A.W.; Busse, M.D.; Shestak, C.J. Changes in microbial community structure following herbicide (glyphosate) additions to forest soils. Appl. Soil Ecol. 2006, 34, 114–124. [Google Scholar] [CrossRef]
  47. Kong, W.-D.; Zhu, Y.-G.; Fu, B.-J.; Marschner, P.; He, J.-Z.; Kong, W. The veterinary antibiotic oxytetracycline and Cu influence functional diversity of the soil microbial community. Environ. Pollut. 2006, 143, 129–137. [Google Scholar] [CrossRef] [PubMed]
  48. Degens, B. Decreases in organic C reserves in soils can reduce the catabolic diversity of soil microbial communities. Soil Biol. Biochem. 2000, 32, 189–196. [Google Scholar] [CrossRef]
  49. Choi, K.-H.; Dobbs, F.C. Comparison of two kinds of Biolog microplates (GN and ECO) in their ability to distinguish among aquatic microbial communities. J. Microbiol. Methods 1999, 36, 203–213. [Google Scholar] [CrossRef]
  50. Tian, Y.N.; Wang, H.Q. Application of Biolog to study of environmental microbial function diversity. Environ. Sci. Technol. 2011, 34, 50–57. [Google Scholar] [CrossRef]
  51. Wang, C.; Xue, L.; Dong, Y.; Wei, Y.; Jiao, R. Unravelling the Functional Diversity of the Soil Microbial Community of Chinese Fir Plantations of Different Densities. Forests 2018, 9, 532. [Google Scholar] [CrossRef] [Green Version]
  52. Qu, Y.D.; Su, Z.Y.; Peng, G.X.; Liu, G. Soil microbial function aldiversity inamontaneevergreenbroadleaved forest of Chebaling following the huge ice storm in south China. Acta Ecol. Sin. 2009, 29, 6156–6164. [Google Scholar]
  53. Deng, J.; Zhou, Y.; Bai, X.; Luo, J.; Yin, Y.; Zhu, W. Soil Microbial Functional Diversity Responses to Different Revegetation Types in Baishilazi Nature Reserve. Pol. J. Environ. Stud. 2019, 28, 3675–3686. [Google Scholar] [CrossRef]
  54. Bending, G.D.; Turner, M.K.; E Jones, J. Interactions between crop residue and soil organic matter quality and the functional diversity of soil microbial communities. Soil Biol. Biochem. 2002, 34, 1073–1082. [Google Scholar] [CrossRef]
  55. Springob, G.; Kirchmann, H. Bulk soil C to N ratio as a simple measure of net N mineralization from stabilized soil organic matter in sandy arable soils. Soil Biol. Biochem. 2003, 35, 629–632. [Google Scholar] [CrossRef]
  56. Xie, L.X.; Chen, Q.P.; Wang, Z.H.; Liu, X.X. A Review of Effects of Soil Environmental Changes on Soil Microbe. Chin. J. Trop. Agric. 2004, 24, 39–47. [Google Scholar] [CrossRef]
  57. Xu, W.X.; Zhao, C.J.; Zhu, M.J.; Wu, Z.Y.; Han, Q.; Zheng, Q.Y. Soil microbial functional diversity of Eucalyptus plantation in Hainan Island. Guangdong Agric. Sci. 2016, 43, 65–72. [Google Scholar] [CrossRef]
  58. Gu, L.H.; Zhou, Y. Vegetation Structure and Species Diversity in Eucalypt Understory at Different Stand Age. Guangdong For. Technol. 2012, 28, 46–52. [Google Scholar] [CrossRef]
  59. Wang, C.Q.; Jiao, R.Z.; Dong, Y.H.; Hou, L.Y.; Zhao, J.J.; Zhao, S.R. Differences in Metabolic Functions of Soil Microbial Communities of Chinese Fir Plantations of Different Ages. Sci. Silvae Sin. 2019, 55, 36–45. [Google Scholar] [CrossRef]
  60. Lin, Y.; Chen, A.; Yan, S.; Rafay, L.; Du, K.; Wang, D.; Ge, Y.; Li, J. Available soil nutrients and water content affect leaf nutrient concentrations and stoichiometry at different ages of Leucaena leucocephala forests in dry-hot valley. J. Soils Sediments 2018, 19, 511–521. [Google Scholar] [CrossRef]
  61. O’Donnell, A.G.; Seasman, M.; Macrae, A.; Waite, I.; Davies, J.T. Plants and fertilisers as drivers of change in microbial community structure and function in soils. Plant Soil 2001, 232, 135–145. [Google Scholar] [CrossRef]
  62. Kang, M.M.; Chen, H.Y.; Chen, C.G.; Da, L.Q.; Wu, Q.T.; He, S.T. Microbial diversity in root zone soils of Acacia confusa and Eucalyptus urophylla polluted by heavy metals. J. East China Norm. Univ. (Nat. Sci.) 2009, 2, 50–60. [Google Scholar] [CrossRef]
Figure 1. Dynamics of average well color development (AWCD) of the soil microbial community in soil samples from the eucalyptus plantations with incubation time relative to stand ages.
Forests 10 01083 g001
Figure 2. Cluster analysis of the diversity indices of soil microbial communities from eucalyptus plantations at different ages. Abbreviations: A—1-year-old, B—2-year-old, C—3-year-old, D—5-year-old, and E—8-year-old.
Forests 10 01083 g002
Figure 3. Use efficiency of carbon sources by the soil microbial communities from the eucalyptus plantations at different ages. Abbreviation: AWCD—average well color development.
Forests 10 01083 g003
Figure 4. The heatmap of microbial communities from the eucalyptus plantations at different ages depending on the carbon substrates utilization in Biolog EcoPlate. Definitions: C denotes the absorbance of each medium containing well; R denotes the absorbance of the blank control well.
Forests 10 01083 g004
Figure 5. Principal component analysis (PCA) of carbon sources’ utilization of soil microbial communities from eucalyptus plantations at different ages.
Forests 10 01083 g005
Figure 6. Canonical correspondence analysis (CCA) two-dimensional ordination diagram of eucalyptus plantation plots and soil factors.
Forests 10 01083 g006
Table 1. Soil chemical properties of the eucalyptus plantation with different stand ages.
Stand AgesTC
(g·kg−1)
TN
(g·kg−1)
TP
(g·kg−1)
TK
(g·kg−1)
AN
(mg·kg−1)
AP
(mg·kg−1)
AK
(mg·kg−1)
pH
1-year-old17.32 ± 5.54b0.53 ± 0.23c0.23 ± 0.08c2.54 ± 1.52d68.79 ± 16.63a13.32 ± 5.64a92.28 ± 19.13b4.16 ± 0.20a
2-year-old27.55 ± 4.93a1.57 ± 0.49a0.38 ± 0.06a15.58 ± 0.99a131.51 ± 25.30a5.76 ± 0.51a152.14 ± 15.27a4.14 ± 0.10a
3-year-old30.59 ± 6.49a1.19 ± 0.22ab0.22 ± 0.04c11.03 ± 1.76b134.78 ± 8.03a8.41 ± 4.16a32.70 ± 6.63c4.46 ± 0.47a
5-year-old30.68 ± 1.31a1.51 ± 0.09a0.25 ± 0.05c7.37 ± 2.51c204.94 ± 34.44a6.72 ± 1.05a37.49 ± 9.95c4.46 ± 0.31a
8-year-old15.46 ± 2.84b0.87 ± 0.04bc0.50 ± 0.05a2.75 ± 0.88d85.99 ± 10.19a9.99 ± 6.70a44.26 ± 4.43c4.03 ± 0.15a
Note: Different letters within the same column show significant differences (p ≤ 0.05). Abbreviations: TC—total carbon, TN—total nitrogen, TP—total phosphorous, AN—available nitrogen, AP—available phosphorous, AK—available potassium, and TK—total potassium. The same below.
Table 2. Thirty-one types of carbon sources significantly related to PC1 and PC2 in woodland soils.
TypeCarbon SourcePC1 (52.42%)PC2 (13.39%)
CarbohydratesD-glucosaminic acid0.877−0.125
Glucose-1-phosphate0.8000.373
D-cellobiose0.787−0.005
α-D-lactose0.7770.537
D-galacturonic acid0.6980.290
D-galactonic acid γ-lactone0.695−0.211
D-mannitol0.6810.529
D, L-α-glycerol phosphate0.6490.200
N-acetyl-D-glucosamine0.5990.536
i-erythritol0.515−0.033
β-methyl-D-glucoside0.1050.442
D-xylose-0.0360.731
Amino acidsL-serine0.8840.036
Glycose-L-glutamic acid0.8630.003
L-arginine0.824−0.169
L-phenylalanine0.7890.235
L-threonine0.756−0.152
L-asparagine0.5490.212
Carboxylic acidsγ-hydroxybutyric acid0.913−0.165
D-malic acid0.885−0.323
Itaconic acid0.883−0.236
Pyruvic acid methyl ester0.781−0.199
α-Ketobutyric acid0.781−0.114
Polymersα-cyclodextrin0.935−0.278
Tween-800.8730.185
Tween-400.818−0.189
Glycogen0.222−0.437
AminesPhenylethylamine0.9310.011
Putrescine0.853−0.218
Phenolic acids4-hydroxy-benzoic acid0.886−0.260
2-hydroxy-benzoic acid0.5880.151
Table 3. Diversity indices of the soil microbial communities from the eucalyptus plantations at different ages.
Stand AgesHJDsUS
1-year-old3.19 ± 0.11b0.90 ± 0.01b0.93 ± 0.04a5.64 ± 0.76c23.00 ± 1.73c
2-year-old3.20 ± 0.06ab0.93 ± 0.19ab0.95 ± 0.01a8.44 ± 0.65b25.00 ± 3.61ba
3-year-old3.36 ± 0.05a0.98 ± 0.014a0.96 ± 0.01a11.80 ± 0.29a30.33 ± 1.15a
5-year-old3.33 ± 0.03ab0.97 ± 0.01a0.96 ± 0.00a11.57 ± 0.53a29.67 ± 1.15a
8-year-old3.10 ± 0.16b0.90 ± 0.05b0.95 ± 0.01a6.01 ± 2.41c24.00 ± 4.00cb
Note: Different letters within the same column show significant differences (p ≤ 0.05). Abbreviations: H—Shannon–Weiner index, J—Pielou index, DS—Simpson’s index, U—McIntosh index, and R—abundance.

