Synchronous Growth Releases in Peatland Pine Chronologies as an Indicator for Regional Climate Dynamics—A Multi-Site Study Including Estonia, Belarus and Sweden


 ,
,
Abstract
:1. Introduction
2. Materials and Methods
2.1. Study Sites and Tree-Ring Data
2.2. Estimating the Timing of Growth Release Events
2.3. Climatic Data
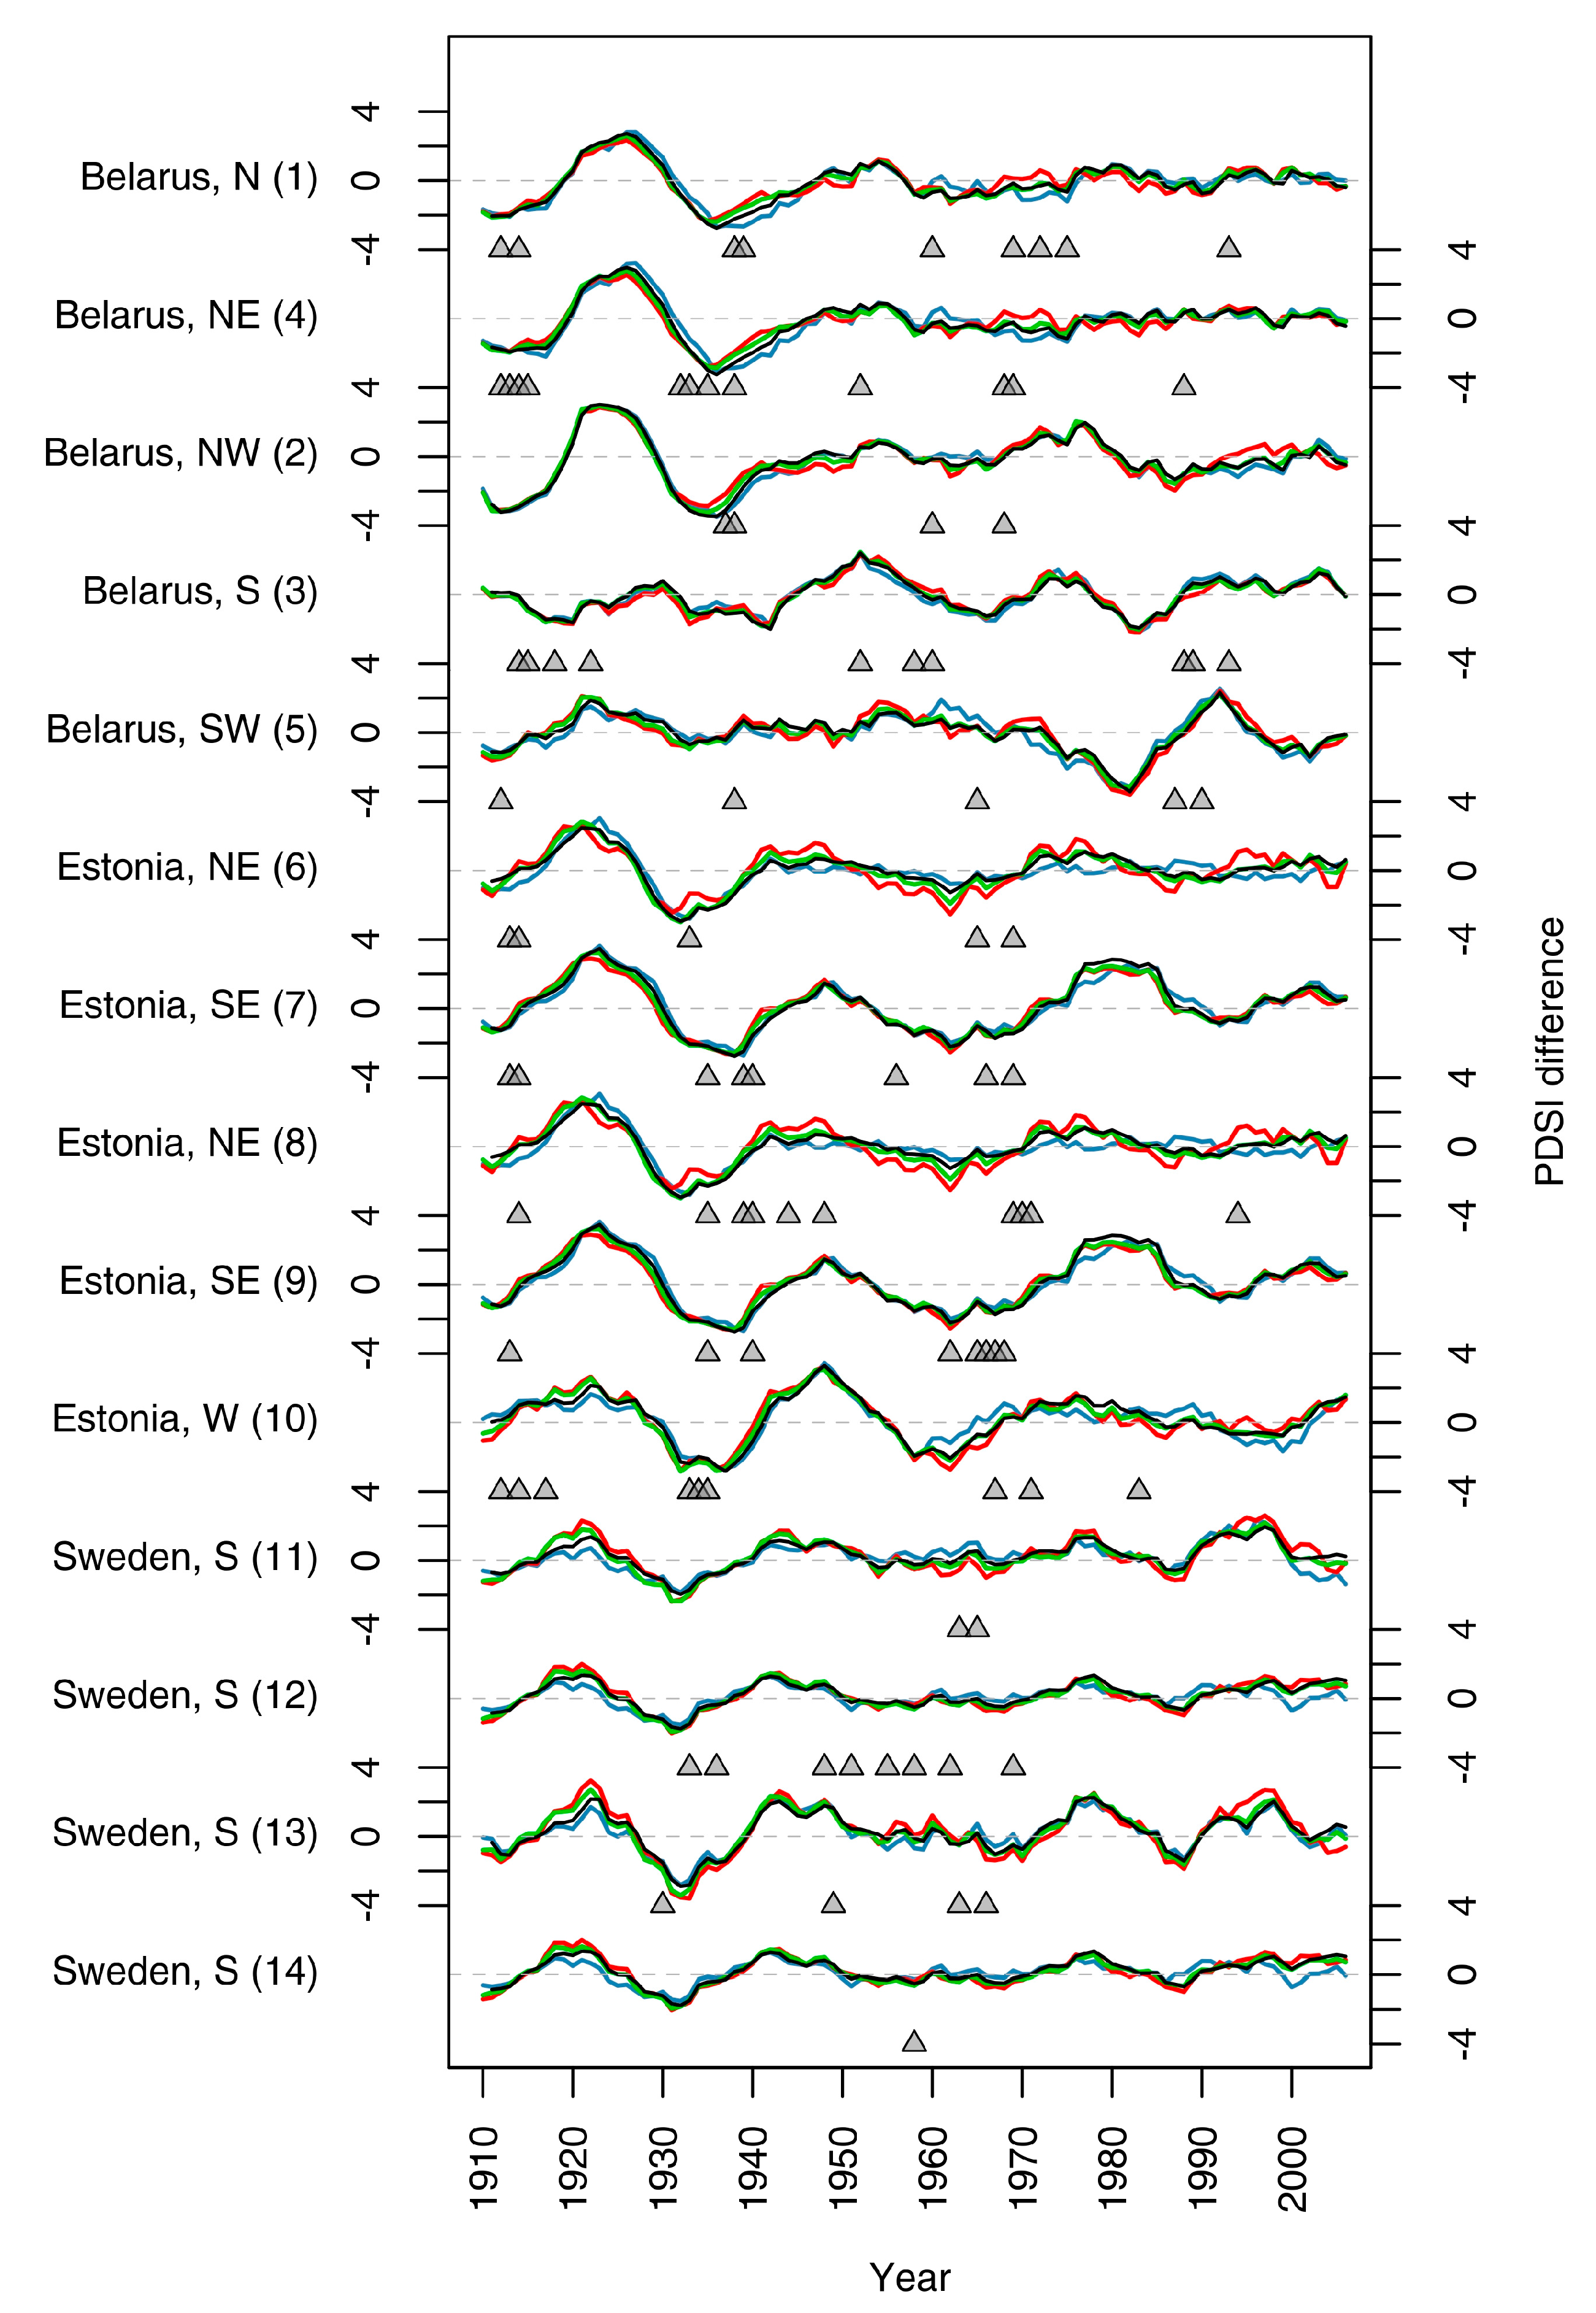
3. Results
3.1. Radial Growth Trends
3.2. Climatic Variability and Growth Release
4. Discussion
4.1. Comparison between Different Regions
4.2. Links between Climate and Trends in Tree Radial Growth
4.3. Peatland Management
5. Conclusions
Supplementary Materials
Author Contributions
Funding
Acknowledgments
Conflicts of Interest
References
- Päivänen, J.; Hånell, B. Peatland Ecology and Forestry: A Sound Approach; University of Helsinki: Helsinki, Finland, 2012; ISBN 9789521045318. [Google Scholar]
- Edvardsson, J.; Rimkus, E.; Corona, C.; Šimanauskienė, R.; Kažys, J.; Stoffel, M. Exploring the impact of regional climate and local hydrology on Pinus sylvestris L. growth variability—A comparison between pine populations growing on peat soils and mineral soils in Lithuania. Plant Soil 2015, 392, 345–356. [Google Scholar] [CrossRef]
- Waddington, J.M.; Morris, P.J.; Kettridge, N.; Granath, G.; Thompson, D.K.; Moore, P.A. Hydrological feedbacks in northern peatlands. Ecohydrology 2015, 8, 113–127. [Google Scholar] [CrossRef]
- Laine, A.M.; Mehtätalo, L.; Tolvanen, A.; Frolking, S.; Tuittila, E.S. Impacts of drainage, restoration and warming on boreal wetland greenhouse gas fluxes. Sci. Total Environ. 2019, 647, 169–181. [Google Scholar] [CrossRef] [PubMed]
- Paavilainen, E.; Päivänen, J. Peatland Forestry; Springer: Berlin/Heidelberg, Germany, 1995; ISBN 978-3-642-08198-9. [Google Scholar]
- Raudsaar, M.; Sims, A.; Timmusk, T.; Pärt, E.; Nikopensius, M. Forest Resources. In Yearbook Forest 2017; Raudsaar, M., Siimon, K.-L., Valgepea, M., Eds.; Keskkonnaagentuur: Tallinn, Estonia, 2018; pp. 17–86. [Google Scholar]
- Macdonald, S.E.; Yin, F. Factors influencing size inequality in peatland black spruce and tamarack: Evidence from post-drainage release growth. J. Ecol. 1999, 87, 404–412. [Google Scholar] [CrossRef]
- Freléchoux, F.; Buttler, A.; Schweingruber, F.H.; Gobat, J.-M. Stand structure, invasion, and growth dynamics of bog pine (Pinus uncinata var. rotundata) in relation to peat cutting and drainage in the Jura Mountains, Switzerland. Can. J. For. Res. 2000, 30, 1114–1126. [Google Scholar] [CrossRef]
- Hökkä, H.; Ojansuu, R. Height development of Scots pine on peatlands: Describing change in site productivity with a site index model. Can. J. For. Res. 2004, 34, 1081–1092. [Google Scholar] [CrossRef]
- Linderholm, H.W.; Leine, M. An assessment of twentieth century tree-cover changes on a southern Swedish peatland combining dendrochronoloy and aerial photograph analysis. Wetlands 2004, 24, 357–363. [Google Scholar] [CrossRef]
- Edvardsson, J.; Stoffel, M.; Corona, C.; Bragazza, L.; Leuschner, H.H.; Charman, D.J.; Helama, S. Subfossil peatland trees as proxies for Holocene palaeohydrology and palaeoclimate. Earth Sci. Rev. 2016, 163, 118–140. [Google Scholar] [CrossRef]
- Dang, Q.L.; Lieffers, V.J. Assessment of patterns of response of tree ring growth of black spruce following peatland drainage. Can. J. For. Res. 1989, 19, 924–929. [Google Scholar] [CrossRef]
- Sikström, U.; Hökkä, H. Interactions between soil water conditions and forest stands in boreal forests with implications for ditch network maintenance. Silva Fenn. 2016, 50. [Google Scholar] [CrossRef]
- Läänelaid, A.; Eckstein, D. Norway spruce in Estonia reflects the early summer weather in its tree-ring widths. Balt. For. 2012, 18, 194–204. [Google Scholar]
- Sohar, K.; Läänelaid, A.; Eckstein, D.; Helama, S.; Jaagus, J. Dendroclimatic signals of pedunculate oak (Quercus robur L.) in Estonia. Eur. J. For. Res. 2014, 133, 535–549. [Google Scholar] [CrossRef]
- Hordo, M.; Kängsepp, V.; Kannimäe, T.; Kask, P. Annual growth trends and response to weather of larch trees at Järvselja Training and Experimental Forest Center stands (Estonia). For. Stud. 2015, 63, 111–129. [Google Scholar] [CrossRef]
- Metslaid, S.; Stanturf, J.A.; Hordo, M.; Korjus, H.; Laarmann, D.; Kiviste, A. Growth responses of Scots pine to climatic factors on reclaimed oil shale mined land. Environ. Sci. Pollut. Res. 2016, 23, 13637–13652. [Google Scholar] [CrossRef] [PubMed]
- Metslaid, S.; Hordo, M.; Korjus, H.; Kiviste, A.; Kangur, A. Spatio-temporal variability in Scots pine radial growth responses to annual climate fluctuations in hemiboreal forests of Estonia. Agric. For. Meteorol. 2018, 252, 283–295. [Google Scholar] [CrossRef]
- Linderholm, H. Climatic influence on Scots pine growth on dry and wet soils in the central Scandinavian mountains, interpreted from tree-ring width. Silva Fenn. 2001, 35, 415–424. [Google Scholar] [CrossRef]
- Vitas, A. Dendroclimatological research of Scots pine (Pinus sylvestris L.) in the Baltic coastal zone of Lithuania. Balt. For. 2004, 10, 65–71. [Google Scholar]
- Hordo, M.; Henttonen, H.; Mäkinen, H.; Helama, S.; Kiviste, A. Annual growth variation of Scots pine in Estonia and Finland. Balt. For. 2011, 17, 35–49. [Google Scholar]
- Jansons, Ā.; Matisons, R.; Šēnhofa, S.; Katrevičs, J.; Jansons, J. High-frequency variation of tree-ring width of some native and alien tree species in Latvia during the period 1965–2009. Dendrochronologia 2016, 40, 151–158. [Google Scholar] [CrossRef]
- Cook, E.R. A Time Series Analysis Approach to Tree Ring Standardization. Ph.D. Thesis, The University of Arizona, Tucson, AZ, USA, 1985. [Google Scholar]
- Peters, R.L.; Groenendijk, P.; Vlam, M.; Zuidema, P.A. Detecting long-term growth trends using tree rings: A critical evaluation of methods. Glob. Chang. Biol. 2015, 21, 2040–2054. [Google Scholar] [CrossRef]
- Edvardsson, J.; Hansson, A. Multiannual hydrological responses in Scots pine radial growth within raised bogs in southern Sweden. Silva Fenn. 2015, 49. [Google Scholar] [CrossRef]
- Charman, D.J.; Brown, A.D.; Hendon, D.; Karofeld, E. Testing the relationship between Holocene peatland palaeoclimate reconstructions and instrumental data at two European sites. Quat. Sci. Rev. 2004, 23, 137–143. [Google Scholar] [CrossRef]
- Blanchet, G.; Guillet, S.; Calliari, B.; Corona, C.; Edvardsson, J.; Stoffel, M.; Bragazza, L. Impacts of regional climatic fluctuations on radial growth of Siberian and Scots pine at Mukhrino mire (central-western Siberia). Sci. Total Environ. 2017, 574, 1209–1216. [Google Scholar] [CrossRef] [PubMed]
- Valgma, Ü. Impact of precipitation on the water table level of different ombrotrophic raised bog complexes, central Estonia. Suo 1998, 49, 13–21. [Google Scholar]
- Yermokhin, M. The tree-ring chronology of Scots pine (Pinus sylvestris L.) from the Nesvizh castle XVI-XIX cc. in central Belarus. Dendrochronologia 2012, 30, 69–72. [Google Scholar] [CrossRef]
- Yermokhin, M.; Mychko, V.; Knysh, N.; Uhlyanets, S.; Barsukova, T.; Dudkina, L.; Lukin, V. Transformation of pine bog forests in Belovezhskaya Pushcha—Drainage or climate change? In Proceedings of the EuroDendro 2017 Conference, Tartu, Estonia, 6–10 September 2017; p. 28. [Google Scholar]
- Potapov, A. Effect of construction of drainage system and ditch network maintenance on radial increment of trees. Master’s Thesis, Estonian University of Life Sciences, Tartu, Estonia, 2016. [Google Scholar]
- Toomik, S.; Sohar, K.; Läänelaid, A.; Jaagus, J. Climate and hydrology relations of pine (Pinus sylvestris L.) growing in some drained Central Estonian mires. In Proceedings of the EuroDendro 2017 Conference, Tartu, Estonia, 6‒10 September 2017; p. 117. [Google Scholar]
- Padari, A.; Kiviste, K. Modelling of postdrained forest growth. For. Stud. 2005, 43, 58–83. [Google Scholar]
- Préfontaine, G.; Jutras, S. Variation in stand density, black spruce individual growth and plant community following 20 years of drainage in post-harvest boreal peatlands. For. Ecol. Manage. 2017, 400, 321–331. [Google Scholar] [CrossRef]
- Cook, E.R.; Kairiukstis, L.A. Methods of Dendrochronology; Springer: Dordrecht, The Netherlands, 1990; ISBN 978-90-481-4060-2. [Google Scholar]
- Holmes, R. Computer-assisted quality control in tree-ring dating and measurement. Tree-Ring Bull. 1983, 43, 69–75. [Google Scholar]
- Nowacki, G.J.; Abrams, M.D. Radial-growth averaging criteria for reconstructing disturbance histories from presettlement-origin oaks. Ecol. Monogr. 1997, 67, 225–249. [Google Scholar] [CrossRef]
- Abrams, M.D.; Copenheaver, C.A.; Terazawa, K.; Umeki, K.; Takiya, M.; Akashi, N. A 370-year dendroecological history of an old-growth Abies-Acer-Quercus forest in Hokkaido, northern Japan. Can. J. For. Res. 1999, 29, 1891–1899. [Google Scholar] [CrossRef]
- Lorimer, C.G.; Frelich, L.E. A methodology for estimating canopy disturbance frequency and intensity in dense temperate forests. Can. J. For. Res. 1989, 19, 651–663. [Google Scholar] [CrossRef]
- Rentch, J.S.; Desta, F.; Miller, G.W. Climate, canopy disturbance, and radial growth averaging in a second-growth mixed-oak forest in West Virginia, U.S.A. Can. J. For. Res. 2002, 32, 915–927. [Google Scholar] [CrossRef]
- Rubino, D.L.; McCarthy, B.C. Comparative analysis of dendroecological methods used to assess disturbance events. Dendrochronologia 2004, 21, 97–115. [Google Scholar] [CrossRef]
- Altman, J.; Fibich, P.; Dolezal, J.; Aakala, T. TRADER: A package for Tree Ring Analysis of Disturbance Events in R. Dendrochronologia 2014, 32, 107–112. [Google Scholar] [CrossRef]
- Bunn, A.G. A dendrochronology program library in R (dplR). Dendrochronologia 2008, 26, 115–124. [Google Scholar] [CrossRef]
- R Core Team. R: A Language and Environment for Statistical Computing; R Foundation for Statistical Computing: Vienna, Austria, 2016. [Google Scholar]
- Palmer, W.C. Meteorological Drought; Research Paper 45; U.S. Department of Commerce, Weather Bureau: Washington, DC, USA, 1965; p. 58.
- Van der Schrier, G.; Barichivich, J.; Briffa, K.R.; Jones, P.D. A scPDSI-based global data set of dry and wet spells for 1901–2009. J. Geophys. Res. Atmos. 2013, 118, 4025–4048. [Google Scholar] [CrossRef]
- Osborn, T.; Barichivich, J.; Harris, I.; Van Der Schrier, G.; Jones, P. Monitoring global drought using the self-calibrating Palmer Drought Severity Index. In State of the Climate in 2015. Bull. Am. Meteorol. Soc. 2016, 97, S32–S36. [Google Scholar]
- Trouet, V.; van Oldenborgh, G.J. KNMI Climate Explorer: A web-based research tool for high-resolution paleoclimatology. Tree Ring Res. 2013, 69, 3–13. [Google Scholar] [CrossRef]
- Wells, N.; Goddard, S.; Hayes, M.J. A Self-Calibrating Palmer Drought Severity Index. J. Clim. 2004, 17, 2335–2351. [Google Scholar] [CrossRef]
- Sarkkola, S.; Hökkä, H.; Penttilä, T. Natural development of stand structure in peatland Scots pine following drainage: Results based on long-term monitoring of permanent sample plots. Silva Fenn. 2004, 38, 405–412. [Google Scholar] [CrossRef] [Green Version]
- Edvardsson, J.; Šimanauskien, R.; Taminskas, J.; Baužien, I.; Stoffel, M. Increased tree establishment in Lithuanian peat bogs—Insights from field and remotely sensed approaches. Sci. Total Environ. 2015, 505, 113–120. [Google Scholar] [CrossRef] [PubMed]
- Dauškane, I. Influence of Climatic Factors on the Radial Growth of Scots Pine Pinus sylvestris L. on Mires in Latvia. Ph.D. Thesis, University of Latvia, Riga, Latvia, 2011. [Google Scholar]
- Dauškane, I.; Brūmelis, G.; Elferts, D. Effect of climate on extreme radial growth of Scots pine growing on bogs in Latvia. Est. J. Ecol. 2011, 60, 236. [Google Scholar] [CrossRef] [Green Version]
- Čugunovs, M.; Nikodemus, O.; Dauškane, I.; Brūmelis, G. The colonization history of Scots pine (Pinus sylvestris) in pristine and drained raised bogs in Latvia. Environ. Exp. Biol. 2016, 14, 97–106. [Google Scholar] [CrossRef]
- Taminskas, J.; Edvardsson, J.; Linkevičienė, R.; Stoffel, M.; Corona, C.; Tamkevičiūtė, M. Combining multiple proxies to investigate water table fluctuations in wetlands: A case study from the Rėkyva wetland complex, Lithuania. Palaeogeogr. Palaeoclimatol. Palaeoecol. 2019, 514, 453–463. [Google Scholar] [CrossRef]
- Smiljanić, M.; Seo, J.-W.; Läänelaid, A.; van der Maaten-Theunissen, M.; Stajić, B.; Wilmking, M. Peatland pines as a proxy for water table fluctuations: Disentangling tree growth, hydrology and possible human influence. Sci. Total Environ. 2014, 500–501, 52–63. [Google Scholar] [CrossRef]
- Edvardsson, J.; Adolphi, F.; Linderholm, H.W.; Corona, C.; Muscheler, R.; Stoffel, M. Periodicities in mid- to late-Holocene peatland hydrology identified from Swedish and Lithuanian tree-ring data. Quat. Sci. Rev. 2016, 137, 200–208. [Google Scholar] [CrossRef]
- Payandeh, B. Analyses of a forest drainage experiment in Northern Ontario. I: Growth analysis. Can. J. For. Res. 1973, 3, 387–398. [Google Scholar] [CrossRef]
- Jaani, A. Hydrology and water balance of Lake Peipsi. Hydrobiologia 1996, 338, 11–23. [Google Scholar] [CrossRef]
- Zhao, H.; Gao, G.; An, W.; Zou, X.; Li, H.; Hou, M. Timescale differences between SC-PDSI and SPEI for drought monitoring in China. Phys. Chem. Earth Parts A B C 2017, 102, 48–58. [Google Scholar] [CrossRef]
- Dudley, R.W.; Hodgkins, G.A.; Nielsen, M.G.; Qi, S.L. Estimating historical groundwater levels based on relations with hydrologic and meteorological variables in the U.S. glacial aquifer system. J. Hydrol. 2018, 562, 530–543. [Google Scholar] [CrossRef]
- Guttman, N.B. Comparing the Palmer Drought Index and the Standardized Precipitation Index. J. Am. Water Resour. Assoc. 1998, 34, 113–121. [Google Scholar] [CrossRef]
- Vicente-Serrano, S.M.; Beguería, S.; López-Moreno, J.I. Comment on “Characteristics and trends in various forms of the Palmer Drought Severity Index (PDSI) during 1900–2008” by Aiguo Dai. J. Geophys. Res. 2011, 116, D19112. [Google Scholar] [CrossRef] [Green Version]
- Girardin, M.P.; Ali, A.; Carcaillet, C.; Mudelsee, M.; Drobyshev, I.; Hély, C.; Bergeron, Y. Heterogeneous response of circumboreal wildfire risk to climate change since the early 1900s. Glob. Chang. Biol. 2009, 15, 2751–2769. [Google Scholar] [CrossRef]
- McKee, T.B.; Doesken, N.J.; Kleist, J. The relationship of drought frequency and duration to time scales. In Proceedings of the 8th Conference on Applied Climatology, Anaheim, CA, USA, 17–22 January 1993; pp. 179–183. [Google Scholar]
- Leelaruban, N.; Padmanabhan, G.; Oduor, P. Examining the relationship between drought indices and groundwater levels. Water 2017, 9, 82. [Google Scholar] [CrossRef] [Green Version]
- Vicente-Serrano, S.M.; Beguería, S.; López-Moreno, J.I. A multiscalar drought index sensitive to global warming: The Standardized Precipitation Evapotranspiration Index. J. Clim. 2010, 23, 1696–1718. [Google Scholar] [CrossRef] [Green Version]
- Edvardsson, J.; Baužienė, I.; Lamentowicz, M.; Šimanauskienė, R.; Tamkevičiūtė, M.; Taminskas, J.; Linkevičienė, R.; Skuratovič, Ž.; Corona, C.; Stoffel, M. A multi-proxy reconstruction of moisture dynamics in a peatland ecosystem: A case study from Čepkeliai, Lithuania. Ecol. Indic. 2019, 106, 105484. [Google Scholar] [CrossRef]
- Leuschner, H.H.; Sass-Klaassen, U.; Jansma, E.; Baillie, M.G.L.; Spurk, M. Subfossil European bog oaks: Population dynamics and long-term growth depressions as indicators of changes in the Holocene hydro-regime and climate. Holocene 2002, 12, 695–706. [Google Scholar] [CrossRef]
- Yu, Z.C. Northern peatland carbon stocks and dynamics: A review. Biogeosciences 2012, 9, 4071–4085. [Google Scholar] [CrossRef] [Green Version]
- Hommeltenberg, J.; Schmid, H.P.; Drösler, M.; Werle, P. Can a bog drained for forestry be a stronger carbon sink than a natural bog forest? Biogeosciences 2014, 11, 3477–3493. [Google Scholar] [CrossRef] [Green Version]
- Minkkinen, K.; Laine, J.; Penttilä, T. Greenhouse gas emissions from forestry drained peatlands and contributing environmental factors. In Greenhouse Impacts of the Use of Peat and Peatlands in Finland; Report 11a/2007; Sarkkola, S., Ed.; Ministry of Agriculture and Forestry: Helsinki, Finland, 2008; pp. 22–26. ISBN 9789524533942. [Google Scholar]
- Maljanen, M.; Sigurdsson, B.D.; Guömundsson, J.; Öskarsson, H.; Huttunen, J.T.; Martikainen, P.J. Greenhouse gas balances of managed peatlands in the Nordic countries—Present knowledge and gaps. Biogeosciences 2010, 7, 2711–2738. [Google Scholar] [CrossRef] [Green Version]
- Lohila, A.; Minkkinen, K.; Aurela, M.; Tuovinen, J.P.; Penttilä, T.; Ojanen, P.; Laurila, T. Greenhouse gas flux measurements in a forestry-drained peatland indicate a large carbon sink. Biogeosciences 2011, 8, 3203–3218. [Google Scholar] [CrossRef] [Green Version]
- Ojanen, P.; Minkkinen, K.; Penttilä, T. The current greenhouse gas impact of forestry-drained boreal peatlands. For. Ecol. Manage. 2013, 289, 201–208. [Google Scholar] [CrossRef]
- Strack, M.; Waddington, J.M.; Turetsky, M.; Roulet, N.T.; Byrne, K.A. Northern peatlands, greenhouse gas exchange and climate change. In Peatlands and Climate Change; Strack, M., Ed.; International Peat Society: Jyväskylä, Finland, 2008; pp. 44–69. ISBN 978-952-99401-1-0. [Google Scholar]
- Sarojini, B.B.; Stott, P.A.; Black, E. Detection and attribution of human influence on regional precipitation. Nat. Clim. Chang. 2016, 6, 669–675. [Google Scholar] [CrossRef]
- Sarkkola, S.; Hökkä, H.; Ahti, E.; Koivusalo, H.; Nieminen, M. Depth of water table prior to ditch network maintenance is a key factor for tree growth response. Scand. J. For. Res. 2012, 27, 649–658. [Google Scholar] [CrossRef]


| Study Area | Coordinates | Type | Drainage Ditches 1 | N | D 2 (cm) | Age 2 (year) | TRW (mm) | First Year | |||||
|---|---|---|---|---|---|---|---|---|---|---|---|---|---|
| nr. | Region | Name | Lat | Long | Mean | SD | |||||||
| 1 | Belarus | N | Berezinsky | 54.75 | 28.29 | r | Absent | 45 | 10.6 | 121 | 0.45 | 0.35 | 1826 |
| 2 | NW | Milashki | 55.43 | 27.02 | t | Distant | 40 | 17.6 | 166 | 0.55 | 0.33 | 1787 | |
| 3 | S | Aziarany | 51.95 | 27.87 | r | Distant | 16 | 13.1 | 103 | 0.70 | 0.51 | 1852 | |
| 4 | NE | Zorycy | 54.21 | 28.92 | t | Absent | 24 | 22.9 | 158 | 0.78 | 0.45 | 1786 | |
| 5 | SW | Białowieża | 52.88 | 24.02 | f, t, r | * | 170 | 26.0 | 148 | 1.01 | 0.62 | 1769 | |
| 6 | Estonia | N | Ongassaare | 59.16 | 27.43 | f, t | Present | 160 | 26.6 | 97 | 1.55 | 0.73 | 1786 |
| 7 | SE | Kanajalasoo | 58.31 | 27.30 | t | Present | 39 | 16.2 | 119 | 0.73 | 0.39 | 1796 | |
| 8 | NE | Selisoo | 59.18 | 27.28 | r | Some plots | 69 | 13.1 | 105 | 0.63 | 0.28 | 1851 | |
| 9 | SE | Ullika | 58.25 | 27.35 | r | Some plots | 61 | 10.6 | 102 | 0.55 | 0.21 | 1874 | |
| 10 | W | Tuhu | 58.58 | 23.84 | r | Some plots | 49 | 13.3 | 128 | 0.52 | 0.28 | 1856 | |
| 11 | Sweden | S | Store | 57.23 | 13.92 | r | Absent | 49 | 16.5 | 94 | 0.89 | 0.43 | 1877 |
| 12 | S | Saxnäs | 56.85 | 13.45 | r | Absent | 20 | 12.4 | 89 | 0.73 | 0.36 | 1893 | |
| 13 | S | Buxabygds | 56.80 | 14.22 | r | Distant | 21 | 17.0 | 90 | 0.99 | 0.51 | 1905 | |
| 14 | S | Hästhults | 56.70 | 13.48 | r | Absent | 25 | 15.3 | 57 | 1.33 | 0.96 | 1942 | |
| Study area | April | May | June | July | Growing Period | Yearly | ||||||||
|---|---|---|---|---|---|---|---|---|---|---|---|---|---|---|
| nr. | Region | r | R2 | r | R2 | r | R2 | r | R2 | r | R2 | r | R2 | |
| 1 | Belarus | North | −0.72 * | 0.51 * | −0.71 * | 0.50 * | −0.70 * | 0.49 * | −0.60 * | 0.36 * | −0.71 * | 0.50 * | −0.72 * | 0.51 * |
| 2 | Northwest | −0.68 * | 0.46 * | −0.67 * | 0.45 * | −0.68 * | 0.46 * | −0.57 * | 0.32 * | −0.67 * | 0.44 * | −0.72 * | 0.51 * | |
| 3 | South | 0.17 | 0.02 | 0.18 | 0.02 | 0.12 | 0.00 | 0.12 | 0.00 | 0.16 | 0.02 | 0.20 | 0.03 | |
| 4 | Northeast | −0.37 * | 0.13 * | −0.46 * | 0.21 * | −0.44 * | 0.19 * | −0.46 * | 0.20 * | −0.46 * | 0.20 * | −0.43 * | 0.18 * | |
| 5 | Southwest | 0.00 | −0.01 | −0.06 | −0.01 | 0.01 | −0.01 | −0.02 | −0.01 | −0.02 | −0.01 | −0.04 | −0.01 | |
| 6 | Estonia | Northeast | −0.60 * | 0.35 * | −0.60 * | 0.35 * | −0.33 * | 0.10 * | −0.30 * | 0.08 * | −0.42 * | 0.17 * | −0.50 * | 0.24 * |
| 7 | Southeast | −0.60 * | 0.35 * | −0.62 * | 0.38 * | −0.53 * | 0.27 * | −0.53 * | 0.27 * | −0.55 * | 0.30 * | −0.57 * | 0.32 * | |
| 8 | Northeast | −0.40 * | 0.15 * | −0.35 * | 0.11 * | 0.05 | −0.01 | 0.02 | −0.01 | −0.14 | 0.01 | −0.26 * | 0.06 * | |
| 9 | Southeast | −0.68 * | 0.45 * | −0.70 * | 0.48 * | −0.64 * | 0.40 * | −0.63 * | 0.39 * | −0.65 * | 0.42 * | −0.66 * | 0.44 * | |
| 10 | West | −0.54 * | 0.28 * | −0.61 * | 0.37 * | −0.60 * | 0.35 * | −0.65 * | 0.41 * | −0.66 * | 0.42 * | −0.65 * | 0.41 * | |
| 11 | Sweden | South | −0.42 * | 0.17 * | −0.38 * | 0.13 * | −0.48 * | 0.22 * | −0.56 * | 0.30 * | −0.48 * | 0.22 * | −0.53 * | 0.27 * |
| 12 | South | −0.36 * | 0.12 * | −0.41 * | 0.16 * | −0.41 * | 0.16 * | −0.42 * | 0.16 * | −0.44 * | 0.19 * | −0.46 * | 0.20 * | |
| 13 | South | −0.58 * | 0.32 * | −0.53 * | 0.27 * | −0.58 * | 0.33 * | −0.53 * | 0.27 * | −0.58 * | 0.33 * | −0.54 * | 0.29 * | |
| 14 | South | −0.46 * | 0.20 * | −0.29 * | 0.08 * | −0.25 * | 0.05 * | −0.13 | 0.01 | −0.25 * | 0.05 * | −0.28 * | 0.07 * | |
© 2019 by the authors. Licensee MDPI, Basel, Switzerland. This article is an open access article distributed under the terms and conditions of the Creative Commons Attribution (CC BY) license (http://creativecommons.org/licenses/by/4.0/).
Share and Cite
Potapov, A.; Toomik, S.; Yermokhin, M.; Edvardsson, J.; Lilleleht, A.; Kiviste, A.; Kaart, T.; Metslaid, S.; Järvet, A.; Hordo, M. Synchronous Growth Releases in Peatland Pine Chronologies as an Indicator for Regional Climate Dynamics—A Multi-Site Study Including Estonia, Belarus and Sweden. Forests 2019, 10, 1097. https://doi.org/10.3390/f10121097
Potapov A, Toomik S, Yermokhin M, Edvardsson J, Lilleleht A, Kiviste A, Kaart T, Metslaid S, Järvet A, Hordo M. Synchronous Growth Releases in Peatland Pine Chronologies as an Indicator for Regional Climate Dynamics—A Multi-Site Study Including Estonia, Belarus and Sweden. Forests. 2019; 10(12):1097. https://doi.org/10.3390/f10121097
Chicago/Turabian StylePotapov, Aleksei, Sandra Toomik, Maxim Yermokhin, Johannes Edvardsson, Ando Lilleleht, Andres Kiviste, Tanel Kaart, Sandra Metslaid, Arvo Järvet, and Maris Hordo. 2019. "Synchronous Growth Releases in Peatland Pine Chronologies as an Indicator for Regional Climate Dynamics—A Multi-Site Study Including Estonia, Belarus and Sweden" Forests 10, no. 12: 1097. https://doi.org/10.3390/f10121097