Article

Dynamics and Vertical Distribution of Roots in European Beech Forests and Douglas Fir Plantations in Bulgaria

1
Institute of Biodiversity and Ecosystem Research, Bulgarian Academy of Sciences, 2 Y. Gagarin Street, 1113 Sofia, Bulgaria
2
Forest Research Institute, Bulgarian Academy of Sciences, 132 St. Kl. Ohridski, 1756 Sofia, Bulgaria
3
Forest Research, Alice Holt Lodge, Farnham GU10 4LH, UK
*
Authors to whom correspondence should be addressed.
Forests 2019, 10(12), 1123; https://doi.org/10.3390/f10121123
Submission received: 14 October 2019 / Revised: 4 December 2019 / Accepted: 6 December 2019 / Published: 9 December 2019
(This article belongs to the Section Forest Ecology and Management)

Abstract

:
Identifying patterns in roots spatial distribution and dynamics, and quantifying the root stocks, annual production and turnover rates at species level is essential for understanding plant ecological responses to local environmental factors and climate change. We studied selected root traits in four different stands, two European beech (Fagus sylvatica L.) forests and two Douglas fir (Pseudotsuga menziezii Mirb. Franco) plantations. Root system vertical distribution and dynamics were studied using sequential coring method and characterised into three root diameter size classes (0–2, 2–5 and 5–10 mm) sampled at three different soil depths (0–15, 15–30, 30–45 cm). Root annual production and turnover rates were analysed and quantified using Decision Matrix and Maximum-Minimum estimation approaches. The overall root mass (<10 mm diameter up to 0–45 cm soil depth) was higher in the beech forests than in the Douglas fir plantations. Some root traits, e.g., the overall root mass, the fine (0–2 mm) and small (2–5 mm) roots mass, differed significantly between the sampling plots rather than between the forest types. The root system revealed a tree species specific vertical distribution pattern. More than half of the fine and small roots biomass of the Douglas fir stands were allocated in the uppermost soil layer and decreased significantly with depths, while in the beech forests the biomass was more uniformly distributed and decreased gradually with increasing soil depth. Although both tree species belong to two different plant functional types and the stands were situated in two distantly located regions with different climatic and soil characteristics, we revealed similar trends in the root biomass and necromass dynamics, and close values for the annual production and turnover rates. The mean turnover rates for all studied stands obtained by sequential coring and Decision Matrix were 1.11 yr−1 and 0.76 yr−1 based on mean and maximum biomass data, respectively. They were similar to the averaged values suggested for Central and Northern European forests but higher compared to those reported from Southern Europe.

1. Introduction

Plant roots play a key role in all functions and services provided by ecosystems [1]. They are involved in various ecological processes such as biomass production, nutrients cycling, carbon sequestration, water balance and also provide habitats for below-ground organisms. In forests, root systems perform essential functions for the trees such as water and nutrients supply, as well as tree physical anchorage and stability [2]. Furthermore, tree carbon allocation into their rooting systems input part of this carbon into the soils, where it can become stabilized and sequestered for the long term. Despite decades of extensive research our understanding on root traits, their dynamics and spatial variability, and input to soil processes and ecosystem functions remains limited due to the challenges related to belowground studies [3]. A wide range of direct measurement techniques for root ecological studies are used, usually classified as non-destructive (e.g., rhizotrons and minirhizotrons) and destructive (e.g., soil coring and isotopic-labelling) [4], and their strengths and limitations to study root stocks, net primary production and turnover of forest trees have often been discussed [5,6,7,8,9].
Although having some disadvantages, sequential soil coring is widely used approach for estimating fine roots net primary production, mortality and turnover [5,10,11,12,13,14,15,16]. It combines direct measuring of root biomass and necromass at specified time intervals using soil cores (i.e., the roots dynamics over the growing season), and a subsequent estimation of root production and turnover by different methods Maximum-Minimum, sum of changes and/or Decision Matrix has been applied mainly to evaluate the net primary production of small-sized roots (<10 mm in diameter) and particularly fine roots.
Usually, fine roots are defined as roots with diameter below a threshold, most commonly 1 or 2 mm, and 3 or 5 mm in older studies [17]. The affiliation to fine/coarse root classes is usually determined by the measuring method used and the functions investigated [17,18]. Other studies classify roots with diameter 2–5 mm as small roots [19,20,21,22,23] and those above 5 mm as coarse. Although widely used in root ecological studies, some recent studies criticize this simple, pragmatic classification approach and suggest a more comprehensive one based on root branching order that links form and physiology to individual roots functions [24,25]. Despite the shortcomings of traditional approaches applying arbitrary root size classes, numerous data has already been accumulated in the literature that allow us to compare and analyse root structure complexity across different plant taxa. Identifying patterns in roots spatial distribution, phenology and turnover rates at species level are critical for understanding plant ecological responses to local environmental factors [26] and climate change [27]. The plant functional type and climate, particularly the temperature, have been found to be the two strongest predictors of fine-root traits variation [28], therefore an accumulation of comprehensive data on root system traits of various tree species and the associated environmental factors are important for predicting tree and ecosystem responses to water and nutrient resource and environmental stress [29].
The Douglas fir (Pseudotsuga menziesii (Mirb.) Franco) is the second most cultivated non-native conifer tree species in Europe [30,31] due to its high productivity and timber quality [32]. It has been found to be more resistant and resilient to previous drought extremes [33] and planting the species is suggested as a strategy to improve the adaptiveness of European forests to changing climate [34]. Douglas fir plantations in Europe accounts for more than 800,000 hectares [35]. In Bulgaria it covers c. 0.2% (9078 ha) of the forested area [36] and is the most planted non-native coniferous species. Afforestation has begun at the beginning of 20th century but increased substantially in 1960–1970s. Nowadays, the Douglas fir plantations are located at wide-range of elevations (150–1600 m a.s.l.), steep slopes (up to 36 degrees) and eroded soils [37]. Most plantations have demonstrated high productivity and adaptability, especially those located at north-eastern exposures and altitudes c. 700–1200 m a.s.l. The species shapes its abiotic environment similarly to some native trees such as Norway spruce (Picea abies Karst.), silver fir (Abies alba Mill.) or European beech (Fagus sylvatica L.) [31]. Beech (F. sylvatica ssp. sylvatica and F. sylvatica ssp. orientalis (Lipsky) [38] is a widespread deciduous species (c. 17% of the total forested area of the country) [36] prevailing in the mountain areas at an altitude of 900 to 1500 m a.s.l. The beech dominated forests have an ecological and economic importance, however it is susceptible to extreme droughts, which might be the main factor controlling its expected response to climate change [39].
In this study, we investigated selected root traits that characterise the root system distribution (e.g., root mass vertical allocation) and root system dynamics (e.g., fine roots annual production and turnover) in European beech forests and in planted Douglas fir stands. These tree species represent two plant functional types (woody broadleaved deciduous vs. woody needleleaf evergreen [40] with similar requirements to climate and soil characteristics. The objectives of this study were to assess: (i) belowground mass (biomass and necromass) distribution across different root diameter classes and soil depths; (ii) root annual production and turnover rates over one-year period and their variations with soil depth; and (iii) patterns of temporal dynamics in root biomass and necromass.

2. Materials and Methods

2.1. Sampling Plots Description

The study was carried out in two natural European beech forests (Fs1 and Fs2) located in The Central Balkan Mountains, and two Douglas fir (Pm1 and Pm2) plantations located in The Rhodope Mountains (Table 1). At each stand one sampling plot (100 m2) for long-term monitoring observations has been established in relation to previous studies [41,42,43].

2.2. Soil Sampling and Analysis

Soil sampling took place in May 2015 during the first root sampling. In each experimental plot one representative soil profile was excavated and 100 g soil was collected at three depths 0–15, 15–30 and 30–45 cm into plastic bags. The soil samples were air-dried, plant materials and roots were removed, then soil was sieved through 2 mm mesh sieve and then homogenized for analyses. Soil properties (pH, carbon and nitrogen) were analysed according to standard methodologies in the laboratory of Forest Research, Alice Holt, UK. For bulk density assessment, the soil samples were collected at each soil depth using steel cylinders (80.7 cm3) in three replicates and analysed in the Laboratory of Forest Soil Science at the Forest Research Institute, BAS. Detailed data characterising the soil profile at each depth are presented in Supplementary Table S1.

2.3. Root Sampling and Analysis

The sequential coring method [44,45] was used to assess roots distribution and temporal dynamics, as well as annual production and turnover rates. Soil cores were collected every month from May to October 2015 and in April 2016. A cylindrical steel corer with an inner diameter of 8 cm and 15 cm length (753.9 cm3) was used for soil sampling. At each sampling plot 12 random points were selected each month and soil core samples (36 per sampling plot) were collected at three different depths (0–15, 15–30, 30–45 cm) and about 1 m distance from tree trunks. Overall, a total number of 1008 soil samples were collected and processed. Roots were extracted from the soil and washed using sieves with apertures 1 mm and 63 µm within 24 h of sampling. Subsequently, the extracted roots were divided into two status categories (live and dead) and three diameter classes (fine (0–2 mm), small (2–5 mm) and coarse (5–10 mm) roots) [19,20].
The roots were considered ‘live’ if they were pale-coloured on the exterior, elastic and flexible, and free of decay with a whitish cortex; and as ‘dead’ if they were brown or black in colour, rigid and inflexible, in various stages of decay [16,44]. After sorting, the roots were oven-dried at 90 °C for 48 h to a constant mass and weighed to the nearest 0.01 g. Dry weights of living roots (biomass) and dead roots (necromass) for each diameter class were converted to g m−2. The root mass (biomass + necromass) per each soil depth (0–15, 15–30, 30–45 cm) and the total root mass (biomass + necromass within 0–45 cm depth) were calculated for each diameter class.

2.4. Estimation of Annual Fine Root Production and Turnover Rates

The annual production (Pa; g m−2 yr−1) was estimated using Decision Matrix (DM) and Maximum-Minimum (MM) calculation techniques described in details by Brunner et al. [46].
The Decision Matrix (DM) takes into consideration changes in root biomass and necromass between sampling dates and calculates the annual fine root production (Pa) by summing all calculated productions (P) between each pair of consecutive sampling dates during a one-year period:
Pa = ∑ P
The production (P) is calculated either by Equation (1) adding the differences in biomass (ΔB) and necromass (ΔN), Equation (2) adding only the differences in biomass (ΔB) or Equation (3) equaling P to zero [47].
P = ΔB + ΔN
(a) if biomass and necromass have increased
(b) if biomass has decreased and necromass has increased; but |ΔB |lower than |ΔN|
P = ΔB
(a) if biomass has increased and necromass has decreased
P = 0
(a) if biomass and necromass have decreased
(b) if biomass has decreased and necromass has increased; but |ΔB| higher than |ΔN|
The Maximum-Minimum (MM) method is based on the difference between the maximum and minimum fine root biomass measured during a one-year period; it is calculated by subtracting the lowest biomass value (Bmin) from the highest biomass value (Bmax) [48].
The fine roots turnover rates (TR; yr−1) were calculated either by dividing the annual fine root production (Pa) to the maximum biomass value (Bmax) [49] or by dividing it to the mean biomass value (Bmean) [48].
TRBmax = Pa/Bmax
TRBmean = Pa/Bmean

2.5. Statistical Analyses

Root data means and standard errors of the means were calculated per each plot. Statistical analyses were carried out on a subsample of 252 root samples per each diameter class and status category (live or dead). The examination by Shapiro-Wilk W test did not confirmed assumptions of normality for the most data and normal distribution was not achieved via transformation. Therefore, non-parametric statistical tests (Mann–Whitney U test and Kruskal-Wallis ANOVA by Ranks test) were used to test for differences in root necromass, annual production and turnover rates between tree species, study plots and soil depths. The distribution of root biomass was normalised by Box-Cox transformation, and Factorial ANOVA was used to test for differences between tree species, study plots and soil depths. Bonferroni post-hoc procedure for pair-wise comparisons was applied when significant differences were detected. Friedman ANOVA by ranks tests for repeated measures followed by pairwise comparisons using Wilcoxon matched pair tests were used to investigate temporal dynamics of root biomas/necromass. Levels of p < 0.05 were accepted as significant. All statistical analyses were carried out with STATISTICA, Version 13.2.1 (Statsoft Inc., Tulsa, OK, USA).

3. Results

3.1. Root Stocks and Root Size Classes Allocation

The overall root mass (all roots below 10 mm diameter distributed within 0–45 cm soil depth) was significantly higher in beech than in Douglas fir stands (t-test, t(82) = 2.25, p = 0.027), which was mainly attributed to the significantly higher quantity of small roots in the beech forests (t-test, t(82) = 4.65, p < 0.001). The overall root mass and the root mass of each diameter class revealed different distributional patterns among sampling plots (Figure 1A–D). The total fine root mass and the total small root mass were significantly higher in Fs1 and Pm1 plots than in Fs2 and Pm2 plots (One-Way ANOVA, total fine root mass: F3, 80 = 7.9, p (Bonferroni correction) < 0.001; total small root mass: F3, 80 = 23.2, p (Bonferroni correction) < 0.001; Figure 1B,C, Table 2); however the total fine root mass of both tree species varied in similar ranges. The total small root mass was significantly higher in Fs1 than in Fs2 plot and in Pm1 than in Pm2 plot. No significant difference in the total coarse root mass between the plots and tree species was found (Figure 1D). In the Douglas fir plantations, the relative total mass of fine roots was almost equal to the small root total mass (c. 36%) while in the beech forests the average proportion of fine roots (29%) was considerably lower than of the small roots (45%). Coarse roots had similar proportions in all sampling plots (25–28%).

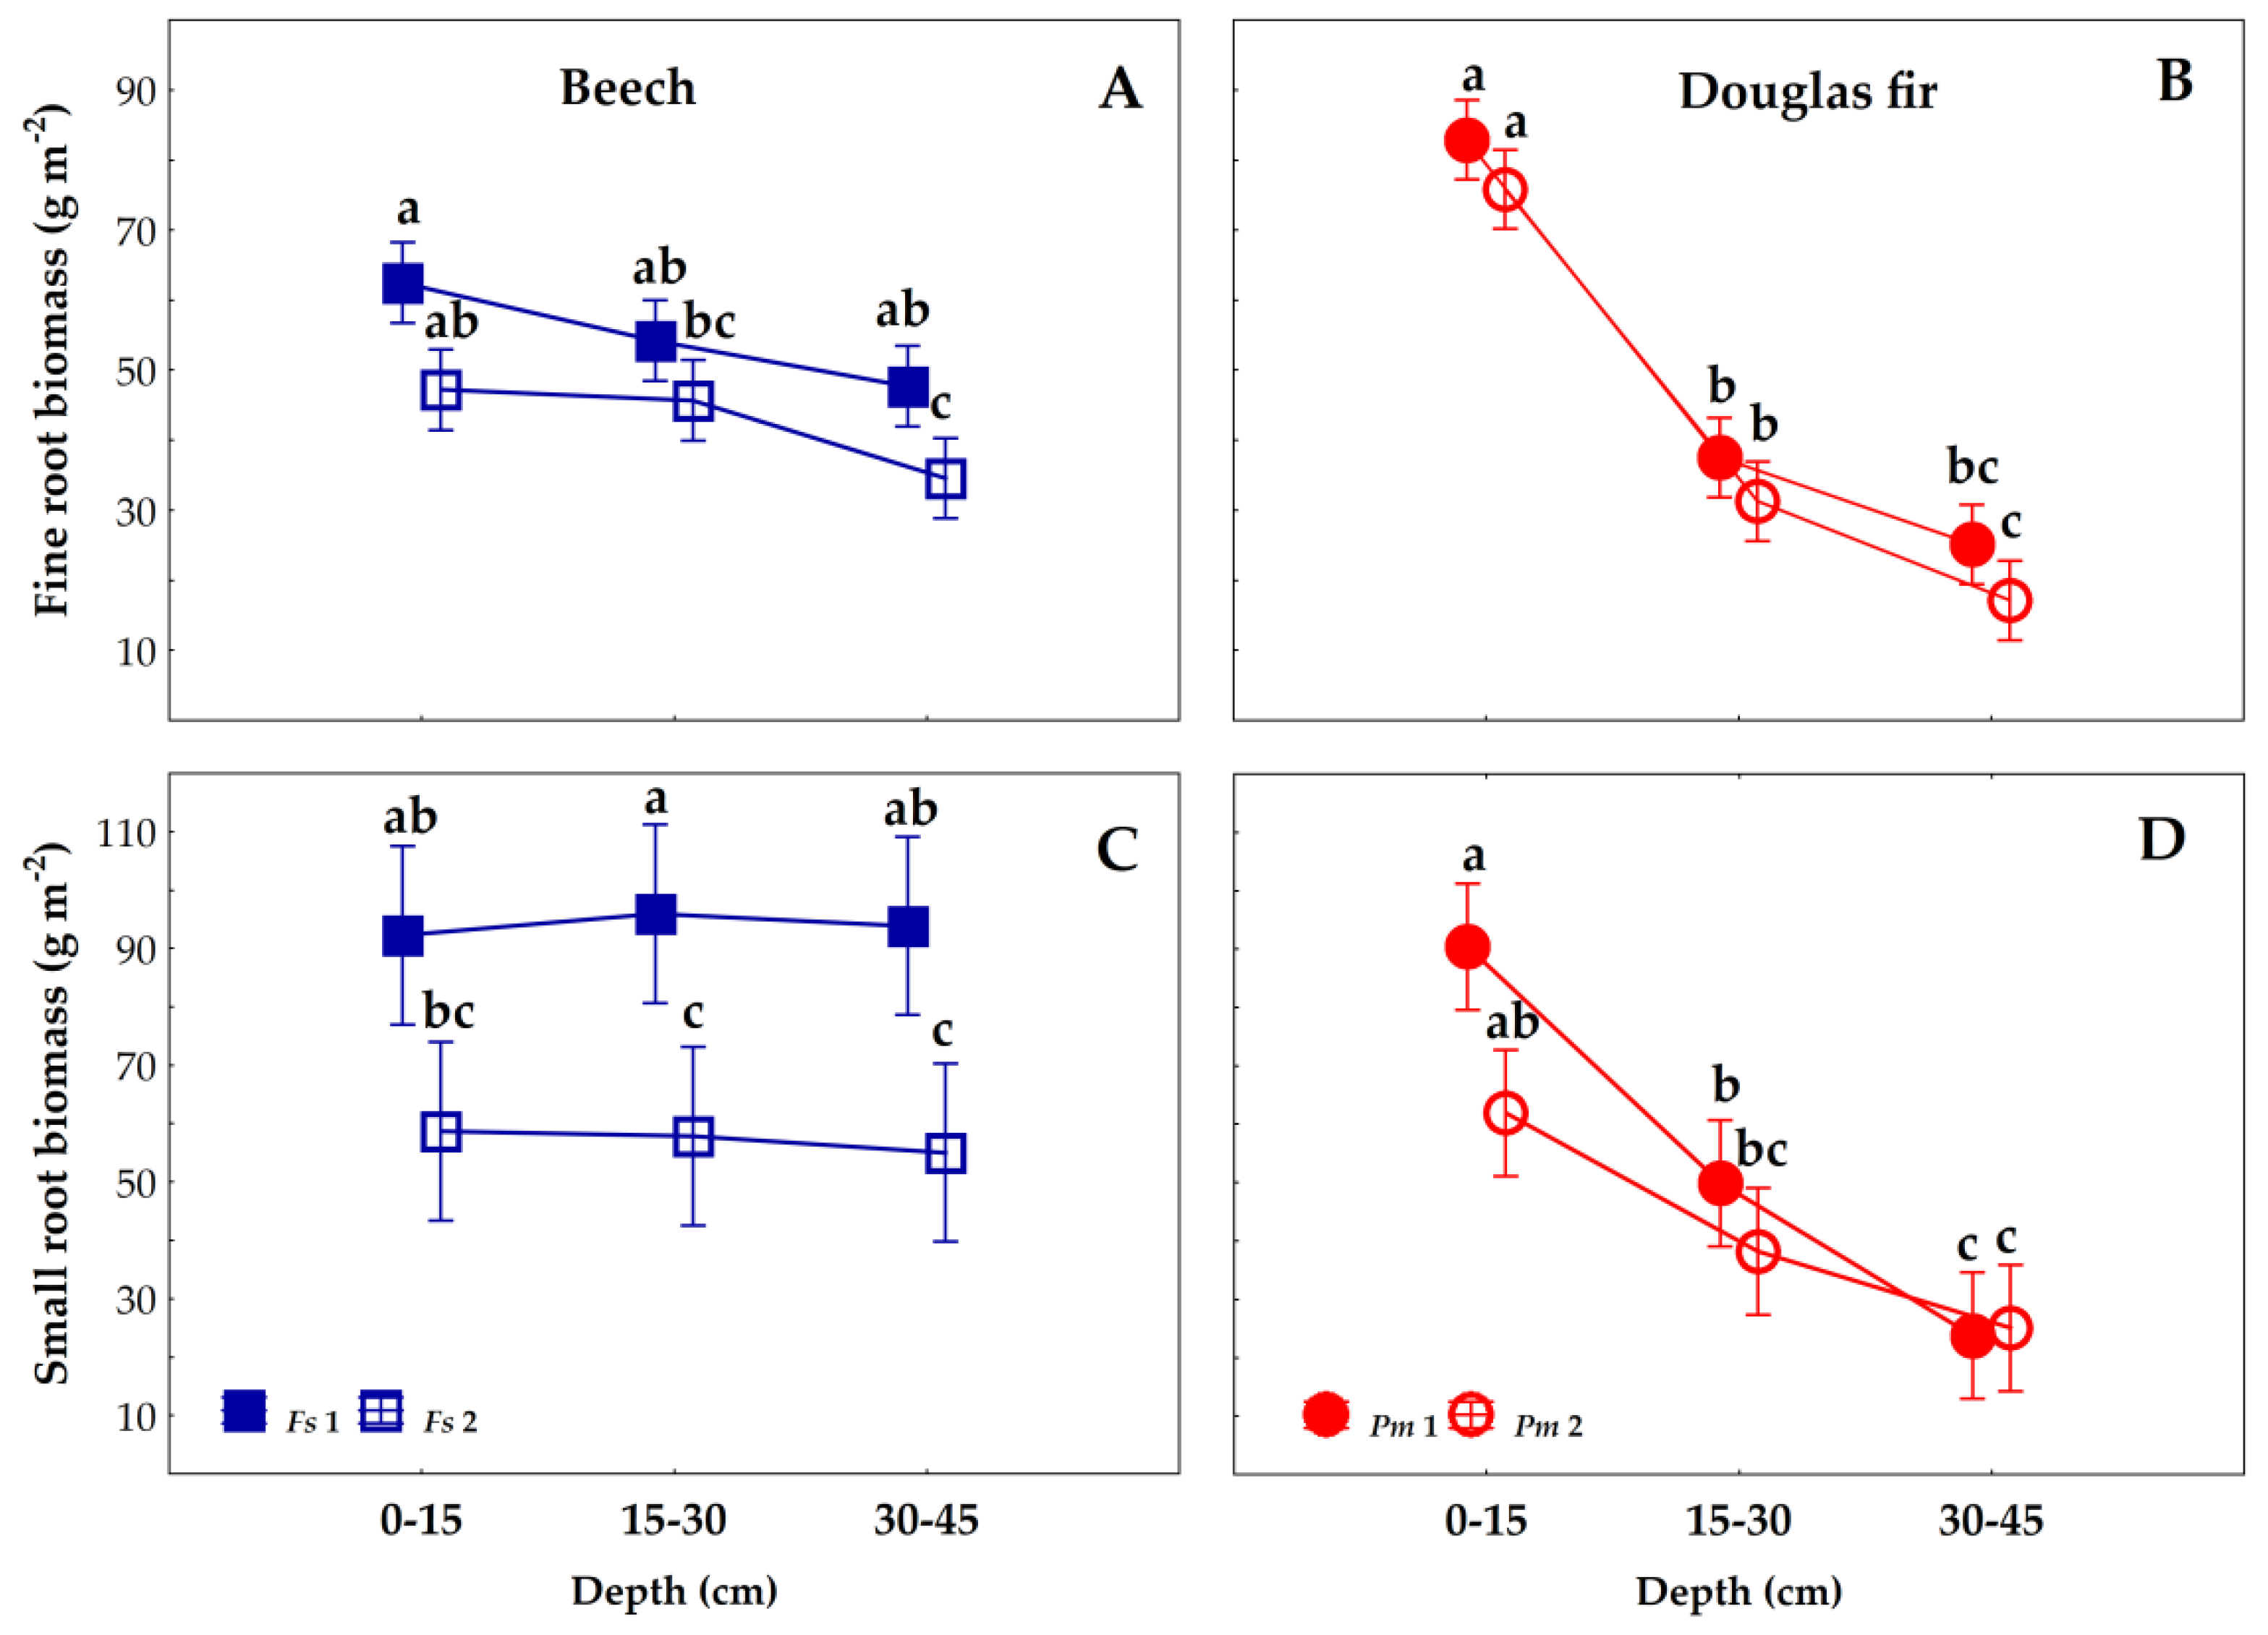
3.2. Fine and Small Roots Biomass/Necromass Vertical Distribution

Averaged data of root biomass and necromass at three different soil depths (0–15, 15–30, 30–45 cm) and total (0–45 cm) by diameter classes, sampling plots and tree species are presented in Table 2. The vertical distribution of fine (Figure 2A,B) and small roots biomass (Figure 2C,D) revealed different patterns between both tree species. In the beech forests, the fine root biomass decreased gradually for all three soil depths (avg. 38%, 34% and 28% for 0–15, 15–30 and 30–45 cm, respectively) and a significant difference was found between the uppermost and the lowest layers only (Factorial ANOVA, F2, 123 = 7.3, p < 0.001, p (Bonferroni correction) < 0.02; Figure 2A). More than half (avg. 59%) of the fine root biomass in both Douglas fir plots were in the upper soil layer (0–15 cm) and decreased significantly with soil depths (15–30 cm—avg. 25% and 30–45 cm—avg. 16%) (F2, 123 = 123.7, p < 0.001, Figure 2B). No clear stratification in the vertical distribution of small root biomass was found in the beech forests (34%, 33% and 32%) (Figure 3C). However, the small root biomass of the Fs2 plot was much lower and differed significantly at deeper soil layers (15–30 and 30–45 cm) compared to these of Fs1 plot (p (Bonferroni correction) < 0.01, Figure 3C). For Douglas fir plantations, the highest proportion of small root biomass was found in the upper soil layer 0–15 cm (53%) and decreased significantly to 30% and 18% at 15–30 and 30–45 cm depths, respectively (F2, 123 = 37.6, p < 0.001; Figure 3D).
The proportion of fine root necromass in the total fine root mass was lower in the beech (avg. 6% (0–25.0%) than in the Douglas fir plots (avg. 15% (0–60%). The relative fine root necromass was significantly higher in the upper soil layer of the beech forests (avg. 7.4%) (Kruskal-Wallis test, H (2, N = 126) = 7.1, p = 0.03) and similar at 15–30 cm and 30–45 cm depth (4.5%, 4.9%). The fine root necromass in the Douglas fir plots was uniformly distributed among layers (avg. relative weights 16%, 16% and 14%, for 0–15, 15–30 and 30–45 cm depth, respectively). With the exception of Pm2 plot, the proportion of small root necromass was higher compared to the fine root necromass (Table 2), and prevailed significantly in the Douglas fir plantations, i.e., 19% (0–69%) vs. 11% (0–62%) in the beech forests (Mann-Whitney test, U = 6711.5, p = 0.04). Small root necromass was lowest in the deepest soil layer of the beech plots (avg. 13%, 13%, 6%, respectively; Kruskal-Wallis test, H (2, N = 126) =13.6, p = 0.001), however the observed trend of increase of necromass proportion with the increase soil depth in Douglas fir plots was not significant (avg. 13%, 17%, 28%).

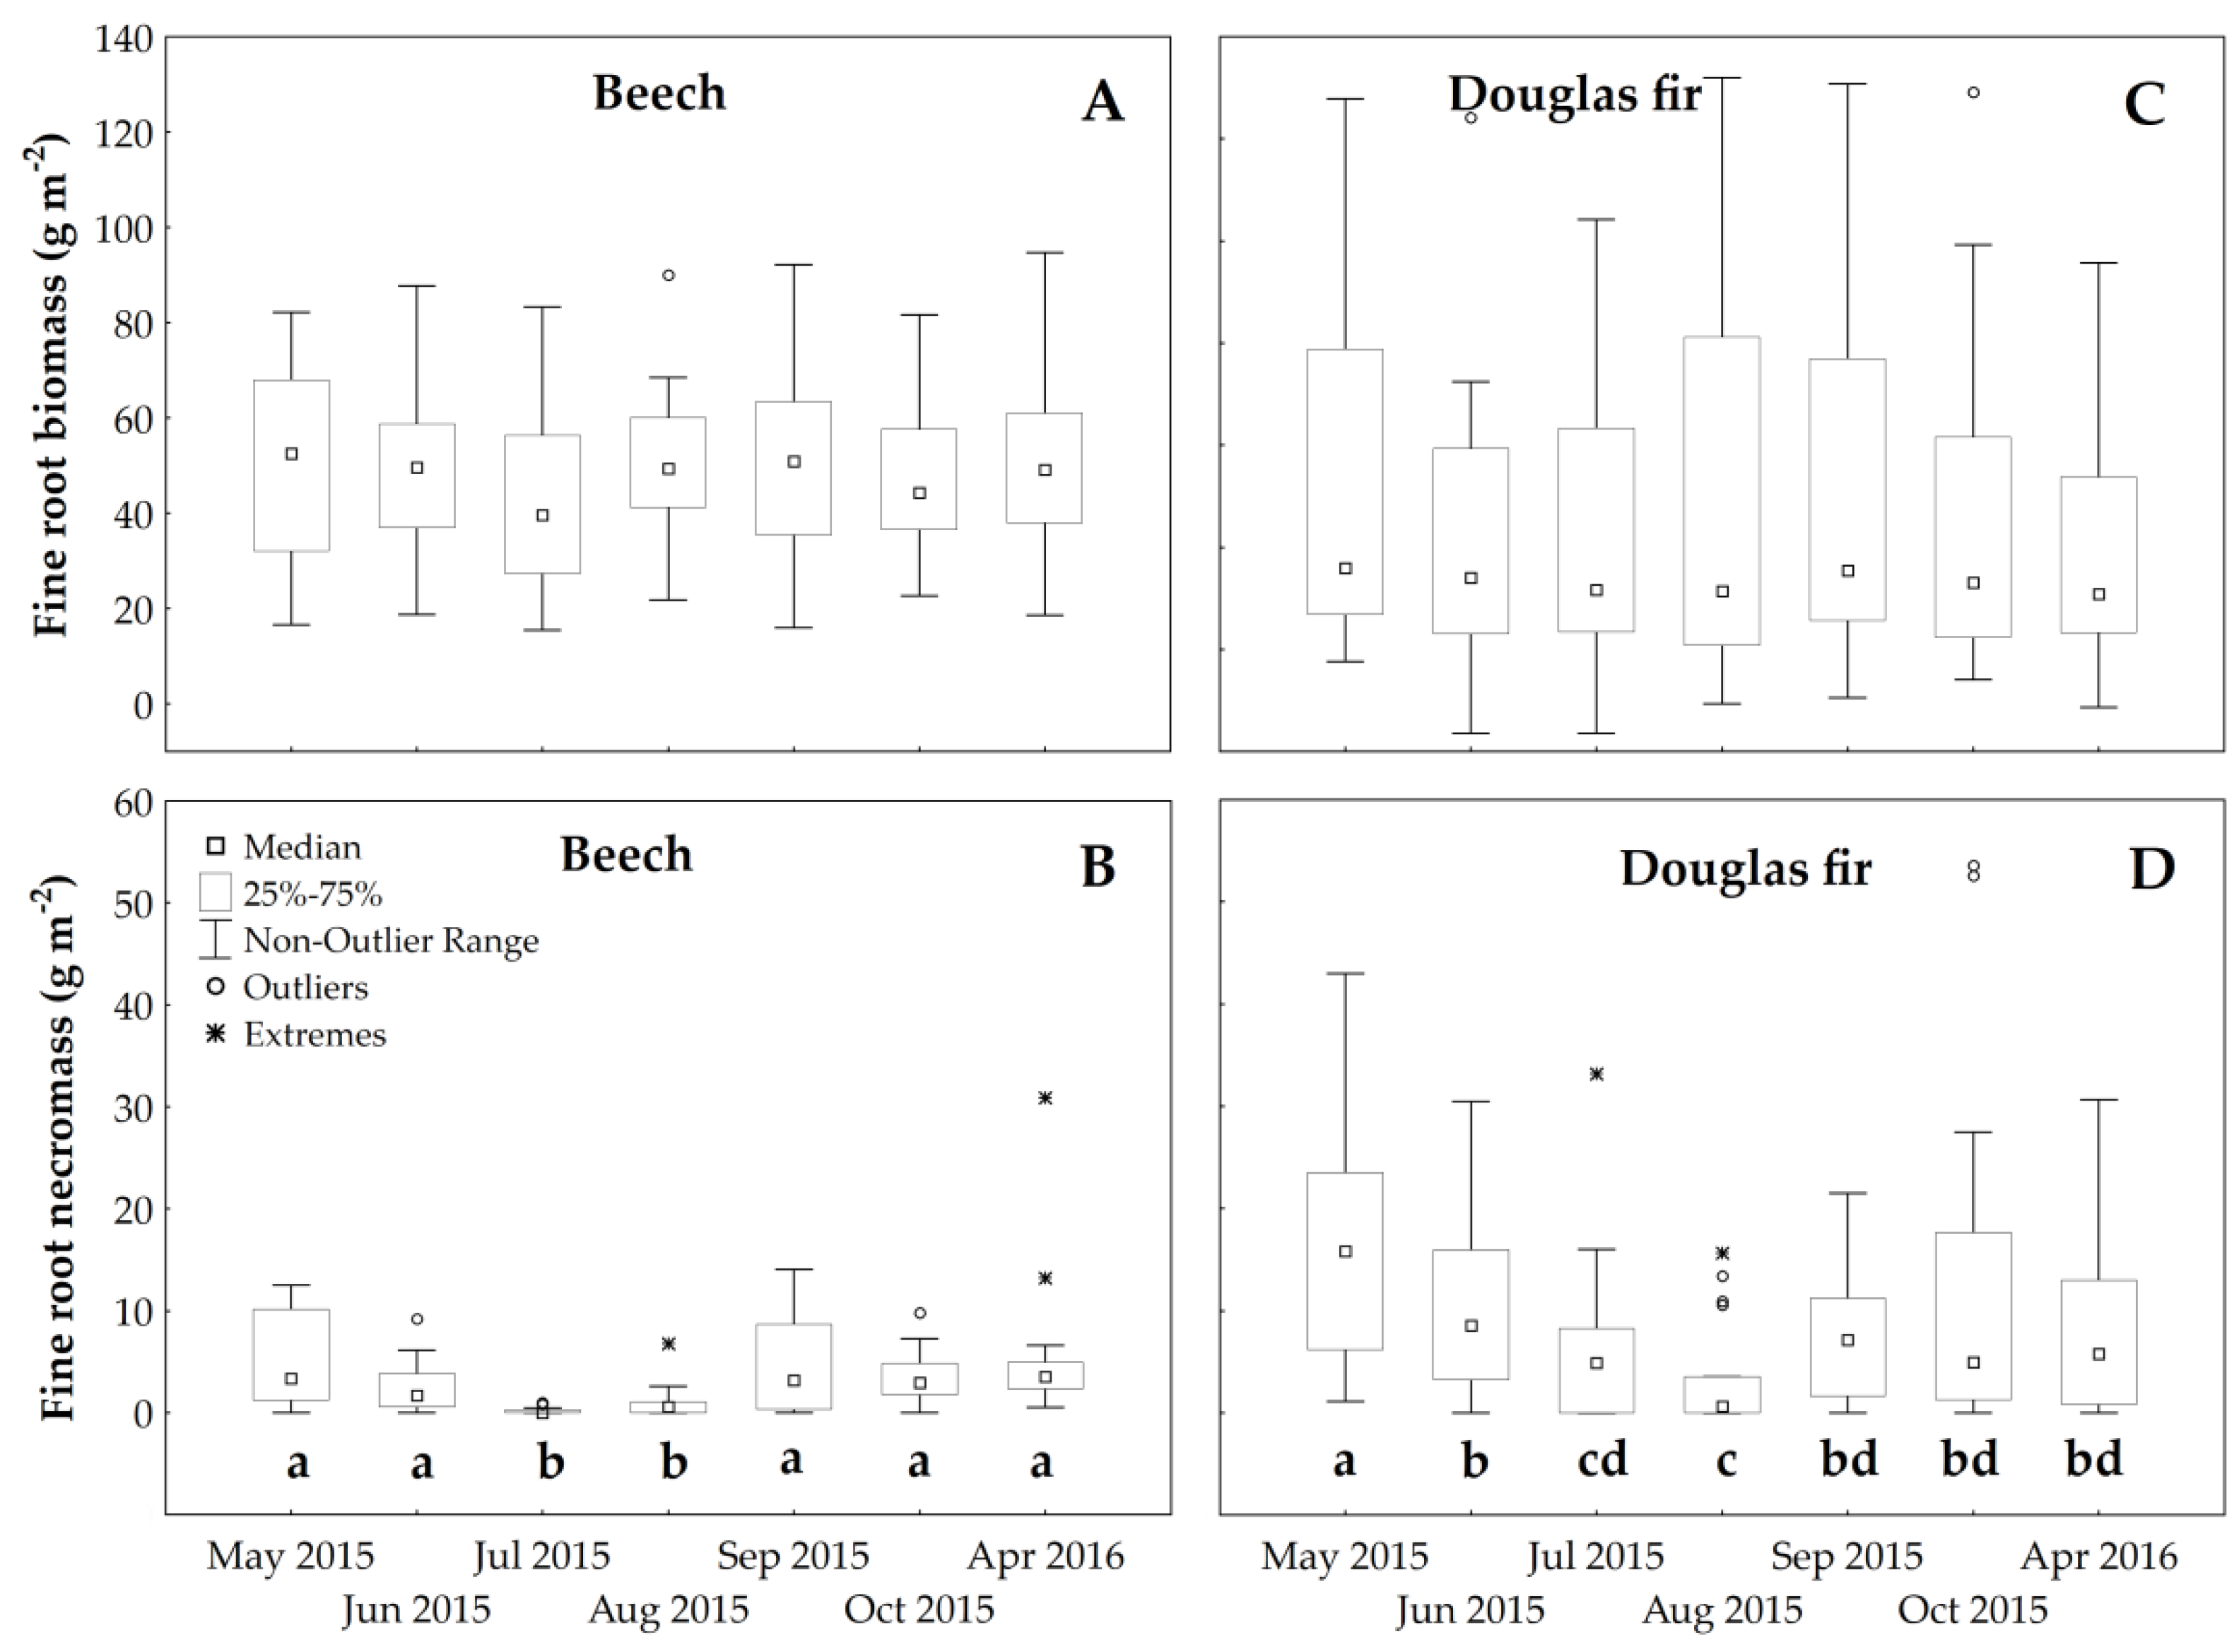
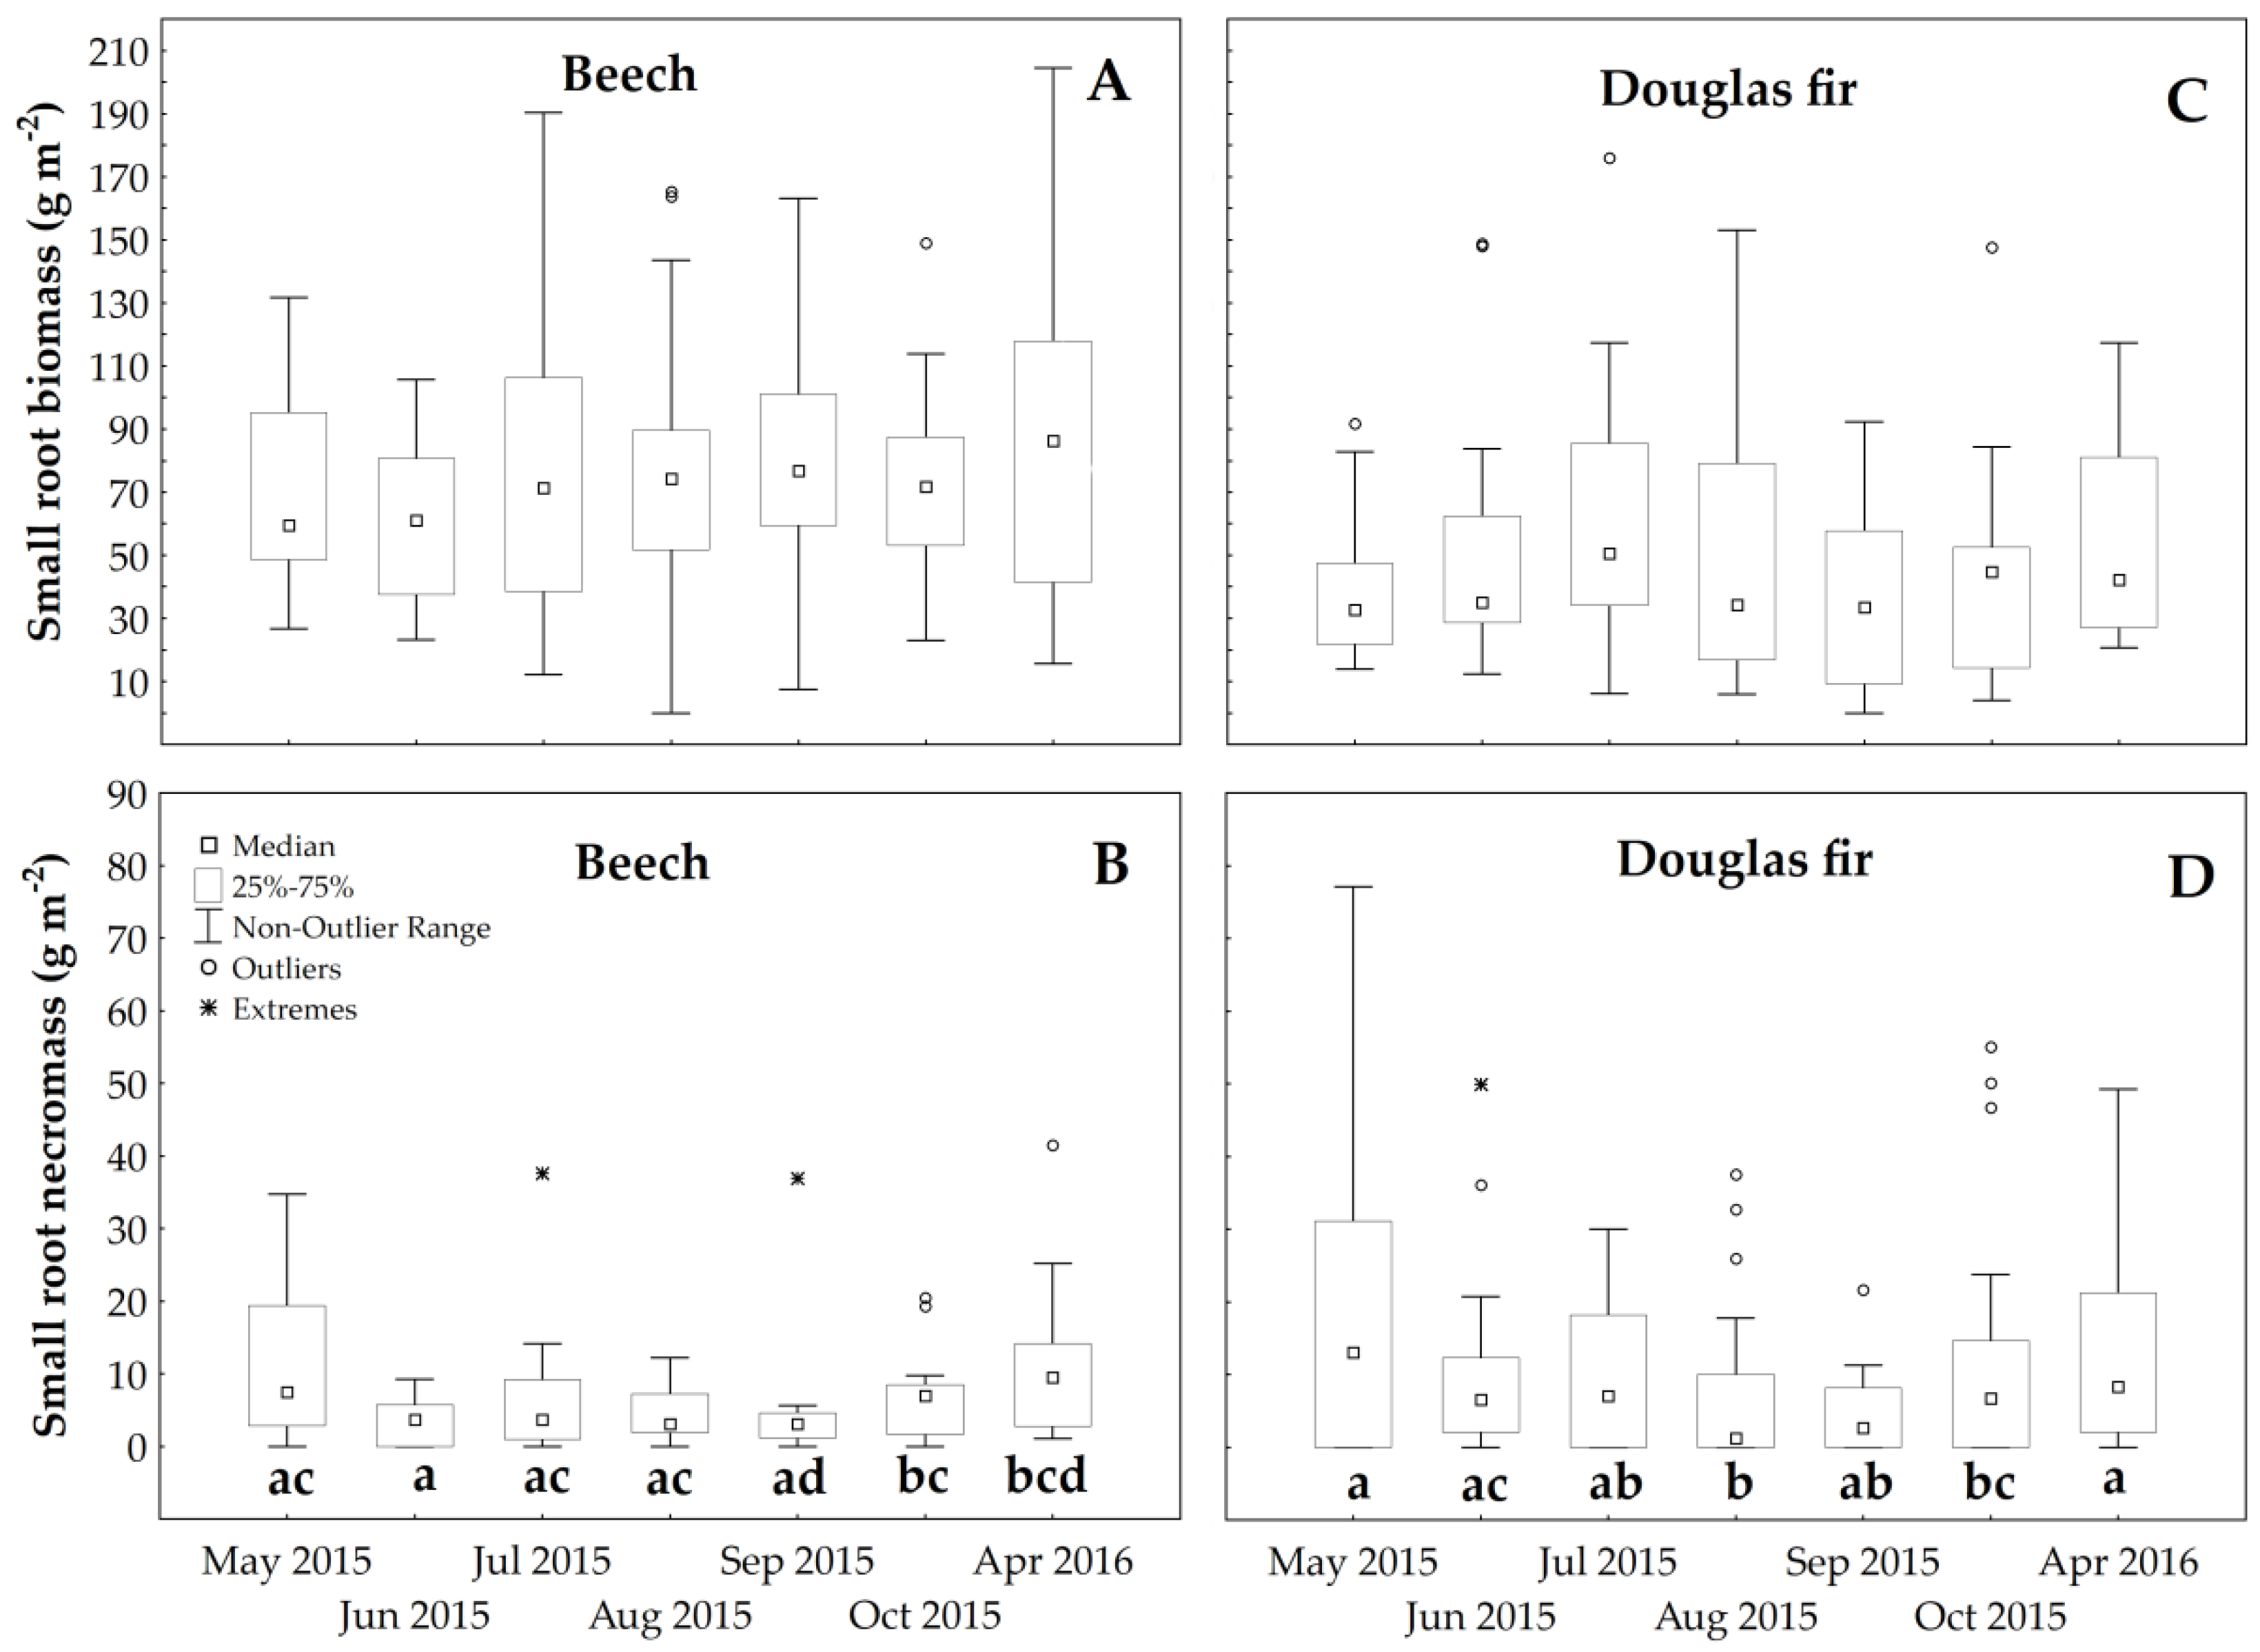
3.3. Root Temporal Dynamics

In general, the fine and small roots biomass and necromass temporal dynamics showed similar trends for both tree species. The fine root biomass varied among sampling dates, however no significant differences between the different dates for each tree species were found (Figure 3A,C). The variation in monthly fine root necromass showed a decrease, reaching its minimum in July for the beech forests, and in August for the Douglas fir stands, with a subsequent increase thereafter; Significant differences among sampling dates were found for both tree species: beech (Friedman ANOVA, χ2 (N = 18, df = 6) = 44.0, p < 0.001) and Douglas fir (χ2 (N = 18, df = 6) = 39.7, p < 0.001); Wilcoxon matched pair test, Figure 3 B,D) and these trends were significant for all depths (data not shown).
The temporal dynamics of small root biomass and necromass showed similar patterns. No significant differences in monthly variation of root biomass for both tree species were found (Figure 4A,C). However, significant differences in the total necromass (0–45 cm) among sampling dates were found for both tree species-beech: Friedman ANOVA, χ2 (N = 18, df = 6) = 17.8 p = 0.007; Douglas fir: χ2 (N = 18, df = 6) = 18.0, p = 0.006); Wilcoxon matched pair test, Figure 4B,D). These differences persisted in the beech forests for the first two soil layers (0–15 cm: χ2 (N = 6, df = 6) = 14.5, p = 0.02; 15–30 cm: χ2 (N = 6, df = 6) = 12.4, p = 0.05). No significant differences in the necromass variations on a monthly basis for each soil depth in the Douglas fir was found.

3.4. Root Annual Production and Turnover Rates

Mean values for fine and small roots annual production, and turnover rates obtained by DM and MM methods using mean and maximal biomass per each sampling plot and soil depth are presented in Table 3. The total fine root annual production (0–45 cm) estimated by means of DM method was higher for the beech (avg. 162 g m−2) than for the Douglas fir plots (avg. 117 g m−2) and did not differ significantly between the sampling plots within each tree species (beech: U = 40, p = 1.00; Douglas fir: U = 0.32, p = 0.07) and between the tree species (Mann-Whitney test, U = 7, p = 0.09). Along the soil depth gradient, no significant differences in the fine root annual production for the beech forests were found (Kruskal-Wallis test, H (2, N = 18) = 0.56, p = 0.8; while for the Douglas fir plantations, the fine root production of the topsoil (0–15 cm) was significantly greater as compared to the deeper soil layers (DM method, H (2, N = 18) = 8.9, p = 0.01; multiple comparisons: between 0–15 and 15–30 cm, p = 0.045, the 0–15 and 30–45 cm, p = 0.01). The annual production of the small roots was two to three times higher as compared to fine roots (Table 3). The annual production of small roots (0–45 cm) of beech forests was slightly higher than of the Douglas fir plantations (avg. 393 vs. 321 g m−2), and differed significantly between both beech plots (Mann-Whitney test, U = 13, p = 0.02). A clear trend of decrease in small root production along the soil depth gradient was found for the Douglas fir (Kruskal-Wallis test, H (2, N = 18) = 8.7, p = 0.01) but not for the beech.
The mean values of turnover rates of fine roots calculated by Decision Matrix method using mean (Bmean) and maximal (Bmax) biomass for beech and Douglas fir plots were close (Bmean: 1.17 vs. 1.04) and very close (Bmax: 0.80 vs. 0.72). The values obtained for each soil layer varied in wide ranges (Bmean: 0.28–2.00, Bmax: 0.25–1.43), however no significant differences related to tree species, sampling plot or soil depth were found. Therefore, as a result of this study we suggest the following average values for the turnover rates for all stands: 1.11 (Bmean) and 0.76 (Bmax).

4. Discussion

4.1. Standing Root Stocks

Two beech and two Douglas fir stands were compared based on several belowground root traits such as standing root mass, annual production and turnover rate, all important not only for tree health, nutrient and water uptake but for carbon input to soils. The higher overall root mass (<10 mm diameter up to 0–45 cm soil depth) in the beech was mainly attributed to the significantly greater quantity of small roots which suggest higher carbon allocation of this species to roots of size between 2 and 5 mm. We observed higher differences in the overall root mass, and in the total fine and small roots mass between the plots than between the forest types and the observed trend was consistent for both locations. The significantly higher fine and small roots mass in two of the plots (Fs1 and Ps1) we could relate to the differences in stand characteristics i.e., the greater stem density in both plots. Significant influence of stand density on the fine root quantitative traits and vertical distribution was observed for Norway spruce forests [22,50]. The total fine root mass was positively correlated with the stem density at the stand level and negatively at the single tree level.
The mean total fine root stock of the beech forests (156 g m−2) in our study was consistent with data reported for this species [46,51], falling in the lower limit of the reference ranges and were most similar to the values reported for beech forests from Italy (119–230 g m−2, 0–30 cm) [52,53] and partly to data from Germany (42–195 g m−2 for 0–20 cm soil depth) [54]. The large variations observed in the standing fine root stock of beech forests from Europe might be related to the application of different sampling methods and sampling soil depths, and differences in climatic and stand characteristics [49,55,56]. Similar wide-range variation in the fine root biomass for Douglas fir was also observed (see Supplementary Table S2). Most published data on Douglas fir roots were from forests of North America where the species cover a large latitudinal (19°–55°) and elevation range (from sea level to 3260 m) [57] and a few from plantations along Europe. The mean total fine root stock (162 g m−2) revealed in our study was similar to data reported for young (28 and 36 years old) plantations from The Netherlands (73–273 g m−2, soil depth 0–40 cm) [58] and lower compared to data from reported from North America (182–792 g m−2 for 0–50 cm, Canada) [59] and 270 and 830 g m−2 for 0–45 cm, Seattle, WA, USA, [60].

4.2. Root traits Vertical Distribution

We observed different patterns of vertical distributions of fine/small roots biomass between both tree species but similar rooting pattern between the plots within each tree species. More than half of the fine and small roots mass (avg. 59% and 53%, respectively) of the Douglas fir plantations were allocated to the uppermost soil layer and decreased significantly with depths, while in the beech forests the biomass was more uniformly distributed and decreased gradually with increasing soil depth for both root size classes. This finding was not consistent with the results of Hendriks and Bianchi [61] who found a similar rooting pattern of fine roots allocation in pure beech and Douglas fir stands with highest root density in the upper (0–15 cm) and significant decrease in the lower soil layers (15–30 and 30–40 cm). However, in the mixed beech-Douglas fir stands the roots allocation differed from those of pure stands i.e., the fine roots density was more equally distributed. Studies on fine roots in pure beech-dominated forests reported two main different types of distribution: (i) highest biomass in the top soil layers (H and M1) and an apparent decrease with depth [52,55,62,63,64] and (ii) somewhat equal vertical distribution [65]. Similarly, different vertical fine roots distribution patterns were observed for pure and mixed beech stands. An increased roots biomass in deeper layers was found in mixed stands of beech with Norway spruce [65], common ash [66], Sessile oak [62] and Douglas fir [61]. Using minirhizotrons in two old Douglas fir forests, Oregon Cascade Mountains, Tingey et al. [67] revealed similar to our fine roots allocation with the highest biomass being in the upper 0–20 cm layer (av. 55%) and a significant decrease at 20–40–60 cm (13–28%) depth. In Douglas fir plantations in The Netherlands, a slight decrease with soil depth to a relatively uniform vertical distribution of fine roots biomass was observed during first two years of the investigation and a considerable change at the third year when a dry period has preceded the soil sampling [58]. A higher vertical variability including a biomass increase at deeper layers was detected in all three sites. The contrasting patterns of roots allocation in this study and variations observed in previous studies might be either related to the species root architecture [68] or to roots plasticity response to local environmental factors [69]. Water and nutrients vertical allocation [70,71] might also explain higher fine and small roots biomass in the uppermost layer of mineral soil in the Douglas fir stands and the relatively uniform distribution observed in beech forests. The significantly higher carbon and nitrogen content and mineralisation across the soil profile suggested by the C/N ratio under the beech in addition to lower soil bulk density (Supplementary Table S1) could have provided better soil conditions for root growth and expansion with depth compared to soil condition under the Douglas fir. In addition, significantly higher rainfall (Table 1) and lower water interception in the beech forests than in the Douglas fir plantations [72] provide higher water input to the soils and water availability with soil depth thus aid beech fine root growth and extension. Douglas fir is considered more drought resistant than the European beech, however, dense system of fine roots in the topsoil of established saplings [68] and formation of large fine roots biomass in the uppermost layers of the mineral soil of mature trees [73], as in this study, could be a significant drawback in periods of extreme climatic events.
The fine and small root annual production of the Douglas fir stands showed a clear stratification trend compared to these of the beech forests but no a clear stratification in turnover rates was found. Published data on vertical variability of roots annual production and turnover rates for beech and Douglas fir forest are scarce. Inter-species differences in the fine root production was reported for deeper (10–20 and 20–30 cm) but not for the uppermost (0–10 cm) soil layers in temperate forests, dominated by six deciduous tree species [74], with fine roots productivity of F. sylavtica significantly higher in the deeper (20–30 cm) than in the upper mineral soil layers. The same large variation in turnover rates values within a tree species and no uniform trend of fine root turnover variation with soil depth was observed in other studies as well [52,74,75].

4.3. Root Dynamics

It is well known that tree roots growth clearly responds to seasonal patterns and these responses are frequently modified by external abiotic factors. Although both studied tree species belong to two different plant functional types and the forests were located in two distantly located regions, we revealed similar trends in roots biomass and necromass dynamics. Monthly fluctuations in the biomass for both the fine and small roots were insignificant thus corresponding to a uniformly distributed pattern [26]. Vice versa, the necromass dynamics revealed a more explicit annual trends with highest values obtained in the spring (and autumn for fine roots) and lowest in the summer and these trends were most distinct in the uppermost soil layer (0–15 cm). These observations might be a result of root-litter changes due to unfavourable growth conditions during winter and summer months.
In general, four alternate patterns of root production in temperate regions of the northern hemisphere are conceivable: concentrated (unimodal or single seasonal pulse), bimodal with one dominant or two equal peaks, and distributed [26]. A rapid root growth to a single peak in spring or begging of growing season [76,77] and a bimodal pattern with two peaks detected at different time periods during the year [52,76,78] seems to be the most frequently observed patterns in fine root biomass dynamics. Lack of seasonally related root biomass pulses were also observed [11,12]. A wide variation in timing of root production with some species producing a single root flush in early summer and others producing roots either more uniformly over the growing season or in multiple pulses have been observed in 12 temperate tree species [26]. In beech forests from Italy, a bimodal seasonal pattern with two peaks in mid-summer and beginning of the fall in fine root biomass and length were revealed [52,53].
Data on the root seasonal dynamics of Douglas fir are available from the Pacific Northwest only where the species is naturally distributed. In a 2-year study, Tingey et al. [67] observed a single peak of root production during spring/early summer for a low productivity Douglas-fir stand and no seasonal changes-at a high productivity site. Santantonio and Hermann [79] observed a bimodal pattern in six Douglas fir stands over a 3-year period with a high root growth occurring in spring and autumn and low root growth in the summer and winter. The changes in the seasonal patterns from year to year were related to different water regimes (moderately dry to wet) [79]. The pattern and timing of root production revealed by McCormack et al. [26] has appeared to be consistent across years for some species but varied in others. Considering the significant variations among years observed even by controlled studies [80] and the significant differences in biomass/necromass dynamics revealed by our study we believe that an extension and long-term observations are needed in order to reveal the roots growth dynamics of both tree species and their most probable pattern.

4.4. Root Annual Production and Turnover Rates

Fine root annual production and turnover rates have been extensively studied in European beech forests and estimates using Decision Matrix (DM) and Maximum-Minimum (MM) calculation techniques have been recently summarised [46,56], while data for the Douglas fir forests are scarce, mainly available from North America and were estimated by DM formula only [59,79]. The total fine root annual production (0–45 cm) was higher for the beech forests than for the Douglas fir plantations (162.2 g m−2 vs. 117.4 g m−2, estimated by DM method) but almost the same when MM was applied (110 g m−2 vs. 106 g m−2). Our values for fine root annual production in the beech forests were at the lower limit of ranges reported for this tree species across Europe [46,56] and closest to values reported from Italy (29–132 g m−2, 0–30 cm depth, MM method) [52,53], France (165 g m−2 and 77 g m−2 for 0–40 cm depth, using DM and MM method, respectively) [81] and Germany (85 g m−2 using MM method) [55], where climatic conditions were similar to our study. Dry and warm conditions have been associated with lower root biomass and production for other tree species too [82]. The annual fine root production was 140 and 620 g m−2 year−1 in 40 years old low and high productivity Douglas fir stands, respectively [60] and a similar wide-range variation (112 and 514 g m−2 year−1) was found in 32 and 70 years old stands up to 50 cm [59]. In older stands (70–170 years) the fine root production increased substantially (480–650 g m−2 year−1) for wet and dry site, respectively [79].
The mean turnover rates for both, the beech forests and Douglas fir stands, varied in similar ranges and differed according to the calculation method used (1.17 vs. 1.04, DM Bmean; 0.80 vs. 0.73 DM Bmax; 0.81 vs. 0.88 MM Bmean; 0.54 vs. 0.61, MM Bmax). Brunner et al. [46] reviewed the fine root turnover rates from European forests and suggested 0.86 yr−1 and 0.88 yr−1 rates (DM Bmax) to be used in models and carbon emissions reporting for F. sylvatica and P. abies forests respectively, and 1.11 yr−1 for both species when DM Bmean data are used. Our average turnover rates [1.11 yr−1 (DM Bmean) and 0.76 yr−1 (DM Bmax)] obtained for both forest types were closer to mean values suggested for Central and Northern Europe [46] and higher compared to those reported by a few studies from Southern Europe [46,52,53,83]. This could be partly due to drier and warmer climatic conditions and potentially lower decomposition and root turnover rate in Mediterranean regions. A recent research has shown that the mean chronological age of fine roots can vary between tree species from <1 to 3 years (temperate beech and pine forests), which may partly explain the variability observed in the turnover rates [84].

5. Conclusions

The interspecies comparison of selected root traits revealed differences more in the root system distribution (e.g., root mass vertical allocation) rather than in the root system dynamics (e.g., fine roots annual production and turnover). The overall root mass (<10 mm diameter) in 0–45 cm soil depth was significantly higher in the beech forests than the Douglas fir stands, which was mainly attributed to the significantly higher small root mass in the beech forests. More than half of the fine and small roots biomass of the Douglas fir plantations were allocated to the uppermost layer of mineral soil and decreased significantly with depths, while in the beech forests the biomass was more uniformly distributed and decreased gradually with increasing soil depth, which could be partly explained by the local soil conditions. The fine and small roots biomass fluctuations were insignificant as compared to the necromass for which the highest values were observed in the spring, and lowest in summer. A large variation in turnover rates within a tree species and no uniform trend of fine root turnover change with soil depth were observed. The mean values for turnover rates calculated for all studied stands represent well the averaged root turnover rates suggested for forests of Central and Northern Europe.

Supplementary Materials

The following are available online at https://www.mdpi.com/1999-4907/10/12/1123/s1, Table S1. Detailed soil characteristics of studied European beech forests and planted Douglas fir stands, presented for each soil depth. Table S2. Published reference data for fine and small roots biomass, annual production and turnover rates from Douglas fir studies. References to Table S2.

Author Contributions

M.Z. and S.D. conceived and designed the investigation; L.L. and M.Z. performed the field and laboratory work; L.L., M.P.M. and S.L. analysed and visualised the data; L.L., M.P.M. and S.L. wrote the original draft; L.L., M.Z., E.V., S.D., M.P.M. and S.L. reviewed and edited the manuscript.

Funding

The study has been carried out in the framework of the National Science Program “Environmental Protection and Reduction of Risks of Adverse Events and Natural Disasters” approved by the Resolution of the Council of Ministers № 577/17.08.2018 and supported by the Ministry of Education and Science of Bulgaria (Agreement DO-230/06-12-2018).

Acknowledgments

The authors are grateful to: both reviewers for their constructive comments and feedbacks on the manuscript; Ivano Brunner for methodological advices; Tzvetan Zlatanov and Angel Ferezliev, Ivailo Stoyanov and Stanislav Lazarov for their valuable comments and suggestions; François Bochereau (Forest Research, Alice Holt, UK) for soil chemical analyses; Mitko Lozanov and Zdravko Jelyaskov for their assistance during root sampling. The first author thanks BioLink COSTAction FP1305 for providing research grants and for enhancing knowledge exchange and collaboration.

Conflicts of Interest

The authors declare no conflict of interest.

References

  1. Bardgett, R.D.; Mommer, L.; De Vries, F.T. Going underground: Root traits as drivers of ecosystem processes. Trends Ecol. Evol. 2014, 29, 692–699. [Google Scholar] [CrossRef] [PubMed]
  2. Coutts, M.P. Root architecture and tree stability. In Tree Root Systems and Their Mycorrhizas; Springer: Dordrecht, The Netherlands, 1983; pp. 171–188. [Google Scholar]
  3. Erktan, A.; McCormack, M.L.; Roumet, C. Frontiers in root ecology: Recent advances and future challenges. Plant Soil 2018, 424, 1–9. [Google Scholar] [CrossRef]
  4. Coleman, D.C.; Crossley, D.A.; Hendrix, P.F. Fundamentals of Soil Ecology, 2nd ed.; Elsevier Academic Press: Cambridge, MA, USA, 2004; ISBN 9780121797263. [Google Scholar]
  5. Vogt, K.A.; Vogt, D.J.; Bloomfield, J. Analysis of some direct and indirect methods for estimating root biomass and production of forests at an ecosystem level. In Root Demographics and Their Efficiencies in Sustainable Agriculture, Grasslands and Forest Ecosystems; Springer: Dordrecht, The Netherlands, 1998; pp. 687–720. [Google Scholar]
  6. Lauenroth, W.K.; Gill, R. Turnover of Root Systems. In Root Ecology; Springer: Berlin/Heidelberg, Germany, 2003; pp. 61–89. [Google Scholar]
  7. Majdi, H.; Pregitzer, K.; Morén, A.S.; Nylund, J.E.; Ågren, G.I. Measuring fine root turnover in forest ecosystems. Plant Soil 2005, 276, 1–8. [Google Scholar] [CrossRef]
  8. Lukac, M. Fine Root Turnover. In Measuring Roots; Mancuso, S., Ed.; Springer: Berlin/Heidelberg, Germany, 2012; pp. 363–373. [Google Scholar]
  9. Addo-Danso, S.D.; Prescott, C.E.; Smith, A.R. Methods for estimating root biomass and production in forest and woodland ecosystem carbon studies: A review. For. Ecol. Manag. 2016, 359, 332–351. [Google Scholar] [CrossRef]
  10. Persson, H. Fine-root production, mortality and decomposition in forest ecosystems. Vegetatio 1980, 41, 101–109. [Google Scholar] [CrossRef]
  11. Persson, H.A. The distribution and productivity of fine roots in boreal forests. Plant Soil 1983, 71, 87–101. [Google Scholar] [CrossRef]
  12. Makkonen, K.; Helmisaari, H.S. Seasonal and yearly variations of fine-root biomass and necromass in a Scots pine (Pinus sylvestris L.) stand. For. Ecol. Manag. 1998, 102, 283–290. [Google Scholar] [CrossRef]
  13. Helmisaari, H.S.; Makkonen, K.; Kellomäki, S.; Valtonen, E.; Mälkönen, E. Below- and above-ground biomass, production and nitrogen use in Scots pine stands in eastern Finland. For. Ecol. Manag. 2002, 165, 317–326. [Google Scholar] [CrossRef]
  14. Ostonen, I.; Lõhmus, K.; Pajuste, K. Fine root biomass, production and its proportion of NPP in a fertile middle-aged Norway spruce forest: Comparison of soil core and ingrowth core methods. For. Ecol. Manag. 2005, 212, 264–277. [Google Scholar] [CrossRef]
  15. Hendricks, J.; Hendrick, R.; Wilson, C.; Mitchell, R.; Pecot, S.; Guo, D. Assessing the patterns and controls of fine root dynamics: An empirical test and methodological review. J. Ecol. 2006, 94, 40–57. [Google Scholar] [CrossRef]
  16. Brassard, B.W.; Chen, H.Y.H.; Bergeron, Y.; Paré, D. Differences in fine root productivity between mixed- and single-species stands. Funct. Ecol. 2011, 25, 238–246. [Google Scholar] [CrossRef]
  17. Danjon, F.; Stokes, A.; Bakker, M.R. Root Systems of Woody Plants. In Plant Roots: The Hidden Half, 4th ed.; Eshel, A., Beeckman, T., Eds.; CRC Press: Boca Raton, FL, USA, 2013; pp. 29-1–29-26. [Google Scholar]
  18. Bakker, M.R.; Turpault, M.P.; Huet, S.; Nys, C. Root distribution of Fagus sylvatica in a chronosequence in western France. J. For. Res. 2008, 13, 176–184. [Google Scholar] [CrossRef]
  19. Böhm, W. Excavation Methods. In Methods of Studying Root Systems; Springer: Berlin/Heidelberg, Germany, 1979; pp. 5–19. [Google Scholar]
  20. Jackson, D.S.; Jackson, D.S.; Chittenden, J. Estimation of dry matter in Pinus radiata root systems. 1. Individual trees. N. Z. J. For. Sci. 1981, 11, 164–182. [Google Scholar]
  21. Persson, H.; Ahlström, K.; Clemensson-Lindell, A. Nitrogen addition and removal at Gårdsjön—Effects on fine-root growth and fine-root chemistry. For. Ecol. Manag. 1998, 101, 199–205. [Google Scholar] [CrossRef]
  22. Helmisaari, H.S.; Derome, J.; Nojd, P.; Kukkola, M. Fine root biomass in relation to site and stand characteristics in Norway spruce and Scots pine stands. Tree Physiol. 2007, 27, 1493–1504. [Google Scholar] [CrossRef] [Green Version]
  23. Cai, H.; Li, F.; Jin, G. Fine root biomass, production and turnover rates in plantations versus natural forests: Effects of stand characteristics and soil properties. Plant Soil 2019, 436, 463–474. [Google Scholar] [CrossRef]
  24. Pregitzer, K.S. Fine roots of trees—A new perspective. New Phytol. 2002, 154, 267–270. [Google Scholar] [CrossRef] [Green Version]
  25. Atkinson, J.A.; Rasmussen, A.; Traini, R.; Voß, U.; Sturrock, C.; Mooney, S.J.; Wells, D.M.; Bennett, M.J. Branching out in roots: Uncovering form, function, and regulation. Plant Physiol. 2014, 166, 538–550. [Google Scholar] [CrossRef] [Green Version]
  26. McCormack, M.L.; Adams, T.S.; Smithwick, E.A.H.; Eissenstat, D.M. Variability in root production, phenology, and turnover rate among 12 temperate tree species. Ecology 2014, 95, 2224–2235. [Google Scholar] [CrossRef]
  27. Radville, L.; McCormack, M.L.; Post, E.; Eissenstat, D.M. Root phenology in a changing climate. J. Exp. Bot. 2016, 67, 3617–3628. [Google Scholar] [CrossRef] [Green Version]
  28. Freschet, G.T.; Valverde-Barrantes, O.J.; Tucker, C.M.; Craine, J.M.; McCormack, M.L.; Violle, C.; Fort, F.; Blackwood, C.B.; Urban-Mead, K.R.; Iversen, C.M.; et al. Climate, soil and plant functional types as drivers of global fine-root trait variation. J. Ecol. 2017, 105, 1182–1196. [Google Scholar] [CrossRef] [Green Version]
  29. Iversen, C.M.; McCormack, M.L.; Powell, A.S.; Blackwood, C.B.; Freschet, G.T.; Kattge, J.; Roumet, C.; Stover, D.B.; Soudzilovskaia, N.A.; Valverde-Barrantes, O.J.; et al. A global Fine-Root Ecology Database to address below-ground challenges in plant ecology. New Phytol. 2017, 215, 15–26. [Google Scholar] [CrossRef] [PubMed] [Green Version]
  30. Eckhart, T.; Walcher, S.; Hasenauer, H.; van Loo, M. Genetic diversity and adaptive traits of European versus American Douglas-fir seedlings. Eur. J. For. Res. 2017, 136, 811–825. [Google Scholar] [CrossRef] [Green Version]
  31. Schmid, M.; Pautasso, M.; Holdenrieder, O. Ecological consequences of Douglas fir (Pseudotsuga menziesii) cultivation in Europe. Eur. J. For. Res. 2014, 133, 13–29. [Google Scholar] [CrossRef] [Green Version]
  32. Hermann, R.K.; Lavender, D.P. Douglas-fir planted forests. New For. 1999, 17, 53–70. [Google Scholar] [CrossRef]
  33. Vitali, V.; Büntgen, U.; Bauhus, J. Silver fir and Douglas fir are more tolerant to extreme droughts than Norway spruce in south-western Germany. Glob. Chang. Biol. 2017, 23, 5108–5119. [Google Scholar] [CrossRef]
  34. Eckhart, T.; Pötzelsberger, E.; Koeck, R.; Thom, D.; Lair, G.J.; van Loo, M.; Hasenauer, H. Forest stand productivity derived from site conditions: An assessment of old Douglas-fir stands (Pseudotsuga menziesii (Mirb.) Franco var. menziesii) in Central Europe. Ann. For. Sci. 2019, 76, 19. [Google Scholar] [CrossRef] [Green Version]
  35. Forest Europe. State of Europe’s Forests 2015 Report. Available online: https://www.foresteurope.org/docs/fullsoef2015.pdf (accessed on 8 December 2019).
  36. Executive Forest Agency, Ministry of Agriculture and Foods. Distribution of the forested area by tree species and age in 2015. Report. 2016. (in Bulgarian). Available online: http://www.iag.bg/data/docs/otchet2.pdf (accessed on 8 December 2019).
  37. Popov, E.; Hinkov, G.; Velichkov, I.; Stefanova, P. Productivity of Douglas fir plantations in Bulgaria and the necessity for its utilization. For. Sci. 2018, 54, 3–23. [Google Scholar]
  38. Denk, T.; Grimm, G.; Stögerer, K.; Langer, M.; Hemleben, V. The evolutionary history of Fagus in western Eurasia: Evidence from genes, morphology and the fossil record. Plant Syst. Evol. 2002, 232, 213–236. [Google Scholar] [CrossRef]
  39. Packham, J.R.; Thomas, P.A.; Atkinson, M.D.; Degen, T. Biological Flora of the British Isles: Fagus sylvatica. J. Ecol. 2012, 100, 1557–1608. [Google Scholar] [CrossRef]
  40. Kattge, J.; Díaz, S.; Lavorel, S.; Prentice, I.C.; Leadley, P.; Bönisch, G.; Garnier, E.; Westoby, M.; Reich, P.B.; Wright, I.J.; et al. TRY—A global database of plant traits. Glob. Chang. Biol. 2011, 17, 2905–2935. [Google Scholar] [CrossRef]
  41. Ferezliev, A. Relationship between particular dendrobiometrical indicators of natural European beech (Fagus sylvatica L.) dendrocenoses in Central Balkan Range. Folia Oecol. 2017, 44, 69–77. [Google Scholar] [CrossRef] [Green Version]
  42. Zhiyanski, M.; Glushkova, M.; Kirova, L. Quantitative and qualitative features of soil humus in mountain treeline ecosystems. Silva Balc. 2017, 18, 5–23. [Google Scholar]
  43. Ferezliev, A.; Mavrevski, R.; Delkov, A. Correlation between average and dominant height of middle-aged Douglas fir plantations in the North-West Rhodopes. Silva Balc. 2018, 19, 13–26. [Google Scholar]
  44. Schuurman, J.J.; Goedewaagen, M.A.J. Methods for the Examination of Root Systems and Roots; Centre for Agricultural Publishing and Documentation: Wageningen, The Netherlands, 1971. [Google Scholar]
  45. Persson, H. Root Dynamics in a Young Scots Pine Stand in Central Sweden. Oikos 1978, 30, 508. [Google Scholar] [CrossRef]
  46. Brunner, I.; Bakker, M.R.; Björk, R.G.; Hirano, Y.; Lukac, M.; Aranda, X.; Børja, I.; Eldhuset, T.D.; Helmisaari, H.S.; Jourdan, C.; et al. Fine-root turnover rates of European forests revisited: An analysis of data from sequential coring and ingrowth cores. Plant Soil 2013, 362, 357–372. [Google Scholar] [CrossRef]
  47. Fairley, R.; Alexander, I. Methods of calculating fine root production in forests. In Ecological Interactions in Soil: Plants, Microbes and Animals; Special Publication Number 4 of the British Ecological Society; Fiter, A.H., Ed.; Blackwell Scientific: Oxford, UK, 1985; pp. 37–42. ISBN 0632013869. [Google Scholar]
  48. McClaugherty, C.A.; Aber, J.D.; Melillo, J.M. The role of fine roots in the organic matter and nitrogen budgets of two forested ecosystems. Ecology 1982, 63, 1481–1490. [Google Scholar] [CrossRef] [Green Version]
  49. Gill, R.A.; Jackson, R.B. Global patterns of root turnover for terrestrial ecosystems. New Phytol. 2000, 147, 13–31. [Google Scholar] [CrossRef]
  50. Kucbel, S.; Jaloviar, P.; Špišák, J. Quantity, vertical distribution and morphology of fine roots in Norway spruce stands with different stem density. Plant Root 2011, 5, 46–55. [Google Scholar] [CrossRef]
  51. Finér, L.; Helmisaari, H.S.; Lõhmus, K.; Majdi, H.; Brunner, I.; Børja, I.; Eldhuset, T.; Godbold, D.; Grebenc, T.; Konôpka, B.; et al. Variation in fine root biomass of three European tree species: Beech (Fagus sylvatica L.), Norway spruce (Picea abies L. Karst.), and Scots pine (Pinus sylvestris L.). Plant Biosyst. 2007, 141, 394–405. [Google Scholar] [CrossRef]
  52. Montagnoli, A.; Terzaghi, M.; Di Iorio, A.; Scippa, G.S.; Chiatante, D. Fine-root seasonal pattern, production and turnover rate of European beech (Fagus sylvatica L.) stands in Italy Prealps: Possible implications of coppice conversion to high forest. Plant Biosyst. 2012, 146, 1012–1022. [Google Scholar] [CrossRef] [Green Version]
  53. Montagnoli, A.; Di Iorio, A.; Terzaghi, M.; Trupiano, D.; Scippa, G.S.; Chiatante, D. Influence of soil temperature and water content on fine-root seasonal growth of European beech natural forest in Southern Alps, Italy. Eur. J. For. Res. 2014, 133, 957–968. [Google Scholar] [CrossRef] [Green Version]
  54. Wu, K. Fine Root Production and Turnover and Its Contribution to Nutrient Cycling in Two Beech (Fagus sylvatica L.) Forest Ecosystems. Ber. Forsch. Zent. Waldökosyst. Reihe A 2000, 170, 1–130. [Google Scholar]
  55. Claus, A.; George, E. Effect of stand age on fine-root biomass and biomass distribution in three European forest chronosequences. Can. J. For. Res. 2005, 35, 1617–1625. [Google Scholar] [CrossRef]
  56. Finér, L.; Ohashi, M.; Noguchi, K.; Hirano, Y. Fine root production and turnover in forest ecosystems in relation to stand and environmental characteristics. For. Ecol. Manag. 2011, 262, 2008–2023. [Google Scholar] [CrossRef]
  57. Hermann, R.; Lavender, D. Pseudotsuga menziesii (Mirb.) Franco Douglas-fir. In Silvics of North America; United States Department of Agriculture: Washington, DC, USA, 1990; Volume 1, pp. 527–554. [Google Scholar]
  58. Olsthoorn, A. Fine root density and root biomass of two Douglas-fir stands on sandy soils in The Netherlands. 1. Root biomass in early summer. Neth. J. Agric. Sci. 1991, 39, 49–60. [Google Scholar]
  59. Kurz, W.A. Net Primary Production, Production Allocation, and Foliage Efficiency in Second Growth Douglas-Fir Stands with Differing Site Quality. Ph.D. Thesis, University of British Columbia, Vancouver, BC, Canada, 1989. [Google Scholar]
  60. Keyes, M.R.; Grier, C.C. Above- and below-ground net production in 40-year-old Douglas-fir stands on low and high productivity sites. Can. J. For. Res. 1981, 11, 599–605. [Google Scholar] [CrossRef]
  61. Hendriks, C.; Bianchi, F. Root density and root biomass in pure and mixed forest stands of Douglas-fir and Beech. Neth. J. Agric. Sci. 1995, 43, 321–331. [Google Scholar]
  62. Leuschner, C.; Hertel, D.; Coners, H.; Büttner, V. Root competition between beech and oak: A hypothesis. Oecologia 2001, 126, 276–284. [Google Scholar] [CrossRef]
  63. Curt, T.; Prévosto, B. Root biomass and rooting profile of naturally regenerated beech in mid-elevation Scots pine woodlands. Plant Ecol. 2003, 167, 269–282. [Google Scholar] [CrossRef]
  64. Konôpka, B. Differences in fine root traits between Norway spruce (Picea abies [L.] Karst.) and European beech (Fagus sylvatica L.)—A case study in the Kysucké Beskydy Mts. J. For. Sci. 2009, 55, 556–566. [Google Scholar] [CrossRef] [Green Version]
  65. Bolte, A.; Villanueva, I. Interspecific competition impacts on the morphology and distribution of fine roots in European beech (Fagus sylvatica L.) and Norway spruce (Picea abies (L.) Karst.). Eur. J. For. Res. 2006, 125, 15–26. [Google Scholar] [CrossRef]
  66. Rust, S.; Savill, P.S. The root systems of Fraxinus excelsior and Fagus sylvatica and their competitive relationships. Forestry 2000, 73, 499–508. [Google Scholar] [CrossRef]
  67. Tingey, D.T.; Phillips, D.L.; Johnson, M.G.; Rygiewicz, P.T.; Beedlow, P.A.; Hogsett, W.E. Estimates of Douglas-fir fine root production and mortality from minirhizotrons. For. Ecol. Manag. 2005, 204, 359–370. [Google Scholar] [CrossRef]
  68. Moser, B.; Bachofen, C.; Müller, J.D.; Metslaid, M.; Wohlgemuth, T. Root architecture might account for contrasting establishment success of Pseudotsuga menziesii var. menziesii and Pinus sylvestris in Central Europe under dry conditions. Ann. For. Sci. 2016, 73, 959–970. [Google Scholar]
  69. Hertel, D.; Strecker, T.; Müller-Haubold, H.; Leuschner, C. Fine root biomass and dynamics in beech forests across a precipitation gradient—Is optimal resource partitioning theory applicable to water-limited mature trees? J. Ecol. 2013, 101, 1183–1200. [Google Scholar] [CrossRef]
  70. Forde, B.; Lorenzo, H. The nutritional control of root development. Plant Soil 2001, 232, 51–68. [Google Scholar] [CrossRef]
  71. Grossman, J.D.; Rice, K.J. Evolution of root plasticity responses to variation in soil nutrient distribution and concentration. Evol. Appl. 2012, 5, 850–857. [Google Scholar] [CrossRef]
  72. Nisbet, T. Water Use by Trees. Forestry Commission Information Note 65; Forestry Commission: Edinburgh, UK, 2005.
  73. Thomas, F.; Bögelein, R.; Werner, W. Interaction between Douglas fir and European beech: Investigations in pure and mixed stands. Forstarch. Forstwiss. Fachz. 2015, 86, 83–91. [Google Scholar]
  74. Kubisch, P.; Hertel, D.; Leuschner, C. Fine root productivity and turnover of ectomycorrhizal and arbuscular mycorrhizal tree species in a temperate broad-leaved mixed forest. Front. Plant Sci. 2016, 7, 1233. [Google Scholar] [CrossRef] [Green Version]
  75. Richter, A.K. Fine Root Growth and Vitality of European Beech in Acid Forest Soils with a Low Base Saturation. Ph.D. Thesis, Swiss Federal Institute Of Technology Zurich, Zurich, Switzerland, 2007. [Google Scholar]
  76. Harris, W.; Santantonio, D.; McGinty, D. The dynamic belowground ecosystem. In Forests: Fresh Perspectives from Ecosystem Analysis, Proceedings of the 40th Annual Biology Colloquium, Corvallis, OR, USA, 27–28 April 1979; Richard, H.W., Ed.; Oregon State University: Corvallis, OR, USA, 1980; pp. 119–129. [Google Scholar]
  77. Burton, A.J.; Pregitzer, K.S.; Hendrick, R.L. Relationships between fine root dynamics and nitrogen availability in Michigan northern hardwood forests. Oecologia 2000, 125, 389–399. [Google Scholar] [CrossRef] [PubMed]
  78. López, B.; Sabaté, S.; Gracia, C.A. Annual and seasonal changes in fine root biomass of a Quercus ilex L. forest. Plant Soil 2001, 230, 125–134. [Google Scholar] [CrossRef]
  79. Santantonio, D.; Hermann, R.K. Standing crop, production, and turnover of fine roots on dry, moderate, and wet sites of mature Douglas-fir in western Oregon. Ann. Des. Sci. For. 1985, 42, 113–142. [Google Scholar] [CrossRef] [Green Version]
  80. Joslin, J.; Wolfe, M.; Hanson, P. Effects of altered water regimes on forest root systems. New Phytol. 2000, 147, 117–129. [Google Scholar] [CrossRef]
  81. Stober, C.; George, E.; Persson, H. Root Growth and Response to Nitrogen. In Carbon and Nitrogen Cycling in European Forest Ecosystems. Ecological Studies Analysis and Synthesis; Schulze, E.D., Ed.; Springer: Berlin/Heidelberg, Germany, 2000; pp. 99–121. [Google Scholar]
  82. Vanguelova, E.I.; Nortcliff, S.; Moffat, A.J.; Kennedy, F. Morphology, biomass and nutrient status of fine roots of Scots pine (Pinus sylvestris) as influenced by seasonal fluctuations in soil moisture and soil solution chemistry. Plant Soil 2005, 270, 233–247. [Google Scholar] [CrossRef]
  83. Zhiyanski, M. Fine-root production and turnover based on 2-yr of sequential coring in four forest species in Bulgaria. Silva Balc. 2015, 16, 34–49. [Google Scholar]
  84. Solly, E.F.; Brunner, I.; Helmisaari, H.S.; Herzog, C.; Leppälammi-Kujansuu, J.; Schöning, I.; Schrumpf, M.; Schweingruber, F.H.; Trumbore, S.E.; Hagedorn, F. Unravelling the age of fine roots of temperate and boreal forests. Nat. Commun. 2018, 9, 3006. [Google Scholar] [CrossRef]
Figure 1. Overall root mass (roots < 10 mm diameter, 0–45 cm, n = 84) (A) and total root mass (biomass and necromass, 0–45 cm) of different diameter classes: fine (0–2 mm, n = 84) (B), small (2–5 mm, n = 84) (C) and coarse (5–10 mm, n = 84) (D) roots in the studied plots. Different letters above bars indicate a significant difference among sampling plots as assessed by One-Way ANOVA followed by a Bonferroni post-hoc test. The test statistics were calculated on the basis of Box–Cox-transformed values; original scores on the Y-axis of the figure are presented. Vertical bars denote 0.95 confidence intervals for each sampling plot.
Forests 10 01123 g001
Figure 2. Vertical distribution of fine (0–2 mm) (A,B) and small (2–5 mm) (C,D) roots biomass in two beech (Fs1 and Fs2, n = 126) and two Douglas fir (Pm1 and Pm2, n = 126) plots. Different letters above the bars indicate a significant difference among soil depths and sampling plots as assessed by Factorial ANOVA followed by a Bonferroni post-hoc test. The test statistics were calculated on the basis of Box–Cox-transformed values; original scores on the Y-axis of the figure are presented. Vertical bars denote 0.95 confidence intervals within each soil depth.
Forests 10 01123 g002
Figure 3. Temporal dynamics of fine total root biomass (A,C) and necromass (B,D) for both tree species. Different letters below box-plots indicate a significant difference (p < 0.05) among sampling dates as assessed by Friedman ANOVA multiple comparison test followed by a Wilcoxon matched pair test.
Forests 10 01123 g003
Figure 4. Temporal dynamics of small total root biomass (A,C) and necromass (B,D) in both tree species. Different letters below box-plots indicate a significant difference (p < 0.05) among sampling dates as assessed by Friedman ANOVA multiple comparison test followed by a Wilcoxon matched pair test.
Forests 10 01123 g004
Table 1. Site and sampling plots description.
Tree SpeciesFagus sylvaticaPseudotsuga menziezii
Sampling plot abbreviationFs 1Fs 2Pm 1Pm 2
Geographical regionCentral Balkan MountainsRhodope Mountains
GPS coordinates42°47′ 4.47″ N
24°36′ 53.16″ E
42°47′ 5.21″ N
24°36′ 33.39″ E
42°02′ 28.19″ N
23°56′ 20.76″ E
42°02′ 30.32″ N
23°56′ 27.05″ E
Mean altitude (m)1330132511001050
Mean annual temperature (°C)6.77.5
Annual precipitation (mm)1240677
Forests compositionBeech 100%Douglas fir 87% Scots pine 13%
Mean stand age in 2015 (years)64473747
Stand density (trees/ha)209027006611700
Mean tree height (m)17.216.125.130.8
Mean diameter at breast height (Dbh in cm)14.69.124.123.0
Soil type (WRB, 2014)Dystric CambisolsDystric Cambisols
pH H2O 0–45 cm4.57 ± 0.144.41 ± 0.085.15 ± 0.105.22 ± 0.15
pH CaCl2 0–45 cm4.07 ± 0.103.91 ± 0.074.45 ± 0.144.48 ± 0.14
Total nitrogen % 0–45 cm0.47 ± 0.120.52 ± 0.090.08 ± 0.030.05 ± 0.01
Total carbon % 0–45 cm5.42 ± 1.736.00 ± 1.171.47 ± 0.530.80 ± 0.15
Soil bulk density (g/cm3)0.78 ± 0.080.71 ± 0.06 1.08 ± 0.051.22 ± 0.04
Table 2. Total root biomass/necromass and the vertical distribution of fine, small and coarse roots biomass/necromass (g m−2) per each diameter class and soil depth (0–45 cm, 0–15, 15–30, 30–45 cm) in two beech forests and two Douglas fir plantations. Data presented as mean ± standard error.
Tree Species/Sampling PlotDepthFine Roots (0–2 mm)Small Roots (2–5 mm)Coarse Roots (5–10 mm)
BiomassNecromassBiomassNecromassBiomassNecromass
Beech
Fs10–45165.2 ± 5.510.8 ± 3.2282.1 ± 18.432.9 ± 10.1153.2 ± 16.714.2 ± 5.1
0–1562.5 ± 3.05.2 ± 1.592.2 ± 7.620.4 ± 5.247.6 ± 8.41.7 ± 5.1
15–3055.0 ± 3.82.5 ± 0.796.0 ± 12.28.2 ± 1.964.4 ± 24.60.9 ± 0.9
30–4547.7 ± 3.23.1 ± 1.693.9 ± 10.04.2 ± 0.741.3 ± 14.21.5 ± 1.5
Fs20–45127.5 ± 5.38.2 ± 1.9171.6 ± 10.516.0 ± 5.5118.6 ± 29.97.7 ± 3.2
0–1547.2 ± 2.74.0 ± 1.158.7 ± 4.35.9 ± 1.624.0 ± 9.65.2 ± 2.8
15–3045.7 ± 3.42.2 ± 0.757.8 ± 5.37.2 ± 1.954.7 ± 18.91.2 ± 0.8
30–4534.6 ± 4.32.0 ± 0.655.0 ± 7.12.9 ± 0.739.9 ± 7.81.3 ± 1.0
Douglas fir
Pm10–45145.5 ± 6.641.3 ± 6.9164.1 ± 28.257.8 ± 23.3132.5 ± 31.537.7 ± 9.0
0–1582.9 ± 6.020.7 ± 3.290.4 ± 7.320.9 ± 2.142.0 ± 11.29.9 ± 3.9
15–3037.5 ± 3.510.8 ± 1.849.9 ± 7.817.0 ± 3.844.9 ± 9.118.4 ± 5.7
30–4525.1 ± 1.69.8 ± 2.523.8 ± 3.99.9 ± 5.445.5 ± 17.69.4 ± 4.6
Pm20–45124.3 ± 5.013.1 ± 3.7125.2 ± 13.311.1 ± 6.8126.0 ± 25.03.2 ± 2.1
0–1575.8 ± 3.88.3 ± 2.261.9 ± 9.45.0 ± 1.646.0 ± 21.91.4 ± 1.4
15–3031.3 ± 1.63.8 ± 1.638.2 ± 6.13.2 ± 0.733.7 ± 9.3na
30–4517.1 ± 1.11.0 ± 0.325.1 ± 3.42.8 ± 0.646.3 ± 14.71.8 ± 1.8
Table 3. Annual production (Pa) and turnover rates (TR) of fine and small roots diameter classes presented by sampling plots and soil depths calculated using the Decision Matrix (DM) and the Maximum-Minimum (MM) methods and using mean (Bmean) and maximal (Bmax) values for biomass.
Fine Roots (≤2 mm)Small Roots (2–5 mm)
Tree Species/Sampling Plot DMMMDMMM
PaTRPaTRPaTR
Depth BmeanBmax BmeanBmax
(cm)(g m−2 yr−1)(yr−1)(yr−1)(g m−2 yr−1)(yr−1)(yr−1)(g m−2 yr-1)(yr−1)
Beech
Fs10–451701.070.781140.710.52478339
0–15540.810.63370.580.45166131
15–30591.050.77430.770.5714493
30–45571.340.94340.790.53169116
Fs20–451551.280.811060.900.56307230
0–15631.320.94300.660.478453
15–30380.900.55390.960.5612199
30–45541.620.95361.090.6510178
Douglas fir
Pm10–451341.100.771130.850.59345208
0–15630.890.65550.710.5214685
15–30401.090.73370.990.6313784
30–45311.310.92210.870.626138
Pm20–451010.980.68990.910.62297198
0–15480.640.51500.680.5413586
15–30321.120.71311.000.6210368
30–45201.170.81171.050.715944

