Radial Growth Rate Responses of Western Juniper (Juniperus occidentalis Hook.) to Atmospheric and Climatic Changes: A Longitudinal Study from Central Oregon, USA

Abstract
:1. Introduction
2. Materials and Methods
2.1. Field Sampling
2.2. Laboratory Processing and Chronology Development
2.3. Statistical Analyses
3. Results
4. Discussion
5. Conclusions
Author Contributions
Funding
Acknowledgments
Conflicts of Interest
References
- The Gymnosperm Database. Available online: https://www.conifers.org/cu/Juniperus_occidentalis.php (accessed on 9 March 2019).
- Burkhardt, J.W.; Tisdale, E.W. Nature and successional status of western juniper vegetation in Idaho. J. Range Manag. 1969, 1, 264–270. [Google Scholar] [CrossRef]
- Burkhardt, J.W.; Tisdale, E.W. Causes of juniper invasion in southwestern Idaho. Ecology 1976, 57, 472–484. [Google Scholar] [CrossRef]
- Caraher, D.L. The spread of western juniper in central Oregon. In Proceedings of the Western Juniper Ecology and Management Workshop; General Technical Report PNW-74; USDA Forest Service: Portland, OR, USA, 1978. [Google Scholar]
- Eddleman, L.E. General Technical Report INT-US Department of Agriculture: Establishment and Stand Development of Western Juniper in Central Oregon; Forest Service, Intermountain Research Station: Ogden, UT, USA, 1987.
- Miller, R.F.; Rose, J.A. Historic expansion of Juniperus occidentalis (western juniper) in southeastern Oregon. Great Basin Nat. 1995, 55, 37–45. [Google Scholar]
- Soulé, P.T.; Knapp, P.A. Western juniper expansion on adjacent disturbed and near-relict sites. J. Range Manag. 1999, 1, 525–533. [Google Scholar] [CrossRef] [Green Version]
- Sankey, T.T.; Germino, M.J. Assessment of juniper encroachment with the use of satellite imagery and geospatial data. Rangel. Ecol. Manag. 2008, 61, 412–418. [Google Scholar] [CrossRef]
- Rowland, M.M.; Suring, L.H.; Tausch, R.J.; Geer, S.; Wisdom, M.J. Dynamics of Western Juniper Woodland Expansion into Sagebrush Communities in Central Oregon, Natural Resources and Environmental Issues. In Proceedings of the 15th Wildl and Shrub Symposium, Bozeman, MT, USA, 17–19 June 2008. [Google Scholar]
- Campbell, J.L.; Kennedy, R.E.; Cohen, W.B.; Miller, R.F. Assessing the carbon consequences of western juniper (Juniperus occidentalis) encroachment across Oregon, USA. Rangel. Ecol. Manag. 2012, 65, 223–231. [Google Scholar] [CrossRef] [Green Version]
- Miller, R.F.; Svejcar, T.J.; Rose, J.A. Impacts of western juniper on plant community composition and structure. Rangel. Ecol. Manag. 2000, 53, 574–585. [Google Scholar] [CrossRef]
- Miller, R.F.; Bates, J.D.; Svejcar, A.J.; Pierson, F.B., Jr.; Eddleman, L.E. Biology, Ecology, and Management of Western Juniper (Juniperus Occidentalis); Oregon State University Agricultural Experiment Station: Corvallis, OR, USA, 2005. [Google Scholar]
- Petersen, S.L.; Stringham, T.K. Infiltration, runoff, and sediment yield in response to western juniper encroachment in southeast Oregon. Rangel. Ecol. Manag. 2008, 61, 74–81. [Google Scholar] [CrossRef]
- Belsky, A.J. Western juniper expansion: Is it a threat to arid northwestern ecosystems? J. Range Manag. 1996, 1, 53–59. [Google Scholar] [CrossRef]
- Ahlström, A.; Raupach, M.R.; Schurgers, G.; Smith, B.; Arneth, A.; Jung, M.; Reichstein, M.; Canadell, J.G.; Friedlingstein, P.; Jain, A.K.; et al. The dominant role of semi-arid ecosystems in the trend and variability of the land CO2 sink. Science 2015, 348, 895–899. [Google Scholar] [CrossRef] [Green Version]
- Poulter, B.; Frank, D.; Ciais, P.; Myneni, R.B.; Andela, N.; Bi, J.; Broquet, G.; Canadell, J.G.; Chevallier, F.; Liu, Y.Y.; et al. Contribution of semi-arid ecosystems to interannual variability of the global carbon cycle. Nature 2014, 509, 600–603. [Google Scholar] [CrossRef] [PubMed] [Green Version]
- Young, J.A.; Evans, R.A. Demography and fire history of a western juniper stand. Rangel. Ecol. Manag. 1981, 34, 501–506. [Google Scholar] [CrossRef]
- Soulé, P.T.; Knapp, P.A.; Grissino-Mayer, H.D. Human agency, environmental drivers, and western juniper establishment during the late Holocene. Ecol. Appl. 2004, 14, 96–112. [Google Scholar] [CrossRef]
- Miller, R.F.; Rose, J.A. Fire history and western juniper encroachment in sagebrush steppe. J. Range Manag. 1999, 52, 550–559. [Google Scholar] [CrossRef]
- Knapp, P.A.; Soulé, P.T. Vegetation change and the role of atmospheric CO2 enrichment on a relict site in central Oregon: 1960–1994. Ann. Assoc. Am. Geogr. 1996, 86, 387–411. [Google Scholar] [CrossRef] [Green Version]
- Knapp, P.A.; Soulé, P.T.; Grissino-Mayer, H.D. Detecting potential regional effects of increased atmospheric CO2 on growth rates of western juniper. Glob. Chang. Biol. 2001, 7, 903–917. [Google Scholar] [CrossRef]
- Tognetti, R.; Longobucco, A.; Miglietta, F.; Raschi, A. Transpiration and stomatal behaviour of Quercus ilex plants during the summer in a Mediterranean carbon dioxide spring. Plant Cell Environ. 1998, 21, 613–622. [Google Scholar] [CrossRef]
- Wullschleger, S.D.; Tschaplinski, T.J.; Norby, R.J. Plant water relations at elevated CO2-implications for water-limited environments. Plant Cell Environ. 2002, 25, 319–331. [Google Scholar] [CrossRef] [Green Version]
- Knapp, P.A.; Soulé, P.T.; Grissino-Mayer, H.D. Post-drought growth responses of western Juniper (Juniperus occidentalis var. occidentalis) in central Oregon. Geophys. Res. Lett. 2001, 28, 2657–2660. [Google Scholar] [CrossRef] [Green Version]
- Keenan, T.F.; Hollinger, D.Y.; Bohrer, G.; Dragoni, D.; Munger, J.W.; Schmid, H.P.; Richardson, A.D. Increase in forest water-use efficiency as atmospheric carbon dioxide concentrations rise. Nature 2013, 499, 324–327. [Google Scholar] [CrossRef]
- Palmer, W.C. Meteorologic Drought; Office of Climatology U.S. Weather Bureau: Washington, DC, USA, 1965.
- United States Drought Monitor. Available online: https://droughtmonitor.unl.edu (accessed on 9 March 2019).
- Rupp, D.E.; Abatzoglou, J.T.; Mote, P.W. Projections of 21st century climate of the Columbia River Basin. Clim. Dyn. 2017, 49, 1783–1799. [Google Scholar] [CrossRef]
- Dalton, M.M.; Dello, K.D.; Hawkins, L.; Mote, P.W.; Rupp, D.E. The Third Oregon Climate Assessment Report; Oregon Climate Change Research Institute, College of Earth, Ocean and Atmospheric Sciences, Oregon State University: Corvallis, OR, USA, 2017. [Google Scholar]
- Koutavas, A. CO2 fertilization and enhanced drought resistance in Greek firs from Cephalonia Island, Greece. Glob. Chang. Biol. 2013, 19, 529–539. [Google Scholar] [CrossRef] [PubMed]
- Allen, C.D.; Breshears, D.D.; McDowell, N.G. On underestimation of global vulnerability to tree mortality and forest die-off from hotter drought in the Anthropocene. Ecosphere 2015, 6, 1–55. [Google Scholar] [CrossRef]
- Knapp, P.A.; Soulé, P.T. Use of atmospheric CO2-sensitive trees may influence dendroclimatic reconstructions. Geophys. Res. Lett. 2008, 35. [Google Scholar] [CrossRef] [Green Version]
- Pacific Northwest Interagency Natural Areas Network. Available online: http://www.fsl.orst.edu/rna/ (accessed on 9 March 2019).
- Duchesne, L.; Houle, D.; Ouimet, R.; Caldwell, L.; Gloor, M.; Brienen, R. Large apparent growth increases in boreal forests inferred from tree-rings are an artefact of sampling biases. Sci. Rep. 2019, 9, 6832–6840. [Google Scholar] [CrossRef] [PubMed]
- Halvorson, R. Western juniper (Juniperus occidentalis). Kalmiopsis 2013, 20, 25–33. [Google Scholar]
- Phillips, N.G.; Buckley, T.N.; Tissue, D.T. Capacity of old trees to respond to environmental change. J. Integr. Plant Biol. 2008, 50, 1355–1364. [Google Scholar] [CrossRef] [Green Version]
- Knapp, P.A.; Soulé, P.T. Increasing water-use efficiency and age-specific growth responses of old-growth ponderosa pine trees in the Northern Rockies. Glob. Chang. Biol. 2011, 17, 631–641. [Google Scholar] [CrossRef]
- Camarero, J.J.; Gazol, A.; Galván, J.D.; Sangüesa-Barreda, G.; Gutiérrez, E. Disparate effects of global-change drivers on mountain conifer forests: Warming-induced growth enhancement in young trees vs. CO2 fertilization in old trees from wet sites. Glob. Chang. Biol. 2015, 21, 738–749. [Google Scholar] [CrossRef] [Green Version]
- Yamaguchi, D.K. A simple method for cross-dating increment cores from living trees. Can. J. For. Res. 1991, 21, 414–416. [Google Scholar] [CrossRef]
- Regent Instruments Canada, Inc. WINDENDRO for Tree-Ring Analysis; Regent Instruments Canada, Inc.: Nepean, ON, Canada, 2011. [Google Scholar]
- Holmes, R.L. Computer-assisted quality control in tree-ring dating and measurement. Tree-Ring Bull. 1983, 43, 69–78. [Google Scholar]
- Cook, E.R.; Holmes, R.L. ARSTAN: Chronology development. In The International Tree-Ring Data Bank Program Library, Version 21 User’s Manual; University of Arizona Laboratory of Tree-Ring Research: Tucson, Arizona, 1997; pp. 75–92. [Google Scholar]
- Keim, B.D.; Wilson, A.M.; Wake, C.P.; Huntington, T.G. Are there spurious temperature trends in the United States Climate Division database? Geophys. Res. Lett. 2003, 30. [Google Scholar] [CrossRef] [Green Version]
- Graumlich, L.J. Subalpine tree growth, climate, and increasing CO2: An assessment of recent growth trends. Ecology 1991, 72, 1–11. [Google Scholar] [CrossRef]
- Wang, G.; Chhin, S.; Bauerle, W.L. Effect of natural atmospheric CO2 fertilization suggested by open-grown white spruce in a dry environment. Glob. Chang. Biol. 2006, 12, 601–610. [Google Scholar] [CrossRef]
- Biondi, F.; Waikul, K. DENDROCLIM2002: A C++ program for statistical calibration of climate signals in tree-ring chronologies. Comput. Geosci. 2004, 30, 303–311. [Google Scholar] [CrossRef]
- Fritts, H.C. Tree Rings and Climate; Elsevier: Amsterdam, The Netherlands, 2012. [Google Scholar]
- Knutson, K.C.; Pyke, D.A. Western juniper and ponderosa pine ecotonal climate–growth relationships across landscape gradients in southern Oregon. Can. J. For. Res. 2008, 38, 3021–3032. [Google Scholar] [CrossRef] [Green Version]
- Peñuelas, J.; Canadell, J.G.; Ogaya, R. Increased water-use efficiency during the 20th century did not translate into enhanced tree growth. Glob. Ecol. Biogeogr. 2011, 20, 597–608. [Google Scholar] [CrossRef]
- Eamus, D. The interaction of rising CO2 and temperatures with water use efficiency. Plant Cell Environ. 1991, 14, 843–852. [Google Scholar]
- LaMarche, V.C.; Graybill, D.A.; Fritts, H.C.; Rose, M.R. Increasing atmospheric carbon dioxide: Tree ring evidence for growth enhancement in natural vegetation. Science 1984, 225, 1019–1021. [Google Scholar] [CrossRef]
- Graybill, D.A.; Idso, S.B. Detecting the aerial fertilization effect of atmospheric CO2 enrichment in tree-ring chronologies. Glob. Biogeochem. Cycles 1993, 7, 81–95. [Google Scholar] [CrossRef] [Green Version]
- Bunn, A.G.; Lawrence, R.L.; Bellante, G.J.; Waggoner, L.A.; Graumlich, L.J. Spatial variation in distribution and growth patterns of old growth strip-bark pines. Arct. Antarct. Alp. Res. 2003, 35, 323–330. [Google Scholar] [CrossRef]
- Soule’, P.T.; Knapp, P.A. Radial growth rate increases in naturally-occurring ponderosa pine trees: A late 20th century CO2 fertilization effect? New Phytol. 2006, 171, 379–390. [Google Scholar] [CrossRef] [PubMed]
- Voelker, S.L.; Muzika, R.M.; Guyette, R.P.; Stambaugh, M.C. Historical CO2 growth enhancement declines with age in Quercus and Pinus. Ecol. Monogr. 2006, 76, 549–564. [Google Scholar] [CrossRef]
- Battipaglia, G.; Saurer, M.; Cherubini, P.; Calfapietra, C.; McCarthy, H.R.; Norby, R.J.; Francesca Cotrufo, M. Elevated CO2 increases tree-level intrinsic water use efficiency: Insights from carbon and oxygen isotope analyses in tree rings across three forest FACE sites. New Phytol. 2013, 197, 544–554. [Google Scholar] [CrossRef] [PubMed] [Green Version]
- Giammarchi, F.; Cherubini, P.; Pretzsch, H.; Tonon, G. The increase of atmospheric CO2 affects growth potential and intrinsic water-use efficiency of Norway spruce forests: Insights from a multi-stable isotope analysis in tree rings of two Alpine chronosequences. Trees 2017, 31, 503–515. [Google Scholar] [CrossRef]
- Huang, R.; Zhu, H.; Liu, X.; Liang, E.; Grießinger, J.; Wu, G.; Li, X.; Bräuning, A. Does increasing intrinsic water use efficiency (iWUE) stimulate tree growth at natural alpine timberline on the southeastern Tibetan Plateau? Glob. Planet. Chang. 2017, 148, 217–226. [Google Scholar] [CrossRef]
- Gedalof, Z.E.; Berg, A.A. Tree ring evidence for limited direct CO2 fertilization of forests over the 20th century. Glob. Biogeochem. Cycles 2010, 24. [Google Scholar] [CrossRef]
- Silva, L.C.; Anand, M. Probing for the influence of atmospheric CO2 and climate change on forest ecosystems across biomes. Glob. Ecol. Biogeogr. 2013, 22, 83–92. [Google Scholar] [CrossRef]
- Giguère-Croteau, C.; Boucher, É.; Bergeron, Y.; Girardin, M.P.; Drobyshev, I.; Silva, L.C.; Hélie, J.F.; Garneau, M. North America’s oldest boreal trees are more efficient water users due to increased [CO2], but do not grow faster. Proc. Natl. Acad. Sci. USA 2019, 116, 2749–2754. [Google Scholar] [CrossRef] [Green Version]
- Linares, J.C.; Camarero, J.J. From pattern to process: Linking intrinsic water-use efficiency to drought-induced forest decline. Glob. Chang. Biol. 2012, 18, 1000–1015. [Google Scholar] [CrossRef]
- Way, D.A. Will rising CO2 and temperatures exacerbate the vulnerability of trees to drought? Tree Physiol. 2013, 33, 775–778. [Google Scholar] [CrossRef] [PubMed] [Green Version]


| Study | #Samples | Interseries Correlation | Mean Sensitivity | Mean Length of Chronology (years) | r-Value between Sites (1905–2017) | |||
|---|---|---|---|---|---|---|---|---|
| Site | HRR | IRR | QRJ | PBR | ||||
| HRR | 33 | 0.87 | 0.59 | 178.9 | - | 0.75 * | 0.8 * | 0.76 * |
| IRR | 32 | 0.85 | 0.6 | 140.9 | - | 0.68 * | 0.71 * | |
| QRJ | 30 | 0.86 | 0.66 | 147.2 | - | 0.8 * | ||
| PBR | 30 | 0.8 | 0.72 | 169.2 | - | |||
| COMBO | 125 | 0.78 | 0.64 | 159.2 | ||||
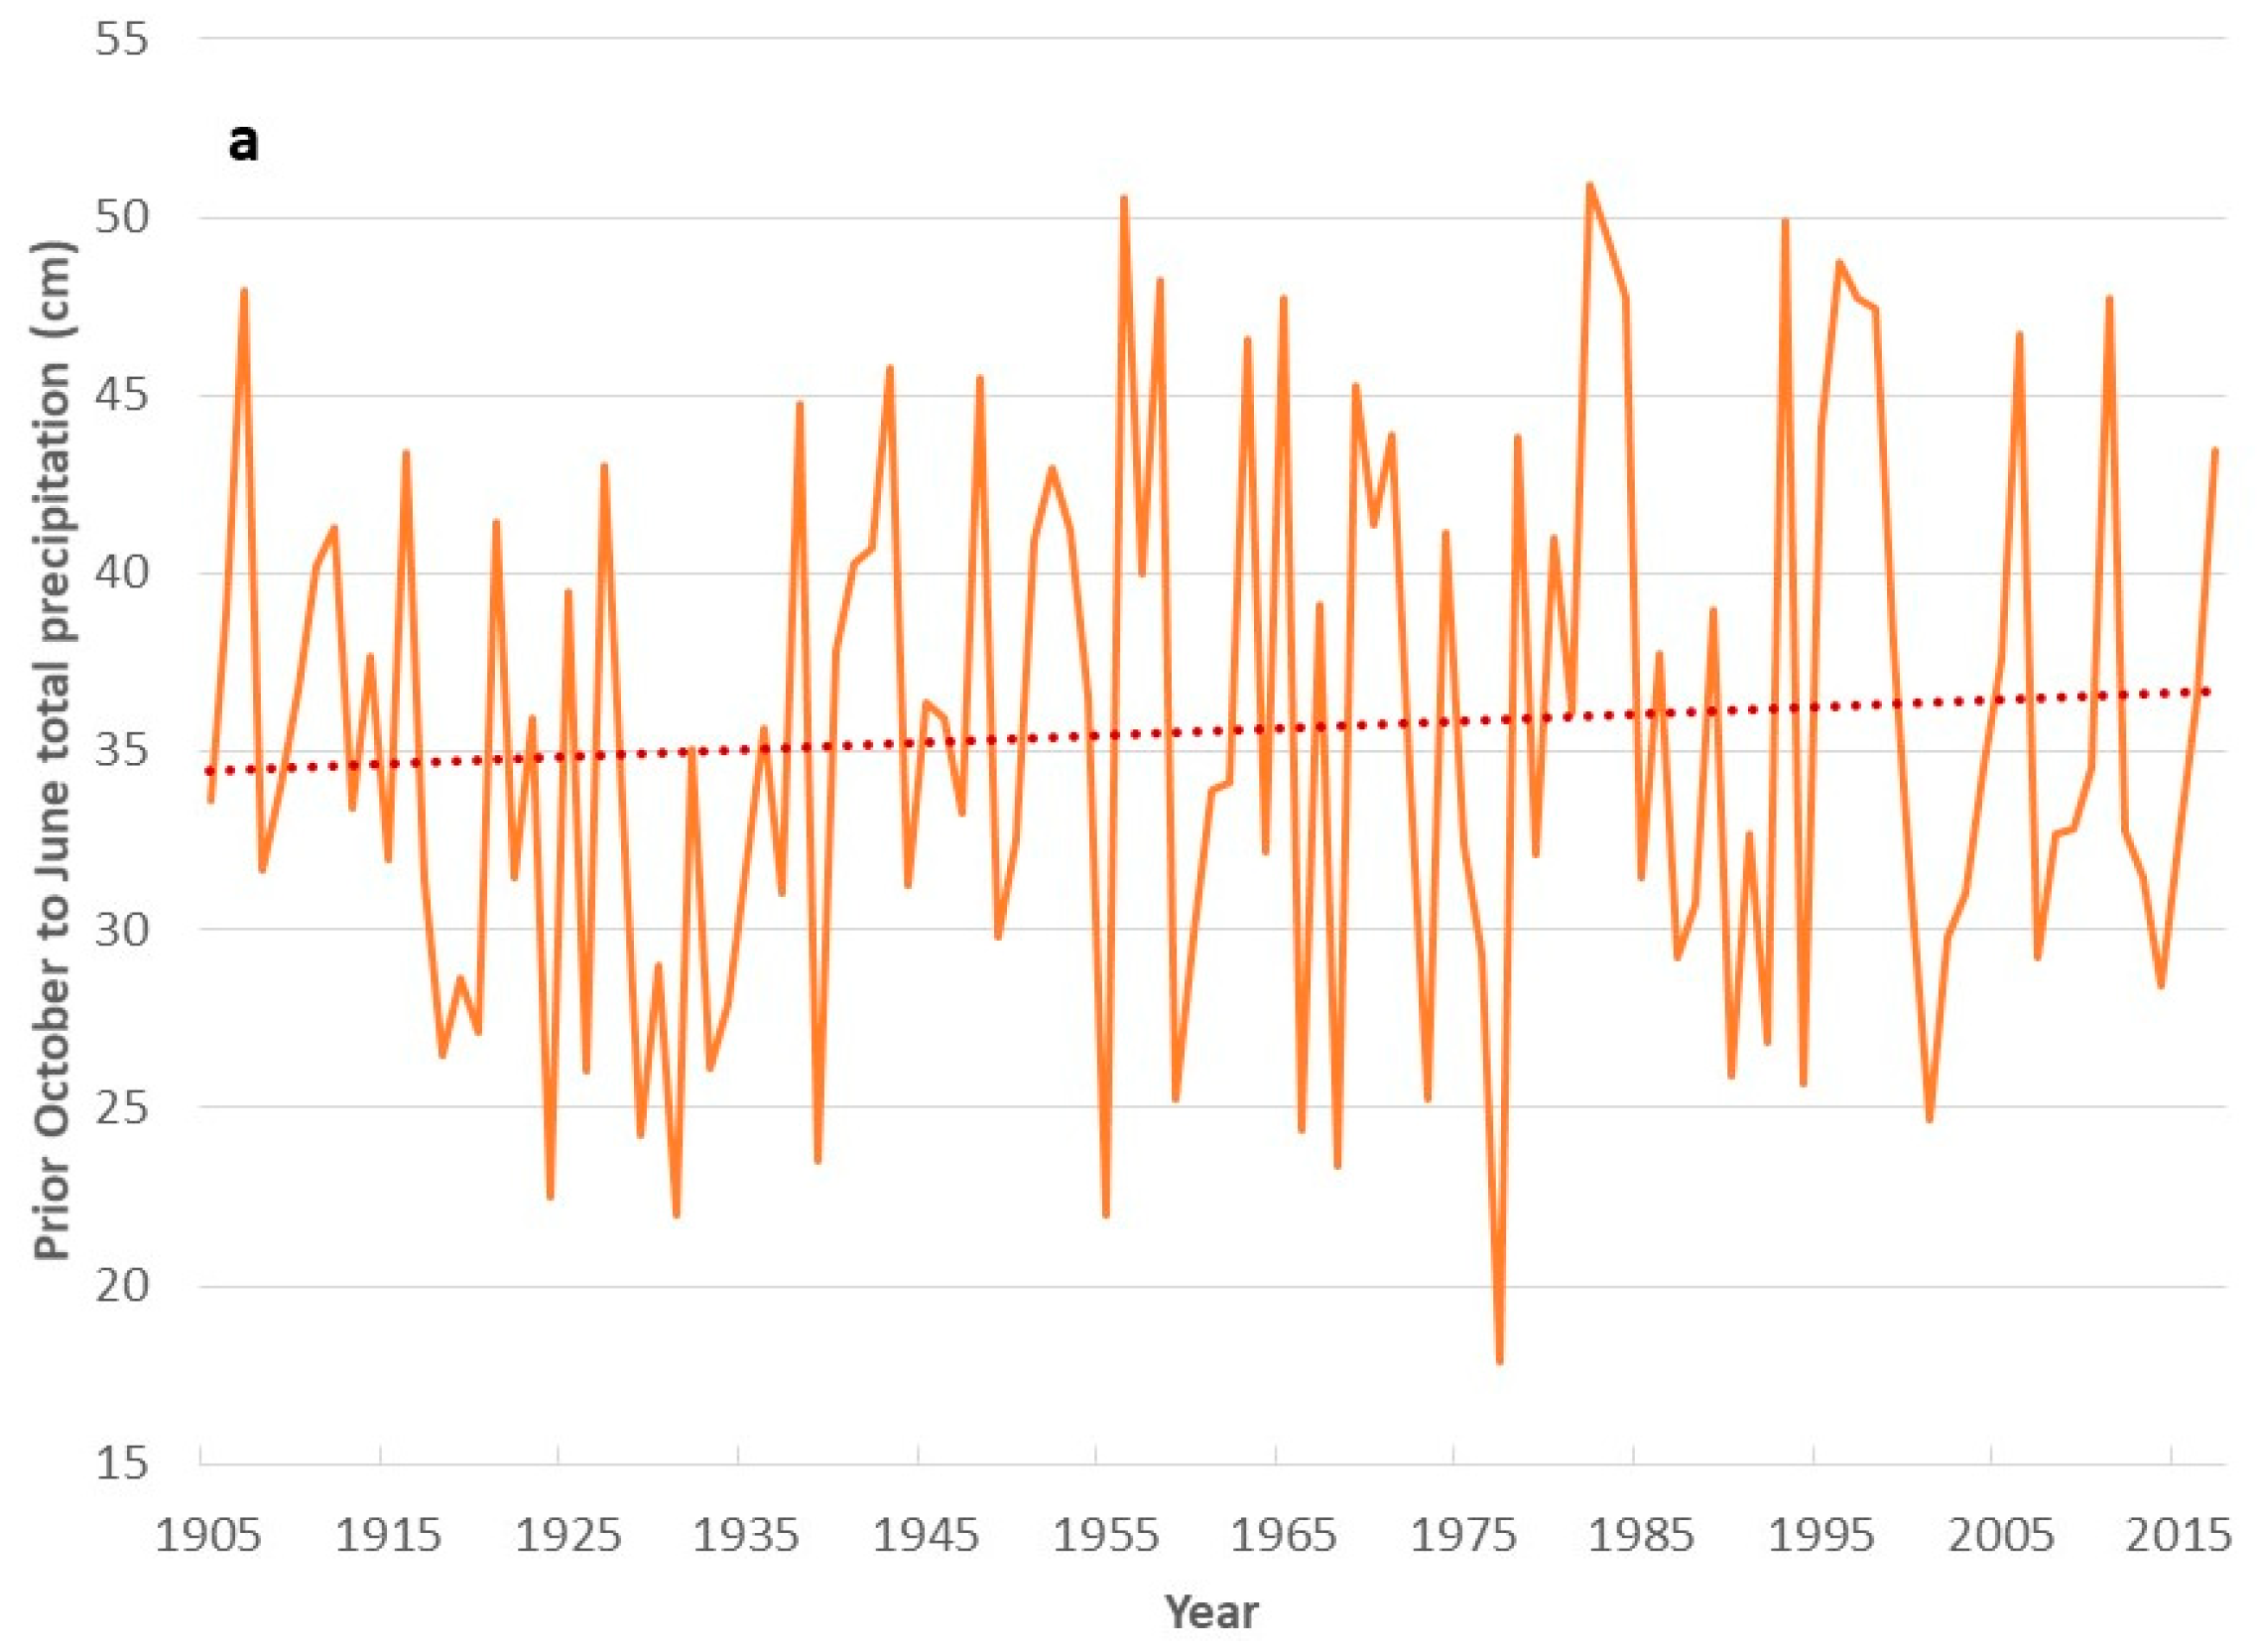
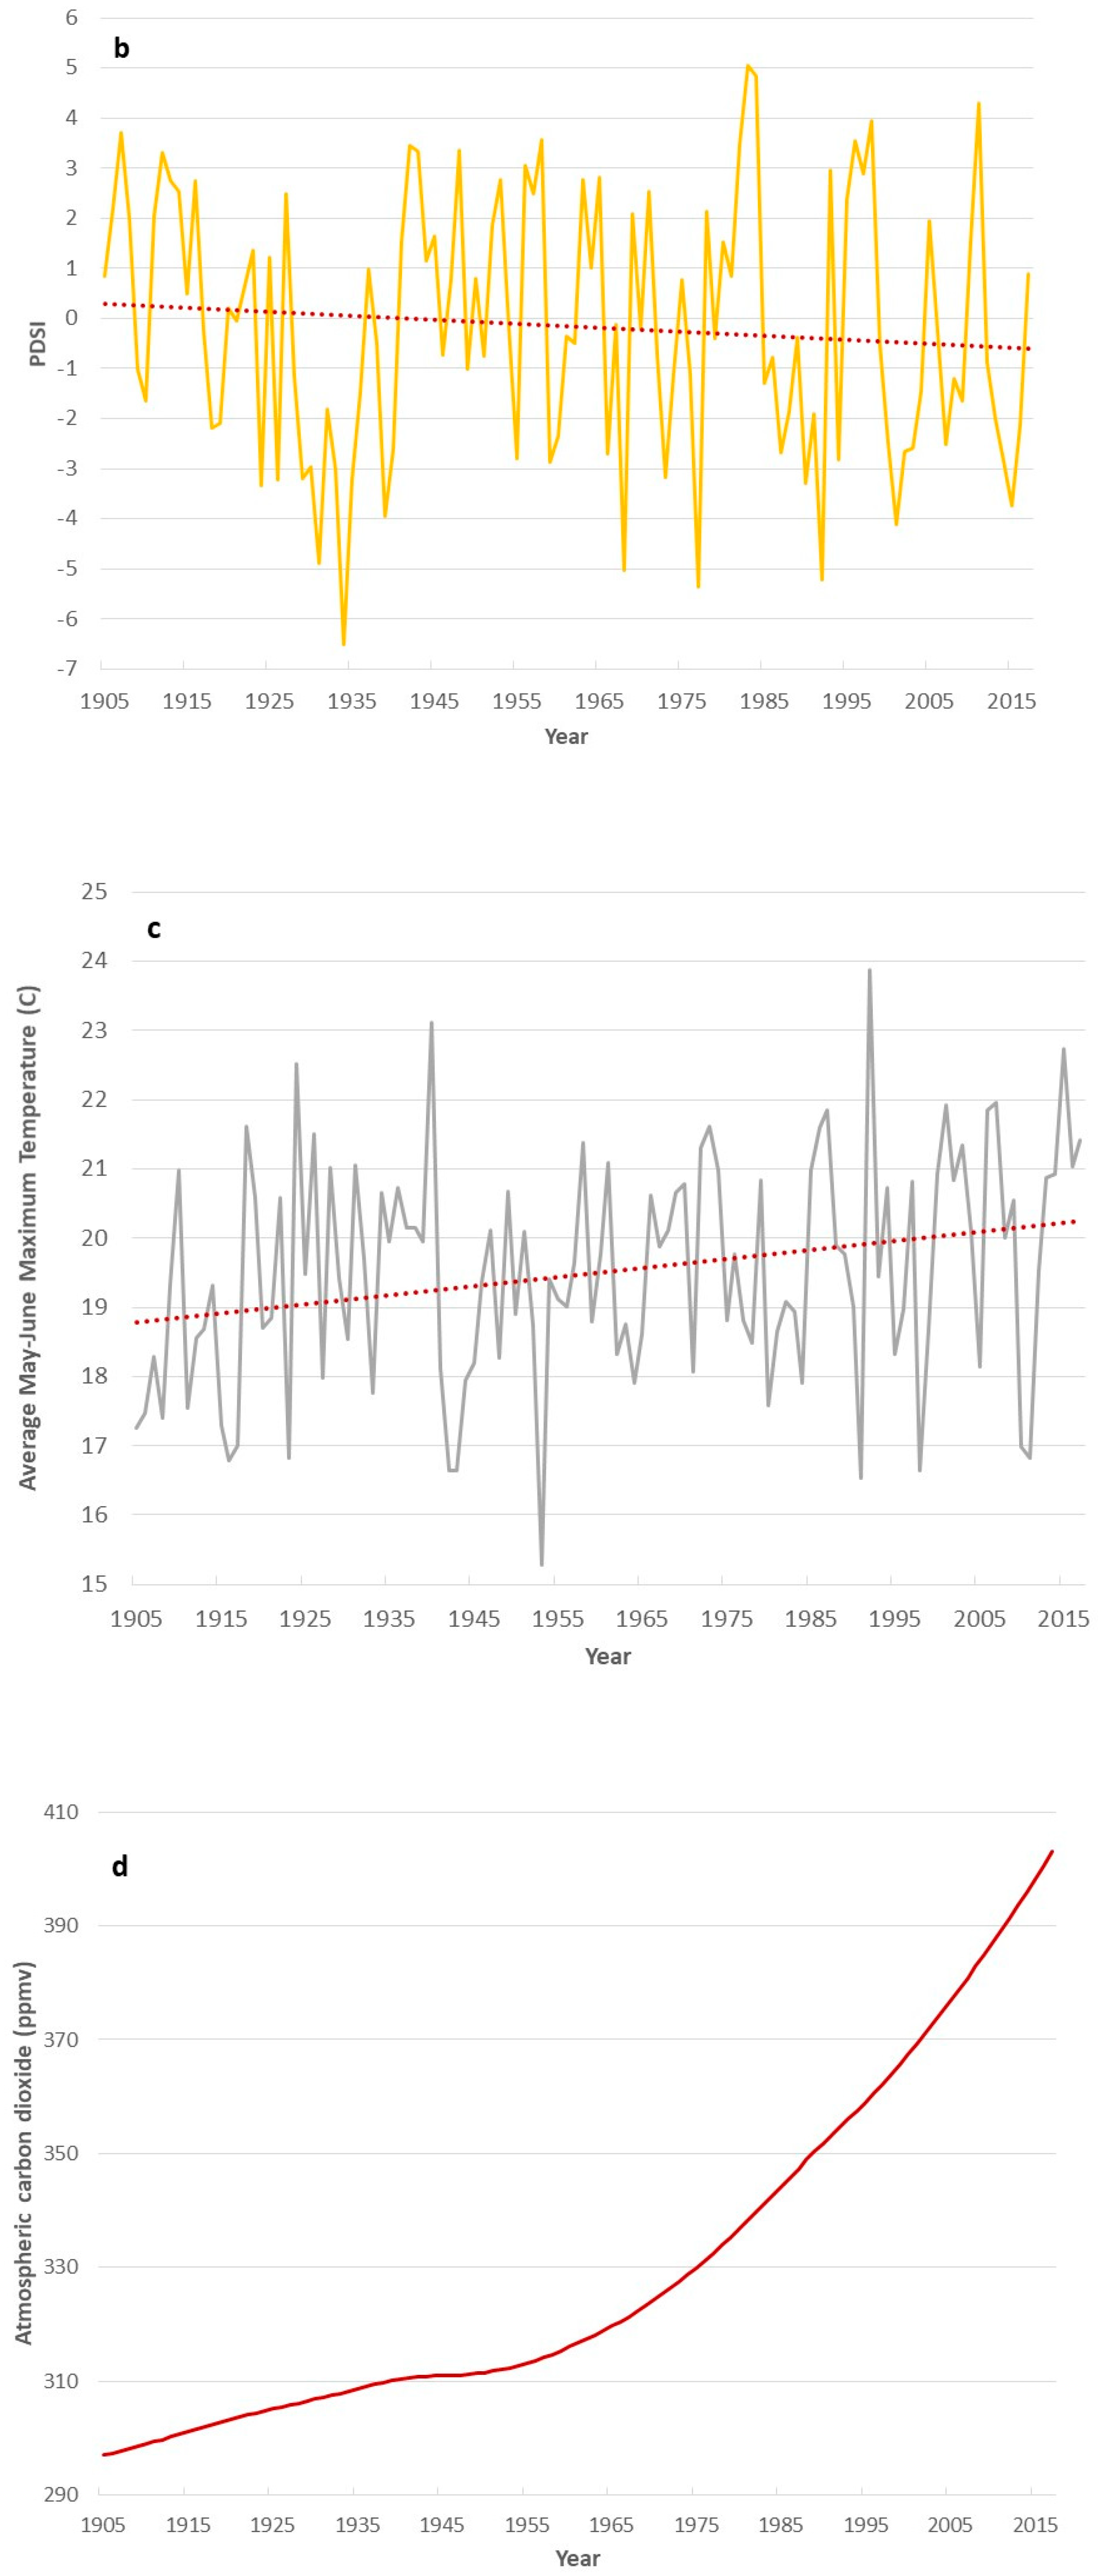
| Site | Precipitation Variable | Pearson r-Value |
| QRJ | prior October to June | 0.74 * |
| HRR | prior October to June | 0.68 * |
| PBR | prior October to June | 0.71 * |
| IRR | prior October to June | 0.67 * |
| COMBO | prior October to June | 0.78 * |
| Site | Temperature Variable | Pearson r-Value |
| QRJ | May–June maximum | −0.41 * |
| HRR | May–June maximum | −0.35 * |
| PBR | May–June maximum | −0.36 * |
| IRR | June–August maximum | −0.32 * |
| COMBO | May–June maximum | −0.4 * |
| Site | PDSI Variable | Pearson r-Value |
| QRJ | June | 0.71 * |
| HRR | June | 0.64 * |
| PBR | June | 0.67 * |
| IRR | June | 0.66 * |
| COMBO | June | 0.74 * |
| The best bivariate model: |
| COMBO = −0.651 + (0.046 × O_Jppt) |
| R2 = 0.60; p-Value model p = 0.000; p-Value O_Jppt p = 0.000 |
| The best multivariate model: |
| COMBO = 0.338 + (0.042 × O_Jppt) + (−0.045 × MJTmax) |
| R2 = 0.63; p-Value model p = 0.000; p-Vlaue O_Jppt p = 0.000; p-Value MJTmax p = 0.01 |
| R2 change adding in MJTmax = 2.4% |
| Residuals from the model with time: r = 0.18, p = 0.059 |
| The best PDSI Model: |
| pCOMBO = 0.992 + (0.131 × JunePDSI) |
| R2 = 0.55; p-value model = 0.000; p-Value JPDSI = 0.000 |
| Residuals from the model with time: r = 0.31, p = 0.001 |
| Model with JunePDSI and CO2: |
| COMBO = 0.200 + (0.135 × JunePDSI) + (0.002 × CO2) |
| R2 = 0.58; p-Value model = 0.000; p-Value JunePDSI = 0.001; p-Value CO2 = 0.013 |
| R2 change adding CO2 = 2.4% |
| Residuals from the model with time: r = 0.09, p = 0.345 |
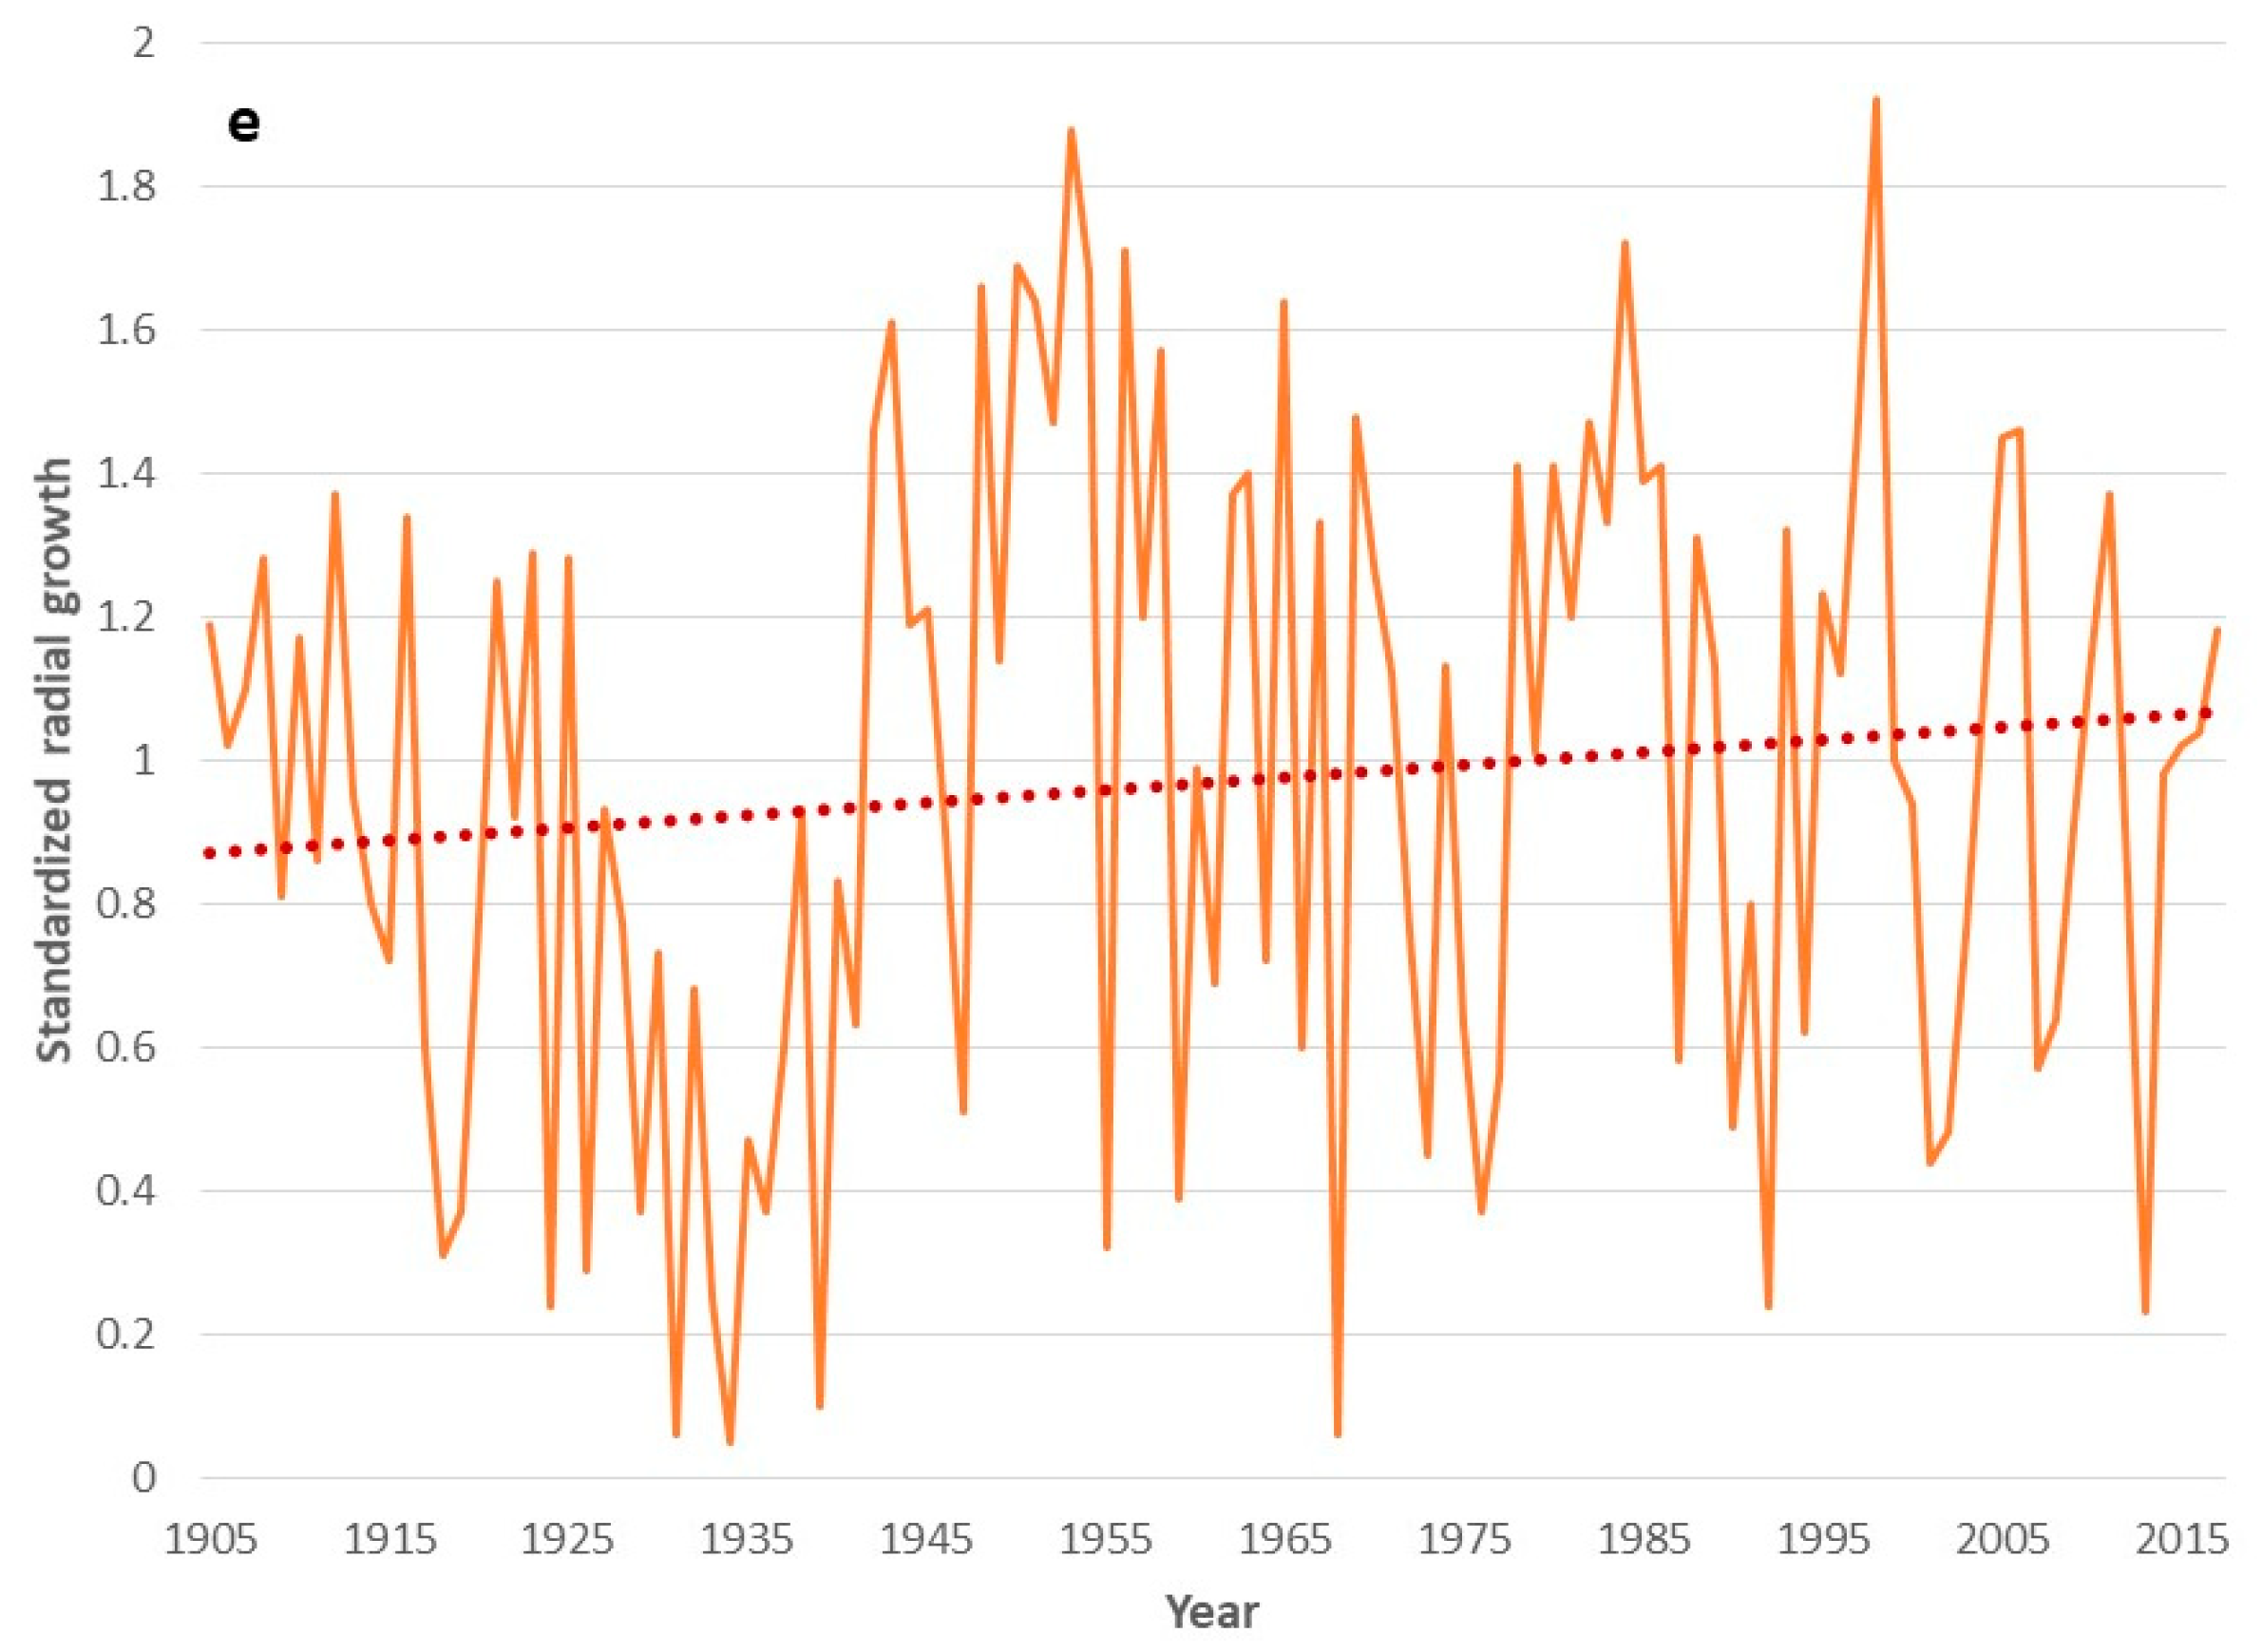
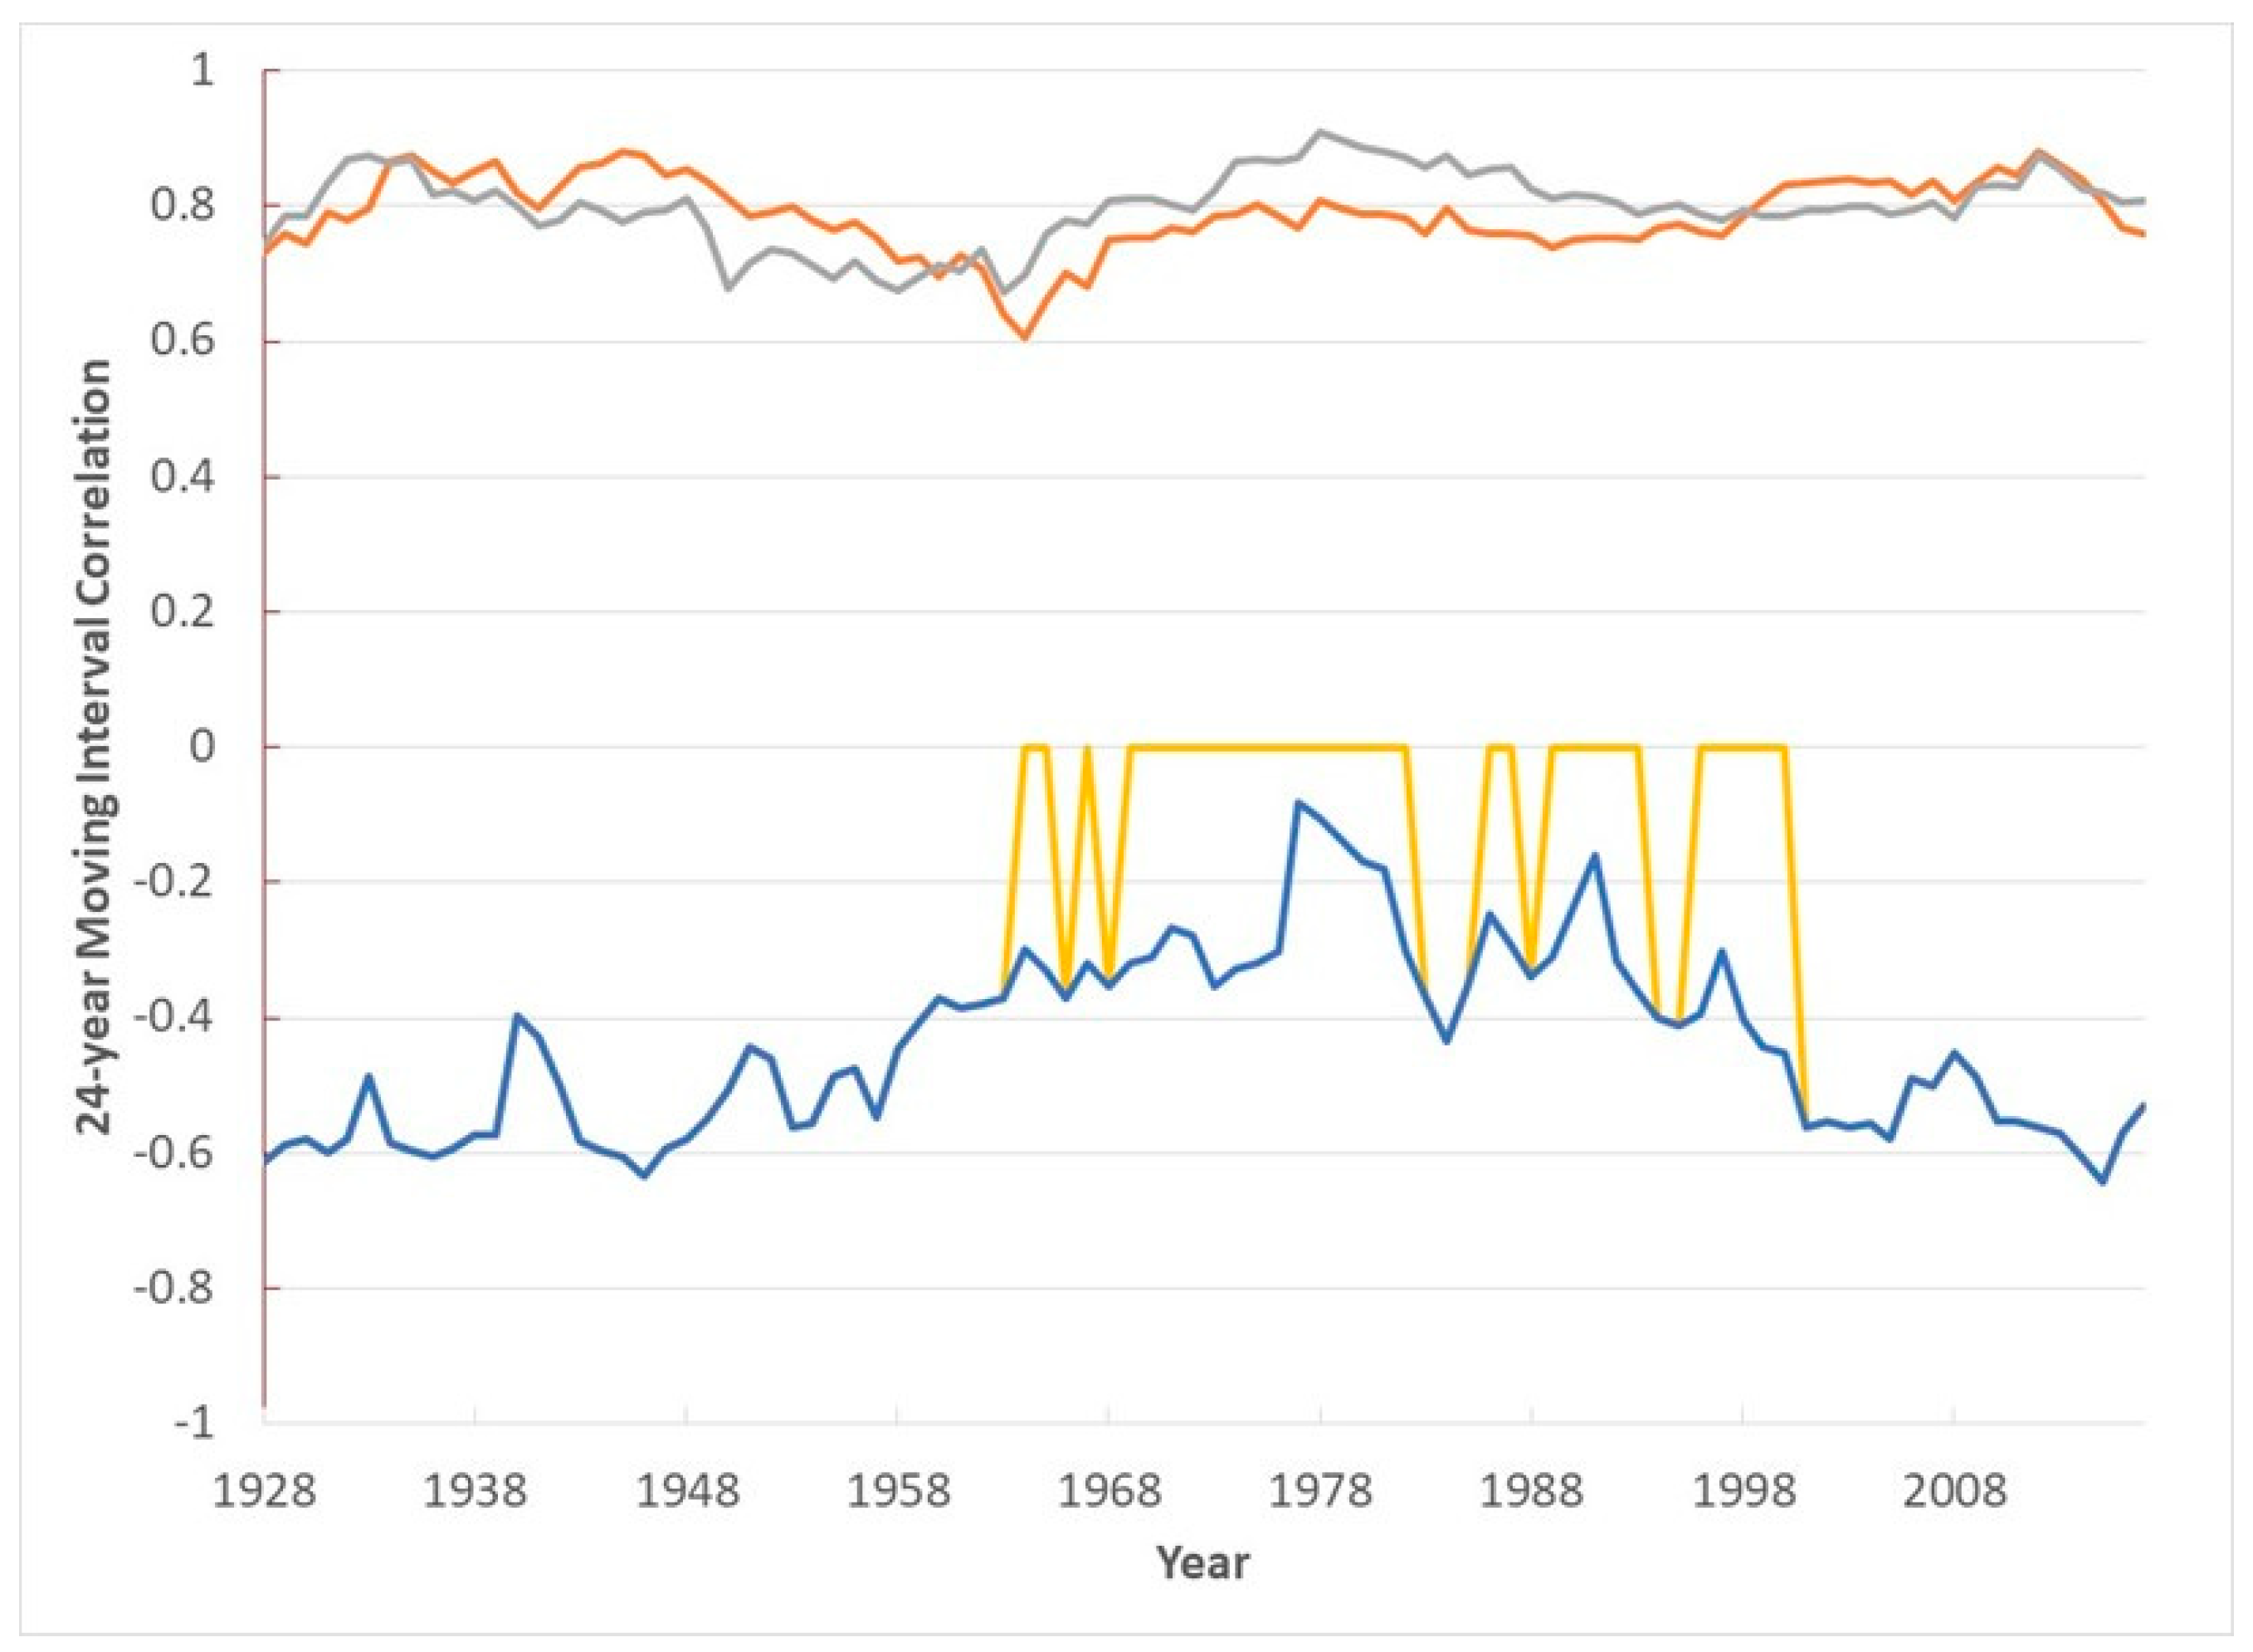
| Full Record | Last 50 Years | Last 30 Years | Last 20 Years | |
|---|---|---|---|---|
| (1905–2017) | (1968–2017) | (1988–2017) | (1998–2017) | |
| Variable (COMBO) | 0.13 | −0.00 | −0.01 | −0.09 |
| Variable (Single Month) | ||||
| Prior December Precipitation | 0.16 | 0.11 | 0.27 | 0.37 |
| June PDSI | −0.1 | −0.09 | −0.03 | −0.06 |
| June Maximum Temperature | 0.24 * | 0.12 | 0.24 | 0.17 |
| Variable (Multi-Month) | ||||
| Prior October–June Precipitation | 0.09 | −0.02 | −0.01 | 0.03 |
| May–June Average Max Temp | 0.26 * | 0.12 | 0.2 | 0.23 |
| PDSI < −3 | |||
| PDSI | Growth | # years | |
| EARLY | −3.9 | 0.23 | 8 |
| LATE | −4.3 | 0.47 | 7 |
| p-Value | 0.315 | 0.132 | |
| PDSI < −2 | |||
| PDSI | Growth | # years | |
| EARLY | −3.3 | 0.38 | 15 |
| LATE | −3.3 | 0.59 | 17 |
| p-Value | 0.479 | 0.034 | |
| PDSI < −1 | |||
| PDSI | Growth | # years | |
| EARLY | −2.7 | 0.51 | 21 |
| LATE | −2.7 | 0.71 | 25 |
| p-Value | 1.00 | 0.236 |
© 2019 by the authors. Licensee MDPI, Basel, Switzerland. This article is an open access article distributed under the terms and conditions of the Creative Commons Attribution (CC BY) license (http://creativecommons.org/licenses/by/4.0/).
Share and Cite
Soulé, P.T.; Knapp, P.A. Radial Growth Rate Responses of Western Juniper (Juniperus occidentalis Hook.) to Atmospheric and Climatic Changes: A Longitudinal Study from Central Oregon, USA. Forests 2019, 10, 1127. https://doi.org/10.3390/f10121127
Soulé PT, Knapp PA. Radial Growth Rate Responses of Western Juniper (Juniperus occidentalis Hook.) to Atmospheric and Climatic Changes: A Longitudinal Study from Central Oregon, USA. Forests. 2019; 10(12):1127. https://doi.org/10.3390/f10121127
Chicago/Turabian StyleSoulé, Peter T., and Paul A. Knapp. 2019. "Radial Growth Rate Responses of Western Juniper (Juniperus occidentalis Hook.) to Atmospheric and Climatic Changes: A Longitudinal Study from Central Oregon, USA" Forests 10, no. 12: 1127. https://doi.org/10.3390/f10121127