Article

Carbon Cycles of Forest Ecosystems in a Typical Climate Transition Zone under Future Climate Change: A Case Study of Shaanxi Province, China

1
State Key Laboratory of Soil Erosion and Dryland Farming on the Loess Plateau, Northwest A&F University, Yangling 712100, China
2
College of Natural Resources and Environment, Northwest A&F University, Yangling 712100, China
3
Institute of Soil and Water Conservation, Chinese Academy of Sciences and Ministry of Water Resources, Yangling 712100, China
*
Author to whom correspondence should be addressed.
Forests 2019, 10(12), 1150; https://doi.org/10.3390/f10121150
Submission received: 25 October 2019 / Revised: 2 December 2019 / Accepted: 12 December 2019 / Published: 16 December 2019
(This article belongs to the Section Forest Ecology and Management)

Abstract

:
As global climate change has a large effect on the carbon cycle of forests, it is very important to understand how forests in climate transition regions respond to climate change. Specifically, the LPJ-GUESS (Lund-Potsdam-Jena General Ecosystem Simulator) model was used to simulate net ecosystem productivity (NEP) and soil heterotrophic respiration (Rh) dynamics of two forest ecosystems of different origins between 1951 and 2100, to quantitatively analyze the carbon source and sink functions and potential changes in soil carbon dynamics in arid and humid regions under future climate change, simulate the dynamics of forest net primary productivity (NPP) under different climatic factors, and analyze the sensitivity of forests in arid and humid regions to temperature, precipitation, and carbon dioxide (CO2) concentration. We found that: (1) in both the historical and future periods, the average NEP of both studied forests in the humid region was larger than that in the arid region, the carbon sink function of the humid region being predicted to become stronger and the arid zone possibly becoming a carbon source; (2) between 1951 and 2100, the forest soil Rh in the arid region was lower than that in the humid region and under future climate change, forest in the humid region may have higher soil carbon loss; (3) increasing temperature had a negative effect and CO2 concentration had a positive effect on the forests in the study area, and forests in arid areas are more sensitive to precipitation change. We believe our research could be applied to help policy makers in planning sustainable forest management under future climate change.

1. Introduction

Since the industrial revolution, atmospheric CO2 concentration has increased from 280 ppmv before the industrial revolution to 400 ppmv at present, and the global average surface temperature has increased by 0.85 °C [1]. As the main body of terrestrial ecosystems, forests play a very important role in the global terrestrial carbon cycle and in maintaining the global terrestrial ecosystem carbon balance [2]. Therefore, given the predicted continuous climate change over the next 100 years, it is important to investigate the effects of climate conditions on forest ecosystems. However, previous studies on the impact of climate change on the carbon cycle of forest ecosystems have mainly focused on single climatic zones [3,4,5], while forest ecosystems located in different climatic zones are likely to respond differently to climate change. In China, since the 1990s, the average temperature has increased at a rate of 0.6 °C 10 yr−1 [6], which is far higher than the global average of 0.27 °C 10 yr−1 [7], and together with average temperature, seasonal precipitation has also changed significantly [8]. These climate changes are particularly evident in northern China [9]. Shaanxi Province, located in the north of China, is one of the regions where climate change is obvious. Our previous study predicted that the temperature in this area would rise 1.4–3.1 °C by the end of this century, while precipitation showed no obvious change [10]. This region is also a transition zone from a temperate arid to a subtropical humid climate [11]. Therefore, we chose Shaanxi as a research area to study the carbon cycle of forest ecosystems in arid and humid regions.
Our previous work in this region focused on the response of net primary productivity (NPP) of forests to future climate change [10]. However, NPP only considers net carbon sequestration by vegetation within forest ecosystems [12], ignoring carbon emissions from heterotrophic respiration (Rh) of forest soils into the atmosphere, which may limit our overall understanding of the carbon cycle of forest ecosystems in this region. Here, we introduce net ecosystem productivity (NEP), which is numerically equal to NPP minus Rh, and describes the net exchange of atmospheric carbon dioxide (CO2) by an undisturbed forest ecosystem. Therefore, determining the response of NEP and Rh to climate change will help us correctly understand and evaluate the carbon source and sink functions of forest ecosystems in arid and humid regions under future climate change, as well as carbon storage and stability in forest soils. In addition, future climate change will result from the interaction of many environmental factors (among which temperature, precipitation, and CO2 concentration are the main factors affecting forest carbon cycles); therefore, it is necessary to determine the sensitivity of forest ecosystems to environmental factors. Previous studies have shown that NPP is more sensitive to climate change and is suitable for measuring the sensitivity of forest ecosystems to changes in temperature, precipitation, and CO2 concentration [13,14]. Therefore, NPP was also selected as an indicator of forest sensitivity in this study.
In order to determine the dynamic changes of forest ecosystems under climate control in time series, it is essential to clarify the responses of vegetation growth and stand dynamics to interannual changes in climate and other environmental conditions [15]. Process modeling provides a method to integrate data on a continuous spatial and temporal scale to study regional carbon cycles, and assess potential changes in ecosystem carbon dynamics with climate change [16]. Furthermore, process models are based on developing an understanding of ecosystems by simulating the effects of biological processes such as canopy photosynthesis, absorption, transpiration, and soil moisture on individual plants to predict biomass growth, the interaction of vegetation with the environment, and the response mechanism of ecosystems to climate change. Therefore, process models have inherent advantages in predicting how forests respond to future climate change. As a widely used vegetation dynamic process model in the world, LPJ-GUESS (Lund-Potsdam-Jena General Ecosystem Simulator) refines the simulation to the individual plant level on the basis of LPJ-DGVM (dynamic global vegetation model), which makes the dynamic simulation process of vegetation composition, structure, and function response to climate change more precise [17]. At present, LPJ-GUESS has been used to study the carbon cycle of forest ecosystems around the world [18,19].
The purpose of this study was to investigate NEP and Rh responses to future climate change in forest ecosystems and the sensitivity of forest ecosystems to temperature, precipitation, and CO2 concentrations in arid and humid regions. Specifically we used (1) the LPJ-GUESS model to simulate the NEP and Rh dynamics of forest ecosystems, both historically and to predict future trends, and to assess the carbon sink function of forests in arid and humid regions and potential changes in soil carbon dynamics of forests; and (2) the LPJ-GUESS model to simulate forest NPP in arid and humid areas under different climate combination scenarios, and quantitatively analyze the sensitivity of forest ecosystems in different climate zones to temperature, precipitation, and CO2 concentration. Our research aimed to provide insight into the carbon source and sink function of forest ecosystems, carbon sequestration of forest soil in semi-arid and humid areas, and the response mechanism of forest ecosystems to changes in temperature, precipitation, and CO2 concentration.

2. Materials and Methods

2.1. Study Area

The study area is in Shaanxi Province, China (31°42′–39°35′ N, 105°29′–111°15′ E) (Figure 1), which is located in the transition zone between the southern humid climate zone and northern arid climate zone and has a continental monsoon climate overall. From south to north the climatic types found in this area are subtropical humid climate, warm temperate humid climate, and temperate arid climate, with great differences between the north and south. Within our study Shaanxi Province was divided into three geographical units, according to topography, hydrology, climate, and other factors from north to south, named Northern Shaanxi Plateau (NSX), Guanzhong Plain (MSX), and Southern Shaanxi Mountains (SSX) [10]. The average annual temperature in the study area is 8–16 °C, of which the temperatures in SSX, MSX, and NSX are 14–16 °C, 12–13 °C, and 8–l0 °C, respectively. The annual average precipitation increased from north to south; precipitation was 964.6 mm in SSX, 590.4 mm in MSX, and 461.7 mm in NSX, with total precipitation of 320–1400 mm for the entire study area. Due to the unique climate and geographical conditions, a temperate grassland zone, warm temperate deciduous broad-leaved forest zone, and subtropical evergreen broad-leaved forest zone appear successively from north to south in Shaanxi Province [10]. Robinia pseudoacacia has become the main tree species in afforestation and has the largest plantation area in Shaanxi Province because of its developed root system, rapid growth, drought tolerance, barren tolerance, and high survival rate. Quercus L. (Quercus wutaishanica being the dominant species) has a well-developed root system, cold and drought tolerance, strong adaptability, and a wide distribution area in Shaanxi Province, being an important natural vegetation type in this area. R. pseudoacacia and Q. wutaishanica are the representative tree species of artificial forests and natural secondary forests in Shaanxi Province, accounting for 30.7% and 63.0%, respectively, of the carbon reserves in plantations and natural secondary forests in Shaanxi Province [20]. Small changes in their carbon sequestration may cause large carbon fluctuations in Shaanxi Province. Therefore, Q. wutaishanica and R. pseudoacacia forests were selected as the research subjects to study the carbon cycle in arid and humid regions.

2.2. Modeling Forest NPP

LPJ-GUESS is a multi-scale dynamic process model for simulating ecosystem structure and function; it can perform simulations on a variety of scales, including patches, landscapes, regions, and even global scale simulations. The simulation process is carried out in plant functional types (PFTs) or species. Sitch et al. described the simulation scheme of the LPJ-GUESS model [21]. In this study, we used model version 3.0, which is an updated version that includes the interaction between the atmospheric nitrogen cycle and carbon cycle, completely described by Smith et al. [17]. The model requires multiple data inputs, including monthly mean climate data (temperature, precipitation, and cloud cover), atmospheric CO2 concentration, and soil texture.
The historical monthly precipitation and average temperature data used in this study were taken from the CRU TS 3.23 data set (1951–2014) [22], and predicted future values (2015–2100) were generated by the NorESM1-M, GFDL-ESM2M, and BCC-CSM1.1-M models of 28 general circulation models (GCMs) in the Coupled Model Intercomparison Project Phase 5. Due to the low resolution of the historical and future climate data obtained, this study was based on 1 km resolution climate data compiled by the China National Ecosystem Research Network (CNERN), and used the delta downscaling method to generate high resolution (1 km) climate data in the study area. Peng et al. gave a complete description of the downscaling process [23].
Furthermore, soil texture data was obtained from the Food and Agriculture Organization soil dataset [21], and the CO2 concentration from 1951 to 2100 was obtained from the representative concentration path (RCP) database. Differences among tree species were distinguished by different physiological and phenological parameters. The physiological and ecological characteristics of Q. wutaishanica and R. pseudoacacia were parameterized according to previous studies [17,21] and our own field investigations.
Simulations generally start from bare ground. When the initial conditions of each plot cannot be obtained (e.g., carbon and nitrogen pools of the ecosystem in the initial simulated year), spin-up is used to establish the initial conditions. In this study, the climate data from 1951 to 1980 were used as spin-up input data to repeatedly create simulations, so that the vegetation, litter, soil carbon, nitrogen pool, and their climatic conditions in the simulated area reached dynamic equilibrium.
To support the study of climate change, researchers from different disciplines and scientific communities have established a new coordinated parallel process: the representative concentration path (RCP) [24]. Among them, the RCP2.6 scenario assumes that global annual greenhouse gas emissions (measured in carbon dioxide equivalent) peak in 2010–2020, and then decrease dramatically; in the RCP4.5 scenario, global annual greenhouse gas emissions are expected to peak around 2040 and then decline gradually; in the RCP8.5 scenario emissions continue to rise throughout the 21st century. In this study, the above three RCP scenarios were used to predict the carbon cycle of forest ecosystems in arid and humid areas.
Two non-parametric methods (Mann-Kendall and Sen’s slope estimator tests) were used to detect historical and future NEP trends for two forests; full details of these two methods are given in Atta-ur-Rahman and Dawood [25]. The anomaly method was also used to analyze historical and future changes in forest Rh. In addition, in order to explore the sensitivity of forests in arid and humid regions to climate change, we used NPP values from both forests from 1961 to 1990 for reference. Historical temperature, precipitation, and CO2 concentration data were used as the main driving variables. Our previous study concluded that the maximum possible future increase of temperature in the study area was about 30% [10], and the average atmospheric CO2 concentration in the future (510 ppmv) [1] will be about 30% higher than the current atmospheric CO2 concentration (380 ppmv). To measure the variables uniformly, we set the maximum increase of the three indicators of sensitivity analysis as 30% and compared them with the current value 0% and the intermediate value 15%. Therefore, each driving variable was divided into three levels (+0%, +15%, and +30%), and 26 climate combination scenarios were defined. We also used the anomaly method to analyze the NPP changes of both forests under different climate combination scenarios.

2.3. Model Validation

The applicability of the LPJ-GUESS model in simulating the NPP of R. pseudoacacia and Q. wutaishanica in Shaanxi Province was validated by NPP values based on fieldwork undertaken from 2001 to 2010. From July 2015 to August 2016, we conducted a survey of the study area (Figure 1 and Supplementary Materials Table S1). We recorded the diameter at breast height (DBH) and height of trees with DBH > 8 cm and measured the stand density in 30 × 30 m plots. In each plot, trees without obvious signs of damage were selected to take core samples at DBH, and 10–15 samples were obtained from each plot. Furthermore, leaf, branch, stem, and fine root samples were collected from selected healthy trees and sealed in plastic bags to estimate the carbon content in each organ.
In the laboratory, cores were glued to the sample groove with white latex, dried for 24 h, and polished with fine sandpaper; then all tree rings were marked, and the width of each ring was measured using a stereomicroscope (Olympus VM-31, Tokyo, Japan). The collected organ samples (i.e., leaves, branches, stems, and fine roots) were dried to a constant weight in an oven at 80 °C to obtain the dry weight of each organ sample; then, these dried organ samples were ground and the carbon content of each organ was determined with an elemental analyzer (Carlo Erba 1106, Milan, Italy). The annual carbon content of each tree in the sample plot was calculated by the annual average tree ring width, the allometric growth equation (Supplementary Materials Table S2) between the biomass of each organ and DBH, and the carbon content of each organ measured in the laboratory. Then, the forest carbon biomass of the plot was calculated by the carbon biomass of each tree and the tree density of the plot. Although the simulated NPP of each forest was slightly greater than the field based NPP in the study area, these differences were not significant (Figure 2). Therefore, we considered the simulation results of the LPJ-GUESS model for NPP to be reliable.
We compared the measured NEP values of R. pseudoacacia and Q. wutaishanica in published literature with our simulated values in the same year to verify the applicability of the LPJ-GUESS model (Table 1). As NEP fluctuates greatly between years, Table 1 is only the measured value of individual years. Although the measured values differed from the simulated values, the measured values were in the fluctuation range of the simulated values. Therefore, considering the factors, the simulated value was basically in agreement with the measured value. The LPJ-GUESS model could accurately simulate the NEP of R. pseudoacacia and Q. wutaishanica in the study area. Furthermore, in numerical terms, Rh = NPP−NEP, thus the LPJ-GUESS model could simulate forest ecosystem Rh on the basis of validating forest NPP and NEP.

3. Results

3.1. Net Ecosystem Productivity

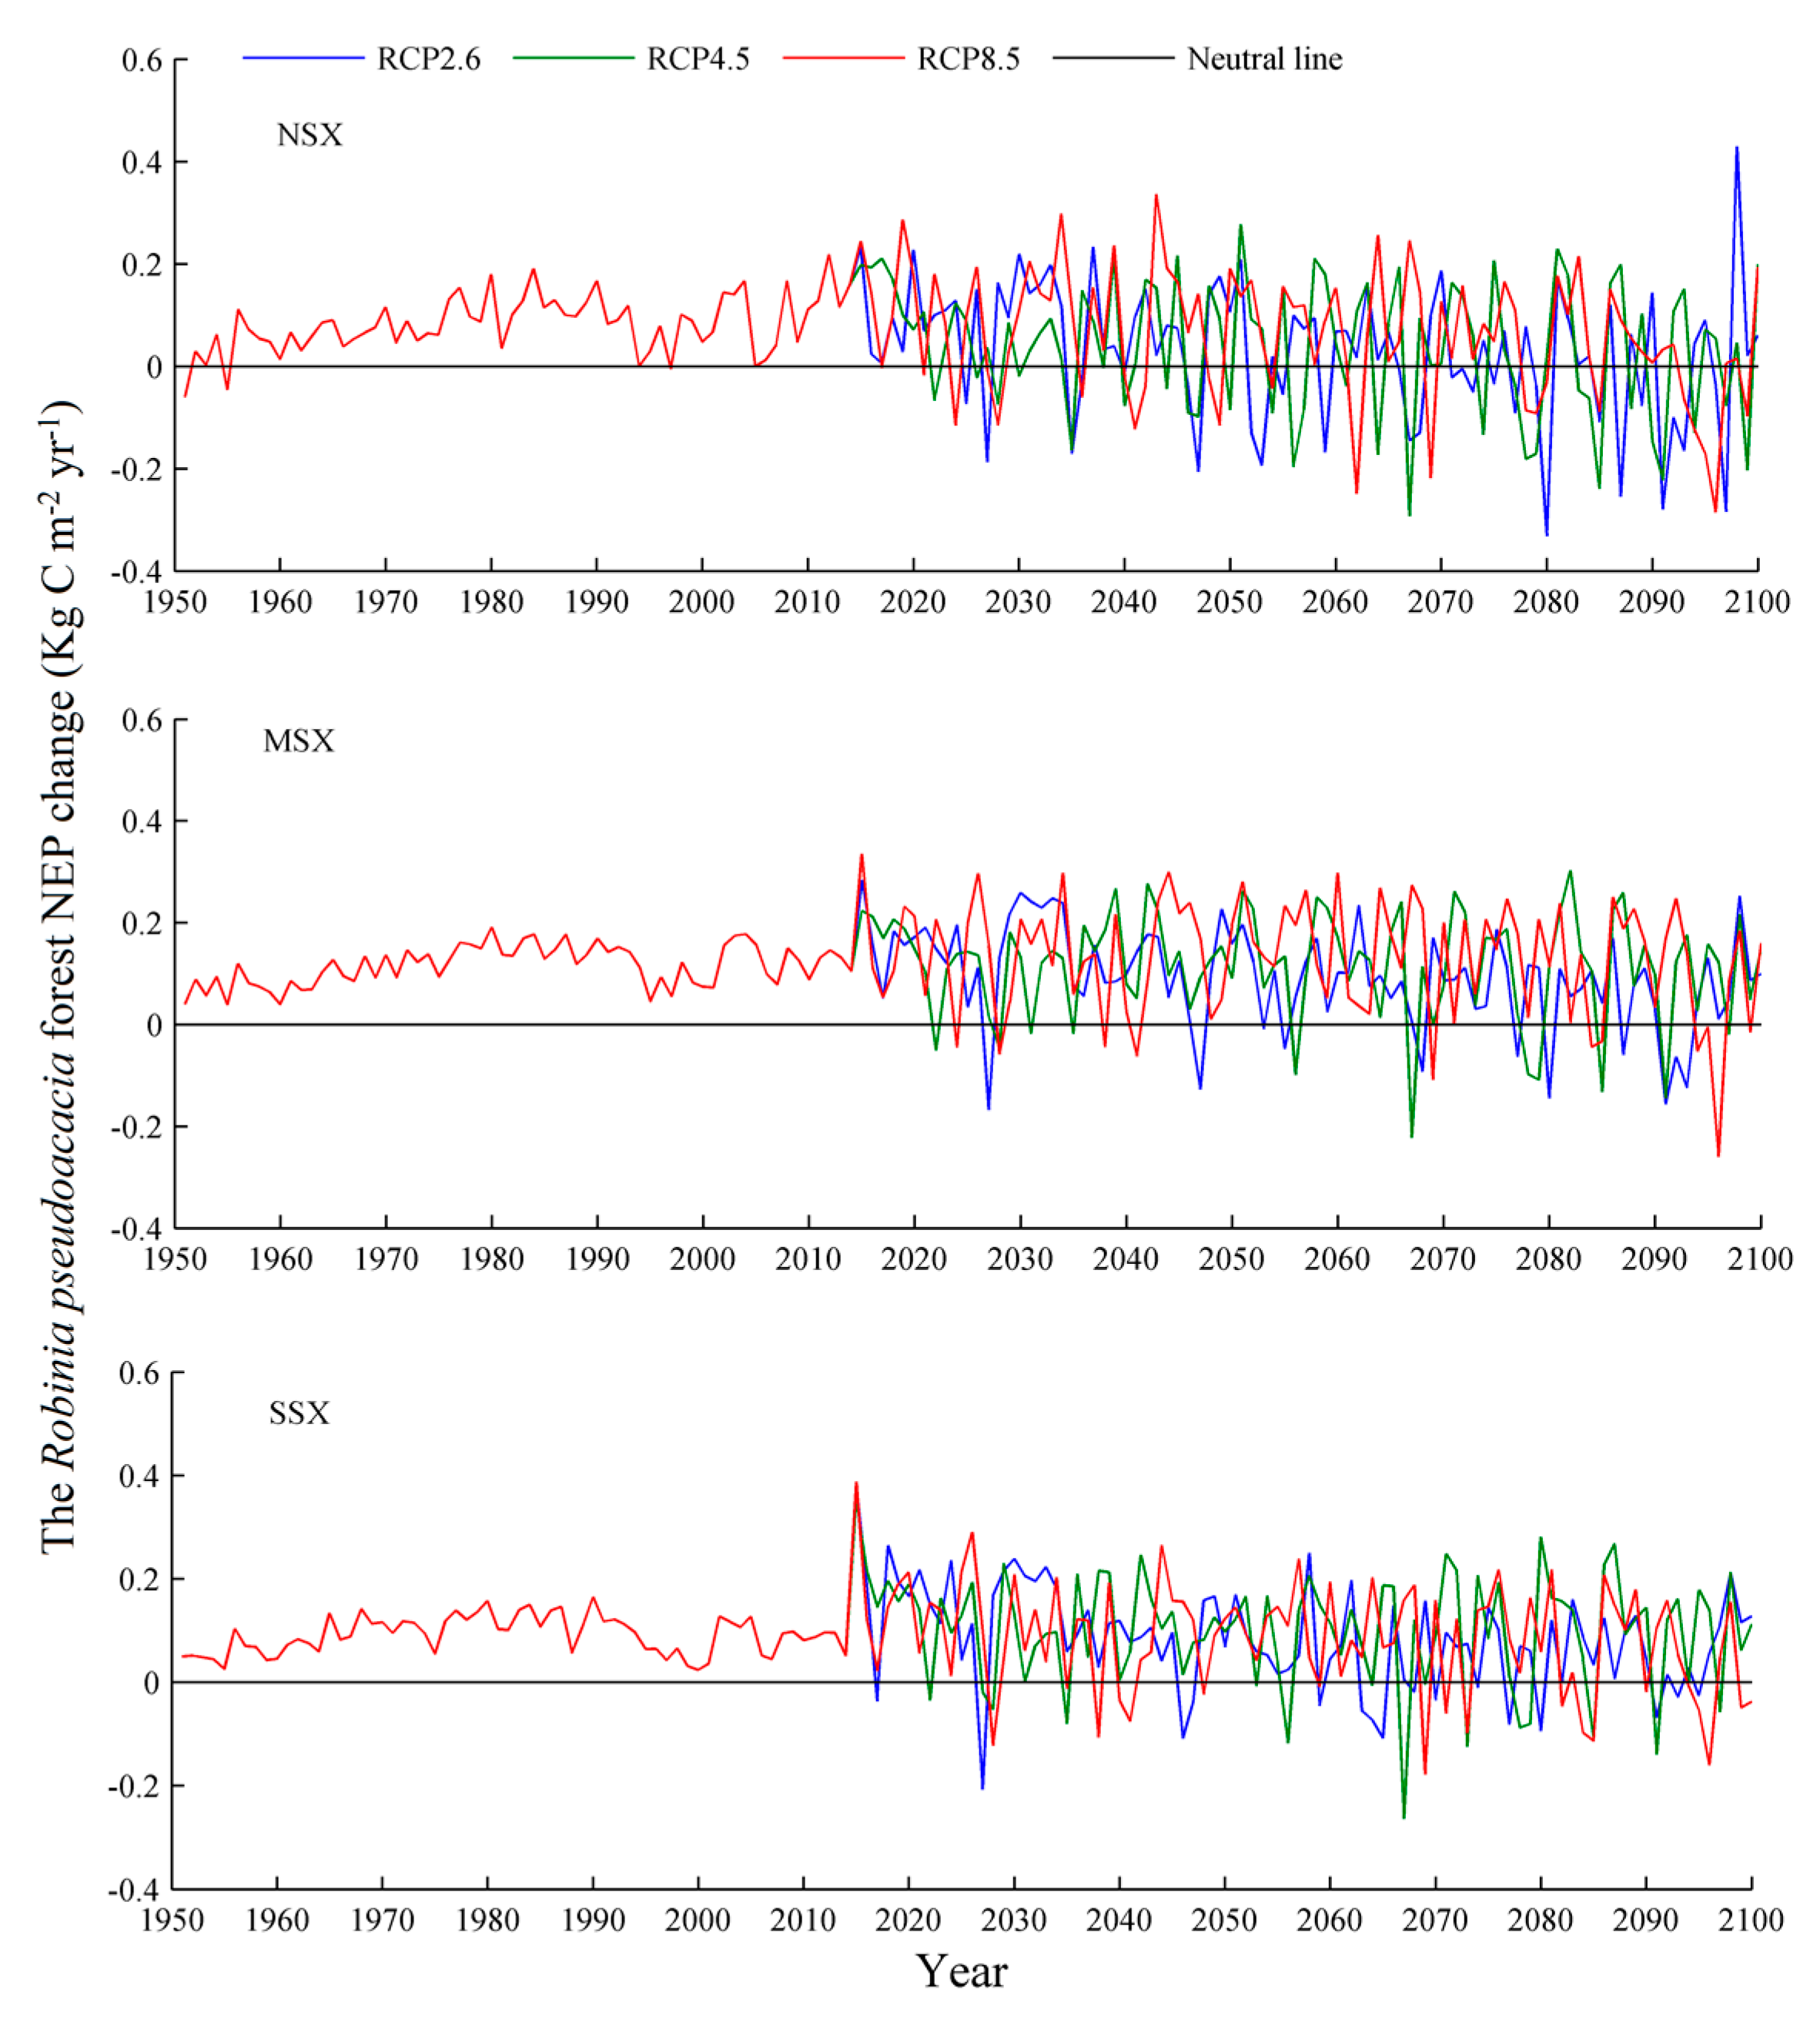
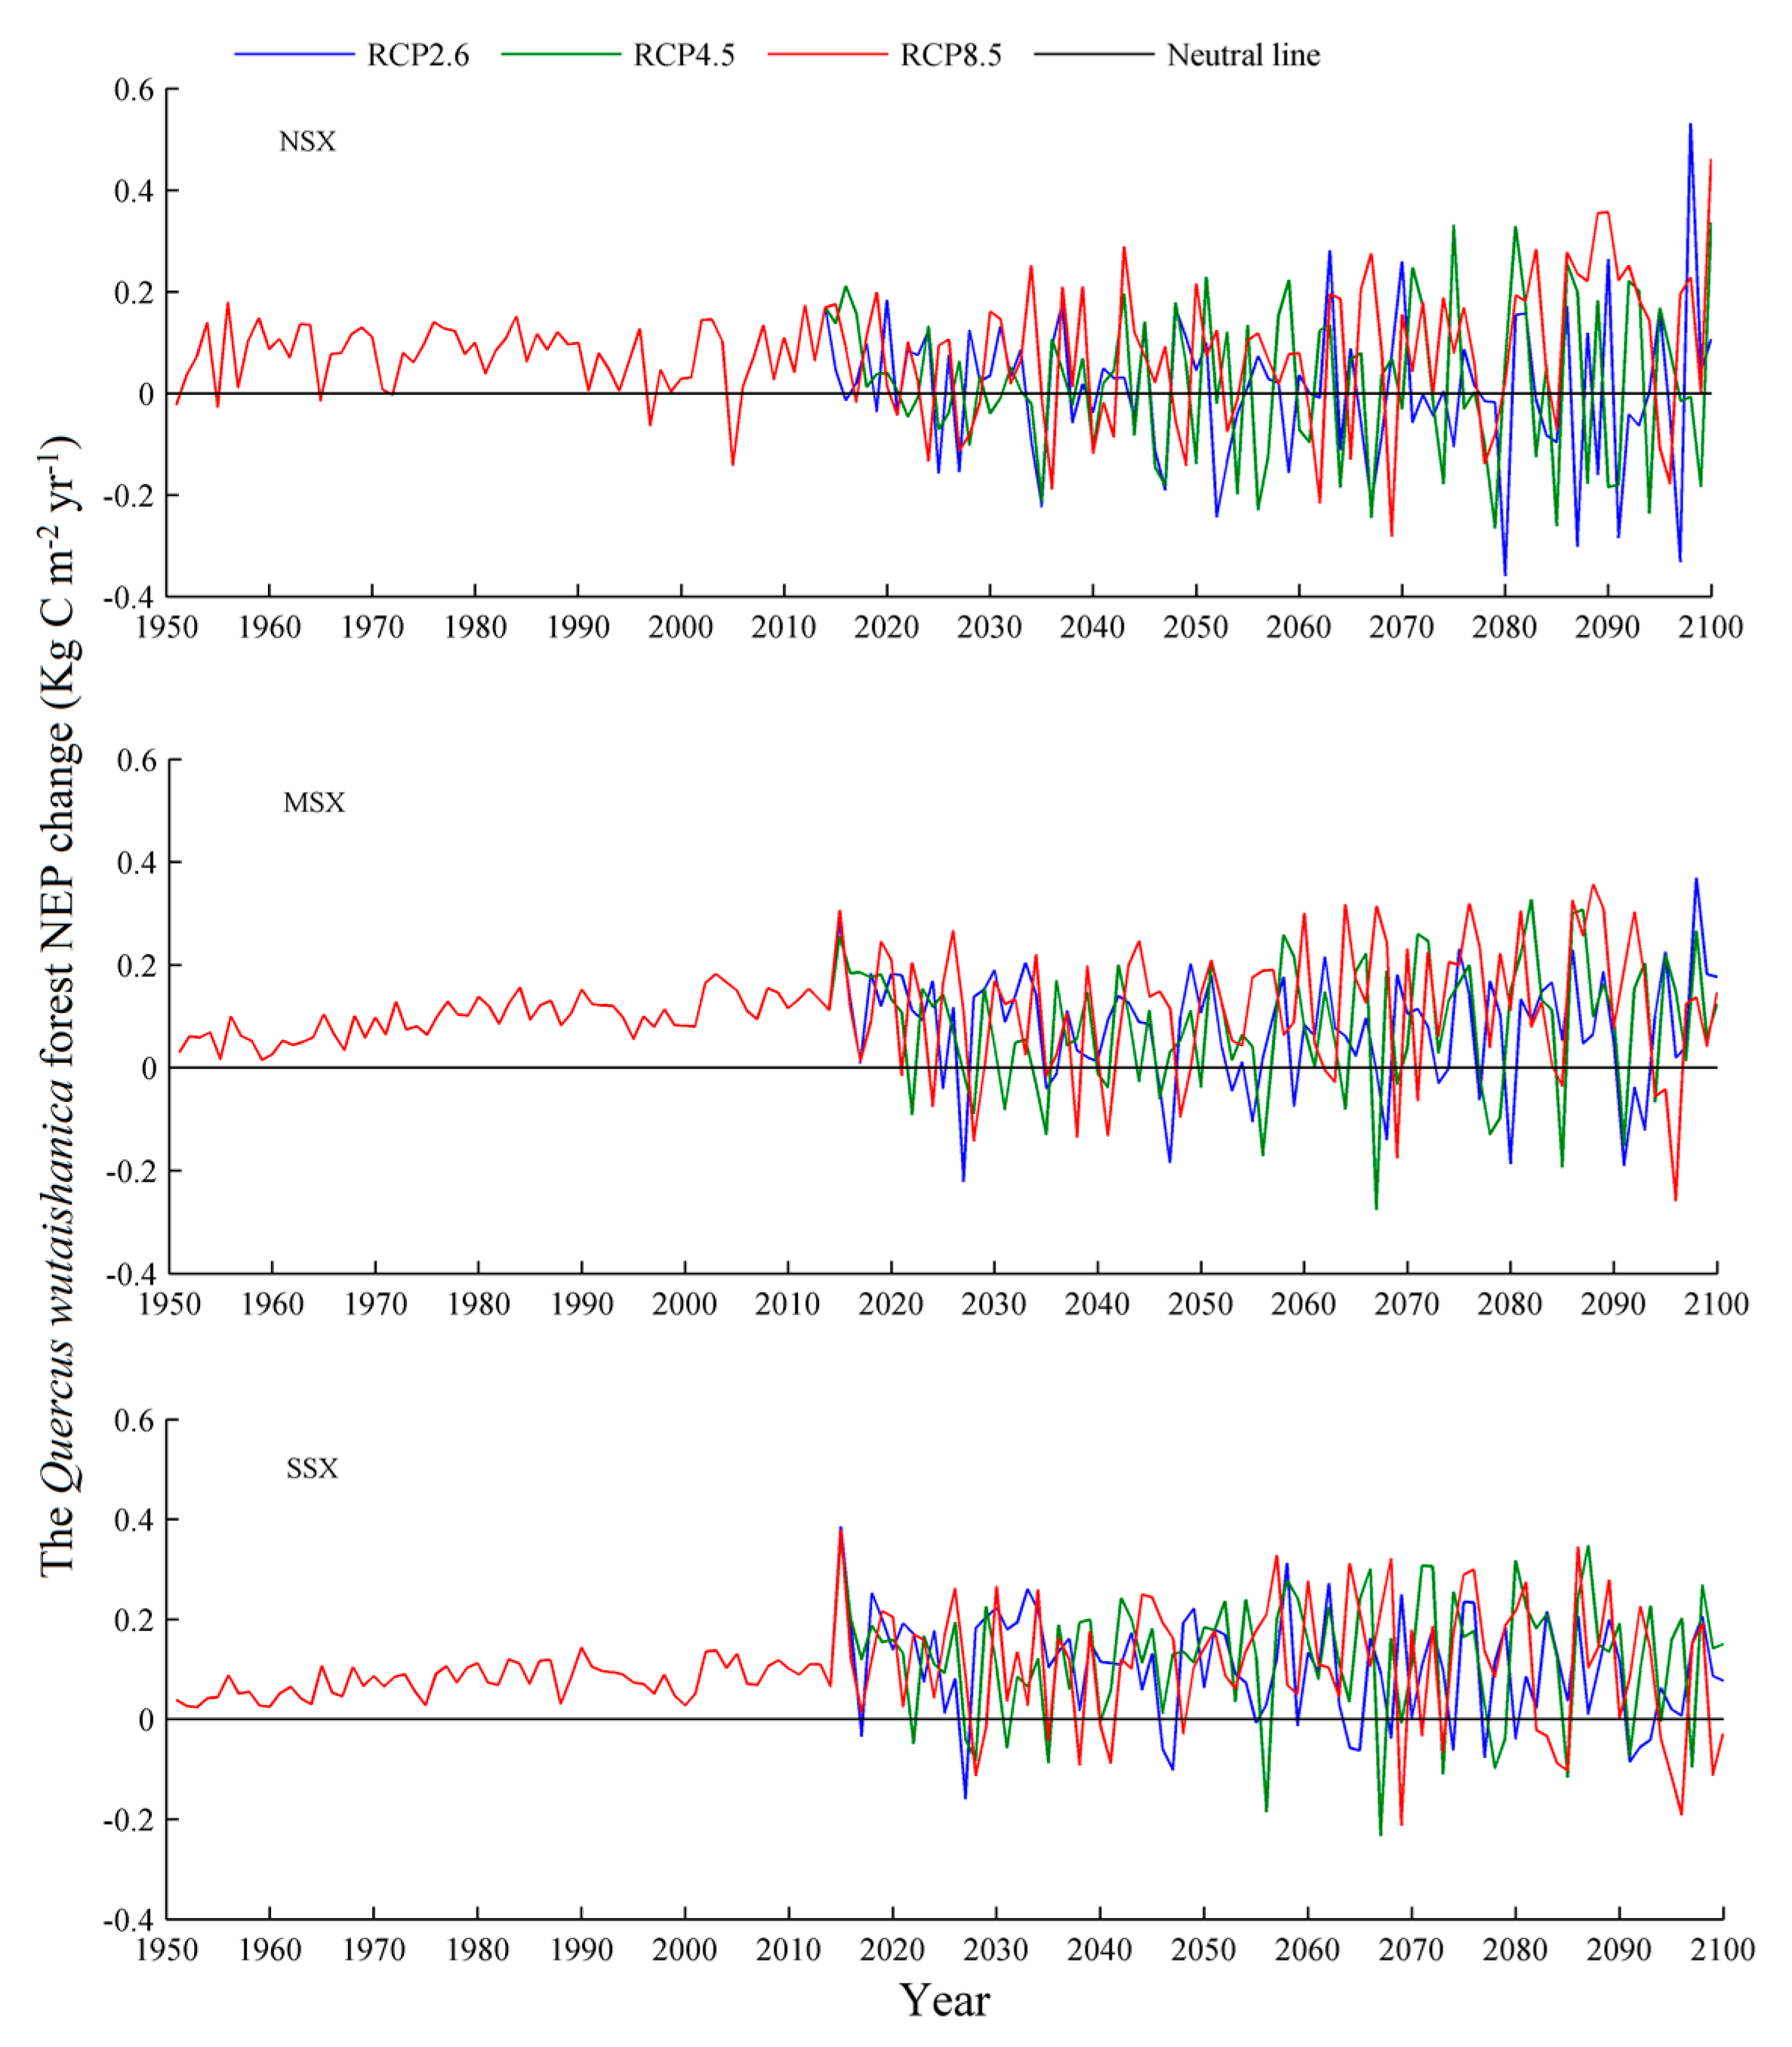
Historically, plantations and natural secondary forests in the arid and humid regions were characterized as carbon sinks, with a more powerful carbon sink function in the humid regions (Table 2). However, under the three RCP scenarios, the average NEPs of R. pseudoacacia and Q. wutaishanica forests in arid regions were predicted to range between 5.8–78.3 g C m−2 yr−1 and 30.2–63.1 g C m−2 yr−1, respectively, and the average NEPs in humid regions were predicted as 78.5–124.9 g C m−2 yr−1 and 83.9–131.2 g C m−2 yr−1, respectively. Therefore, in the future, we expect the carbon sink function of humid forests to increase, and that of arid forests to decrease, possibly becoming a carbon source (Table 2, Figure 3 and Figure 4). In addition, we also found that the average NEP of the two forest types was predicted as 5.8–78.3 g C m−2 yr−1 in arid areas and 78.5–131.2 g C m−2 yr−1 in humid regions in the future, which was increased with emission intensity.
In terms of NEP trends, Q. wutaishanica forest NEP showed a downward trend under the three RCP scenarios. Among them, NSX and SSX displayed significantly downward trends under the RCP2.6 scenario, which reached 16.0 g C m−2 10 yr−1. Q. wutaishanica forest NEP in NSX showed a larger downward trend than that in MSX and SSX. R. pseudoacacia forest NEP showed a downward trend under the RCP2.6 scenario, while it showed an upward trend under the RCP4.5 and RCP8.5 scenarios, with a significant change in the RCP8.5 scenario in NSX, which was 16.0 g C m−2 10 yr−1. The NEP trend of R. pseudoacacia forests in the study area was greater than that of Q. wutaishanica forests under the three RCP scenarios.

3.2. Soil Heterotrophic Respiration

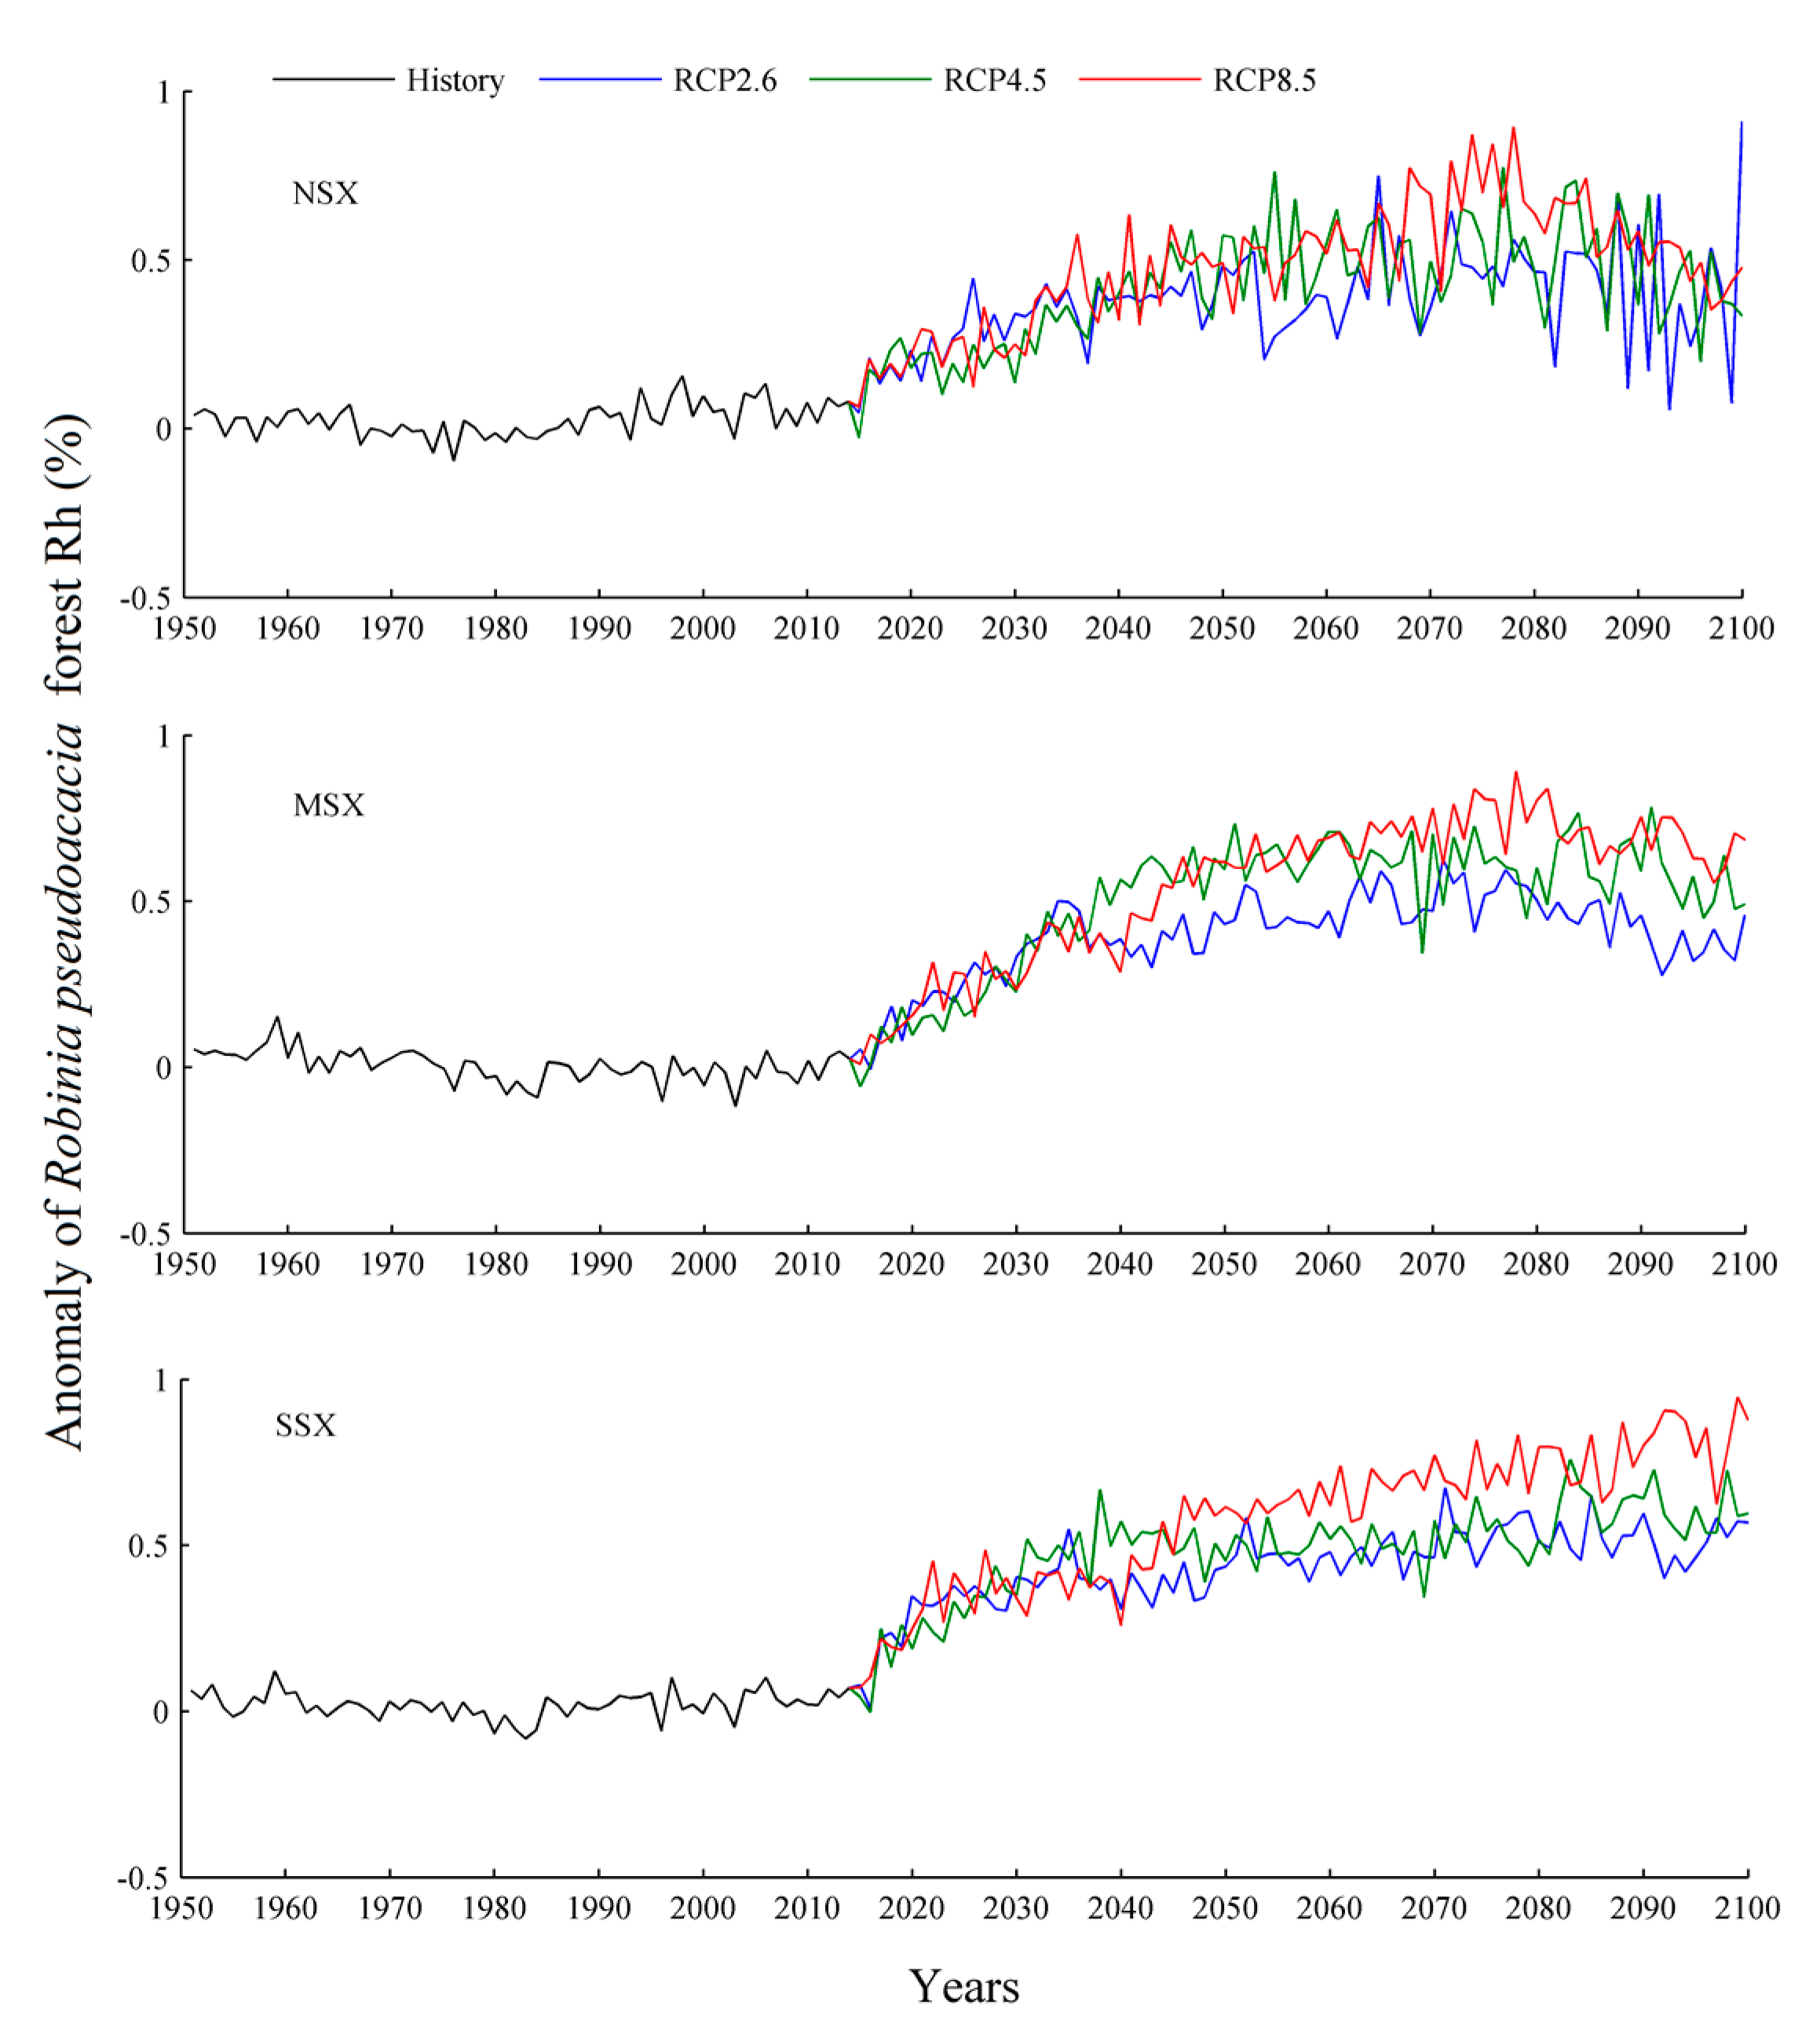
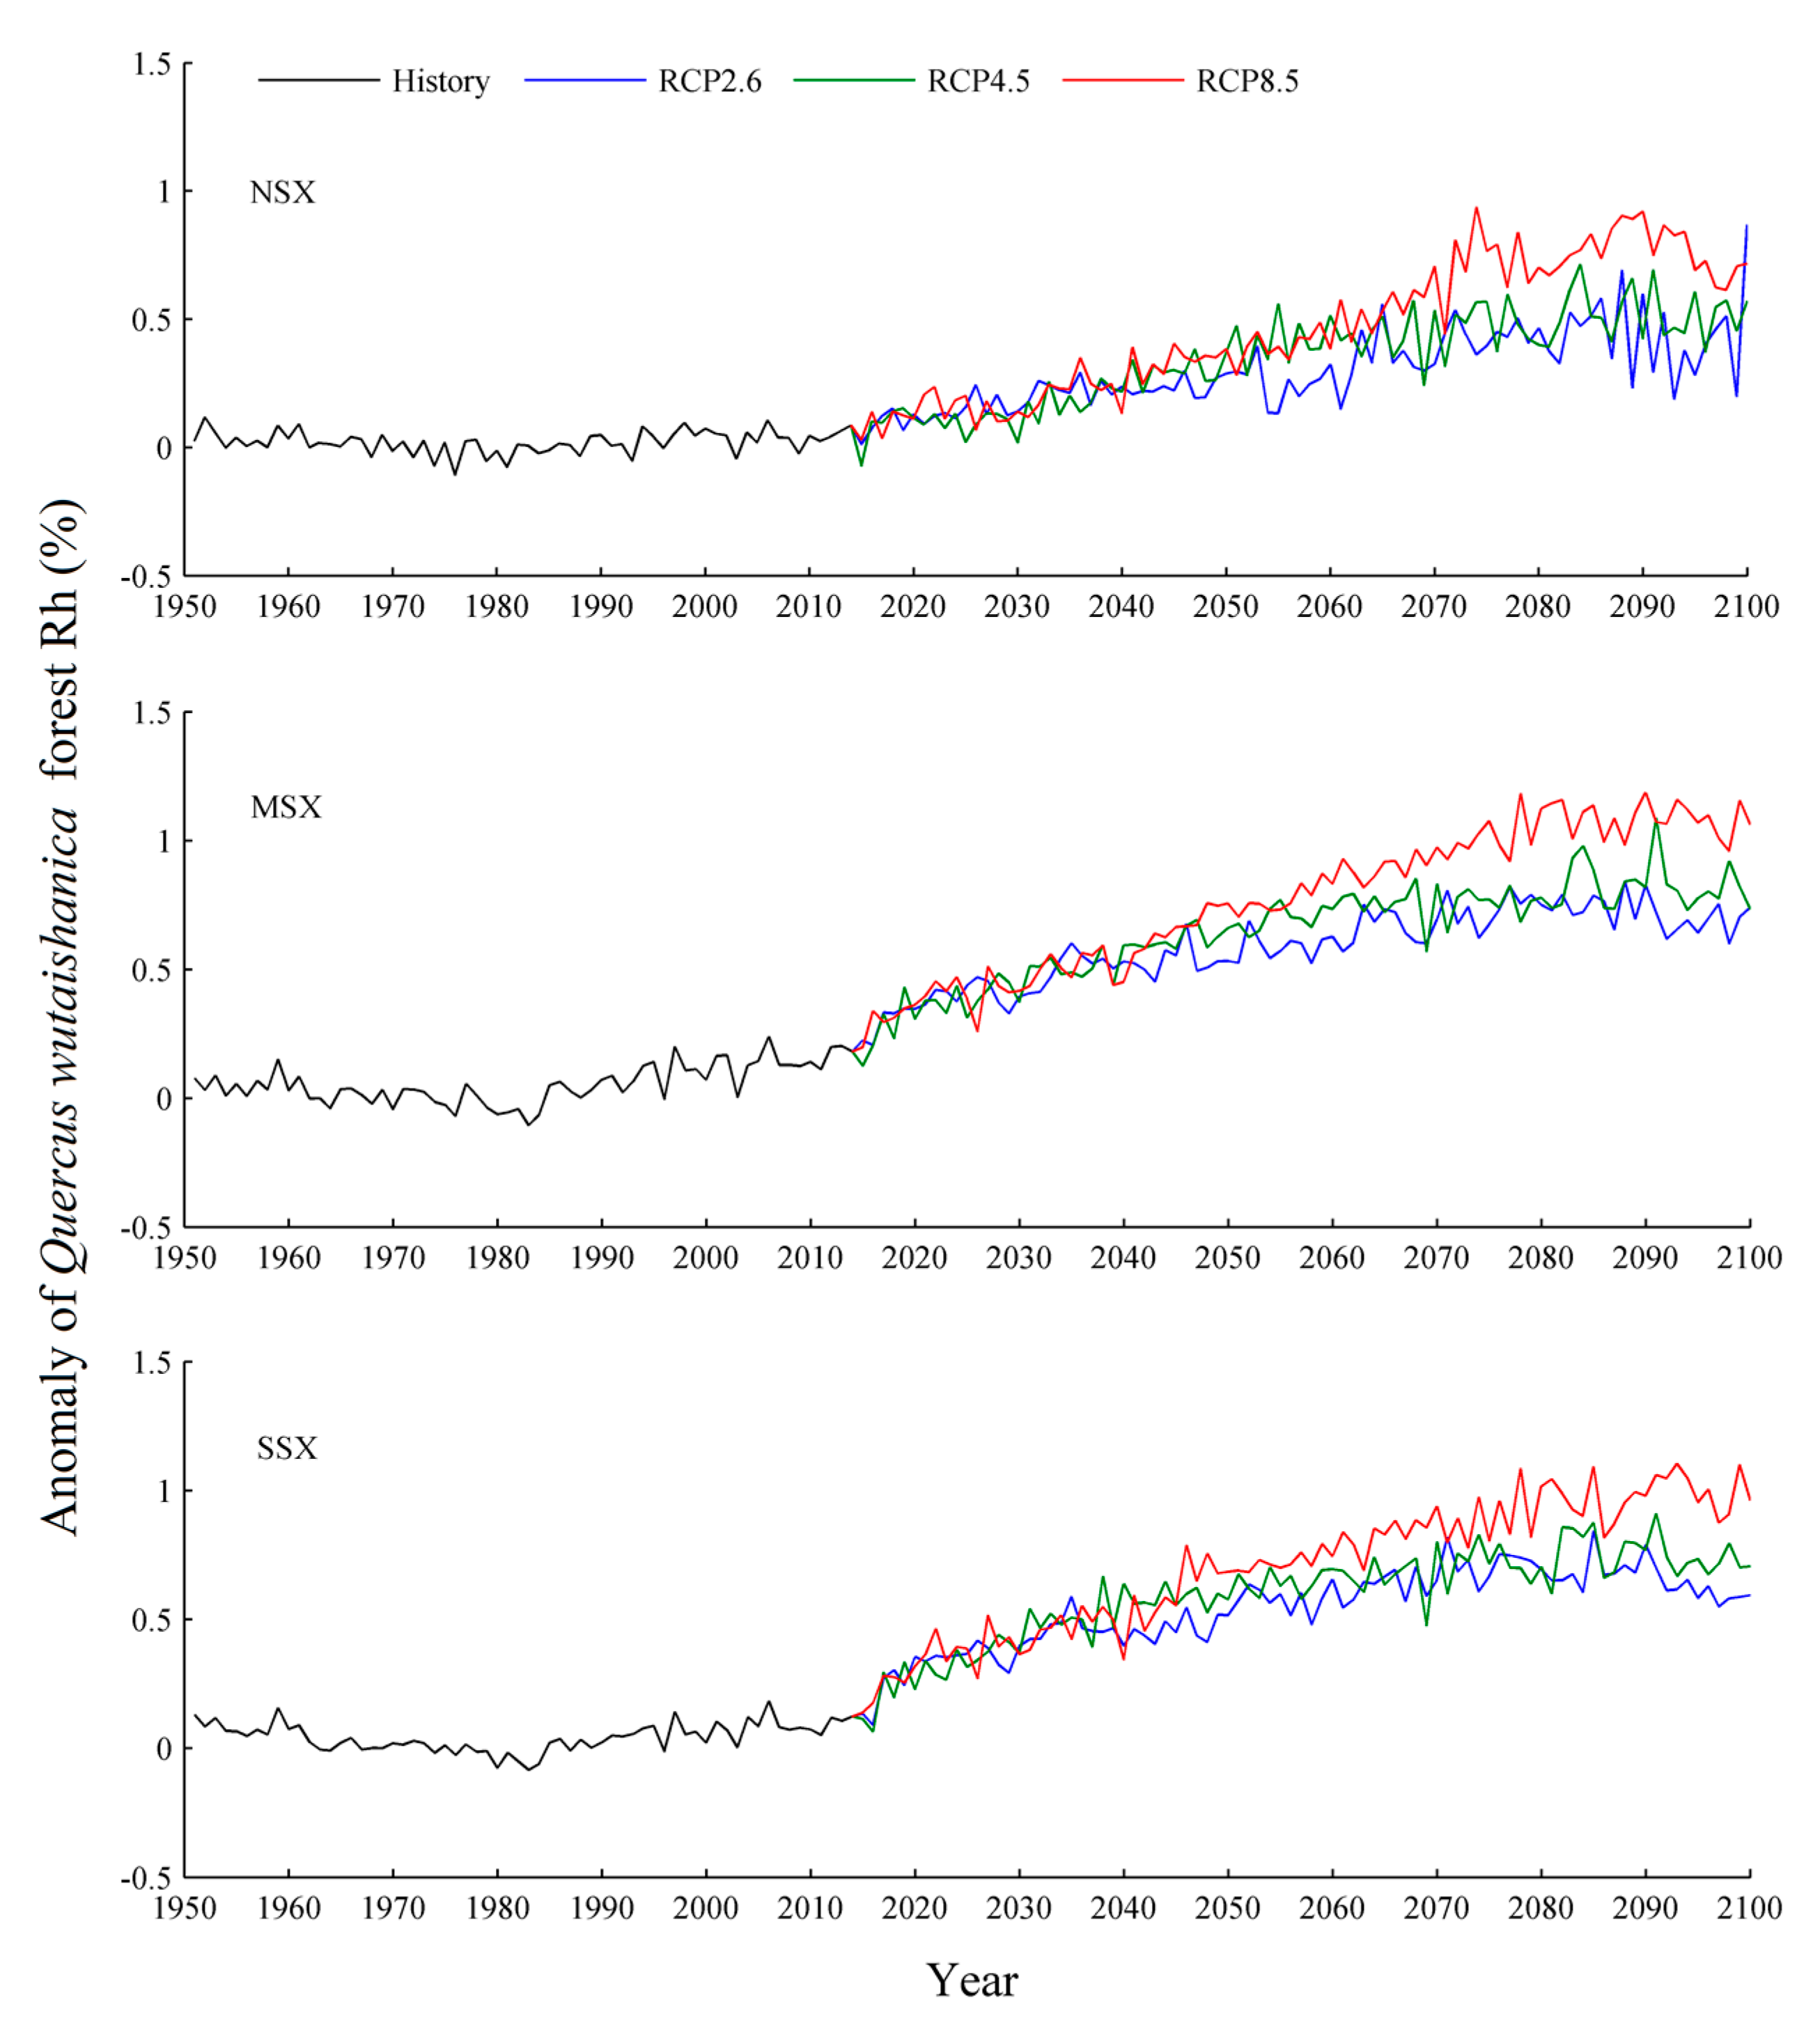
In both the historical and future periods, the average and anomaly values of both forests’ Rh were lower in NSX than those in MSX and SSX (Table 3). Compared with 1961–1990, forest Rh in arid regions was predicted to increase by 30.0–47.9% in the future, while forest Rh in humid regions would increase by 39.8–77.1%, which would increase with increasing emission intensity (Figure 5 and Figure 6). Therefore, there may be more carbon loss from forest soils in humid regions in the future. In addition, different forest ecosystems have different Rh increments. Specifically, both historically and in the future, the average Rh value of Q. wutaishanica forests was higher than that of R. pseudoacacia forests, but the anomaly values of R. pseudoacacia forests in NSX were larger than those of Q. wutaishanica forests in the future period.

3.3. Sensitivity of NPP to Temperature, Precipitation, and CO2 Concentration

This study used the simulated values from 1961 to 1990 as the comparison baseline (C1P1T1 scenario) to study the sensitivity of forest NPP to climate factors and CO2 concentration in arid and humid regions (Table 4 and Table 5). In NSX, the R. pseudoacacia and Q. wutaishanica forest NPP increased by 13.0–18.4% and 7.2–30.4% respectively, by increasing precipitation alone, and NPP increased by 20.5–27.7% and 18.0–31.3%, respectively, by increasing CO2 concentration alone. Precipitation was the main limiting factor for forest NPP growth in low-level scenarios +15%, and in high-level scenarios +30% the NPP showed a relatively intense response to atmospheric CO2 concentration. Meanwhile increasing temperature alone had a negative effect on R. pseudoacacia and Q. wutaishanica forest NPP, which decreased by 11.4–29.0% and 2.7–20.7%, respectively. In MSX and SSX, when considered independently, increasing temperature would decrease forest NPP, and CO2 concentration would increase forest NPP; the response of forest NPP to precipitation is less intense. The NPP of R. pseudoacacia and Q. wutaishanica forests would increase by 1.2–7.9% and −0.7–6.9%, respectively.
When considering factors in combination, forest NPP values in both arid and humid areas were most sensitive to different combinations of precipitation and CO2 concentration. NPP of R. pseudoacacia and Q. wutaishanica forests increased by 18.1–51.9% and 7.8–53.0% (in C2P2T1, C2P3T1, C3P2T1, and C3P3T1 scenarios), respectively. Moreover, the response of forest NPP to the combination scenario of precipitation and CO2 concentration was more intense in arid areas. Simultaneously, NPP of R. pseudoacacia and Q. wutaishanica forests changed by −3.6–36.6% and 5.6–41.2%, respectively, in NSX and changed by −17.0–23.7% and –19.5–11.6%, respectively, in MSX and SSX with simultaneous changes in temperature, precipitation, and CO2 concentration (in C2P2T2, C3P2T2, C2P3T2, C2P2T3, C3P3T2, C2P3T3, C3P2T3, and C3P3T3 scenarios). These values were lower than forest NPP values only considering the increases in precipitation and CO2 concentration.

4. Discussion

4.1. Sensitivity of Forests to Precipitation, Temperature, and CO2 Concentration

In this study, we selected two forest ecosystems of different origins to assess the sensitivity of forests to temperature, precipitation, and CO2 concentration in different climatic zones, by quantifying the contribution of these climatic factors to forest NPP.
Our research showed that increased precipitation had a great positive effect on NPP in the arid region, which is attributed to increased precipitation supplementing soil water content, reducing water stress caused by excessive transpiration, and increasing stomatal conductance, thus increasing forest CO2 intake and NPP. Forest growth was also observed to be more sensitive to precipitation change in arid and semi-arid areas such as the south of the United States, Central Asia, the south of South America, the south of Africa, and Australia [27], and in temperate semi-arid areas of the southern hemisphere [28] than in humid areas, which is attributed to the precipitation increase, reducing NPP by decreasing radiation input, increasing nutrient leaching, or reducing the soil oxygen availability when soil moisture can already support forest growth [29]. Specifically, high rainfall decreases decomposition rates of soil organic matter because the slow diffusion of oxygen through water-filled soil pores cannot match aerobic demand by roots and microbes. While oxygen limitation did not appear to affect plant growth directly, slower decomposition rates decrease nutrient availability and limit the supply of nutrients for plant growth [30].
Considering solely the temperature increase, forest NPP decreased in both arid and humid regions. Temperature-related forest NPP reduction is mainly due to water stress caused by high evapotranspiration and reduction of stomatal conductance to reduce CO2 uptake [31,32], although increasing temperature can also increase NPP by prolonging the growing season [33]. When the temperature continues to increase, forest NPP may even be lower than the base period, at which time the reduction of NPP caused by temperature cannot be compensated for by increasing precipitation and the fertilization effect of CO2 (the C2P2T3 and C2P3T3 scenarios in MSX and SSX). However, this conclusion may not be suitable for forest ecosystems in middle and high latitudes and high altitudes. Previous studies have shown that the sensitivity of forest NPP to temperature is higher with the increase of future temperature in the northwest of the United States [27], and forest NPP increases with increasing temperature in the Tianshan and Qilian Mountains of China [13,14]. This difference should be attributed to the fact that temperature is the main factor limiting forest growth in the middle and high latitudes and high altitudes. Temperature rise can promote forest photosynthesis in these areas, which is one of the important processes in NPP growth. Photosynthesis response to temperature can be described as a parabola around the best temperature value. Below this temperature, photosynthesis increases with the increase of temperature, and above this temperature, photosynthesis decreases with the increase of temperature owing to the decrease of stomatal conductance and transpiration. In addition, our simulation may neglect the possible thermal adaptation of plants (in terms of respiration and photosynthesis). The thermal adaptation of forest photosynthesis may have a greater impact [34,35].
In the LPJ-GUESS model, there is a linear relationship between the concentration of CO2 inside and outside plant cells. The CO2 concentration inside plant cells increases with increasing CO2 concentration outside plant cells; therefore, when the CO2 concentration outside the plant cell increases, carbon assimilation will also increase. In this study, increasing CO2 concentration alone had a positive effect in all three subregions. This result is different from previous studies. One study found that forest NPP increased by only about 2.7% under increased CO2 concentration alone (from 355 to 710 ppmv) [13], and another study found that forest NPP declined under a 12-year sustained CO2 fertilization experiment (maintained at 550 ppmv) [36]. These differences may be attributed to the fact that the CO2 concentration used in this study did not reach the critical point of intracellular carboxylation reaction, i.e., we increased CO2 concentration by a maximum of 30% on the basis of the historical period, to about 494 ppmv.

4.2. Soil Heterotrophic Respiration

At present, many studies have shown that future climate change will promote soil heterotrophic respiration [37,38]. The results of this study showed that future climate change under three RCP scenarios had a positive effect on forest soil heterotrophic respiration in arid and humid regions, which is consistent with previous studies. In our previous work, the temperature and CO2 concentration in arid and humid regions changed significantly under three RCP scenarios, but precipitation did not change significantly [10]. Therefore, the increase of soil heterotrophic respiration under future climate change can be attributed to the increased temperature promoting microbial activity, which could increase the decomposition rate of soil organic matter carbon [39]. Additionally, the CO2 increase can introduce more decomposition substrates for underground carbon pools [40].
In addition, our study also found that soil Rh in arid areas was lower than that in wet areas. In LPJ-GUESS, the key factors affecting Rh are soil temperature and soil moisture, which affect Rh intensity by affecting the decomposition rate of the litter and soil organic carbon pools [40]. Therefore, the above phenomenon can be attributed to the fact that the lower soil moisture in arid regions limits the diffusion of organic matter in the soil, resulting in matrix limitations [41]. Furthermore, the high temperature and low humidity environment is not conducive to the growth and reproduction of soil microorganisms, which reduces both the microbial biomass and microbial activity [42], thus reducing the decomposition rate of soil organic carbon, resulting in a smaller Rh. Additionally, studies have shown that atmospheric nitrogen deposition can significantly reduce soil Rh in temperate forests, which is attributed to the decrease of soil microbial biomass and litter decomposition rate after high level of nitrogen deposition [43,44]. Contrastingly, other studies have come to the opposite conclusion, which is attributed to the increase of soil microbial biomass and activity, followed by the increase of soil Rh [45]. In this study, the increase of soil Rh with increasing climate emission intensity is not caused by one factor, but the result of multiple factors. As the study did not investigate nitrogen deposition, whether nitrogen deposition was positive or negative is uncertain, which will be the direction of our future research.

4.3. Net Ecosystem Productivity

Theoretically, when the ecosystem is in the mature stage, i.e., the climax community, it is in equilibrium with both the climate and the soil, and the carbon balance should be approximately zero. However, when the environment changes, for example climate change or elevated atmospheric CO2, the carbon balance of the ecosystem can be lost [46]. Therefore, it is helpful to understand the uncertainty of carbon sources and sinks in future forest ecosystems by studying the dynamics of forest NEP under climate change with long time series. In this study, our simulation results showed that, in the arid area, forest NEP will decrease, and forests may become a carbon source in the future. This may be mainly attributed to the lower soil moisture content in the arid area, as potential evapotranspiration in this region is greater than precipitation. Contrastingly, in the humid area, forest NEP will increase, and forests will become a larger carbon sink in the future, which is attributed to the water and heat state in this area being more suitable for forest growth, as well as the effect of atmospheric nitrogen deposition being more apparent in humid regions [47]. Our results also show that forest NEP increases with the increase of emission intensity in future climate change, which may be attributed to higher CO2 concentration in high emission intensity, because forest NPP is most sensitive to increases in CO2 concentration, which only provides more organic carbon for the forest’s underground carbon pool but does not directly promote soil Rh. In addition, our results suggest that rising temperature has a negative effect on forest NPP, but this negative effect may be offset by CO2 fertilization under future climate change. As the NEP of forest ecosystems depends on the relationship between NPP and Rh growth ratio under future climate change, when the NPP growth ratio is larger than Rh, the ecosystem is a carbon sink. Conversely, when the NPP growth ratio is smaller than Rh, the ecosystem is a carbon source, and the greater the difference between the two ratios, the greater the change of NEP. Therefore, the factors affecting NPP and Rh discussed in Section 4.1 and Section 4.2 can indirectly affect the interannual variation of forest NEP. In other words, the interannual change of forest NEP is the result of the combined action of temperature, precipitation, CO2 concentration, and other factors. In the above discussion, we focus only on the main factors that affect NEP in different climatic regions under climate change.
In addition to the above factors, atmospheric cloud cover and atmospheric diffuse radiation may play important roles in the annual changes of forest NEP [48,49,50]. First, the atmospheric clouds and aerosols can change the spectral composition of solar radiation and increase the proportion of blue light [51,52]; second, the increased clouds and aerosols can reduce direct radiation, reduce the light saturation frequency of photosynthesis in the forest canopy, and make the canopy more sensitive to radiation changes [53]; finally, diffuse radiation can penetrate the forest canopy more effectively and increase the total photosynthesis of the ecosystem [54].

4.4. Uncertainty Analysis

The ecosystem model we used has multiple uncertainties. As an example, in the LPJ-GUESS model, the equation for simulating root respiration is:
R m = 0.095218 × C C : N × g ( T )
where C is the carbon mass of roots and C:N is the constant ratio of carbon and nitrogen of roots (C:N = 29); g is a dimensionless temperature response function. However, previous studies have shown that under drought conditions, the root system is affected by photosynthesis and reduces respiration [55,56], which is not reflected in the LPJ-GUESS model. In addition, the LPJ-GUESS model only simulates the impact of climate on vegetation, but ignores the feedback of vegetation on climate, which will bring great uncertainty to the research. These limitations within models such as our own may aggravate or mitigate the impact of climate factors on vegetation dynamics and may affect the accuracy of simulations [57]. Therefore, overcoming these limitations is the next direction in which ecosystem process models should be developed. However, as this study focuses on the differences of the carbon cycle in forest ecosystems between different climatic zones, we considered the conclusions of this study to be reasonable despite these limitations.

5. Conclusions

In conclusion, a process-based LPJ-GUESS model was used to study the carbon source and sink function, potential changes in soil carbon dynamics and their sensitivity to climate factors, and CO2 concentration of forest ecosystems in typical arid and humid regions under historical and future climate conditions using three carbon cycle indices (NEP, Rh, and NPP). Specifically, in the historical period, the forests in the study area were all carbon sinks, while in the future, these sinks became stronger in forests in humid regions, but forests in arid regions became weaker carbon sinks with the potential to become carbon sources. Additionally, the forest NEP in the whole study area was predicted to increase with increasing emission intensity. Moreover, soil Rh in arid regions was lower than that in humid regions in both the historical and future periods, and soil Rh is predicted to increase with increasing emission intensity across the whole study area. Therefore, there may be more carbon loss in forest soils in humid regions under future climate change. In addition, our study also found that the increasing temperature would decrease NPP, and increasing CO2 concentration would decrease NPP in the study area (under C1P1T2 and C1P1T3 scenarios, the NPP of R. pseudoacacia and Q. wutaishanica forests would decrease by 7.6–29.5% and 2.7–33.2%, respectively, and under C2P1T1 and C3P1T1 scenarios, the NPP of R. pseudoacacia and Q. wutaishanica forests would increase by 7.2–45.9% and 4.0–31.3%, respectively), and when considering different combinations of those factors, NPP of both forests is most sensitive to a combination of precipitation and CO2 concentration (under C2P2T1, C2P3T1, C3P2T1, and C3P3T1 scenarios, the NPP of R. pseudoacacia and Q. wutaishanica forests would increase by 18.1–51.9% and 7.8–53.0%, respectively). We believe our research could be applied to help policy makers in planning sustainable forest management under future climate change.

Supplementary Materials

The following are available online at https://www.mdpi.com/1999-4907/10/12/1150/s1, Table S1: The plots general characteristics of Shaanxi province, Table S2: Allometric growth equation for the two tree species.

Author Contributions

Conceptualization, S.L. and Y.C.; methodology, S.L. and S.P.; software, S.P.; formal analysis, S.L., Y.C., and S.P.; investigation, S.L.; resources, Y.C.; data curation, S.L.; writing—original draft preparation, S.L.

Funding

This research was funded by the National Key Research and Development Project: Key Technology and Demonstration of Vegetation Function Improvement and Mountain Orchard Management in Loess Hilly and Gully Area (No. 2016YFC0501703), General Program of National Fund: Study on Water and Nutrient Mechanism of Robinia pseudoacacia Plantation in Loess Hilly Area (No. 41771556), and Research and Development Project of Shaanxi Provincial Bureau of Water and Soil Conservation: Integration and Demonstration of Key Technologies for Near Natural Soil and Water Conservation on Qinba Mountain Slope (No. 2017sbkj-01).

Conflicts of Interest

The authors declare no conflict of interest.

References

  1. IPCC. Climate Change 2013: The Physical Science Basis. Contribution of Working Group I to the Fifth Assessment Report of the Intergovernmental Panel on Climate Change; Stocker, T.F., Qin, D., Plattner, G.-K., Tignor, M., Allen, S.K., Boschung, J., Nauels, A., Xia, Y., Bex, V., Midgley, P.M., Eds.; Cambridge University Press: Cambridge, UK, 2013; p. 1535. [Google Scholar]
  2. Heimann, M.; Reichstein, M. Terrestrial ecosystem carbon dynamics and climate feedbacks. Nature 2008, 451, 289–292. [Google Scholar] [CrossRef]
  3. Zheng, J.L.; Mao, F.J.; Du, H.Q.; Li, X.J.; Zhou, G.M.; Dong, L.F.; Zhang, M.; Han, N.; Liu, T.Y.; Xing, L.Q. Spatiotemporal simulation of net ecosystem productivity and its response to climate change in subtropical forests. Forests 2019, 10, 708. [Google Scholar] [CrossRef] [Green Version]
  4. Poulter, B.; Hattermann, F.; Hawkins, E.D.; Zaehle, S.; Sitch, S.; Restrepo-Coupe, N.; Heyder, U.; Cramer, W. Robust dynamics of Amazon dieback to climate change with perturbed ecosystem model parameters. Glob. Chang. Biol. 2010, 16, 2476–2495. [Google Scholar] [CrossRef]
  5. Feng, X.; Uriarte, M.; Gonzalez, G.; Reed, S.; Thompson, J.; Zimmerman, J.K.; Murphy, L. Improving predictions of tropical forest response to climate change through integration of field studies and ecosystem modeling. Glob. Chang. Biol. 2018, 24, e213–e232. [Google Scholar] [CrossRef]
  6. Piao, S.; Ciais, P.; Lomas, M.; Beer, C.; Liu, H.; Fang, J.; Friedlingstein, P.; Huang, Y.; Muraoka, H.; Son, Y.; et al. Contribution of climate change and rising CO2 to terrestrial carbon balance in East Asia: A multi-model analysis. Glob. Planet. Chang. 2011, 75, 133–142. [Google Scholar] [CrossRef]
  7. Morales, P.; Sykes, M.T.; Prentice, I.C.; Smith, P.; Smith, B.; Bugmann, H.; Zierl, B.; Friedlingstein, P.; Viovy, N.; Sabate, S.; et al. Comparing and evaluating process–based ecosystem model predictions of carbon and water fluxes in major European forest biomes. Glob. Chang. Biol. 2005, 11, 2211–2233. [Google Scholar] [CrossRef]
  8. Piao, S.; Fang, J.; Zhou, L.; Zhu, B.; Tan, K.; Tao, S. Changes in vegetation net primary productivity from 1982 to 1999 in China. Glob. Biogeochem. Cycles 2005, 19, GB2027. [Google Scholar] [CrossRef] [Green Version]
  9. Ren, G.; Ding, Y.; Zhao, Z.; Zheng, J.; Wu, T.; Tang, G.; Xu, Y. Recent progress in studies of climate change in China. Adv. Atmos. Sci. 2012, 29, 958–977. [Google Scholar] [CrossRef]
  10. Ding, Y.; Liang, S.; Peng, S. Climate change affects forest productivity in a typical climate transition region of China. Sustainability 2019, 11, 2856. [Google Scholar] [CrossRef] [Green Version]
  11. Liu, W.; Sang, T. Potential productivity of the Miscanthus energy crop in the Loess Plateau of China under climate change. Environ. Res. Lett. 2013, 8, 044003. [Google Scholar] [CrossRef]
  12. Nayak, R.K.; Patel, N.R.; Dadhwal, V.K. Spatio-temporal variability of net ecosystem productivity over India and its relationship to climatic variables. Environ. Earth Sci. 2015, 74, 1743–1753. [Google Scholar] [CrossRef]
  13. Su, H.; Sang, W.; Wang, Y.; Ma, K. Simulating Picea schrenkiana forest productivity under climatic changes and atmospheric CO2 increase in Tianshan Mountains, Xinjiang Autonomous Region, China. For. Ecol. Manag. 2007, 246, 273–284. [Google Scholar] [CrossRef]
  14. Peng, S.; Zhao, C.; Chen, Y.; Xu, Z. Simulating the productivity of a subalpine forest at high elevations under representative concentration pathway scenarios in the Qilian Mountains of northwest China. Scand. J. For. Res. 2017, 32, 166–173. [Google Scholar] [CrossRef]
  15. Keenan, T.F.; Baker, I.; Barr, A.; Ciais, P.; Davis, K.; Dietze, M.; Dragoni, D.; Gough, C.M.; Grant, R.; Hollinger, D.; et al. Terrestrial biosphere model performance for inter–annual variability of land–atmosphere CO2 exchange. Glob. Chang. Biol. 2012, 18, 1971–1987. [Google Scholar] [CrossRef]
  16. Law, B.E.; Turner, D.; Campbell, J.; Sun, O.J.; Van Tuyl, S.; Ritts, W.D.; Cohen, W.B. Disturbance and climate effects on carbon stocks and fluxes across Western Oregon USA. Glob. Chang. Biol. 2004, 10, 1429–1444. [Google Scholar] [CrossRef]
  17. Smith, B.; Warlind, D.; Arneth, A.; Hickler, T.; Leadley, P.; Siltberg, J.; Zaehle, S. Implications of incorporating N cycling and N limitations on primary production in an individual-based dynamic vegetation model. Biogeosciences 2014, 10, 18613–18685. [Google Scholar] [CrossRef] [Green Version]
  18. Zhao, D.; Wu, S.; Yin, Y. Responses of terrestrial ecosystems’ net primary productivity to future regional climate change in China. PLoS ONE 2013, 8, e60849. [Google Scholar] [CrossRef] [Green Version]
  19. Ahlstrom, A.; Xia, J.; Arneth, A.; Luo, Y.; Smith, B. Importance of vegetation dynamics for future terrestrial carbon cycling. Environ. Res. Lett. 2015, 10, 054019. [Google Scholar] [CrossRef]
  20. Ma, Q.; Liu, K.; Zhang, H. Carbon storage by forest vegetation and its spatial distribution in shaanxi. Resour. Sci. 2012, 34, 1781–1789. (In Chinese) [Google Scholar]
  21. Sitch, S.; Smith, B.; Prentice, I.C.; Arneth, A.; Bondeau, A.; Cramer, W.; Kaplan, J.O.; Levis, S.; Lucht, W.; Sykes, M.T.; et al. Evaluation of ecosystem dynamics, plant geography and terrestrial carbon cycling in the LPJ dynamic global vegetation model. Glob. Chang. Biol. 2003, 9, 161–185. [Google Scholar] [CrossRef]
  22. Harris, I.; Jones, P.D.; Osborn, T.J.; Lister, D.H. Updated high-resolution grids of monthly climatic observations—The CRU TS3.10 Dataset. Int. J. Climatol. 2014, 34, 623–642. [Google Scholar] [CrossRef] [Green Version]
  23. Peng, S.; Gang, C.; Cao, Y.; Chen, Y. Assessment of climate change trends over the Loess Plateau in China from 1901 to 2100. Int. J. Climatol. 2018, 38, 2250–2264. [Google Scholar] [CrossRef]
  24. Moss, R.H.; Edmonds, J.A.; Hibbard, K.A.; Manning, M.R.; Rose, S.K.; van Vuuren, D.P.; Carter, T.R.; Emori, S.; Kainuma, M.; Kram, T.; et al. The next generation of scenarios for climate change research and assessment. Nature 2010, 463, 747–756. [Google Scholar] [CrossRef]
  25. Attaur, R.; Dawood, M. Spatio–statistical analysis of temperature fluctuation using Mann–Kendall and Sen’s slope approach. Clim. Dynam. 2017, 48, 783–797. [Google Scholar]
  26. Song, B.L. Study on Biomass, Carbon and Nitrogen Pool and Carbon Sequestration Characteristics of Two Typical Forest Ecosystems in Loess Hilly. Ph.D. Thesis, University of Chinese Academy of Sciences, Beijing, China, 2015. (In Chinese). [Google Scholar]
  27. Liu, Y.; Wang, T.; Huang, M.; Yao, Y.; Ciais, P.; Piao, S. Changes in interannual climate sensitivities of terrestrial carbon fluxes during the 21st century predicted by CMIP5 Earth System Models. J. Geophys. Res. Biogeosci. 2016, 121, 903–918. [Google Scholar] [CrossRef] [Green Version]
  28. Dai, A. Increasing drought under global warming in observations and models. Nat. Clim. Chang. 2012, 3, 52–58. [Google Scholar] [CrossRef]
  29. Schuur, E. Productivity and global climate revisited: The sensitivity of tropical forest growth to precipitation. Ecology 2003, 84, 1165–1170. [Google Scholar] [CrossRef]
  30. Schuur, E.A.; Matson, P.A. Net primary productivity and nutrient cycling across a mesic to wet precipitation gradient in Hawaiian montane forest. Oecologia 2001, 128, 431–442. [Google Scholar] [CrossRef]
  31. Peng, S.; Ding, Y.; Wen, Z.; Chen, Y.; Cao, Y.; Ren, J. Spatiotemporal change and trend analysis of potential evapotranspiration over the Loess Plateau of China during 2011–2100. Agric. For. Meteorol. 2017, 233, 183–194. [Google Scholar] [CrossRef] [Green Version]
  32. Digrado, A.; de la Motte, L.G.; Bachy, A.; Mozaffar, A.; Schoon, N.; Bussotti, F.; Amelynck, C.; Dalcq, A.C.; Fauconnier, M.L.; Aubinet, M.; et al. Decrease in the photosynthetic performance of temperate grassland species does not lead to a decline in the gross primary production of the ecosystem. Front. Plant Sci. 2018, 9, 67. [Google Scholar] [CrossRef] [Green Version]
  33. Ainsworth, E.A.; Long, S.P. What have we learned from 15 years of free-air CO2 enrichment (FACE)? A meta-analytic review of the responses of photosynthesis, canopy properties and plant production to rising CO2. New Phytol. 2005, 165, 351–371. [Google Scholar] [CrossRef] [PubMed]
  34. Atkin, O.K.; Tjoelker, M.G. Thermal acclimation and the dynamic response of plant respiration to temperature. Trends Plant Sci. 2003, 8, 343–351. [Google Scholar] [CrossRef]
  35. Medlyn, B.; Dreyer, E.; Ellsworth, D.; Forstreuter, M.; Harley, P.; Kirschbaum, M.; Le Roux, X.; Montpied, P.; Strassemeyer, J.; Walcroft, A.; et al. Temperature response of parameters of a biochemically based model of photosynthesis. II. A review of experimental data. Plant Cell Environ. 2002, 25, 1167–1179. [Google Scholar] [CrossRef] [Green Version]
  36. Norby, R.; Warren, J.; Iversen, C.; Medlyn, B.; McMurtrie, R. CO2 enhancement of forest productivity constrained by limited nitrogen availability. Proc. Natl. Acad. Sci. USA 2010, 107, 19368–19373. [Google Scholar] [CrossRef] [Green Version]
  37. Wang, X.; Liu, L.; Piao, S.; Janssens, I.A.; Tang, J.; Liu, W.; Chi, Y.; Wang, J.; Xu, S. Soil respiration under climate warming: Differential response of heterotrophic and autotrophic respiration. Glob. Chang. Biol. 2014, 20, 3229–3237. [Google Scholar] [CrossRef]
  38. Liu, X.; Chen, S.; Yang, Z.; Lin, C.; Xiong, D.; Lin, W.; Xu, C.; Chen, G.; Xie, J.; Li, Y.; et al. Will heterotrophic soil respiration be more sensitive to warming than autotrophic respiration in subtropical forests? Eur. J. Soil Sci. 2019, 70, 655–663. [Google Scholar] [CrossRef]
  39. Teramoto, M.; Liang, N.S.; Ishida, S.; Zeng, J.Y. Long-term stimulatory warming effect on soil heterotrophic respiration in a cool-temperate broad-leaved deciduous forest in Northern Japan. J. Geophys. Res. Biogeosci. 2018, 123, 1161–1177. [Google Scholar] [CrossRef]
  40. Liu, R.; Li, N.; Su, H.; Sang, W. Simulation and analysis on future carbon balance of three deciduous forests in Beijing mountain area, warm temperate zone of China. Chin. J. Plant Ecol. 2009, 33, 516–534. (In Chinese) [Google Scholar]
  41. Rey, A.; Pegoraro, E.; Tedeschi, V.; De Parri, I.; Jarvis, P.; Valentini, R. Annual variation in soil respiration and its components in a coppice oak forest in Central Italy. Glob. Chang. Biol. 2002, 8, 851–866. [Google Scholar] [CrossRef]
  42. Curiel Yuste, J.; Janssens, I.A.; Carrara, A.; Ceulemans, R. Annual Q10 of soil respiration reflects plant phenological patterns as well as temperature sensitivity. Glob. Chang. Biol. 2004, 10, 161–169. [Google Scholar] [CrossRef]
  43. Janssens, I.A.; Dieleman, W.; Luyssaert, S.; Subke, J.A.; Reichstein, M.; Ceulemans, R.; Ciais, P.; Dolman, A.J.; Grace, J.; Matteucci, G.; et al. Reduction of forest soil respiration in response to nitrogen deposition. Nat. Geosci. 2010, 3, 315–322. [Google Scholar] [CrossRef]
  44. Fan, H.; Wu, J.; Liu, W.; Yuan, Y.; Huang, R.; Liao, Y.; Li, Y. Nitrogen deposition promotes ecosystem carbon accumulation by reducing soil carbon emission in a subtropical forest. Plant Soil 2014, 379, 361–371. [Google Scholar] [CrossRef]
  45. Chen, F.; Yan, G.; Xing, Y.; Zhang, J.; Wang, Q.; Wang, H.; Huang, B.; Hong, Z.; Dai, G.; Zheng, X.; et al. Effects of N addition and precipitation reduction on soil respiration and its components in a temperate forest. Agric. For. Meteorol. 2019, 271, 336–345. [Google Scholar] [CrossRef]
  46. Ji, J.; Huang, M.; Li, K. Prediction of carbon exchanges between China terrestrial ecosystem and atmosphere in 21st century. Sci. China Ser. D Earth Sci. 2008, 51, 885–898. (In Chinese) [Google Scholar] [CrossRef]
  47. Fei, X.; Song, Q.; Zhang, Y.; Liu, Y.; Sha, L.; Yu, G.; Zhang, L.; Duan, C.; Deng, Y.; Wu, C.; et al. Carbon exchanges and their responses to temperature and precipitation in forest ecosystems in Yunnan, Southwest China. Sci. Total Environ. 2018, 616–617, 824–840. [Google Scholar] [CrossRef]
  48. Han, J.; Zhang, L.; Li, S.; Wen, X.; Li, Q.; Wang, H. Effects of sky conditions on net ecosystem productivity of a subtropical coniferous plantation vary from half-hourly to daily timescales. Sci. Total Environ. 2019, 651, 3002–3014. [Google Scholar] [CrossRef]
  49. Jung, M.; Reichstein, M.; Schwalm, C.R.; Huntingford, C.; Sitch, S.; Ahlstrom, A.; Arneth, A.; Camps-Valls, G.; Ciais, P.; Friedlingstein, P.; et al. Compensatory water effects link yearly global land CO2 sink changes to temperature. Nature 2017, 541, 516–520. [Google Scholar] [CrossRef] [Green Version]
  50. Cox, P.M.; Pearson, D.; Booth, B.B.; Friedlingstein, P.; Huntingford, C.; Jones, C.D.; Luke, C.M. Sensitivity of tropical carbon to climate change constrained by carbon dioxide variability. Nature 2013, 494, 341–344. [Google Scholar] [CrossRef]
  51. Gatebe, C.; Kuznetsov, A.; Melnikova, I. Cloud optical parameters from airborne observation of diffuse solar radiation accomplished in USA and USSR in different geographical regions. Int. J. Remote Sens. 2014, 35, 5812–5829. [Google Scholar]
  52. van Gorsel, E.; Berni, J.A.J.; Briggs, P.; Cabello-Leblic, A.; Chasmer, L.; Cleugh, H.A.; Hacker, J.; Hantson, S.; Haverd, V.; Hughes, D.; et al. Primary and secondary effects of climate variability on net ecosystem carbon exchange in an evergreen Eucalyptus forest. Agric. For. Meteorol. 2013, 182–183, 248–256. [Google Scholar] [CrossRef]
  53. Knohl, A.; Baldocchi, D.D. Effects of diffuse radiation on canopy gas exchange processes in a forest ecosystem. J. Geophys. Res. Biogeosci. 2008, 113, G02023. [Google Scholar] [CrossRef]
  54. Cheng, S.J.; Bohrer, G.; Steiner, A.L.; Hollinger, D.Y.; Suyker, A.; Phillips, R.P.; Nadelhoffer, K.J. Variations in the influence of diffuse light on gross primary productivity in temperate ecosystems. Agric. For. Meteorol. 2015, 201, 98–110. [Google Scholar] [CrossRef] [Green Version]
  55. Moyano, F.E.; Kutsch, W.L.; Rebmann, C. Soil respiration fluxes in relation to photosynthetic activity in broad-leaf and needle-leaf forest stands. Agric For. Meteorol. 2008, 148, 135–143. [Google Scholar] [CrossRef]
  56. Seiler, C.; Hutjes, R.W.A.; Kruijt, B.; Hickler, T. The sensitivity of wet and dry tropical forests to climate change in Bolivia. J. Geophys. Res. Biogeosci. 2015, 120, 399–413. [Google Scholar] [CrossRef]
  57. Bonan, G.B. Forests and climate change: Forcings, feedbacks, and the climate benefits of forests. Science 2008, 320, 1444–1449. [Google Scholar] [CrossRef] [PubMed] [Green Version]
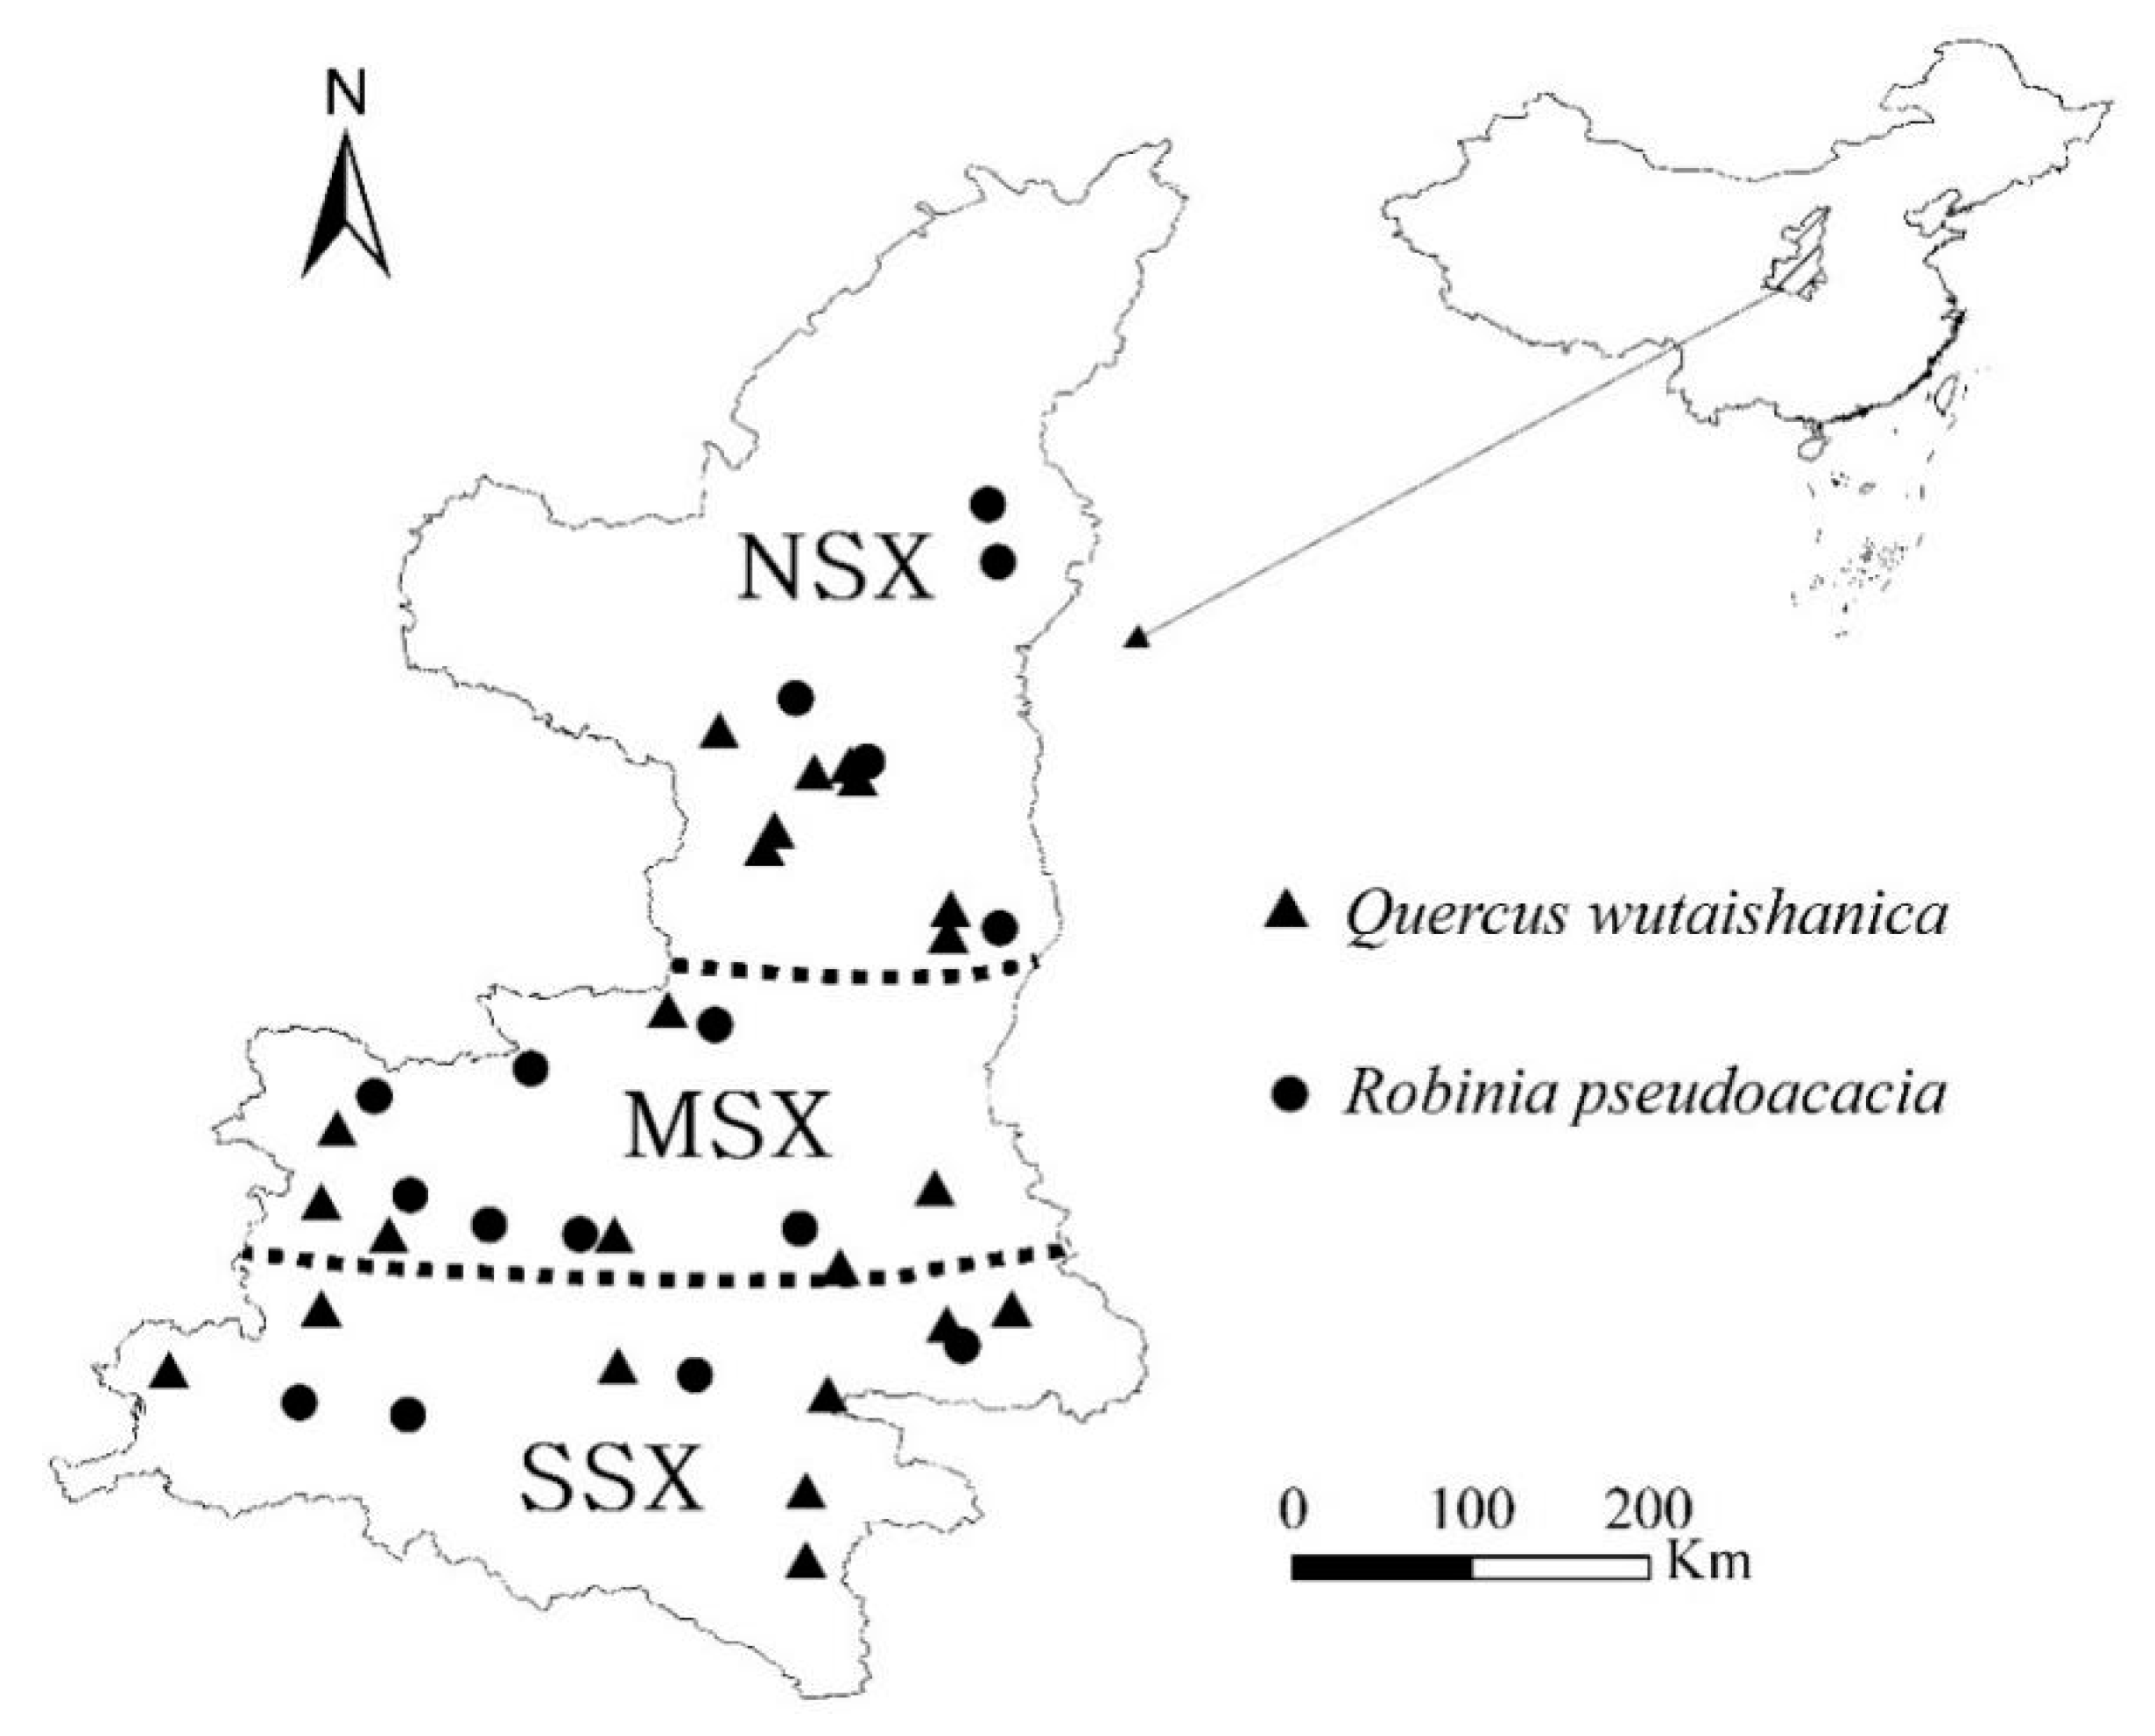
Figure 1. Distribution of sample points in the study area. NSX is Northern Shaanxi Plateau, MSX is Guanzhong Plain, and SSX is Southern Shaanxi Mountains.
Forests 10 01150 g001
Figure 2. Measured and simulated net primary productivity (NPP) of Q. wutaishanica (a) and R. pseudoacacia (b) forests.
Forests 10 01150 g002
Figure 3. Changes in R. pseudoacacia forest NEP under three RCP scenarios.
Forests 10 01150 g003
Figure 4. Changes in Q. wutaishanica forest NEP under three RCP scenarios.
Forests 10 01150 g004
Figure 5. Changes in R. pseudoacacia forest Rh under three RCP scenarios.
Forests 10 01150 g005
Figure 6. Changes in Q. wutaishanica forest Rh under three RCP scenarios.
Forests 10 01150 g006
Table 1. Comparison between simulated and field-based net ecosystem productivity (NEP).
SpeciesYearsNEP (g C m−2 yr−1)Source
RP2010–2012145.3 (109.8–206.2)LPJ-GUESS model
181.4Reference [26]
QW2010–2012120.4 (81.1–145.7)LPJ-GUESS model
96.6Reference [26]
Note: QW is Q. wutaishanica forest, RP is R. pseudoacacia forest, LPJ-GUESS is Lund-Potsdam-Jena General Ecosystem Simulator, the same below.
Table 2. Average (g C m−2 yr−1), trend (g C m−2 10 yr−1), and standard deviation (g C m−2 yr−1) of forest NEP under historical (1951–2014) and future (2015–2100) periods.
SiteSpecies1951–20142015–2100
RCP2.6RCP4.5RCP8.5
AvTSdAvTSdAvTSdAvTSd
NSXQW81.714.00 *55.530.2−16.00 *133.438.0−10.00 *129.963.1−15.00 *124.3
RP85.8−1.7060.75.8−6.30141.119.90.70148.178.36.00142.4
MSXQW115.19.00 *39.193.6−15.00 *97.8116.2−3.90103.7131.2−6.30 *111.7
RP96.515.00 *39.178.5−4.10109.583.74.10123.5117.26.40129.5
SSXQW90.92.9035.983.9−16.00 *99.6101.4−3.70108.685.5−11.00 *107.0
RP97.49.70 *32.0105.3−13.00 *105.4124.93.90122.7112.64.80129.3
Note: Av, average value; T, trend; Sd, standard deviation; *, p < 0.05.
Table 3. Average (g C m−2 yr−1), anomaly (%), and standard deviation (g C m−2 yr−1) of forest Rh under historical (1951–2014) and future (2015–2100) periods.
SiteSpecies1951–20142015–2100
RCP2.6RCP4.5RCP8.5
AvAnSdAnAvSdAvAnSdAnAvSd
NSXQW434.42.0%19.0553.530.0%65.4574.434.9%76.2622.946.2%109.9
RP383.81.5%18.4515.537.7%57.5530.241.6%63.7553.747.9%67.5
MSXQW394.75.5%28.7593.458.6%54.6615.864.6%69.8662.777.1%102.2
RP378.02.4%17.9526.339.8%47.3565.350.2%73.3582.154.6%80.3
SSXQW380.54.2%20.1562.954.2%55.0582.159.4%64.8621.870.3%91.9
RP367.01.9%14.4517.343.7%40.3534.248.3%50.6569.458.1%73.4
Note: Av, average value; An, anomaly value; Sd, standard deviation; Rh, heterotrophic respiration.
Table 4. NPP anomaly of R. pseudoacacia forest under different climate combination scenarios.
R. pseudoacacia ForestC1C2C3
T1T2T3T1T2T3T1T2T3
NSXP10%−11.4%−29.0%7.2%2.3%−15.2%30.4%12.7%−12.9%
P213.0%5.7%−16.1%28.1%26.0%−3.6%44.6%34.8%15.9%
P318.4%21.8%1.1%39.3%25.6%20.8%51.9%36.6%32.1%
MSXP10%−7.6%−25.5%15.6%6.8%−5.5%28.2%17.3%8.8%
P22.6%−3.1%−17.8%18.1%10.6%−3.5%24.0%23.0%9.4%
P37.9%−5.1%−16.1%20.6%12.9%−5.9%29.2%23.7%10.7%
SSXP10%−9.1%−29.5%23.1%11.9%−11.4%45.9%23.1%3.1%
P27.4%−10.2%−29.8%19.3%13.5%−17.0%37.0%22.5%0.8%
P31.2%−7.1%−27.5%25.4%12.7%−13.9%40.0%20.1%2.7%
Note: C, CO2 concentration, P, precipitation, T, temperature; 1, +0%, 2, +15%, 3, +30%. The same below.
Table 5. NPP anomaly of Q. wutaishanica forest under different climate combination scenarios.
Q. wutaishanica ForestC1C2C3
T1T2T3T1T2T3T1T2T3
NSXP10%−2.7%−20.7%18.0%1.7%−6.8%31.3%17.6%10.2%
P220.5%10.3%−5.0%38.7%25.7%5.6%44.8%34.0%19.9%
P327.7%12.6%7.4%41.6%32.0%19.3%53.0%41.2%28.1%
MSXP10%−12.0%−20.4%9.6%−0.7%−10.1%18.4%8.6%−4.2%
P2−0.1%−5.6%−18.8%12.4%1.7%−6.3%20.4%10.4%0.8%
P36.9%−1.3%−11.5%16.3%5.0%−5.5%20.3%11.6%1.7%
SSXP10%−19.2%−33.2%4.0%−10.2%−19.1%11.7%−0.7%−15.7%
P21.9%−13.2%−29.5%7.8%7.5%−19.5%15.9%0.5%−13.4%
P3−0.7%−16.6%−26.1%9.4%−2.3%−16.6%15.4%1.7%−10.8%