Article

Diversity and Genetic Structure Inferred with Microsatellites in Natural Populations of Pseudotsuga menziesii (Mirb.) Franco (Pinaceae) in the Central Region of Mexico

by
Paulina Montiel Castelán
1,
Moisés Cortés-Cruz
2,*,
Ma. del Carmen Mendoza-Castillo
1,
Serafín Cruz-Izquierdo
1,
Javier López-Upton
1,
Isaac Sandoval Padilla
2 and
Vidal Guerra de la Cruz
3
1
Colegio de Postgraduados, Campus Montecillo, Carretera México-Texcoco km 36.5, Montecillo, Texcoco 56230, Estado de México, Mexico
2
Centro Nacional de Recursos Genéticos- Instituto Nacional de Investigaciones Agrícolas Pecuarias y Forestales, Bvld. de la Biodiversidad 400, Tepatitlán de Morelos, Jalisco 47600, Mexico
3
Instituto Nacional de Investigaciones Agrícolas Pecuarias y Forestales, Campo Experimental Tlaxcala, Tlaxcala Km. 2.5 Carretera Tlaxcala-Santa Ana Chiautempan, Tlaxcala 90800, Mexico
*
Author to whom correspondence should be addressed.
Forests 2019, 10(2), 101; https://doi.org/10.3390/f10020101
Submission received: 23 October 2018 / Revised: 21 December 2018 / Accepted: 31 December 2018 / Published: 28 January 2019
(This article belongs to the Special Issue Forest Biodiversity under the Changing Land Use and Climate)

Abstract

:
The amount and structure of the genetic diversity in Mexican populations of Pseudotsuga menziesii (Mirb.) Franco, is almost unknown, since most genetic studies have been carried out on populations from Canada and the United States. Here, we applied a set of 12 microsatellite markers to 12 populations (234 trees) from the central region of Mexico in order to determine values of genetic diversity and differentiation. Seventy-three different alleles were identified: an average number of alleles per locus (Na) of 6.083, effective number of alleles (Ne) of 2.039, observed heterozygosity (Ho) of 0.229, and expected heterozygosity (Ht) of 0.417. Genetic differentiation was high: the coefficient of differentiation (θ) was 0.270, while the coefficient of structure (Φst) was 0.278. Bayesian analysis identified two genetic groups in central Mexico. The PCoA and the dendrogram were in concordance with the two genetic groups. The results of the analysis of molecular variance (AMOVA) indicate that genetic variation exists mainly within populations (72.149%). Therefore, conservation efforts should focus on as many individuals within populations as possible, to maintain this variation.

Graphical Abstract

1. Introduction

Pseudotsuga Carriere (Pinaceae) is distributed naturally in western North America and Southeast Asia [1]. Pseudotsuga menziesii (Mirb.) Franco, is the most important species of this genus, appreciated for its high quality wood that is easy to work with and has physical properties suitable for use in structures [2]. It is one of the main lumber species in North America, and has been introduced to many parts of the world as an exotic species. Today, there are plantations in southern Germany [3], New Zealand, Argentina, and Chile [4,5,6].
In Mexico, this species is distributed in the northern region, although isolated stands can also be found in the central part of the country where its distribution is restricted to shaded moist sites, on the sides of ravines and canyons, or protected valleys [7,8]. It forms mixed forests, mainly with species of Quercus, Pinus, and Abies religiosa (Kunth) Schltdl. & Cham., where P. menziesii is present as a secondary species [8]. According to the Official Mexican Standard 059 (NOM-059-SEMARNAT), P. menziesii is “subjected to special protection (Pr),” meaning that the species is threatened by factors that negatively affect its viability, and that there is the need to promote its recovery and conservation [9]. Moreover, due to anthropogenic factors such as change of use of land, it is included in the red list of threatened species of the International Union for Conservation of Nature (IUCN) [10].
The discontinuous, restricted distribution of populations leads to a high degree of inbreeding, causing the appearance of similar individuals and reducing genetic variation. Consequently, when the individuals inherit identical alleles, they are more likely recessive alleles. This can cause expression of deleterious mutations and undesirable effects in yield [11]. Populations of the central part of Mexico show the lowest fertility and seedling recruiting rates because of inbreeding depression, very likely due to being the smallest and most isolated populations in the country [12,13,14,15]. Reduction of genetic diversity can increase the risk of extinction in natural populations by decreasing individual aptitude and their possibility of adapting to changing environmental conditions [16].
Genetic diversity has an important role to play in the conservation and management of genetic resources, especially in the face of changes that may come about. It is predicted that climate change will cause summers to be hotter and drier, and winters to be warmer and more humid [17,18]. Projections under the climate change model HadCM3 (Hardley Centre Coupled Model, version 3) predict a reduction in the current suitable area for the species by the year 2050, whereas by 2080 they could be on the verge of extinction. The model suggests that the main variable decreasing the suitable area would be the reduction in precipitation, rather than the increase in temperature [19]. The species is found in a variety of environmental conditions, suggesting that it must maintain high genetic diversity in order to cope with this environmental heterogeneity [19]. Therefore, it is necessary to establish conservation strategies that maintain this diversity. Mexican populations are an important source of germplasm for managing the species in the eventuality of climate change.
Application of molecular techniques in the analysis of genetic diversity can contribute to the conservation of endangered species, since it is now possible to analyze a large number of polymorphic loci and individuals at the same time [20]. The use of molecular markers allows the estimation of genetic diversity parameters which can be used to inform conservation strategies [21]. Microsatellite markers or SSR (simple sequence repeats) are very useful due to their abundant distribution in the genome and their codominant inheritance [22,23], and they are often derived from non-coding regions [24].
For P. menziesii, there are SSR markers available that have been used in various different studies demonstrating their applicability to estimating genetic diversity and structure, pollen introgression, evolutionary history, etc. [6,25,26,27]. However, most of these studies have focused on native populations of Canada and the United States, where populations are big and show a continuous distribution [27]. In contrast, for Mexico, genetic diversity studies are scarce, and natural populations are fragmented and show a discontinuous distribution. Additionally, Mexican populations of P. menziesii have been found to be genetically different from those present in Canada and the United States [19,28,29]. Therefore, because of the characteristics of Mexican populations, we expect diversity and genetic values to be different from those reported for Canada and the United States populations. Here, we investigate the diversity and genetic structure of P. menziesii populations in the central region of Mexico using microsatellite markers (first report). The findings will contribute to the sustainable management and conservation of P. menziesii germplasm in Mexico.

2. Materials and Methods

2.1. Collection of Plant Material

Samples were collected from 12 P. menziesii populations located in the central area of Mexico (states of Tlaxcala, Puebla, Querétaro, and Veracruz (Figure 1, Table 1). Ventura et al. [8] identified 29 populations in this region, covering an area of approximately of 682 ha (area size ranging from 78 to 0.5 ha). For each population, 20 trees were sampled when possible. Adult and young P. menziessi trees (mean value of 1.37 m, ranging from 0.12 to 1.12 m at breast height) were sampled along linear transects, considering a minimum distance of 100 m to reduce the probability of sampling from family clusters [30]. Because of the area or the density of the populations (very few scattered trees), in some cases it was not possible to sample the target number (populations Axopilco and Barranca). Needles were identified and conserved fresh until their reception in the laboratory, where they were frozen at −80 °C until lyophilization.

2.2. DNA Extraction

The plant material was lyophilized and pulverized mechanically. Genomic DNA was isolated following the CTAB (Cetyl Tri-Metyl Ammonium Bromide) [31] method with modifications, using 50 mg of sample and 1 mL of extraction buffer (100 mM Tris-HCl, 700 mM NaCl, 50 mM EDTA (ethylenediaminetetra-acetic acid), 1 % CTAB, 140 mM 2-mercapto-ethanol and 1% PVP (polivinylpyrrolidone)). The DNA was precipitated by adding chilled absolute ethanol. The DNA pellet was resuspended in 200 µL buffer TE (10 mM Tris-HCl (pH 7.5), 1 mM EDTA (pH 8.0)).

2.3. Quantification of Nucleic Acids

Concentration and purity of the DNA samples were determined by spectrophotometry (NanoDrop, Thermo Scientific, Wilmington, DE, USA) at wavelengths of 260/280 nm. Integrity of the DNA was evaluated in 1% agarose gels, and the migration pattern of the bands was compared with uncut lambda marker (PROMEGA, Madison, WI, USA).

2.4. SSR Analysis

Forty-two pairs of SSR primers were initially screened for polymorphism, and twelve primers were selected for the molecular analysis [25,26] (Table 2). PCR reactions were performed at a final volume of 10 µL. Each reaction included 50 ng of DNA, 0.8 X RedTaq® ReadyMix™ (SIGMA-ALDRICH, St. Louis, MO, USA), 0.5 µM of each primer (SIGMA-ALDRICH, St. Louis, MO, USA), and molecular biology grade water. The PCR amplifications were carried out on a thermocycler Veriti 96-Well Thermal Cycler (Applied Biosystems, Foster City, CA, USA) under the following conditions: initial denaturation at 95 °C for 5 min, followed by 35 cycles of 40 s at 95 °C for denaturation, 40 s for alignment at the adequate temperature of each primer (Table 2), 2 min at 72 °C for extension, and a final step of 20 min at 72 °C.
PCR products were separated in 8% non-denaturing polyacrylamide gels in 1X TBE (45 mM Tris-Borate, 1mM EDTA) buffer solution at 250V for 2 h 30 min. After electrophoresis, the PCR products were visualized with silver staining [32]. Gel images were captured with the KODAK Gel Logic 100 System (Kodak, Rochester, NY, USA). Fragment sizes were determined with the software GelQuest (SequentiX-Digital DNA Processing, Germany, www.sequentix.de), with which the matrix of codominant data was constructed.

2.5. Data Analysis

POPGENE 1.31 [33] was used to estimate the following genetic diversity parameters at population level: percentage of polymorphic loci (%P), average number of alleles per locus (Na), effective number of alleles (Ne), observed heterozygosity (Ho), expected heterozygosity (He), and number of migrants (Nm). The number of private alleles (NP), defined as alleles that are found only in a single population among a broader group of populations [34], was estimated using GenAlex 6.5 [35]. Principal coordinate analysis (PCoA) was performed at the population level to display graphically their dispersion. It was calculated using the genetic distance between pairs of accessions [35].
A Mantel test [36] was applied to the dataset to determine the relationships between the genetic and geographic distances among P. menziessi populations from all the surveyed locations in the central part of Mexico. The overall population subdivision was estimated using Wright´s F statistics (FIT, FIS and FST) [37] using POPGENE 1.31 [33]. Additionally, the coefficient of genetic structure (Φst) [37] was calculated by the analysis of molecular variance (AMOVA), using 10,000 permutations to test the significance of the hierarchical population analysis using ARLEQUIN v. 3.5 [38].
Graphical representation based on genetic distances [39] was constructed using the methodology unweighted pair group method using arithmetic average (UPGMA) algorithm [40], implemented in TFPGA v. 1.3 [41].
A test of genetic structure was done by Bayesian analysis of individual assignment, assuming a model in which between one and 12 populations could be grouped. The program was executed using 250,000 iterations of MCMC (Monte Carlo Markov Chains), 50,000 replicates, and 10 repetitions for each K, using the software STRUCTURE 2.3.4 [42].

3. Results

3.1. Genetic Diversity

We analyzed 234 individuals from 12 populations of P. menziesii from the central region of Mexico. A total of 73 different alleles were detected, using 12 SSR markers. Allele number ranged from three (PmOSU_3H4, BCPsmAG27 and PmOSU_3B9) to ten (PmOSU_783), with an average of 6.08 alleles per locus (Table 3). Among these alleles, 22 alleles were private. Locus PmOSU_2D6 had the most private alleles, whereas loci PmOSU_2B6, BCPsmAG20 and PmOSU_2D4, had only one.
At the population level, overall percentage of polymorphism was 100%, and it fluctuated between 58.33% (Apizaquito) to 100% (La Rosa). The average number of alleles (Na) per population was 2.677. The population of Cruz de León had a lower Na value (2.167), while the population of Carbonero Jacales had a higher value (3.166). The effective number of alleles (Ae) ranged from 1.416 (Tlaxco) to 2.067 (Carbonero Jacales), with a mean value of 2.039. The mean values of observed heterozygosity (Ho) and expected heterozygosity (He) were 0.230 and 0.302 respectively. Ho values varied from 0.162 for population of Tlaxco to 0.304 for Tlamotolo. The total expected heterozygosity (Ht) was 0.417 and varied by populations, where the population of Tlaxco had the lowest values (0.226), and the population of Carbonero Jacales the highest (0.383). The population of Tlaxco, showed the lowest values for Ae, Ho, He, and NP, whereas the population of Carbonero Jacales showed the highest values for the same variables (Table 4).

3.2. Genetic Structure

The within population inbreeding coefficient (FIS) varied from −0.599 (BCPsmAG27) to 1.000 (PmOSU_3H4) with a mean of 0.234, indicating a significant deficiency of heterozygosity (Table 3). The inbreeding coefficient determined for the total population (FIT) per locus ranged from −0.318 (BCPsmAG27) to 1.000 (PmOSU_3H4) with a mean of 0.452, suggesting a deficiency of heterozygotes in the populations. Meanwhile, the population differentiation coefficient (FST), which measures the degree of genetic differentiation among populations, ranged from 0.029 (PmOSU_2D6) to 0.733 (PmOSU_3G9) with a mean of 0.285, indicating a high differentiation among all the populations [43]. Overall, the values of the F statistics obtained in our study suggest considerable inbreeding in the analyzed P. menziesii populations. The number of migrants (Nm) per generation inferred from the data of the 12 loci analyzed was 0.62, which is considered low [44].
The analysis of molecular variance (AMOVA) was carried out considering the 12 populations studied, calculating the molecular variation attributable to differentiation between and within the populations. The highest percentage of variation (%V) was found within the populations (%V = 72.182) and in lower proportion, between populations (%V = 27.818). The coefficient of genetic structure was Φst = 0.278. The Fisher combined likelihood test or the Raymond and Rousset [45] exactitude test showed that allele frequencies between pairs of populations were significantly different, at a confidence level of 95% (p < 0.05) (Table 5). The coefficient of differentiation θ [37], which is analogous to the Wright coefficient of FST [43], was 0.27 in the 12 Mexican populations of P. menziesii of our study.
Distinct genetic groups of accessions were identified with different methods of grouping. Two different groups were formed using PCoA on the first three coordinates, explaining 72.79% (cumulative values) of the total variability (Figure 2). Likewise, the dendrogram generated from genetic distances [39] using the UPGMA method reflected two groups (Figure 3). Populations from Emiliano Zapata, Cruz de León, La Caldera, Cuatexmola, Tlalmotolo, and La Barranca, clustered in one group (Group I). Populations Apizaquito, La Rosa, Tlaxco, Axopilco, Carbonero Jacales, and Villareal clustered in a different group (Group II).
The Mantel test conducted with 1000 permutations revealed a weak positive correlation between genetic distances and geographic distances (r = 0.24; p = 0.102), indicating that genetic differentiation does not seem to be due to gene flow produced by a model of isolation because of distance.
The Bayesian analysis of assignation of individuals, by comparing likelihoods, showed that the most probable number of genetic groups is K = 2 [46] (Figure 4). We assumed a model of intercrossing, and that the populations derive from a common ancestor. Each individual of each population was assigned to one of the two genetic groups. Populations were clustered evenly, six in each group. About 75% of the populations showed strong ancestry values (>0.80, Table 6). The proportion of color of each of the individuals in each population represents the fraction of ancestry relative to each group (Figure 5).

4. Discussion

4.1. Genetic Diversity

Prior to this study, little information was found in public databases for genetic studies of Mexican populations of P. menziesii using molecular markers. Most of the reported studies focused mainly on morphological [47] and phenological characteristics [48], mating patterns [15], and seed viability and dispersion [12,14]. Cruz-Nicolás et al. [49] analyzed Mexican populations from the northern and central regions of Mexico. Using isozyme markers, Cruz-Nicolás et al. determined levels of genetic diversity of Ht = 0.077 (He = 0.051 for the central region). Although this was the first analysis of the levels of genetic diversity in Mexican populations, a direct comparison between isozymes and microsatellites would be inappropriate without taking into account their differing capacity to detect genetic variation [27]. However, their results were the first to report low levels of genetic diversity in these populations and the presence of genetic differentiation (FST = 0.298).
Previously, Amarasinghe and Carlson [25] and Slavov et al. [26] developed microsatellite markers and estimated genetic diversity parameters in P. menziesii populations from Canada and the United States, respectively. From these primers, 12 SSR markers were used in the present study to determine the genetic diversity parameters in populations of P. menziesii from the central region of Mexico. Polymorphism levels of the selected panel were high (Table 4), with a mean value of 77.86% across the 12 populations of this study. The mean number of alleles (Na = 6.08) and the heterozygosity (Ht = 0.417) detected in this study were lower than those reported in other studies in P. menziesii using microsatellites (Na = 8, He =0.673 [25], Na = 23, He = 0.855 [26] and Na = 24.03, He = 0.936 [27]).
The mean number of alleles observed and expected heterozygosity parameters were compared with other studies that used a similar set of microsatellite markers. Molecular studies on pollination dynamics of P. menziesii orchards [50,51] at the locus level (PmOSU_3B9, PmOSU_2D4, PmOSU_2G12, and PmOSU_3G9) displayed higher values (Na = 20.2, Ho = 0.651 [50], Na = 23, Ho = 0.712, He = 0.916 [51]) than those detected in the Mexican populations with the same markers (Na = 6.3, Ho = 0.116, He = 0.421). These results are in agreement with previous studies suggesting that Mexican populations from the central region display lower levels of genetic diversity than populations in other regions of North America [25,26,27,50,51]. Populations of P. menziesii in the central region of Mexico are fragmented, and present a discontinuous distribution in the form of small patches or stands that are isolated from one another [1,19]. Paleoclimatic studies suggest that P. menziesii in Mexico emerged during the era of glaciation. During this period, the P. menziesii populations of northern Mexico migrated southward, where they found refuge in the mountain systems. In the interglacial events, the populations expanded northward and to the high parts of the mountains, where today’s populations formed with a certain level of isolation. These climate changes could have caused bottlenecks that reduced genetic variation and led to interpopulation differentiation, while the populations distributed in the United States and Canada were secondary points of convergence in the interglacial periods, giving rise to greater genetic diversity [19,52].
In the case of small populations, reproductive isolation can lead to genetic drift [53], increasing genetic differentiation among populations, homozygosity, and inbreeding [54]. Low values of genetic diversity have also been reported in small populations of other species with restricted distribution in Mexico, such as Picea mexicana Martínez (Ht = 0.125) [55], and in different species of Abies that have isolated distribution, such as A. flinckii Rushforth (He = 0.064–0.158), A. guatemalensis Rehder (He = 0.044–0.094), A. hickeli Flous & Gaussen (He = 0.073–0.135) and A. religiosa (He = 0.008–0.235) [52].
Generally, levels of genetic diversity are closely related to the degree of disturbance of the populations [56,57]. Values of genetic diversity obtained for populations of P. menziesii for the central region are lower than those reported for populations in Canada and the United States. However, for a better estimate of the genetic diversity of the species in the country, it would be necessary to analyze populations from the northern region, since both regions have been found to be genetically different [47,48,49].

4.2. Genetic Structure

At the locus level, we detected deficiencies of heterozygotes, as indicated by the values of Wright fixation indexes Fis = 0.234 and Fit = 0.452, in all the analyzed populations (Table 3). High levels of homozygosity are characteristic of genetic drift acting on small populations as differentiation continues [53]. According to Wright [43], the genetic differentiation among populations is high when Fst > 0.25. The results of the present study indicate that genetic variation exists among the populations (Fst = 0.285). This result is counter to other studies, wherein the authors report no genetic differentiation [27,58]. The value of the coefficient of genetic differentiation, θ = 0.27, analogous to the coefficient Fst, was high. Populations with high levels of heterozygosity detected with microsatellite loci can have very low levels of differentiation [59], as in the case of studies reported for other regions in North America, while in our study, the populations analyzed had a deficiency of heterozygotes and high values of differentiation (Table 3).
Populations of P. menziesii from the central region of Mexico have been characterized as having a high production of empty seeds, while the viable seeds are smaller in size with respect to populations from the northern region [60]. Moreover, when evaluating germination, higher rates of germination and survival are observed in seeds from the northern region [12]. These characteristic effects of inbreeding (morphological and genetic) observed in the central populations suggest that the process of genetic drift is associated with a high rate of selfing (deficiency of homozygotes, Table 3).
Gene flow in the analyzed populations was limited, as indicated by the number of migrants (Nm) per generation inferred from the data of the 12 loci analyzed (Nm = 0.647, Table 3). In populations of the state of Washington (USA) and British Columbia (Canada), a Nm= 5.00 has been reported for this species [58]. For the Pinaceae family, to which P. menziesii belongs, values of up to 17.2 migrants of the genus Pinus [61] have been reported. This limited gene flow is in agreement with the high levels of endogamy and genetic structure identified in these populations. It is possible that the reduced gene flow in the analyzed population is a consequence of population fragmentation and size, and of local genetic differentiation [8].
The higher percentage of variation determined with the AMOVA was within the populations (73.05%). At a lower proportion (26.95%) was the variation detected is between populations. This could be due to the biology of the species. In general, long-living populations, panmictic, pollinated by wind, and of late succession have higher levels of variation within populations [62,63]. Additionally, metapopulation structure also has an impact in genetic diversity values. Metapopulation of species is caused by land fragmentation, creating spatially separated populations, which in some cases can interact. This fragmentation could favor genetic drift, hampering gene flow. As a result, there is a reduction of genetic diversity, especially in cross-pollinated species [64].
The coefficient of genetic structure for the species, derived from the AMOVA, was Φst = 0.278 (p < 0.05), which is similar to the characteristic for long-living perennial plants Φst = 0.25 [62]. This value suggests the existence of genetic structure, as a consequence of restricted gene flow and evolution, regardless of the populations within the identified genetic groups.
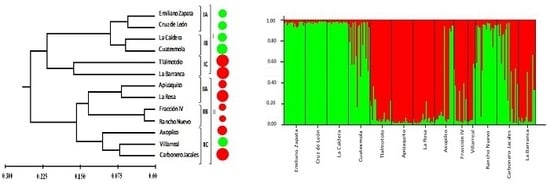
The PCoA, dendrogram, and Bayesian analysis of assignation of individuals (STRUCTURE) were consistent in identifying two genetic groups. However, the results regarding the genetic relatedness of the populations were inconsistent with the expectation that populations geographically closer would be more similar than those that are more distant (Figure 1 and Figure 3). These results are in agreement with the performed Mantel tests, where we found a positive correlation between geographic distance and genetic distance (r = 0.240, p = 0.102), although this correlation was not significant—a possible reason might be the small sampling range. These results suggest that, although geographic distances do not seem to play a significant role in genetic differentiation, there may exist barriers due to characteristics of the landscape that impede or reduce gene flow among the 12 populations studied.
Knowledge of genetic diversity values and population genetic differentiation is essential to identifying current threats and elucidating mechanisms to protect endangered species [65,66]. The results of this study show that the central populations of P. menziessi analyzed still harbor significant levels of genetic diversity, despite the fragmentation status, illegal exploitation, overgrazing, inappropriate cone collecting, pest attack, and climate change [67]. Given these precedents, it is imperative in situ conservation strategies be set up for natural populations with high genetic diversity and private alleles, particularly for populations Carbonero Jacales (He = 0.383, NP = 5), La Barranca (He = 0.371, NP = 4), Tlalmotolo (He = 0.365, NP = 1), La Rosa (He = 0.364, NP = 3), and Cuatemoxla (He = 0.320, NP = 2). In situ conservation must be complemented with ex situ conservation strategies. There are ongoing efforts by national institutions working on the recollection of cones and seeds from different populations of P. menziessi in the country. Collection of vegetative samples should also be considered for in vitro conservation, particularly from those isolated populations and/or those with ancient trees. Populations from La Barranca, Carbonero Jacales, and Apizaquito are isolated from the main cluster of populations (Figure 1), and are at high risk of genetic erosion due to their isolated status. The PCoA distribution also shows these populations are further away from the main clusters (Figure 2). The results of the AMOVA indicate that genetic variation exists mainly within populations. Therefore, conservation efforts should focus on many individuals within populations as possible, to maintain this variation.

5. Conclusions

In the present study, we analyzed 12 populations of P. menziesii from the central region of Mexico, using 12 microsatellite markers to determine diversity and genetic differentiation. Different values of genetic diversity were detected among all analyzed populations, although the overall value was lower than other results reported using microsatellite markers in populations from North America. Molecular data revealed heterozygous deficiency in all populations, and high genetic differentiation among populations. These results, along with the small size and restricted distribution of the populations, and location at the border of the natural distribution, indicate genetic drift, increasing genetic differentiation among population, homozygosis, and inbreeding within populations.
Bayesian analysis showed two main genetic groups that were in agreement with the PCoA and the UPGMA dendrogram, and although there was a positive correlation between genetic and geographic distances, this was not significant. Genetic variation exists within populations; thus conservation efforts should focus on as many individuals as possible within populations, in order to capture most of the genetic variants within populations. Based on genetic diversity values and the number of private alleles, in situ conservation strategies should be implemented for populations Carbonero Jacales, La Barranca, Tlalmotolo, La Rosa, and Cuatexmola. In situ conservation preserves the natural evolution of the species while maintaining its interactions with other organisms and ecological processes. These strategies should also be complemented with ex situ conservation activities.

Author Contributions

P.M.C. conducted the experiment, analyzed the data and wrote the article; M.C.-C. designed the experiment, analyzed the data and wrote the article; M.d.C.M.-C. analyzed the data and wrote the article; S.C.-I. analyzed the data and wrote the article; J.L.-U. analyzed the data and wrote the article; V.G.d.l.C. collected the samples and wrote the article; I.S.P. conducted the experiment, analyzed the data and wrote the article. All authors read and approved the final manuscript.

Funding

This study was funded by the Comisión Nacional Forestal (CONAFOR) through the project “Fomento y Operación del Subsistema de Recursos Genéticos Forestales dentro del Centro Nacional de Recursos Genéticos (CNRG), (Project: SIGI 11385232709)” (“Promotion and Operation of the Sub-system of Forest Genetic Resources in the National Genetic Resources Center”).

Acknowledgments

The authors wish to thank two anonymous reviewers for their input and constructive criticism received.

Conflicts of Interest

The authors declare that they have no conflict of interest.

References

  1. Farjon, A. Pinaceae: Drawings and Descriptions of the Genera Abies, Cedrus, Pseudolarix, Keteeleria, Nothotsuga, Tsuga, Cathaya, Pseudotsuga, Larix and Picea; Koeltz Scientific Books: Konigstein, Germany, 1990; pp. 171–191. [Google Scholar]
  2. Sanchez, E.M.; Arregui, R.Z.; Veigas, G.P.; Saavedra, F.P. Variabilidad de parámetros de calidad de madera entre y dentro de procedencias de Pseudotsuga menziesii. Cuad. Soc. Esp. Cienc. For. 2008, 24, 75–80. [Google Scholar]
  3. Fussi, B.; Dounavi, A.; Konnert, M. Identification of varieties and gene flow in Douglas fir exemplified in artificially established stands in Germany. Ann. For. Res. 2013, 56, 249–268. [Google Scholar]
  4. Hermann, R.K.; Lavender, D.P. Douglas-fir planted forests. New Forest 1999, 17, 53–70. [Google Scholar] [CrossRef]
  5. Bastien, J.C.; Sanchez, L.; Michau, D. DouglasFir (Pseudotsuga menziesii (Mirb.) Franco). In Forest Tree Breeding in Europe; Pâques, L.E., Ed.; Springer: Berlin/Heidelberg, Germany, 2013; Volume 25, pp. 325–369. [Google Scholar]
  6. Van Loo, M.; Hintsteiner, W.; Pötzelsberger, E.; Schüler, S.; Hasenauer, H. Intervarietal and intravarietal genetic structure in Douglas-fir: nuclear SSRs bring novel insights into past population demographic processes, phylogeography, and intervarietal hybridization. Ecol. Evol. 2015, 5, 1802–1817. [Google Scholar] [CrossRef] [PubMed]
  7. Rzedowski, J.; Huerta, L. Vegetación de México; Limusa: Mexico City, México, 1978; Volume 432, pp. 323–324. [Google Scholar]
  8. Ventura-Ríos, A.; López-Upton, J.; Vargas-Hernández, J.J.; Guerra de la Cruz, V. Caracterización de Pseudotsuga menziesii (Mirb.) Franco en el centro de México. Implicaciones para su conservación. Rev. Fitotec. Mex. 2010, 33, 107–116. [Google Scholar]
  9. Secretaria de Medio Ambiente y Recursos Naturales (SEMARNAT). Norma Oficial Mexicana NOM-059-SEMARNAT-2010, Protección Ambiental-Especies Nativas de México de Flora y Fauna Silvestres-Categorías de Riesgo y Especificaciones para su Inclusión, Exclusión o Cambio-Lista de Especies en Riesgo. Available online: https://www.gob.mx/cms/uploads/attachment/file/134778/35.-_NORMA_OFICIAL_MEXICANA_NOM-059-SEMARNAT-2010.pdf (accessed on 9 January 2018).
  10. The IUCN Red List of Threatened Species 2013. Available online: http://www.iucnredlist.org/details/42429/0 (accessed on 24 February 2018).
  11. Pathania, A.; Rialch, N.; Sharma, P.N. Marker Assisted Selection in Disease Resistance Breeding: A Boon to Enhance Agricultural Production. In Current Developments in Biotechnology and Bioengineering, United States, 1st ed.; Dubey, S.K., Pandey, A., Sangwan, R.S., Eds.; Elsevier: Amsterdam, The Netherlands, 2016; pp. 187–213. ISBN 978-0-444-63661-4. [Google Scholar]
  12. Juárez-Agis, A.; López-Upton, J.; Vargas-Hernández, J.J.; Sáenz-Romero, C. Variación geográfica en la germinación y crecimiento inicial de plántulas de Pseudotsuga menziesii en México. Agrociencia 2006, 40, 783–792. [Google Scholar]
  13. Mápula-Larreta, M.; López-Upton, J.; Vargas-Hernández, J.J.; Hernández-Livera, A. Germinación y vigor de semillas en Pseudotsuga menziesii de México. Ra Ximhai 2008, 4, 119–134. [Google Scholar]
  14. Velasco-García, M.V.; López-Upton, J.; Ángeles-Pérez, G.; Vargas-Hernández, J.J.; Guerra de la Cruz, V. Dispersión de semillas de Pseudotsuga menziesii en poblaciones del centro de México. Agrociencia 2007, 41, 121–131. [Google Scholar]
  15. Cruz-Nicolás, J.; Vargas-Hernández, J.J.; Ramírez-Vallejo, P.; López-Upton, J. Patrón de cruzamiento en poblaciones naturales de Pseudotsuga menziesii (Mirb.) Franco en México. Agrociencia 2008, 42, 367–378. [Google Scholar]
  16. Frith, K.E.; Hoelzel, A.R. Conservation Genetics. Encyclopedia of Biodiversity; Durham University: Durham, UK, 2016; Volume 2, pp. 263–277. [Google Scholar]
  17. Mote, P.W.; Salathé, E.P. Future climate in the Pacific Northwest. Clim. Chang. 2010, 102, 29–50. [Google Scholar] [CrossRef] [Green Version]
  18. Beedlow, P.A.; Waschmann, S.R.; Lee, E.H.; Tingey, D.T. Seasonal patterns of bole water content in old growth Douglas-fir (Pseudotsuga menziesii (Mirb.) Franco). Agric. For. Meteorol. 2017, 242, 209–219. [Google Scholar] [CrossRef] [PubMed]
  19. Gugger, P.F.; Gonzalez-Rodríguez, A.; Rodríguez-Correa, H.; Sugita, S.; Cavender- Bares, J. Southward Pleistocene migration of Douglas-fir into Mexico: Phylogeography, ecological niche modeling, and conservation of ‘rear edge’ populations. New Phytol. 2011, 189, 1185–1199. [Google Scholar] [CrossRef] [PubMed]
  20. Bruford, M.W.; Davies, N.; Dulloo, M.E.; Faith, D.P.; Walters, M. Monitoring changes in genetic diversity. In The GEO Handbook on Biodiversity Observation Networks; Walters, M., Scholes, R.J., Eds.; Springer International Publishing: New York, NY, USA, 2017; pp. 107–128. [Google Scholar]
  21. Hedrick, P.W. Conservation genetics and the persistence and translocation of small populations: Bighorn sheep populations as examples. Anim. Conserv. 2014, 17, 106–114. [Google Scholar] [CrossRef]
  22. Marwal, A.; Sahu, K.A. Molecular Markers: Tool for Genetic Analysis. In Animal Biotechnology; Verma, A.S., Singh, A., Eds.; Elsevier: Amsterdam, The Netherlands, 2014; pp. 289–305. [Google Scholar]
  23. Borem, A.; Fritsche-Neto, R. Biotechnology and Plant Breeding; Biotechnology Applied to Plant Breeding. Cedrus, Pseudolarix, Keteeleria, Nothotsuga, Tsuga, Cathaya, Pseudotsuga, Larix and Picea; Koeltz Scientific Books: Konigstein, Germany, 2014; pp. 171–191. [Google Scholar]
  24. Jiang, G. Molecular Markers. Plant Breeding and Genetic. Reference Module in Life Sciences. Encyclopedia of Applied Plant Sciences, 2nd ed.; Elsevier: Amsterdam, The Netherlands, 2017; pp. 207–214. [Google Scholar]
  25. Amarasinghe, V.; Carlson, J.E. The development of microsatellite DNA markers for genetic analysis in Douglas-fir. Can. J. For. Res. 2002, 32, 1904–1915. [Google Scholar] [CrossRef]
  26. Slavov, G.T.; Howe, G.T.; Yakovlev, I.; Edwards, K.J.; Krutovskii, K.V.; Tuskan, G.A.; Carlson, J.E.; Strauss, S.H.; Edwards, W.T. Highly variable SSR markers in Douglas-fir: Mendelian inheritance and map locations. Theor. Appl. Genet. 2004, 108, 873–880. [Google Scholar] [CrossRef] [PubMed]
  27. Krutovsky, K.V.; St. Clair, J.B.; Saich, R.; Hipkins, V.D.; Neale, D.B. Estimation of population structure in coastal Douglas-fir [Pseudotsuga menziesii (Mirb.) Franco var. menziesii] using allozyme and microsatellite markers. Tree Genet. Genomes 2009, 5, 641–658. [Google Scholar] [CrossRef]
  28. Villagómez Loza, M.A.; Bello González, M.Á. Pseudotsuga menziesii (Mirb.) Franco var. glauca (Beissn.) Franco: nuevo registro para Guanajuato. Rev. Mex. Cienc. For. 2015, 6, 66–73. [Google Scholar]
  29. Li, P.; Adams, W.T. Range-wide patterns of allozime variantions in Douglas-fir (Pseudotsuga menziesii). Can. J. For. Res. 1989, 19, 149–161. [Google Scholar] [CrossRef]
  30. Novick, R.R.; Dick, C.W.; Lemes, M.R.; Navarro, C.; Caccone, A.; Berminhham, E. Genetic Structure of Mesoamercian populations of Big-leas mahogany (Swietenia macrophylla) inferred from microsatellites analysis. Mol. Ecol. 2003, 12, 2885–2893. [Google Scholar] [CrossRef]
  31. Saghai-Maroof, M.A.; Soliman, K.M.; Jorgensen, R.A.; Allard, R.W. Ribosomal DNA spacer-length polymorphisms in barley mendelian inheritance, chromosomal location and population dynamics. Proc. Natl. Acad. Sci. USA 1984, 81, 8014–8018. [Google Scholar] [CrossRef]
  32. Sanguinetti, C.J.; Neto, D.E.; Simpson, A.J. Rapid silver staining and recovery of PCR products separated on polyacrylamide gels. Biotechniques 1994, 17, 915–918. [Google Scholar]
  33. Yeh, F.; Yang, R.C.; Boyle, J.T. Popgene Version 1.31; University of Alberta and Centre for International Forestry Research: Edmondton, AB, Canada, 1999. [Google Scholar]
  34. Szpiech, Z.A.; Rosenberg, N.A. On the size distribution of private microsatellite alleles. Theor. Popul. Biol. 2011, 80, 100–113. [Google Scholar] [CrossRef] [PubMed] [Green Version]
  35. Peakall, R.; Smouse, P.E. GenAlEx 6.5: genetic analysis in Excel. Population genetic software for teaching and research—An update. Bioinformatics 2012, 28, 2537–2539. [Google Scholar] [CrossRef] [PubMed]
  36. Mantel, N. The detection of disease clustering and a generalized regression approach. Cancer Res. 1967, 27, 209–220. [Google Scholar] [PubMed]
  37. Weir, B.S.; Cockerham, C.C. Estimating F-statistics for the analysis of population structure. Evolution 1984, 38, 1358–1370. [Google Scholar]
  38. Excoffier, L.; Lisher, H.E.L. Arlequin suite ver 3.5: A new series of programs to perform population genetics analyses under Linux and Windows. Mol. Ecol. Resour. 2010, 10, 564–567. [Google Scholar] [CrossRef] [PubMed]
  39. Nei, M. Genetic distance between populations. Am. Nat. 1972, 106, 283–292. [Google Scholar] [CrossRef]
  40. Felsenstein, J. Distance methods for inferring phylogenies: A justification. Evolution 1984, 38, 16–24. [Google Scholar] [CrossRef] [PubMed]
  41. Miller, M.P. Tools for Population Genetic Analysis (TFPGA), Ver 1.3; Northern Arizona University: Flagstaff, AZ, USA, 2000. [Google Scholar]
  42. Pritchard, J.K.; Stephens, M.; Donnelly, P. Inference of population structure using multilocus genotype data. Genetics 2000, 155, 945–959. [Google Scholar] [PubMed]
  43. Wright, S. The genetical structure of populations. Ann. Eugenic. 1951, 15, 323–354. [Google Scholar] [CrossRef]
  44. Slatkin, M.; Barton, N.H. A comparison of three indirect methods for estimating average levels of gene flow. Evolution 1989, 43, 1349–1368. [Google Scholar] [CrossRef] [PubMed]
  45. Raymond, M.L.; Rousset, F. An exact for population differentiation. Evolution 1995, 49, 1280–1283. [Google Scholar] [CrossRef] [PubMed]
  46. Evanno, G.; Regnaut, S.; Goudet, J. Detecting the number of clusters of individuals using the software STRUCTURE: A simulation study. Mol. Ecol. 2005, 14, 2611–2620. [Google Scholar] [CrossRef] [PubMed]
  47. Acevedo-Rodríguez, R.; Vargas-Hernández, J.J.; López-Upton., J.; Mendoza, J.V. Effect of geographic origin and nutrition on shoot phenology of Mexican Douglas-Fir (Pseudotsuga sp.) seedlings. Agrociencia 2006, 40, 125–137. [Google Scholar]
  48. Reyes-Hernández, V.; Vargas-Hernández, J.; López-Upton, J.; Vaquera-Huerta, H. Phenotypic similarity among Mexican populations of Pseudotsuga Carr. Agrociencia 2006, 40, 545–556. [Google Scholar]
  49. Cruz-Nicolás, J.; Vargas-Hernández, J.J.; Ramírez-Vallejo, P.; López-Upton, J. Genetic diversity and differentiation of Pseudotsuga menziesii (Mirb.) Franco populations in Mexico. Rev. Fitotec. Mex. 2011, 34, 233–240. [Google Scholar]
  50. Lai, B.S.; Funda, T.; Liewlaksaneeyanawin, C.; Klápště, J.; Van Niejenhuis, A.; Cook, C.; Stoehr, M.U.; Woods, J.; El-Kassaby, Y.A. Pollination dynamics in a Douglas-fir seed orchard as revealed by pedigree reconstruction. Ann. For. Sci. 2010, 67, 807–808. [Google Scholar]
  51. Kess, T.; El-Kassaby, Y.A. Estimates of pollen contamination and selfing in a coastal Douglas-fir seed orchard. Scand. J. For. R. 2015, 30, 266–275. [Google Scholar] [CrossRef]
  52. Aguirre-Planter, E.; Furnier, G.R.; Eguiarte, L.E. Low levels of genetic variation within and high levels of genetic differentiation among populations of species of Abies from southern Mexico and Guatemala. Am. J. Bot. 2000, 87, 362–371. [Google Scholar] [CrossRef]
  53. Falconer, D.S.; Mackay, T.F.C. Introduction to Quantitative Genetics, 4th ed.; Longmans Green: Harlow, Essex, UK, 1996. [Google Scholar]
  54. Savolainen, O.; Kuitttinrn, H. Small population processes. In Forest Genetics: Principles and Practice; Young, A.D., Boyle, T., Eds.; CSIRO Publishing: Clayton, Australia, 2000. [Google Scholar]
  55. Ledig, F.T.; Hodgskiss, P.D.; Jacob-Cervantes, V. Genetic diversity mating system, and conservation of a Mexican subalpine relict, Picea mexicana Martínez. Conserv. Genet. 2002, 3, 113–122. [Google Scholar] [CrossRef]
  56. Sala, O.E.; Chapin, F.S.; Armesto, J.J.; Berlow, E.; Bloomfield, J.; Dirzo, R.; Huber-Sanwald, E.; Huenneke, L.F.; Jackson, R.B.; Kinzig, A.; et al. Global biodiversity scenarios for the year 2100. Science 2000, 287, 1770–1774. [Google Scholar] [CrossRef] [PubMed]
  57. Tan, J.; Zhao, Z.-G.; Guo, J.-J.; Wang, C.-S.; Zeng, J. Genetic diversity and population genetic structure of Erythrophleum fordii Oliv., and endangered rosewood species in south China. Forest 2018, 9, 636. [Google Scholar] [CrossRef]
  58. El-Kassaby, Y.A.; Ritland, K. Genetic variation in low elevation Douglas-fir of British Columbia and its relevance to gene conservation. Biodivers. Conserv. 1996, 5, 779–794. [Google Scholar] [CrossRef]
  59. Hedrick, P.W. Perspective: highly variable loci and their interpretation in evolution and conservation. Evolution 1999, 53, 313–318. [Google Scholar] [CrossRef] [PubMed]
  60. Mápula-Larreta, M.; López-Upton, J.; Vargas-Hernández, J.J.; Hernández-Livera, A. Reproductive indicators in natural populations of Douglas-fir in Mexico. Biodivers. Conserv. 2007, 16, 727–742. [Google Scholar] [CrossRef]
  61. Ledig, F.T. Genetic variation in Pinus. In Ecology and Biogeography of Pinus; Richardson, D.M., Ed.; Cambridge University Press: Cambridge, UK, 1998; pp. 251–280. [Google Scholar]
  62. Nybom, H. Comparison of different nuclear DNA markers for estimating intraspecific genetic diversity in plants. Mol. Ecol. 2004, 13, 1143–1155. [Google Scholar] [CrossRef]
  63. Hamrick, J.L.; Godt, M.J.W. Effects of life history traits on genetic diversity in plant species. Philosoph. Trans. R. Soc. B 1996, 351, 1291–1298. [Google Scholar]
  64. Pérez-González, M.A.; Caujapé-Castells, J.; Sosa, P.A. Allozyme variation and structure of the Canarian endemic palm tree (Populus tremuloides Michx). J. Hered. 1995, 86, 454–460. [Google Scholar]
  65. Petit, R.J.; El Mousadik, A.; Pons, O. Identifying populations for conservation on the basis of genetic markers. Conserv. Biol. 1998, 12, 844–855. [Google Scholar] [CrossRef]
  66. Vinceti, B.; Loo, J.; Gaisberger, H.; Van Zonneveld, M.J.; Schueler, S.; Konrad, H.; Kadu, C.A.; Geburek, T. Conservation priorities for Prunus africana defined with the aid of spatial analysis of genetic data and climatic variables. PLoS ONE 2013, 8, e59987. [Google Scholar] [CrossRef]
  67. López-Upton, J.; Valdez-Lazalde, R.; Ventura-Ríos, A.; Vargas-Hernández, J.J.; Guerra de la Cruz, V. Extinction risk of Pseudotsuga menziesii populations in the central region of Mexico: An AHP analysis. Forest 2015, 6, 1598–1612. [Google Scholar] [CrossRef]
Figure 1. Geographic location of natural populations of Pseudotsuga menziesii (Mirb.) Franco, where plant material was collected. Left map represents the most northern surveyed populations in the states of Veracruz and Querétaro. Right map shows populations located in the states of Tlaxcala and Puebla. Names of populations are as follows: (1) La Barranca, (2) Carbonero Jacales, (3) Tlaxco, (4) Cruz de León, (5) Emiliano Zapata, (6) Tlalmotolo, (7) La Rosa, (8) Villareal, (9) Cuatemoxla, (10) La Caldera, (11) Axopilco, (12) Apizaquito. The color of the dots indicates the genetic group assigned by the STRUCTURE analysis.
Forests 10 00101 g001
Figure 2. Graphical dispersion of 12 populations using principal coordinate analysis (PCoA), showing two main groups indicated by dotted circles with colors green (Group I) and red (Group II). Groups were formed in accordance to the UPGMA (unweighted pair group method using arithmetic average) dendrogram. The color of the dots indicate the genetic groups assigned by the STRUCTURE analysis.
Forests 10 00101 g002
Figure 3. UPGMA dendrogram of 12 natural populations of Pseudotsuga menziesii (Mirb.) Franco, constructed from genetic distances [39]. Support values for each branch are indicated in parentheses.
Forests 10 00101 g003
Figure 4. Delta K values for STRUCTURE analysis of Pseudotsuga menziesii (Mirb.) Franco populations, where ΔK, calculated according to Evanno et al. [46] is plotted against the number of modeled gene pools (K).
Forests 10 00101 g004
Figure 5. Graphic representation of the genetic structure of the Pseudotsuga menziesii (Mirb.) Franco populations analyzed. Each column represents each of the populations. The K groupings are indicated by colors. The numbers on the axis indicate the coefficient of ancestry of the populations.
Forests 10 00101 g005
Table 1. Geographic data of the locations of the Pseudotsuga menziesii populations analyzed in this study.
Population 1StateNumber of IndividualsAltitude (m.a.s.l.) 2Longitude WLatitude N
La BarrancaQuerétaro16218799°38′44″21°08′59″
Carbonero JacalesVeracruz20258998°28′15″20°25′16″
TlaxcoTlaxcala20269898°05′42″19°37′21″
Cruz de LeónPuebla20282597°52′19″19°34′52″
Emiliano ZapataTlaxcala20288497°55′00″19°33′31″
TlalmotoloPuebla20273997°44′18″19°33′05″
La RosaTlaxcala20286397°54′32″19°31′23″
VillarealTlaxcala20297697°53′53″19°31′11″
CuatexmolaPuebla20312597°49′46″19°30′01″
La CalderaPuebla20286697°52′15″19°29′58″
AxopilcoTlaxcala18288097°55′37″19°28′10″
ApizaquitoPuebla20310097°18′41″19°12′11″
1 Populations are sorted based on LN values. 2 m.a.s.l.= meters above sea level.
Table 2. Characteristics of 12 pairs of microsatellite markers used for the analysis of genetic diversity and structure of 12 Pseudotsuga menziesii (Mirb.) Franco populations.
LocusSequence (3′ to 5′)Observed Size (bp)Tm (°C)
PmOSU_3H4F: TTTGCCGTCACATTTTT ATTG198–20255
R: GCATCTTTCAGGCATAGTCT
BCPsmAG27F: ACGGGGAGGGAGGGTAAC120–12455
R: CCTTCCTCTCCACTTTCAACC
PmOSU_3B9F: TGTGTAAAAATGTCTAATCC152–16450
R: ACTACTATTCGAGGTTTTCT
PmOSU_4E9F: GTTGGTTGTGTATATTCAGTTT116–12255
R: GCCTCTTCTTGGTTTGGT
PmOSU_3G9F: ATTCCTTTTGAGACCTACTT150–15850
R: CTTCAAAAATTCCTACAACA
PmOSU_2B6 F: TTGTTGGGTATAATTTTCA150–18047
R: TAATAAAATAGCTCTAACCC
PmOSU_2D6F: GGAAAATATACATCTCACGAC164–17655
R: AAGCATGCGTACTAGGTG
PmOSU_2D9F: TCGATTTACGCTTTTTTCTC162–17655
R: TGTTTATCCCCAGTCTCAAG
BCPsmAG20F: CATAGAGAGGGGGCATATCAA126–14655
R: ACCCCCGAACCGTTACTAC
PmOSU_2G12F: CAAGGACTCATATGGGAAA240–25450
R: AACATCAGTAATAACCTTTT
PmOSU_2D4F: TTATTGCACATGAGTATTATGA150–19050
R: CAGATGTTGTTTTTTATACCAC
PmOSU_783F: GAGCTGATGCCTTGAAGACT250–27055
R: CAAGTCAGTTCACAATTCCT
Source: BCPsm markers [25] and PmOSU markers [26].
Table 3. Average estimates of parameters fixation indexes, gene flow, and private alleles in the 12 pairs of microsatellites analyzed.
LocusNaFISFITFSTNmNP
PmOSU_3H431.0001.0000.0753.0670
BCPsmAG273−0.599−0.3180.1761.4040
PmOSU_3B930.7640.7800.0703.3252
PmOSU_4E940.4500.5590.1970.9580
PmOSU_3G950.0770.7540.7330.0893
PmOSU_2B660.7010.8530.5070.2461
PmOSU_2D67−0.047−0.0160.0298.6776
PmOSU_2D97−0.295−0.1850.0842.5752
BCPsmAG2080.5540.6360.1831.0981
PmOSU_2G1280.2270.3590.1701.3462
PmOSU_2D490.9440.9640.3580.5271
PmOSU_783100.0280.0820.0544.6544
Mean6.080.2340.4520.2850.647
Na = Average number of alleles per locus, FIS = Coefficient of inbreeding within populations, FIT = Coefficient of total inbreeding, FST = Coefficient of differentiation, Nm = Number of migrants, NP = number of private alleles.
Table 4. Genetic diversity parameters in the 12 natural populations of Pseudotsuga menziesii (Mirb.) Franco, included in this study.
PopulationN%PNaAeHoHeNP
La Barranca16183.832.7501.7960.3010.3714
Carbonero Jacales20183.333.1662.0670.2380.3835
Tlaxco20175.002.2501.4160.1620.2260
Cruz de León20166.672.1671.5090.1910.2571
Emiliano Zapata20175.002.6661.5180.2000.2463
Tlamotolo20183.332.6661.7520.3040.3651
La Rosa20100.003.0001.8090.2250.3643
Villareal20183.332.5001.5500.2310.2862
Cuatexmola20183.332.9161.6930.2700.3202
La Caldera20166.672.7501.6150.2200.2671
Axopilco18175.002.8331.6350.2310.2870
Apizaquito20158.332.3331.5190.1870.2510
Mean 177.862.6671.6570.2300.302
* Overall234100.006.0832.0390.2290.417
N = Number of individuals; %P = Percentage of polymorphism; Na = Average number of alleles per locus, Ae = Effective number of alleles, Ho = Observed heterozygosity, He = Expected heterozygosity, NP = Number of private alleles. *To calculate the overall values, we assumed that there was no population structure, and that there was a single panmictic population.
Table 5. Analysis of molecular variance (AMOVA) in 12 natural populations of Pseudotsuga menziesii (Mirb.) Franco.
AMOVA
Sum of SquaresVariance ComponentPercentage of VariationΦst
Between populations1323.9570.71127.860
Within population1835.9681.84172.149
Total1159.9252.552100.0000.278
p < 0.05 based significance tests (10,000) permutations.
Table 6. Estimated proportion of ancestry (Q) [42] for the 12 Pseudotsuga menziesii (Mirb.) Franco populations analyzed.
PopulationGenetic Group
III
Emiliano Zapata0.9650.035
Cruz de León0.9790.021
La Caldera0.9780.022
Cuatexmola0.7880.212
Tlalmotolo0.1070.893
Apizaquito0.0220.978
La Rosa0.0490.951
Axopilco0.3030.697
Tlaxco0.1730.827
Villareal0.8490.151
Carbonero Jacales0.5620.438
La Barranca0.1450.855

