Article

Estimation of Forest NPP and Carbon Sequestration in the Three Gorges Reservoir Area, Using the Biome-BGC Model

1
Research Institute of Forest Ecology, Environment and Protection, Chinese Academy of Forestry, Beijing 100091, China
2
Key Laboratory of Forest Ecology and Environment, National Forestry and Grassland Administration, Beijing 100091, China
3
National Forestry-Grassland Economics and Development Research Center, National Forestry and Grassland Administration, Beijing 100714, China
*
Author to whom correspondence should be addressed.
Forests 2019, 10(2), 149; https://doi.org/10.3390/f10020149
Submission received: 14 December 2018 / Revised: 30 January 2019 / Accepted: 6 February 2019 / Published: 11 February 2019
(This article belongs to the Section Forest Ecology and Management)

Abstract

:
The Three Gorges Reservoir area is one of the most ecologically sensitive areas in China, and the forest landscape pattern in this region shows dramatic change due to the influence of the Three Gorges reservoir project. In this study, the locally parameterized Biome-BGC model, generated with long-term meteorological monitoring data, was used to simulate net primary productivity (NPP) and carbon density of the vegetation layer, the litter layer, and the soil layer for various forest types from 1992 to 2012 in this area. The total and unitary forest NPP presented obvious annual fluctuation under the combined influences of land use change and extreme weather events. Apart from the year 2006, from 1992 to 2012, the NPP values of each forest type showed an increasing trend, although the growth rates decreased. In 2006, due to abnormally high air temperatures and less precipitation, total and unit area forest NPP values decreased by 46.3% and 53.9%, respectively, compared to 2002. From 1992 to 2012, the carbon stocks of the forest vegetation layer, the litter layer, the soil layer, and the entire area gradually increased with decreasing growth rates. Additionally, forest carbon stocks were high in the east and the south and low in the west and the north. Generally, the forest productivity is greatly affected by the physiological and ecological characteristics of the plants themselves as well as the environmental factors, whereas total forest productivity is largely influenced by human activities. The increase in forest area and the optimization of the forest landscape pattern could improve the forest productivity and carbon sequestration.

1. Introduction

Climate warming is currently receiving considerable attention and has become a global research focus. Forests are the main vegetation cover in terrestrial ecosystems, and forest productivity and biomass play an important role in global climate change and circulation of substances [1]. Via photosynthesis, forests fix atmospheric CO2 and accumulate carbon in their biomass, litter, and soil. In addition, due to biological respiration, litter decomposition, soil carbon degradation, and natural or artificial disturbances, forests emit carbon into the atmosphere in the form of CO2. Although the forest area only accounts for about one third of the total terrestrial ecosystem area, carbon storage in aboveground forest vegetation is equivalent to 80% of the aboveground total organic carbon of terrestrial ecosystems; belowground carbon storage accounts for 40% of that of the entire terrestrial ecosystem [2].
The Three Gorges Reservoir area (TGRA) of the Yangtze River is a new concept derived from the construction of the Three Gorges Dam Project since 1992. It refers to the region submerged due to the water level rise caused by the Three Gorges Dam (water level 175 m; height of the dam wall 185 m). The Three Gorges Reservoir Area (TGRA) of the Yangtze River is the most ecologically sensitive and fragile area in China with complex terrain and frequent natural disasters, which is located in the transition zone between a mountainous region and watershed region. As a special human activity disturbance, the Land Use/Cover Change (LUCC) was seriously affected by the construction of the reservoir, including the establishment of new towns and cities, migration of millions of people and the extended railway and highway nets [3]. In recent decades, the built-up land increased the most, largely and rapidly, followed by water bodies. They were transformed from croplands, forests and grasslands.
Against the background of climate change and land use change, the present situation of the forest ecosystem in the Three Gorges Reservoir area, as well as its response to global climate change, has become the focus of a large number of studies both in China and around the world [4,5,6]. This study focused on the temporal and spatial variations in forest productivity and carbon storage in the TGRA as well as the corresponding influencing factors. The research results are significant in revealing the extent and scope of human disturbance effects on forest productivity and forest carbon storage and to provide evidence for predicting the response of forest productivity to future climate change scenarios. Therefore, a locally parameterized Biome-BGC model was used to simulate net primary productivity (NPP) and carbon density of the vegetation layer, the litter layer, and the soil layer for various forest types from 1992 to 2012 in the TGRA in order to reveal the changes.

2. Materials and Methods
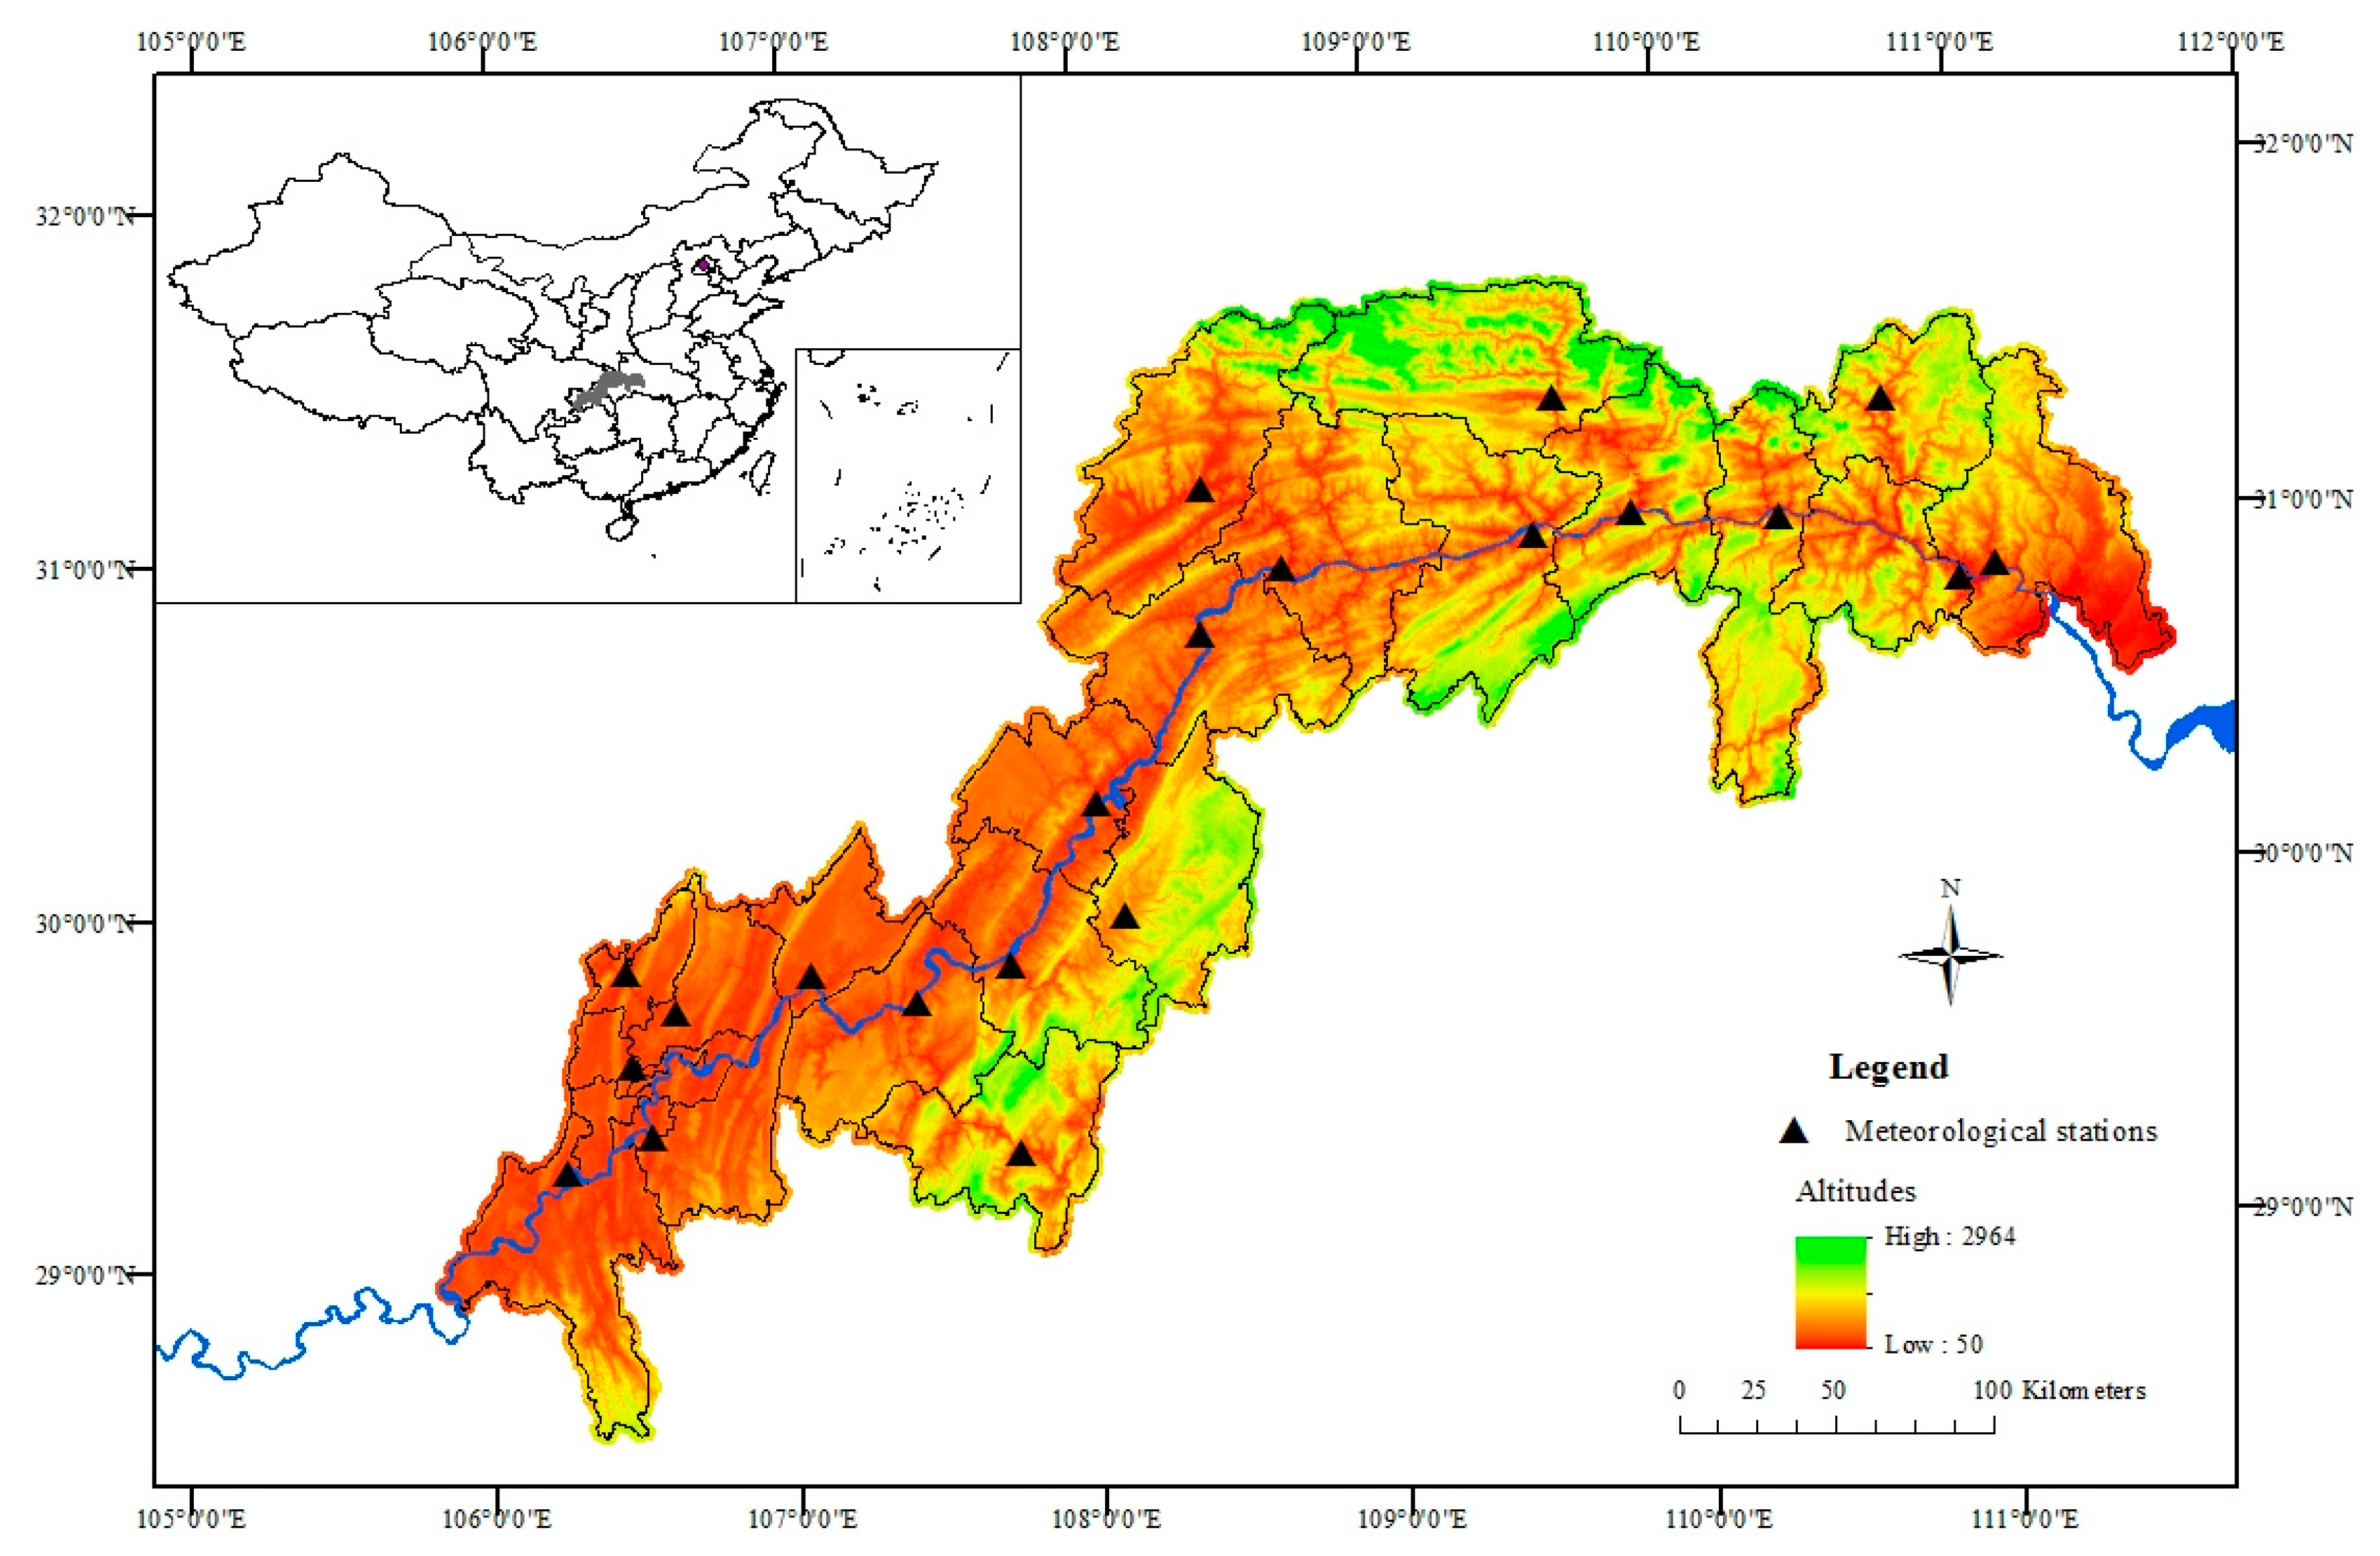
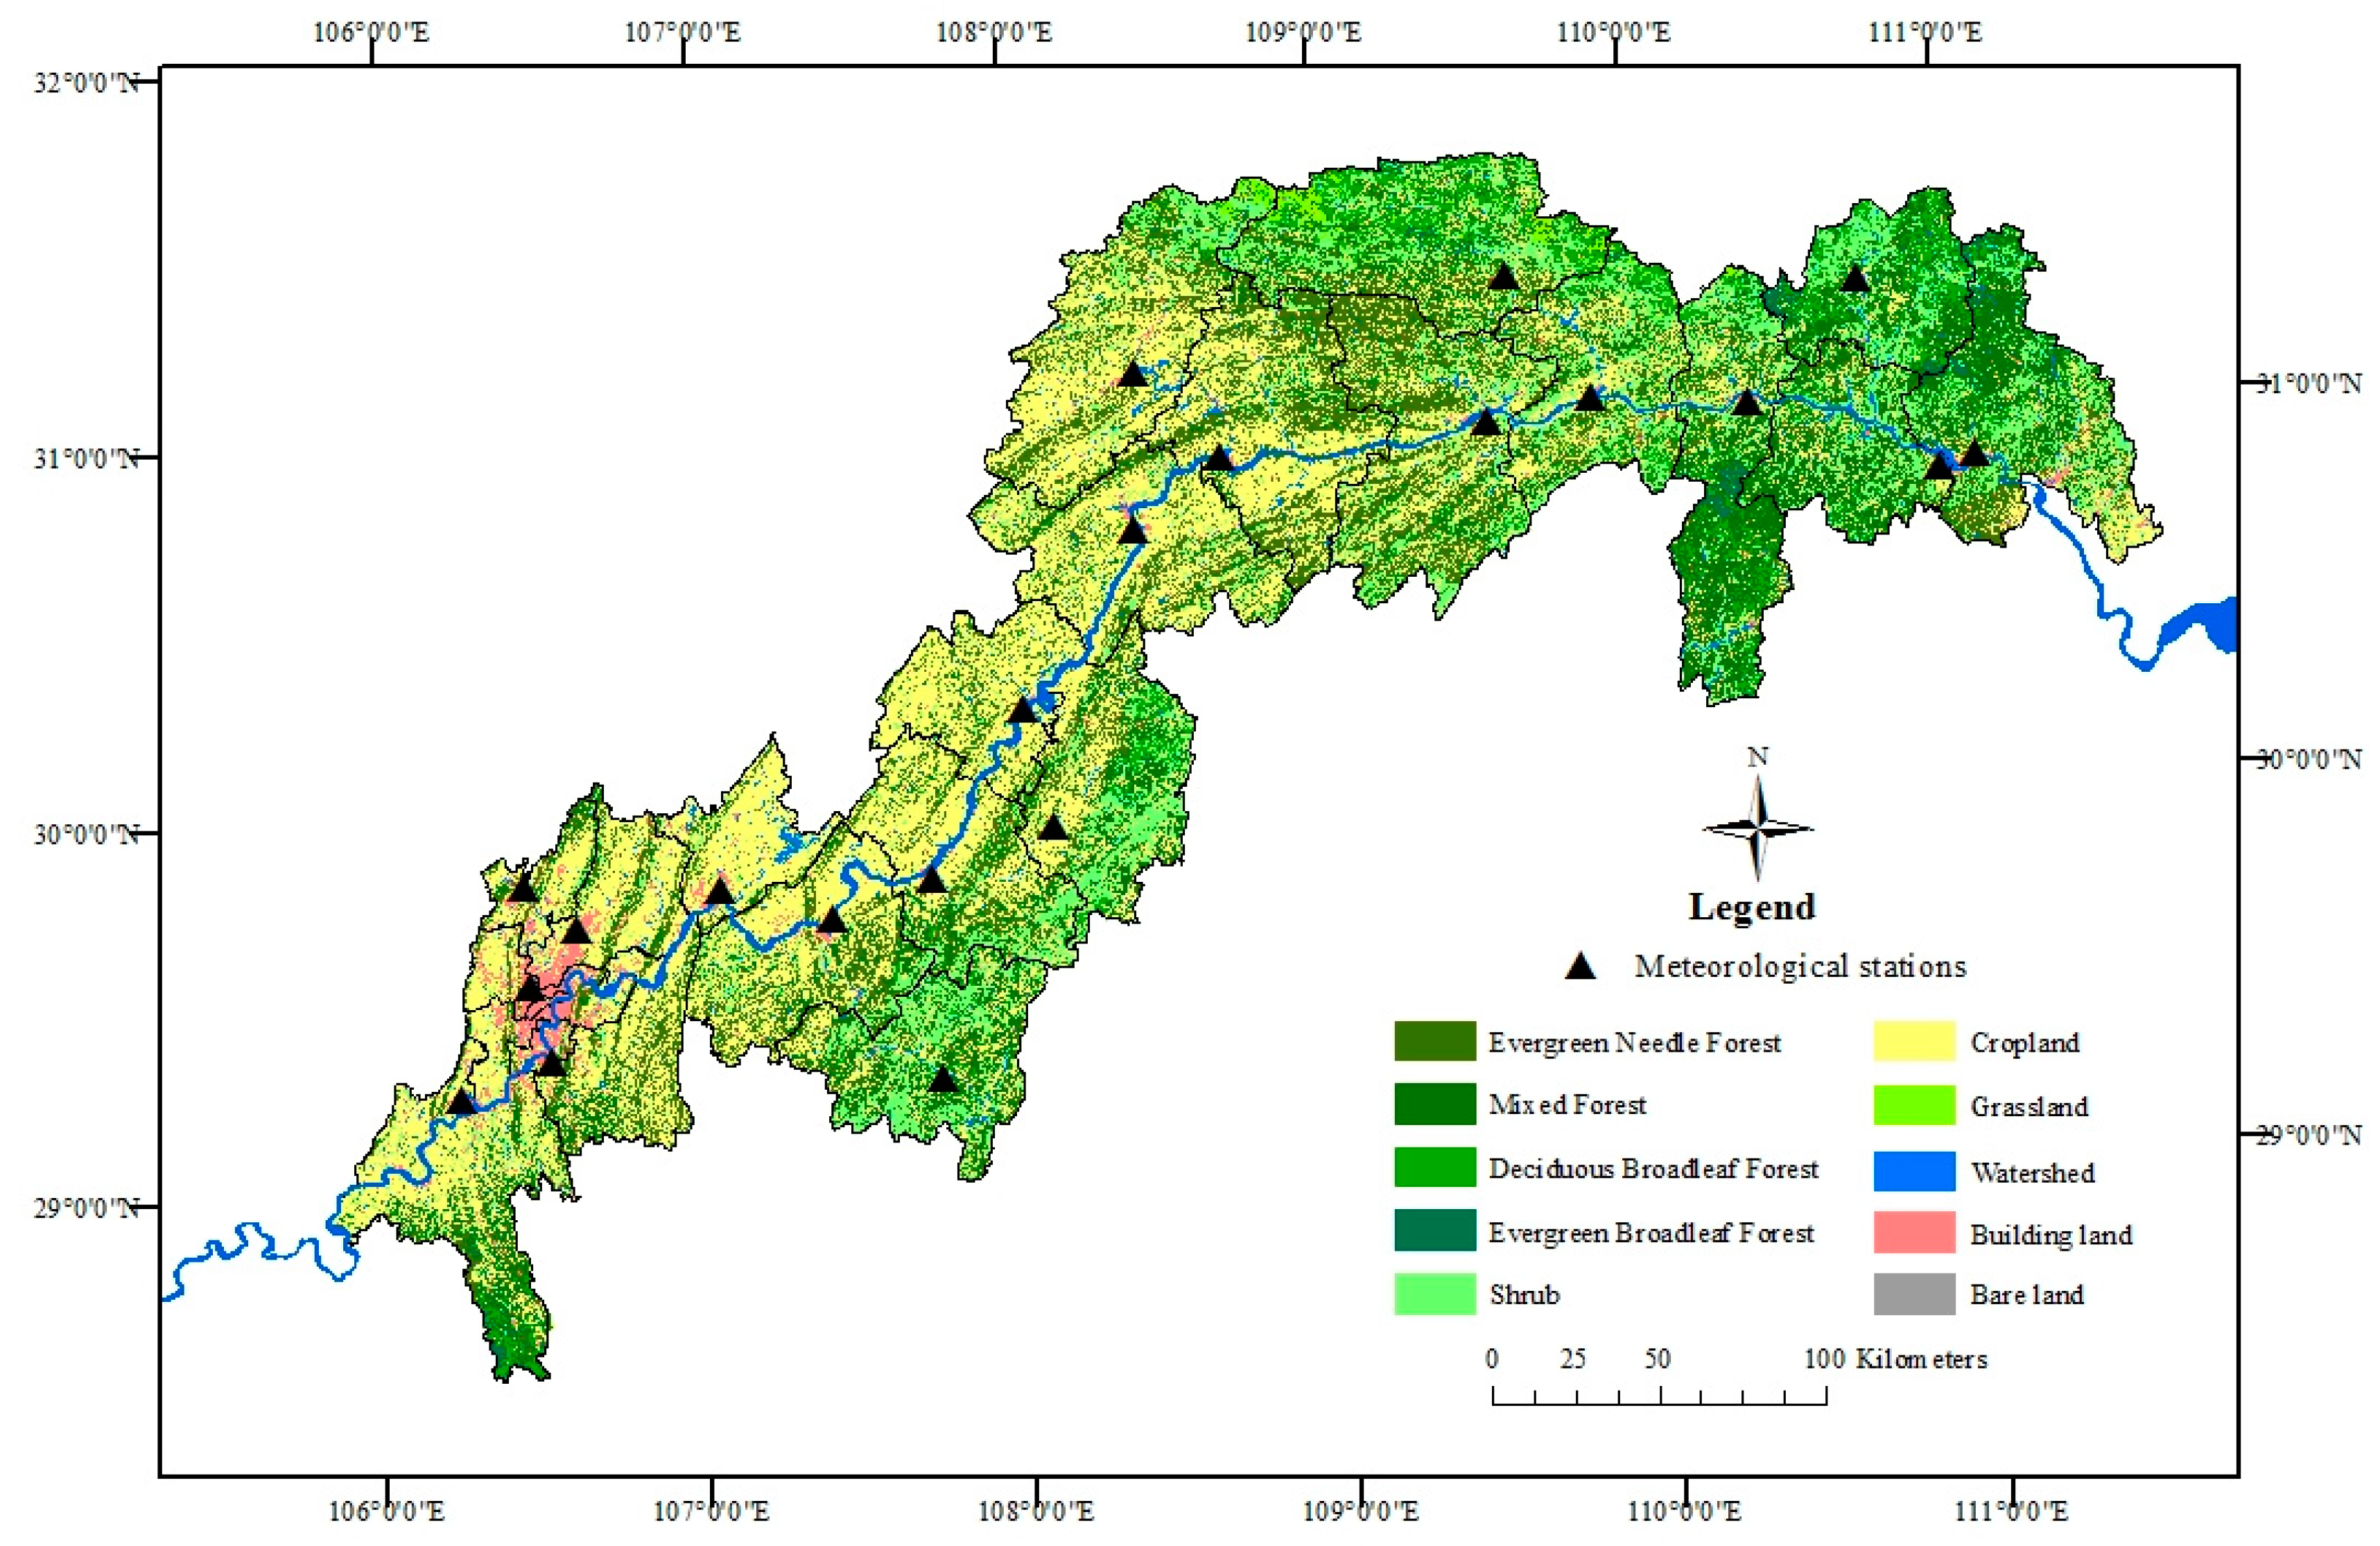
2.1. Study Area

The Three Gorges Reservoir Area is located at 106°16′–111°28′ E, and 28°56′–31°44′ N and covers a total of 26 district (counties), 22 of which are located in Chongqing Municipality directly under the Central Government while 4 are situated in Hubei Province. The reservoir catchment covers an area of about 5.8 × 10⁴ km2, with a total population of about 22 million people. The climate is humid subtropical monsoon, with an annual average temperature of 16–18 °C and an annual precipitation of 1000–1300 mm, with early springs, hot summers, wet autumns, and warm winters [7].
The TGRA is situated on the eastern margin of the second step of the three geomorphic steps in China. It is at the junction of three tectonic units: the Daba Mountain fold belt, the parallel ridge valley in eastern Sichuan and the Sichuan-Hubei-Hunan-Guizhou uplift fold belt. Mountains account for about 74%, hills account for about 22%, plains and dams account for only 4%. The terrain of this area is high in the east and low in the west with an altitude range from 50 m to 2900 m. From the east to the west, the area can be divided into three parts: the eastern mountain part, the central parallel ridge valley part and the western hills (Figure 1).
The TGRA has rich plant resources. It contains 6088 species of vascular plants, belonging to 1428 genera and 208 families, and the species in this area account for about 20% of the total plant species in China [8]. The main species are Pinaceae, Cupressaceae, Juglandaceae, Fagaceae, Hamamelidaceae, Roseceae, Rutaceae, Anarcardiaceae, Theaceae, Cornaceae, Ericaceae, Betulaceae, Leguminosae, Gramineae and Pteridophyta [9,10]. Based on the characteristics of the forest types and the main species composition, the forest vegetation in the TGRA can be divided into four major types, namely, coniferous forest, deciduous broadleaf forest, evergreen broadleaf forest, and shrub forest [11,12]. Due to excessive exploitation and interference for decades, the natural forest area is extremely rare in this region, and most of the natural forests are secondary forests. The forest type structure is relatively simple, and Pinus massoniana and Cupressus funebris are the most widely distributed species with the highest abundance [13]. The forests are mainly distributed in the eastern mountain part, the western Karst Mountains, and the low hilly areas in the south (Figure 2).

2.2. Spin-up and Run the Biome-BGC Model

The Biome-BGC model is one of the typical biogeochemical models. The Biome-BGC version 4.2 (Numerical Terradynamic Simulation Group, Missoula, MT, USA) was used in this study, which can predict the flow and storage of carbon, nitrogen, water, and radiation in terrestrial vegetation and soil, with a time-step of one day, based on daily meteorological data. In addition, the Biome-BGC model considers how global climate change and circulation of substances are affected by environmental conditions such as temperature, precipitation, solar radiation, soil texture, and atmospheric CO2 concentration [14,15,16,17]. The Biome-BGC model has been widely used. For example, Ueyama M et al. applied this model to simulate the carbon flux of an Alaska black pine forest and verified the model by comparing the simulated values with the measured values by the eddy covariance method. Their results showed that gross primary productivity (GPP), net ecosystem carbon exchange capacity (NEE), and ecosystem respiration rates (RE) obtained by the two methods were highly correlated [18]. Similarly, they also found in another study that the GPP, NEE, and RE values simulated by the Biome-BGC model were highly consistent with the observed values based on AsiaFlux [19]. In China, this model has also been used to simulate the characteristics of NPP under current climatic conditions and to predict the NPP characteristics under future climate change scenarios, not only for a particular tree species, but also for forest ecosystems in different regions, such as Picea schrenkiana in Tianshan Mountains of Xinjiang [20], a Pinus elliottii plantation in a hilly Krasnozem area [21], a Quercus variabilis forest in the Beijing mountainous area [22], a Quercus variabilis forest [23], a Larix principis-rupprechtii forest in Beijing mountain area [24], a Robinia pseudoacacia forest [25], as well as the forest ecosystem in Fujian Province located in a subtropical zone and which has the highest forest coverage in China [26], and a forest ecosystem on the northern slope of Tianshan Mountains in the arid region of China [27]. Compared with and verified by the measured values estimated according to the classical ecological survey method, the simulated values had a high correlation. Therefore, the Biome-BGC model can not only reproduce dynamic characteristics of short-term carbon fluxes but can also simulate long-term distribution patterns and dynamics of carbon storage as well as the responses of these processes to environmental changes, including climate change [28,29,30,31,32,33].
Firstly, the Biome-BGC model was spun-up based on a set of long-term meteorological data, site data, and ecophysiological data. As a hypothesis, the CO2 concentration values and nitrogen deposition values prior to the industrial revolution were used as a steady state ecosystem. After repeated and continuous simulation, the model reached an equilibrium state. In the state of equilibrium, the meteorological data, site data, and ecophysiological data during the study period were launched into the Biome-BGC in order to run the model and then obtain the final results [14,34].

2.3. Parameterization of the Biome-BGC Model

Three files are required to run the Biome-BGC model: initialization file, meteorological data file, ecophysiological constants file.
Initialization files are used to control the running process of the model. Firstly, the reading paths of the prepared meteorological and ecophysiological parameters files are specified. Then, the environmental information of each county needs to be described (Table 1), including latitude, altitude, effective depth of soil, soil texture, albedo, etc. Finally, the result variables of model simulation output are defined. The soil characteristic parameters in this study were based on the “National 1:1 million Digital Soil Map” developed by Nanjing Soil Research Institute of Chinese Academy of Sciences and Soil Environment Department of the Ministry of Agriculture of China.
The meteorological data file is comprised of daily maximum temperature, daily minimum temperature, daily average temperature, daily precipitation, daily water vapor pressure difference, daily short wave radiation, and day length. Measured values from the national ground stations of China Meteorological Administration within the TGRA were used; each district (county) had a located meteorological station (Figure 1 and Figure 2 shown the distribution of the stations), with a total of 34 years (from 1981 to 2014) of observations.
The ecophysiological parameter files of the Biome-BGC model are based on seven types: deciduous broadleaf forest (DBF), evergreen broadleaf forest (EBF), evergreen needle leaf forest (ENF), deciduous needle leaf forest (DNF), shrub forest (SHRUB), C3 grassland, and C4 grassland. The Numerical Terradynamic Simulation Group (NTSG) of the Montana University provided a set of default ecophysiological parameters, containing 42 parameters for each vegetation type. These default values are assigned based on the average value of parameters obtained from the literature research or the value determined by clustering analysis after literature retrieval and statistical analysis of each parameter for each community [35]. According to the forest vegetation types and the main species in the TGAR, the ecophysiological constants of Pinus massoniana and oaks were used for the ENF and DBF, while the default parameters were used for the EBF and SHRUB. For the mixed coniferous broadleaved forest (MIX), the Biome-BGC model does not provide the corresponding ecophysiological parameters, making a direct assessment of these parameters impossible. However, previous studies have shown that we can effectively simulate the productivity of MIX forests by simulating the productivity of both vegetation types respectively and using a subsequent proportion conversion like 50% for each forest type [36,37]. Some parameters, such as carbon allocation from roots to leaves, carbon allocation from stems to leaves, carbon allocation from thick roots to stems, carbon to nitrogen ratio of leaves, carbon to nitrogen ratio of leaf litter, carbon to nitrogen ratio of roots, and carbon to nitrogen ratio of woody parts, can be locally parameterized by actual measurement or literature findings [22,23,26,38,39,40]; for other parameters that are difficult to be obtained, default values can be adopted, which are provided by the model (Table 2).

2.4. Validation of The Biome-BGC Model

In this study, the simulation results of the Biome-BGC model were validated through comparative analysis of observed values and simulated values, combined with relevant literature findings. The observed values of NPP were derived from the analytic-tree fitted biomass model, obtained from a sample-plot survey based on the sub-compartment data of forest resource inventory and planning projects in 2003 and 2013 [41,42]. The carbon content in various plant organs, litters, and A and B layers of soil are determined by experiment, and the observed values of carbon density were estimated according to the carbon storage obtained from the biomass and the area data [43]. Fu et al. used the CBM-CFS3 model as the basic platform and simulated annual NPP values (2.20–5.08 Mg C hm−2 year−1) and carbon densities of various forest types in the Three Gorges Reservoir area by plotting age-harvest growth curves for the major forest types [44]. Wang et al., based on forest resources inventory data from three periods (6, 7, and 8), used the forest stock volume (increment) extension method to estimate average NPP values of forests in the Three Gorges Reservoir area; NPP ranged between 2.85 and 6.19 Mg C hm−2 year−1 [45]. The comparison results are shown in Table 3 and Table 4.
By comparison, the NPP values of the ENF and the Mixed coniferous and broadleaf forests, simulated by the Biome-BGC model, were slightly larger than the sample-plot measured values. The simulated carbon density values of the ENF and the Mixed coniferous and broad-leaf forest were close to the measured values, whereas the simulated carbon density values of the DBF, the EBF, and the Shrub forest were lower than the measured values. In spite of this, the values simulated via the Biome-BGC model were consistent with the values simulated by the CBM-CFS3 model and agreed with the estimation results based on the forest resource inventory. Considering that our research focused on the regional scale, the simulation results based on the Biome-BGC model can accurately reflect the real situation, verifying that this model is suitable for the Three Gorges Reservoir area.

2.5. Data Processing and Analysis

According to the different construction stages of the Three Gorges project, we selected five research time-points, namely, 1992, 1996, 2002, 2006, and 2012, to represent five stages of the project process, including the evaluation stage, main channel cutoff, formal impoundment, construction completion, and impoundment to 175 m for full operation, respectively. On this basis, the simulation results from the BIOME-BGC model together with the areas of different forest types derived from remote sensing images at research time-points with spatial geography information were used to analyze the dynamic changes in forest productivity and carbon storage in the reservoir area.
The total forest net primary productivity (NPP) for each respective year was obtained by calculating the NPP values from the Biome-BGC model and the corresponding areas of various forest types for each district (county).
N P P t o t a l = i = 1 5 j = 1 20 N P P i , j × S i , j
N P P m e a n = N P P t o t a l i = 1 5 j = 1 20 S i , j
where NPPtotal is the total forest NPP in a certain year (Tg C); NPPi,j and Si,j represent the NPP values (t hm−2 year−1) and area (hm−2) of the i-th (i = 1,2,3,...,5) forest type in the j-th (j = 1,2,3,...,20) district (county) in this year; NPPmean is the area-weighted average NPP value (t hm−2 year−1) of the forest in the reservoir area in the respective year.
The carbon stocks of forest vegetation, litter, and soil can be calculated by the carbon density values of the vegetation layer, the litter layer, and the soil layer obtained by the Biome-BGC and the corresponding area of various forest types for the district (county) in the respective year. Subsequently, the sum of the above three carbon stocks represents the total forest carbon stock.
C v e g = i = 1 5 j = 1 20 D v e g i , j × S i , j
C l i t r = i = 1 5 j = 1 20 D l i t r i , j × S i , j
C s o i l = i = 1 5 j = 1 20 D s o i l i , j × S i , j
C t o t a l = C v e g + C l i t r + C s o i l
where Cveg, Clitr, and Csoil are the carbon stocks of the vegetation layer, the litter layer, and the soil layer in a given year, respectively (Tg C); Dvegi,j, Dlitri,j, and Dsoili,j are the carbon densities (t hm−2) of the forest vegetation layer, the litter layer, and the soil layer for the i-th (i = 1,2,3,...,5) forest type in the j-th (j = 1,2,3,...,20) district (county) in a given year, respectively; Si,j (hm−2) is the current area of the i-th (i = 1,2,3,...,5) forest type in the j-th (j = 1,2,3,...,20) district (county); Ctotal is the total forest carbon stock (Tg C) of the reservoir area in a given year.

3. Results

3.1. Interannual Variation in NPP for Different Forest Types

The annual average values of NPP for various forest types in the reservoir area from 1981 to 2014 are shown in Figure 3. The simulation results indicated that the interannual variation of NPP was drastic, presenting five consecutive and alternatively fluctuating curves according to the different forest types. The higher and lower values exhibited consistent variation trends. Coniferous forests accounted for the largest area in the reservoir region and were mainly composed of Pinus massoniana forest, cedar forest, and Chinese fir forest, accounting for 35%–40% of the total forest area. The average NPP value was 550.29 g C m−2 year−1, ranging between 262.93 and 807.71 g C m−2 year−1, with a value difference of 544.78 g C m−2 year−1 between the maximum and the minimum values. Mixed coniferous and broadleaf forests were mainly dominated by Pinus massoniana, cedar, Chinese fir, Quercus variabilis, and oriental white oak, accounting for 15%–18% of the total forest area. The average NPP value was 504.49 g C m−2 year−1, varying between 307.02 and 654.63 g C m−2 year−1. The deciduous broadleaf forest in the reservoir region is severely disturbed by human activities and presented a stripped distribution pattern. It accounted for 11% to 14% of the total forest area. The average NPP value was 458.69 g C m−2 year−1, ranging between 351.12 and 531.62 g C m−2 year−1. The evergreen broadleaf forest represented the zonal vegetation in the reservoir area, but excessive exploitation had led to serious disturbance and destruction of the original vegetation. The area with natural forest was extremely limited and mainly consists of secondary forests, accounting for only about 5% of the total forest area. The average NPP value was 456.40 g C m−2 year−1, ranging between 248.69 and 607.67 g C m−2 year−1. The shrub forest is dominated by Cotinus coggygria, Rhus javanica L., Coriaria nepalensis and Lespedeza bicolor, and its area accounted for about 30% of the total forest area [46]. The average NPP value was 274.99 g C m−2 year−1, ranging between 160.66 and 484.07 g C m−2 year−1.

3.2. Temporal Evolution of Forest Productivity and Carbon Sequestration in the TGRA

3.2.1. Forest Productivity

The total forest NPP and the unit area NPP as well as the variation situations of NPP for various forest types during 1992–2012 are shown in Table 5. Both the total and unit area forest NPP in the TGRA presented an obvious interannual fluctuation. In 1992, the values were 7.827 Tg C and 3.833 Mg C hm−2 year−1, respectively, while in 1996, total and unit area forest NPP values showed similar variations and increased by 44.8 and 41.8% compared to the values in 1992, reaching 11.338 Tg C and 5.437 Mg C hm−2 year−1. In 2002, total forest NPP continued to increase, albeit with a declining growth rate, while it increased by 17.7% in 2002 compared with the value in 1996. In contrast, the unit area NPP value decreased slightly in 2002 by 3.72% compared with that in 1996. In 2006, total and unit area NPP values decreased by 46.3 and 53.9% compared with the values in 2002, reaching the minimum values of 7.171 Tg C and 2.415 Mg C hm−2 year−1, respectively. In 2012, total forest NPP reached the maximum value of 14.999 Tg C, while the unit area NPP also increased to 4.465 Mg C hm−2 year−1, which was 109.2 and 84.9% higher, respectively, compared to the values in 2006.
From 1992 to 2012, the NPP contribution ratio of each forest type to the total forest NPP was relatively stable. To be specific, the NPP of the coniferous forest accounted for the largest proportion of the total NPP, reaching 43.9%–49.9%. The NPP of the mixed coniferous and the broadleaf forest accounted for the second largest proportion of the total NPP, namely, 16.4%–20.6%, while the proportions of shrub forest and deciduous broadleaf forest were similar, namely, 15.4%–18.4% and 13%–15.4%, respectively. The contribution of the evergreen broadleaf forest was the lowest and accounted for only 3.2%–4.7% of the total NPP. The NPP variation trends of different forest types were relatively consistent and similar to that of the total forest NPP. The period from 1992 to 1996 showed rapid forest growth, with significantly increasing NPP values for all forest types. From 1996 to 2002, the NPP values for all forest types basically showed an increasing trend. In 2006, the NPP values for all forest types significantly decreased. In 2012, apart from the increase in the NPP of deciduous broadleaf forest by 57.48% compared to that in 2006, NPP values of all forest types increased by more than 100% to 7.067 Tg C.

3.2.2. Forest Carbon Sequestration

The variations in the carbon sequestration of the forest vegetation layer, the litter layer, and the soil layer as well as the variations in carbon storage and carbon density of the entire area from 1992 to 2012 are shown in Table 6.
From 1992 to 2012, the carbon stocks of the forest vegetation layer, the litter layer, and the soil layer as well as the entire area have similar variation trends. Specifically speaking, the stocks of each layer and the entire area continuously increased from 1992 to 2012, while the growing rate began to slow down and stabilize after the rapid increase. From 1992 to 1996, the carbon stocks of the forest vegetation layer, the litter layer, and the soil layer, and the whole area increased by 2.04%–2.16% from 54.53 Tg, 6.678 Tg, 139.637 Tg and 200.845 Tg in 1992, respectively, to 55.707 Tg, 6.814 Tg, 142.607 Tg, and 204.128 Tg in 1996. From 1996 to 2002, the growth rate was significantly higher, and the carbon stocks for each layer and the total area increased by 23.63%, 23.53%, 21.17%, and 21.92% to 68.872 Tg, 8.419 Tg, 172.795 Tg, and 250.084 Tg, respectively. From 2002 to 2006, the total forest carbon stock kept growing, although the growth rated decreased to 16.27%–17.46%; the carbon stocks of the three layers and the entire area were 80.899 Tg, 9.884 Tg, 200.916 Tg, and 291.699 Tg. The variation trends remained the same from 2006 to 2012, increased by 11.39%–13.13% to 90.117 T g, 11.016 Tg, 227.288 Tg, and 328.421 Tg, respectively, in 2012.

3.3. Spatial Evolution of Forest Productivity and Carbon Sequestration in the TGRA

As shown in Figure 4, regions with higher forest NPP values from 1992 to 2012 were mainly concentrated in the four counties in western Hubei in the eastern area of the TGRAT, and forest productivity gradually increased from west to east. The most significant change occurred in the counties Wuxi, Wushan, and Yunyang in the eastern hinterland. From 1992 to 1996 and further to 2002, forest NPP rose. Up to 2012, the forest productivities of Wulong County and Fengdu County, located in the Karst Mountains, also significantly improved from 80.046 Gg T and 52.313 Gg T in 1992 to 179.673 Gg T and 118.145 Gg T in 2012, respectively. The spatial variation of forest productivity was consistent with that of the forest and the fragmented forest patches. Therefore, increases in forest area and optimization of the forest landscape pattern can promote the improvement of forest productivity.
As shown in Figure 5, the forest carbon stock in this area also gradually increased from west to east, and the regions with significant carbon stock variation were Wuxi County, Wushan County, and Yunyang County in the eastern hinterland, Wulong County, Fengdu County, and Shizhu County in the western hinterland, and Jiangjin District and Banan District in the western area of the reservoir area. From 1992 to 1996, the forest carbon stock in the eastern hinterland of the reservoir area increased significantly with continuously high values. From 2002 to 2006, the forest carbon stocks of the Jiangjin District and the Banan District, in the hilly areas at the paralleled ridge valley of the western part, increased significantly; while from 1992 to 2012, the forest carbon stocks of Wulong County, Fengdu County, and Shizhu County, in the southwestern hinterland of the reservoir area, increased gradually; this area became the green barrier of the southern reservoir area.

4. Discussion

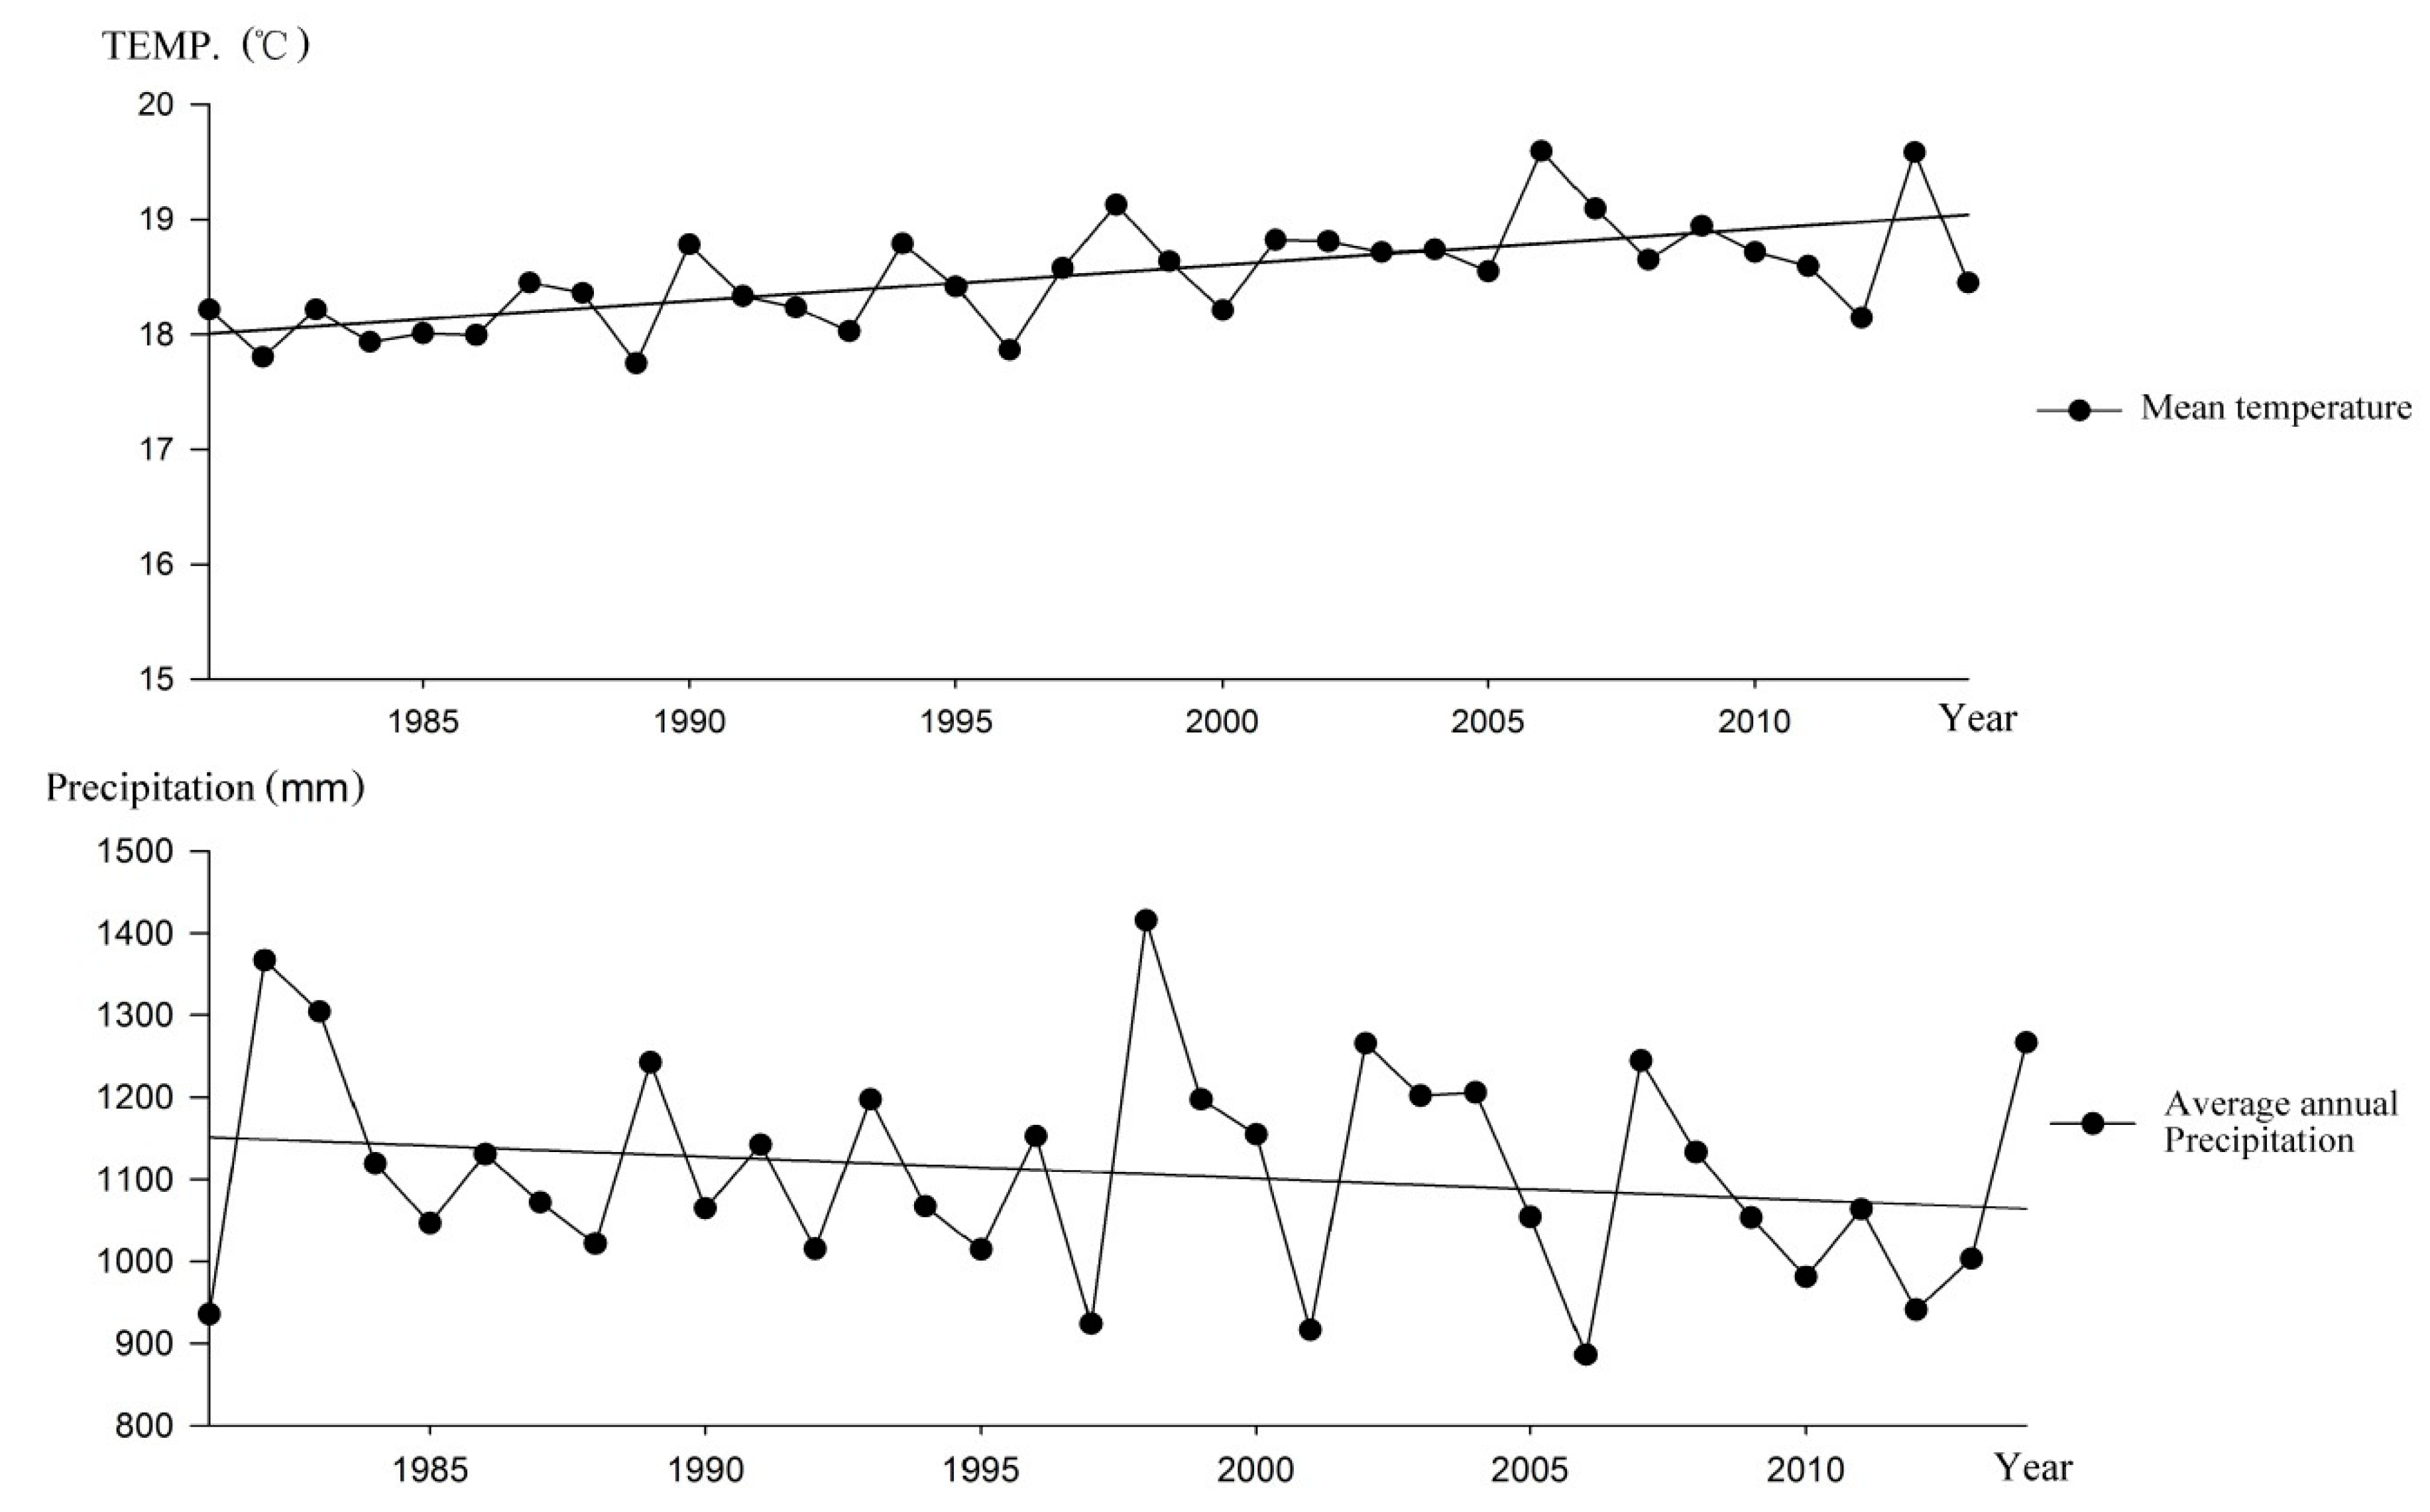
4.1. Influences of Air Temperature and Precipitation on Forest Productivity

Forest productivity is not only controlled by the physiological and ecological characteristics of the plants themselves, but is also affected by solar radiation, precipitation, soil, and human activities. From 1981 to 2014, the annual average temperature in the TGRA showed an upward trend in the fluctuating process. During this period, the annual average temperature was 18.49 °C, with slight annual variations; a minimum temperature of 17.75 °C in 1989 and a maximum temperature of 19.59 °C in 2006. In 2006, the average temperature in China was abnormally high. For most regions within this area, the number of days with a maximum temperature of 35 °C or more was 20 times higher than that in the same period of previous years. In addition, the annual precipitation during 1981 to 2014 in the TGRA showed a larger interannual fluctuation and a slightly downward trend. Average annual precipitation was 1110.34 mm, and the interannual fluctuation was relatively larger, with a maximum annual precipitation of 1415.71 mm (1998) and a minimum annual precipitation of 886.20 mm (2006). Maximum precipitation occurred in 1998, when the Yangtze River Basin suffered a catastrophic flood event; while in 2006, the high temperature and drought event in the Sichuan Province and the Chongqing City led to the decrease of annual precipitation by 259.6 mm compared with that in the same period of “normal” years, and annual precipitation in 2006 was the lowest since 1951 (Figure 6).
Generally, the air temperature in the TGRA varied slightly, while precipitation presented an increasing trend from 1992 to 2002. With this influence, the unitary forest NPP in the reservoir area firstly increased significantly and then slightly decreased. Pearson´s correlation analysis of the NPP values of various forest types and the annual average temperature showed a significantly negative correlation between these factors (Table 7). Besides, Pearson´s correlation analysis on the NPP values and the annual precipitation showed a significantly positive correlation (Table 8). As a result of the high temperature and low precipitation in 2006, forest productivity for unit area was extremely low. We therefore assume that unitary forest productivity is greatly affected by the environmental factors such as solar radiation and precipitation in addition to the physiological and ecological characteristics of the plants themselves, whereas total forest productivity is largely influenced by human activities.

4.2. Influences of Land Use Change on Forest Carbon Stocks

From 1992 to 2012, the areas of various landscape types changed differently [47]. During these 20 years, crop land and forest land were the dominating land use types in this reservoir area, accounting for 93%−96% of the reservoir area. The area of crop land greatly decreased, and its decrease rate was accelerated with the progress of the Three Gorges project. Crop land was mainly transferred to construction land, forest land, water bodies, and the areas of forest land, construction land, or water increased over the years. Among these, construction land showed the most significant increase, increasing five-fold from 1992 to 2012, while water areas in 2012 were two times larger than that in 1992. Forest land increased by nearly 60% or 131.73 × 10⁴ hm2 compared to 1992. With the drastic change in land use since the implementation of reservoir project, the continuous increase in total NPP could be attributed to the significant increase in forest area. In addition, the average area of forest patches increased year by year from 1992 to 2012, while patch density decreased. Hereinto, the landscape dominance index of the coniferous forest increased significantly, and the forest landscape pattern changed from small patches to large patches and from a spatially scattered distribution to a continuous distribution, finally enhancing the internal and external connective of the landscape.
Accordingly, from 1992 to 2012, the carbon stocks of the forest vegetation layer, the litter layer, the soil layer, and the entire reservoir area, showed a continuously increasing trend, but the growth rates started to decrease and finally stabilized. The possible reasons could be attributed to the new forest plantation, forest landscape restoration caused by a number of important forestry ecological projects, including the Yangtze River Basin Shelter Forest System project, the Natural Forest Protection Project, and the Grain for Green Project, which were implemented after the severe floods in 1998. From 1992 to 2002, the total forest area in the reservoir region increased from 204.17 × 10⁴ hm2 to 254.93 × 10⁴ hm2.

5. Conclusions

The Three Gorges Reservoir area is one of the most ecologically sensitive areas in China, and the forest landscape pattern in this region shows dramatic change due to the influence of the Three Gorges reservoir project. The forest NPP and carbon sequestration of various forest types in this area, which were estimated based on the Biome-BGC model, indicated that total and unitary forest NPP presented obvious annual fluctuation from 1992 to 2012 under the combined influences of land use change and extreme weather events. Apart from the year 2006, from 1992 to 2012, the NPP values of each forest type showed an increasing trend, although the growth rates decreased. In 2006, due to abnormally high air temperatures and less precipitation, total and unit area forest NPP values decreased by 46.3% and 53.9%, respectively, compared to 2002. From 1992 to 2012, the carbon stocks of the forest vegetation layer, the litter layer, the soil layer, and the entire area gradually increased with a decreasing growth rates. Forest carbon stocks were high in the east and the south and low in the west and the north. Regions with higher carbon stocks included the reservoir head, the Wushan-Wuxi section, the Shizhu-Wulong section, and the southern section of the Jiangjin District. From 1992 to 2012, the variation in the forest landscape pattern and the responses of forest productivity and carbon stocks indicated that the increase in forest area and the optimization of the forest landscape pattern could improve the forest productivity and carbon stocks.
In fact, the potential and historic land use changes influence not only the forest areas, but also the forest landscape patterns, such as patch size, fragmentation degree, and patches connectivity and so on. This paper only analyzed the changes in forest productivity and carbon storage caused by the changes of forest area, but did not deeply analyze the impacts of landscapes patterns. Therefore, it is an important issue for further study to clarify the contributions of landscape pattern to carbon storage based on the principle of edge effects.
Based on the Biome-BGC model, the simulated NPP values and carbon density values of the coniferous forest and the mixed coniferous and broadleaf forest were close to the measured values, while those of the deciduous broadleaf forest, the evergreen broadleaf forest, and the shrub forest were lower than the measured values. The possible reason could be the use of the default physiological and ecological parameters provided by the model, as well as the underestimate of the carbon density of forest soil. The effective approach to improve the precision of the Biome-BGC model is to provide more accurate spatial interpolation through the plot investigation data of meteorological stations and more physiological and ecological parameters of different vegetation types (e.g., bamboo forest, forest plantation, etc.). By combination of field plot measurement and model simulation, the conversion from point to region and a multi-scale simulation will be realized; also, the accuracy of scaling up or scaling down will be improved.

Author Contributions

Conceptualization, Y.C. and W.X.; Data curation, Y.C.; Methodology, Y.C.; Supervision, W.X.; Writing—original draft, Y.C.; Writing—review & editing, Y.C.

Funding

Ministry of Science and Technology of the People’s Republic of China: Ministry of Finance: GYHY201406035.

Conflicts of Interest

The authors declare no conflict of interest.

References

  1. Richards, K.R.; Stokes, C. A Review of Forest Carbon Sequestration Cost Studies: A Dozen Years of Research. Clim. Chang. 2004, 63, 1–48. [Google Scholar] [CrossRef]
  2. Landsberg, J.; Waring, R. A generalised model of forest productivity using simplified concepts of radiation-use efficiency, carbon balance and partitioning. For. Ecol. Manag. 1997, 95, 209–228. [Google Scholar] [CrossRef]
  3. Li, Y.B.; Shao, J.A.; Li, Y.C. The Status and Prospect of Land Use/Land Cover Changes in Three Gorges Reservoir Area. J. Chongqing Norm. Univ. (Nat. Sci.) 2010, 27, 31–35. [Google Scholar]
  4. Peng, L.; Sun, L. Spatial–temporal changes of rurality driven by urbanization and industrialization: A case study of the Three Gorges Reservoir Area in Chongqing, China. Habitat Int. 2016, 51, 124–132. [Google Scholar] [CrossRef]
  5. Bieger, K.; Hoermann, G.; Fohrer, N. The impact of land use change in the Xiangxi Catchment (China) on water balance and sediment transport. Reg. Environ. Chang. 2015, 15, 485–498. [Google Scholar] [CrossRef]
  6. Liu, R.M.; Yang, Z.F.; Shen, Z.Y.; Xing, W.U. Relationship and simulation information system of land ues/cover change and non-point source pollution in Yangtze river basin. Resour. Environ. Yangtze Basin 2006, 15, 372–377. [Google Scholar]
  7. Hou, L.S.; Cai, Y.L. An essential analysis and review on land use/cover change research. Prog. Geogr. 2004, 23, 96–104. [Google Scholar]
  8. Zhang, J.; Liu, Z.; Sun, X. Changing landscape in the Three Gorges Reservoir Area of Yangtze River from 1977 to 2005: Land use/land cover, vegetation cover changes estimated using multi-source satellite data. Int. J. Appli. Earth Obs. Geoinf. 2009, 11, 403–412. [Google Scholar] [CrossRef]
  9. Wang, P.C. Water Conservation of Forest Vegetation in Three Gorges Reservoir Area. Ph.D. Thesis, Chinese Academy of Forestry, Beijing, China, July 2007. [Google Scholar]
  10. Yao, J. The Study of RS & GIS-Based Forest Landscape Classification and Distribution Pattern in the Three Gorges Reservoir Area. Master’s Thesis, Huazhong Agricultural University, Wuhan, China, June 2008. [Google Scholar]
  11. Cao, Y.; Zhou, W.; Wang, J.; Yuan, C. Spatial-temporal pattern and differences of land use changes in the Three Gorges Reservoir Area of China during 1975–2005. J. Mt. Sci. 2011, 8, 551–563. [Google Scholar] [CrossRef]
  12. Fan, Y.J.; Jiang, X.B. Spatial-temporal variation of land use in three gorges’ project area based on space information technologies. Resour. Sci. 2002, 24, 75–80. [Google Scholar]
  13. Sun, X.X.; Zhang, J.X.; Liu, Z.J. Monitoring the land use dynamics and analyzing its change in time series using imagery in three gorges reservoir area. Resour. Environ. Yangtze Basin 2008, 17, 557–560. [Google Scholar]
  14. Thornton, P.E. Regional Ecosystem Simulation: Combining Surface- and Satellite-Based Observations to Study Linkages Between Terrestrial Energy and Mass Budgets. Ph.D. Thesis, University of Montana, Missoula, MT, USA, June 1998. [Google Scholar]
  15. Thornton, P.E.; Running, S.W. An improved algorithm for estimating incident daily solar radiation from measurements of temperature, humidity, and precipitation. Agric. For. Meteorol. 1999, 93, 211–228. [Google Scholar] [CrossRef]
  16. Thornton, P.E.; Hasenauer, H.; White, M.A. Simultaneous estimation of daily solar radiation and humidity from observed temperature and precipitation: An application over complex terrain in Austria. Agric. For. Meteorol. 2000, 104, 255–271. [Google Scholar] [CrossRef]
  17. Thornton, P.E.; Law, B.E.; Gholz, H.L.; Clark, K.L.; Falge, E.; Ellsworth, D.S.; Goldstein, A.H.; Monson, R.K.; Hollinger, D.; Falk, M.; et al. Modeling and measuring the effects of disturbance history an climate on carbon and water budgets in evergreen needleleaf forests. Agric. For. Meteorol. 2001, 113, 185–222. [Google Scholar] [CrossRef]
  18. Ueyama, M.; Harazono, Y.; Kim, Y.W.; Tanaka, N. Response of the carbon cycle in sub-arctic black spruce forests to climate change: reduction of a carbon sink related to the sensitivity of heterotrophic respiration. Agric. For. Meteorol. 2009, 149, 582–602. [Google Scholar] [CrossRef]
  19. Ueyama, M.; Ichii, K.; Hirata, R.; Takagi, K.; Asanuma, J.; Machimura, T.; Nakai, Y.; Ohta, T.; Saigusa, N.; Takahashi, Y.; et al. Simulating carbon and water cycles of larch forests in East Asia by the BIOME-BGC model with Asia Flux data. Biogeosc. Discussions 2010, 7, 959–977. [Google Scholar] [CrossRef]
  20. Su, H.X. Analyzing and Simulating the Growth of Picea schrenkiana Forests in Xinjiang Under Global Climate Change. Ph.D. Thesis, Institute of Botany, Chinese Academy of Sciences, Beijing, China, July 2005. [Google Scholar]
  21. Zeng, H.Q.; Liu, Q.J.; Feng, Z.W.; Wang, X.K.; Ma, Z.Q. GPP and NPP study of Pinus elliottii forest in red soilhilly region based on Biome-BGC model. Acta Ecol. Sin. 2008, 20, 5314–5321. [Google Scholar]
  22. Fan, M.R.; Yu, X.X.; Zhang, Z.M.; Yu, Y.; Zhao, Y. Net Primary Productivity of a Pinus tabulaeformis Forest in Beijing Mountainous Area in Response to Different Climate Change Scenarios. J. Northeast For. Univ. 2010, 38, 46–48. [Google Scholar]
  23. Fan, M.R.; Yu, X.X.; Zhang, Z.M.; Shi, Y. The study of the impact of elevated CO2 concentration and climate change on net primary productivity of Quercus variabilis forest in Beijing Mountain Area. Ecol. Environ. Sci. 2010, 26, 1278–1283. [Google Scholar]
  24. Su, W.; Yu, X.X.; Lv, X.Z.; Fan, M.R.; Zhang, Y. Study on the impact of climate change on net primary productivity of Larix principis-rupprechtii forest in Beijing mountain area. Guangdong Agric. Sci. 2012, 39, 69–72. [Google Scholar]
  25. Zhang, W.H.; Lv, X.Z.; Yu, X.X.; Fan, M.R. Impact of climate and CO2 change on net primary productivity of Pinus Tabulaeformis forest in Beijing mountain area. Guangdong Agric. Sci. 2012, 39, 4–7. [Google Scholar]
  26. Li, H. On the Spation-Temporal Simulation of Forest Ecosystem Net Primary Productivity and Net Ecosystem Productivity in Fujian Province. Ph.D. Thesis, Fujian Normal University, Fuzhou, China, July 2008. [Google Scholar]
  27. Han, Q.F.; Luo, G.P.; Li, C.F.; Feng, Y.X. Simulation of carbon trend in forest ecosystem in northern slope of the Tianshan Mountains based on Biome-BGC. Arid Zone Res. 2014, 31, 375–382. [Google Scholar]
  28. Law, B.E.; Turner, D.P.; Campbell, J.L.; Sun, O.J.; Van Tuyl, S.; Ritts, W.D.; Cohen, W.B. Disturbance and climate effects on carbon stocks and fluxes across Western Oregon USA. Glob. Chang. Biol. 2004, 10, 1429–1444. [Google Scholar] [CrossRef]
  29. Schmid, S.; Zierl, B.; Bugmann, H. Analyzing the carbon dynamics of central European forests: comparison of Biome-BGC simulations with measurements. Reg. Environ. Chang. 2006, 6, 167–180. [Google Scholar] [CrossRef]
  30. Su, H.X.; Sang, W.G.; Wang, Y.X.; Ma, K.P. Simulating Picea schrenkiana forest productivity under climatic changes and atmospheric CO2 increase in Tianshan Mountains, Xinjiang Autonomous Region, China. For. Ecol. Manag. 2007, 246, 273–284. [Google Scholar] [CrossRef]
  31. Luo, Z.; Sun, O.J.; Wang, E.; Ren, H.; Xu, H.L. Modeling Productivity in Mangrove Forests as Impacted by Effective Soil Water Availability and Its Sensitivity to Climate Change Using Biome-BGC. Ecosystems 2010, 13, 949–965. [Google Scholar] [CrossRef]
  32. Ueyama, M.; Kai, A.; Ichii, K.; Hamotani, K.; Kosugi, Y.; Monji, N. The sensitivity of carbon sequestration to harvesting and climate conditions in a temperate cypress forest: Observations and modeling. Ecol. Model. 2011, 222, 3216–3225. [Google Scholar] [CrossRef]
  33. Bond-Lamberty, B.; Gower, S.T.; Goulden, M.L.; McMillan, A. Simulation of boreal black spruce chronosequences: Comparison to field measurements and model evaluation. J. Geophys. Res. Biogeosc. 2015, 111, 1537–1540. [Google Scholar] [CrossRef]
  34. Holland, E.A.; Dentener, F.J.; Braswell, B.H.; Sulzman, J.M. Contemporary and pre-industrial global reactive nitrogen budgets. Biogeochemistry 1999, 46, 7–43. [Google Scholar] [CrossRef]
  35. White, M.A.; Thornton, P.E.; Running, S.W.; Nemani, R.R. Parameterization and sensitivity analysis of the BIOME-BGC terrestrial ecosystem model: net primary production controls. Earth Interact. 2000, 4, 1–85. [Google Scholar] [CrossRef]
  36. Kang, S.; Kimball, J.S.; Running, S.W. Simulating effects of fire disturbance and climate change on boreal forest productivity and evapotranspiration. Sci. Total Env. 2006, 362, 85–102. [Google Scholar] [CrossRef] [PubMed]
  37. Wu, Y.L.; Wang, X.P.; Li, Q.Y.; Yan, S. Response of broad- leaved Korean Pine forest productivity of Mt. Changbai to climate change: an analysis based on Biome-BGC modeling. Acta Sci. Nat. Univ. Pekin. 2014, 50, 577–586. [Google Scholar]
  38. He, L.H.; Yu, H.Y.; Lei, X.D. Parameter sensitivity of simulating net primary productivity of Larix olgensis forest based on Biome-BGC model. Chin. J. Appl. Ecol. 2016, 27, 412–420. [Google Scholar]
  39. Peng, J.J.; He, X.Y.; Chen, Z.J.; Cui, M.X.; Zhang, X.L.; Zhou, C.H. Responses of Pinus tabulaeformis forest ecosystem in North China to climate change and elevated CO2: A simulation based on BIOME-BGC model and tree-ring data. Chin. J. Appl. Ecol. 2012, 23, 1733–1742. [Google Scholar]
  40. Su, H.X.; Li, G.Q. Simulating the response of the Quercus mongolica forest ecosystem carbon budget to asymmetric warming. Chin. Sci. Bull. 2012, 57, 1544–1552. [Google Scholar] [CrossRef]
  41. Zeng, L.X.; Wang, P.C.; Xiao, W.F.; Wan, R.; Huang, Z. Allocation of biomass and productivity of main vegetations in Three Gorges Reservoir Region. Sci. Silvae Sin. 2008, 44, 16–22. [Google Scholar]
  42. Wang, P.C.; Xing, L.J.; Xiao, W.F.; Huang, Z.L.; Pan, L. Organic carbon density and storage of forest ecosystems in three gorges reservoir area. Acta Ecol. Sin. 2009, 29, 97–107. [Google Scholar]
  43. Xing, L.J. Study on Organic Carbon Storage of Forest Ecosystem in Three Gorges Reservoir Area. Master’s Thesis, Huazhong Agricultural University, Wuhan, China, June 2008. [Google Scholar]
  44. Fu, T. Carbon Estimation of Main Forest Ecosystem in Three Gorges Reservoir Area Using CBM-CFS3. Ph.D. Thesis, Chinese Academy of Forestry, Beijing, China, July 2013. [Google Scholar]
  45. Wang, X.J.; Zhang, Y.X.; Huang, G.S.; Ma, W.; Chen, X.Y.; Dang, Y.F. Estimation of forest productivity and carbon storage in three gorges reservoir. Ecol. Sci. 2014, 33, 1114–1121. [Google Scholar]
  46. Wang, P.C.; Yao, J.; Xiao, W.F.; Zhang, S.G.; Huang, Z.L.; Zeng, L.X.; Pan, L. Topography differentiation characteristics of forest vegetation distribution in the Three Gorges Reservoir area. Res. Environ. Yangtze Basin 2009, 18, 528–534. [Google Scholar]
  47. Chen, Y.R.; Xiao, W.F.; Feng, Y.; Teng, M.J. Evolution of forest landscape pattern in the three gorges researvoir area during 1992–2012. For. Res. 2017, 30, 542–550. [Google Scholar]
Figure 1. Location and administrative districts of the TGRA.
Forests 10 00149 g001
Figure 2. The distribution map of forest types in the TGRA in 2012.
Forests 10 00149 g002
Figure 3. Time series of NPP for various forests in TGRA from 1981 to 2014.
Forests 10 00149 g003
Figure 4. Spatial changes in forest NPP in the TGRA from 1992 to 2012.
Forests 10 00149 g004
Figure 5. Spatial changes in forest carbon storage in the TGRA from 1992 to 2012.
Forests 10 00149 g005
Figure 6. Interannual variation of annual precipitation in Three Gorges Reservoir Area in 1981–2014.
Forests 10 00149 g006
Table 1. The environmental information of the counties in the TGRA.
NoCountyLatitudeLongitudeAltitude (m)Soil TypeAnnual Precipitation (cm)
1Fengjie31°01′ N109°32′ E607.3Yellow rendzina112.79
2Badong31°02′ N110°22′ E334.0Dark yellow-brown soil109.04
3Zigui30°50′ N110°58′ E295.5Yellow soil115.86
4Xingshan31°21′ N110°44′ E336.8Yellow soil101.59
5Wanzhou30°46′ N108°24′ E186.7Neutral purple soil124.52
6Yiling30°42′ N111°18′ E133.1Yellow soil122.41
7Chongqing29°35′ N106°28′ E259.1Neutral purple soil113.58
8Jiangjin29°17′ N106°15′ E261.4Yellow soil102.41
9Changshou29°50′ N107°04′ E377.6Neutral purple soil115.59
10Fengdu29°51′ N107°44′ E290.5Neutral purple soil104.20
11Kaixian31°11′ N108°25′ E216.5Calcareous purple soil126.01
12Yunyang30°57′ N108°41′ E297.2Acid purple soil110.78
13Wuxi31°24′ N109°37′ E337.8Yellow soil109.05
14Wushan31°04′ N109°52′ E275.7Yellow rendzina102.96
15Zhongxian30°18′ N108°02′ E325.6Calcareous purple soil119.50
16Shizhu29°59′ N108°07′ E632.3Yellow soil106.63
17Yubei29°44′ N106°37′ E464.7Neutral purple soil115.56
18Banan29°23′ N106°32′ E243.6Yellow soil107.02
19Fuling29°45′ N107°25′ E273.5Neutral purple soil110.69
20Wulong29°19′ N107°45′ E277.9Yellow soil102.49
Table 2. Value of ecophysiological parameters of forests used in Biome-BGC.
NoParametersUnitENFDBFEBFSHRUB
P1Annual leaf and fine root turnover fractionyear−10.251.00.50.25
P2Annual live wood turnover fractionyear−10.70.70.70.7
P3Annual whole-plant mortality fractionyear−10.0050.0050.0050.02
P4Annual fire mortality fractionyear−10.0050.00250.0020.01
P5New fine root C:new leaf Cratio0.80.5631.00.815
P6New stem C:new leaf Cratio2.20.671.00.5
P7New live wood C:new total wood Cratio0.0710.160.221
P8New croot C:new stem Cratio0.290.770.30.655
P9Current growth proportionprop.0.50.50.50.5
P10C:N of leavesKgC/KgN35.035.942.033.425
P11C:N of leaf litter, after retranslocationKgC/KgN93.065.7249.075
P12C:N of fine rootsKgC/KgN58.043.2342.052.515
P13C:N of live woodKgC/KgN58.047.2350.058
P14C:N of dead woodKgC/KgN729.0109.9300.0730
P15Leaf litter labile proportionDIM0.310.390.320.48
P16Leaf litter cellulose proportionDIM0.450.440.440.37
P17Leaf litter lignin proportionDIM0.240.170.240.15
P18Fine root labile proportionDIM0.340.290.300.41
P19Fine root cellulose proportionDIM0.440.180.450.37
P20Fine root lignin proportionDIM0.220.530.250.22
P21Dead wood cellulose proportionDIM0.710.660.760.71
P22Dead wood lignin proportionDIM0.290.340.240.29
P23Canopy water interception coefficient1/LAI/day0.0450.0210.0410.045
P24Canopy light extinction coefficientDIM0.50.70.70.55
P25All-sided to projected leaf area ratioDIM2.62.02.02.3
P26Specific leaf aream2/KgC8.120.012.017.5
P27Ratio of shaded SLA:sunlit SLADIM2.02.02.02
P28Fraction of leaf N in RubiscoDIM0.080.0850.060.04
P29Maximum stomatal conductancem/s0.0060.0050.0050.006
P30Cuticular conductancem/s0.000060.000010.000010.00006
P31Boundary layer conductancem/s0.090.010.010.02
P32Leaf water potential: start of conductance reductionMPa−0.65−0.6−0.6−0.81
P33Leaf water potential: complete conductance reductionMPa−2.5−2.3−3.9−4.2
P34Vapor pressure deficit: start of conductance reductionPa610930.01800.0970
P35Vapor pressure deficit: complete conductance reductionPa310041004100.04100
Table 3. Comparison between measured and simulated NPP values in the TGRA.
Vegetation TypeObserved NPP Value (Mg C hm−2 year−1)Simulated NPP Value (Mg C hm−2 year−1)NPP Values from the Literature (Mg C hm−2 year−1)
ENF3.605.53Average NPP of various forest types
2.20–5.08 [44]
2.85–6.19 [45]
Mixed3.224.94
DBF3.284.35
EBF4.554.41
Shrub2.812.86
Table 4. Comparison of estimation results of carbon density for the main forest types in the TGRA.
Forest TypeVegetation Carbon Density (Mg hm−2)Litter Carbon Density (Mg hm−2)Soil Carbon Density (Mg hm−2)Total Carbon Density (Mg hm−2)
Biome-BGCCBM-CFS3Observed ValuesBiome-BGCCBM-CFS3Observed ValuesBiome-BGCCBM-CFS3Observed ValuesBiome-BGCCBM-CFS3Observed Values
ENF35.0431.9424.044.2712.752.8765.4547.8198.40104.7692.50125.31
Mixed31.3536.0128.853.8625.722.2865.6576.4971.10100.87138.21102.23
DBF27.6733.0326.203.4618.522.9965.8561.2796.7096.98112.82125.89
EBF26.8041.8439.712.8717.402.9463.9758.8267.6093.65118.06110.25
Shrub11.51 8.671.44 1.3067.30 82.9080.25 92.87
Table 5. NPP of Forest Ecosystem in Three Gorges Reservoir Area in 1992~2012.
YearNPP (Tg C)Average NPP
(Mg C hm−2 year−1)
ENFMIXDBFEBFShrubTotal
19923.4331.6111.2080.3691.2067.8273.833
19965.0581.9711.4760.4812.35211.3385.437
20026.6562.1921.550.4742.47413.3465.235
20063.2071.3381.1290.2281.2697.1712.415
20127.0672.9241.7780.4742.75614.9994.465
Table 6. Carbon storage of the Forest Ecosystem in TGR area from 1992 to 2012.
YearCarbon Storage (Tg)
VegetationLitterSoilTotal
199254.536.678139.637200.845
199655.7076.814142.607205.128
200268.8728.417172.795250.084
200680.8999.884200.916291.699
201290.11711.016227.288328.421
Table 7. Pearson correlation analysis between NPP of forest types and annual mean temperature in TGR.
Annual TemperatureNPP
DBFEBFENFShrubMIX
Annual temperature1−0.235 **−0.242 **−0.321 **−0.248 **−0.319 **
DBF NPP 10.814 **0.657 **0.673 **0.820 **
EBF NPP 10.883 **0.857 **0.932 **
ENF NPP 10.938 **0.970 **
Sbrub NPP 10.929 **
MIX NPP 1
Note: ** significantly correlated at the 0.01 level (bilateral).
Table 8. Pearson correlation analysis between NPP of five forest types and annual precipitation in TGR.
Annual PrecipitationNPP
DBFEBFENFShrubMIX
Annual Precipitation10.609 **0.704 **0.723 **0.743 **0.744 **
DBF NPP 10.814 **0.657 **0.673 **0.820 **
EBF NPP 10.883 **0.857 **0.932 **
ENF NPP 10.938 **0.970 **
Shrub NPP 10.929 **
MIX NPP 1
Note: ** significantly correlated at the 0.01 level (bilateral).

