Hyperspectral Estimation Model of Forest Soil Organic Matter in Northwest Yunnan Province, China

 , , ,
, , ,
Abstract
:1. Introduction
2. Materials and Methods
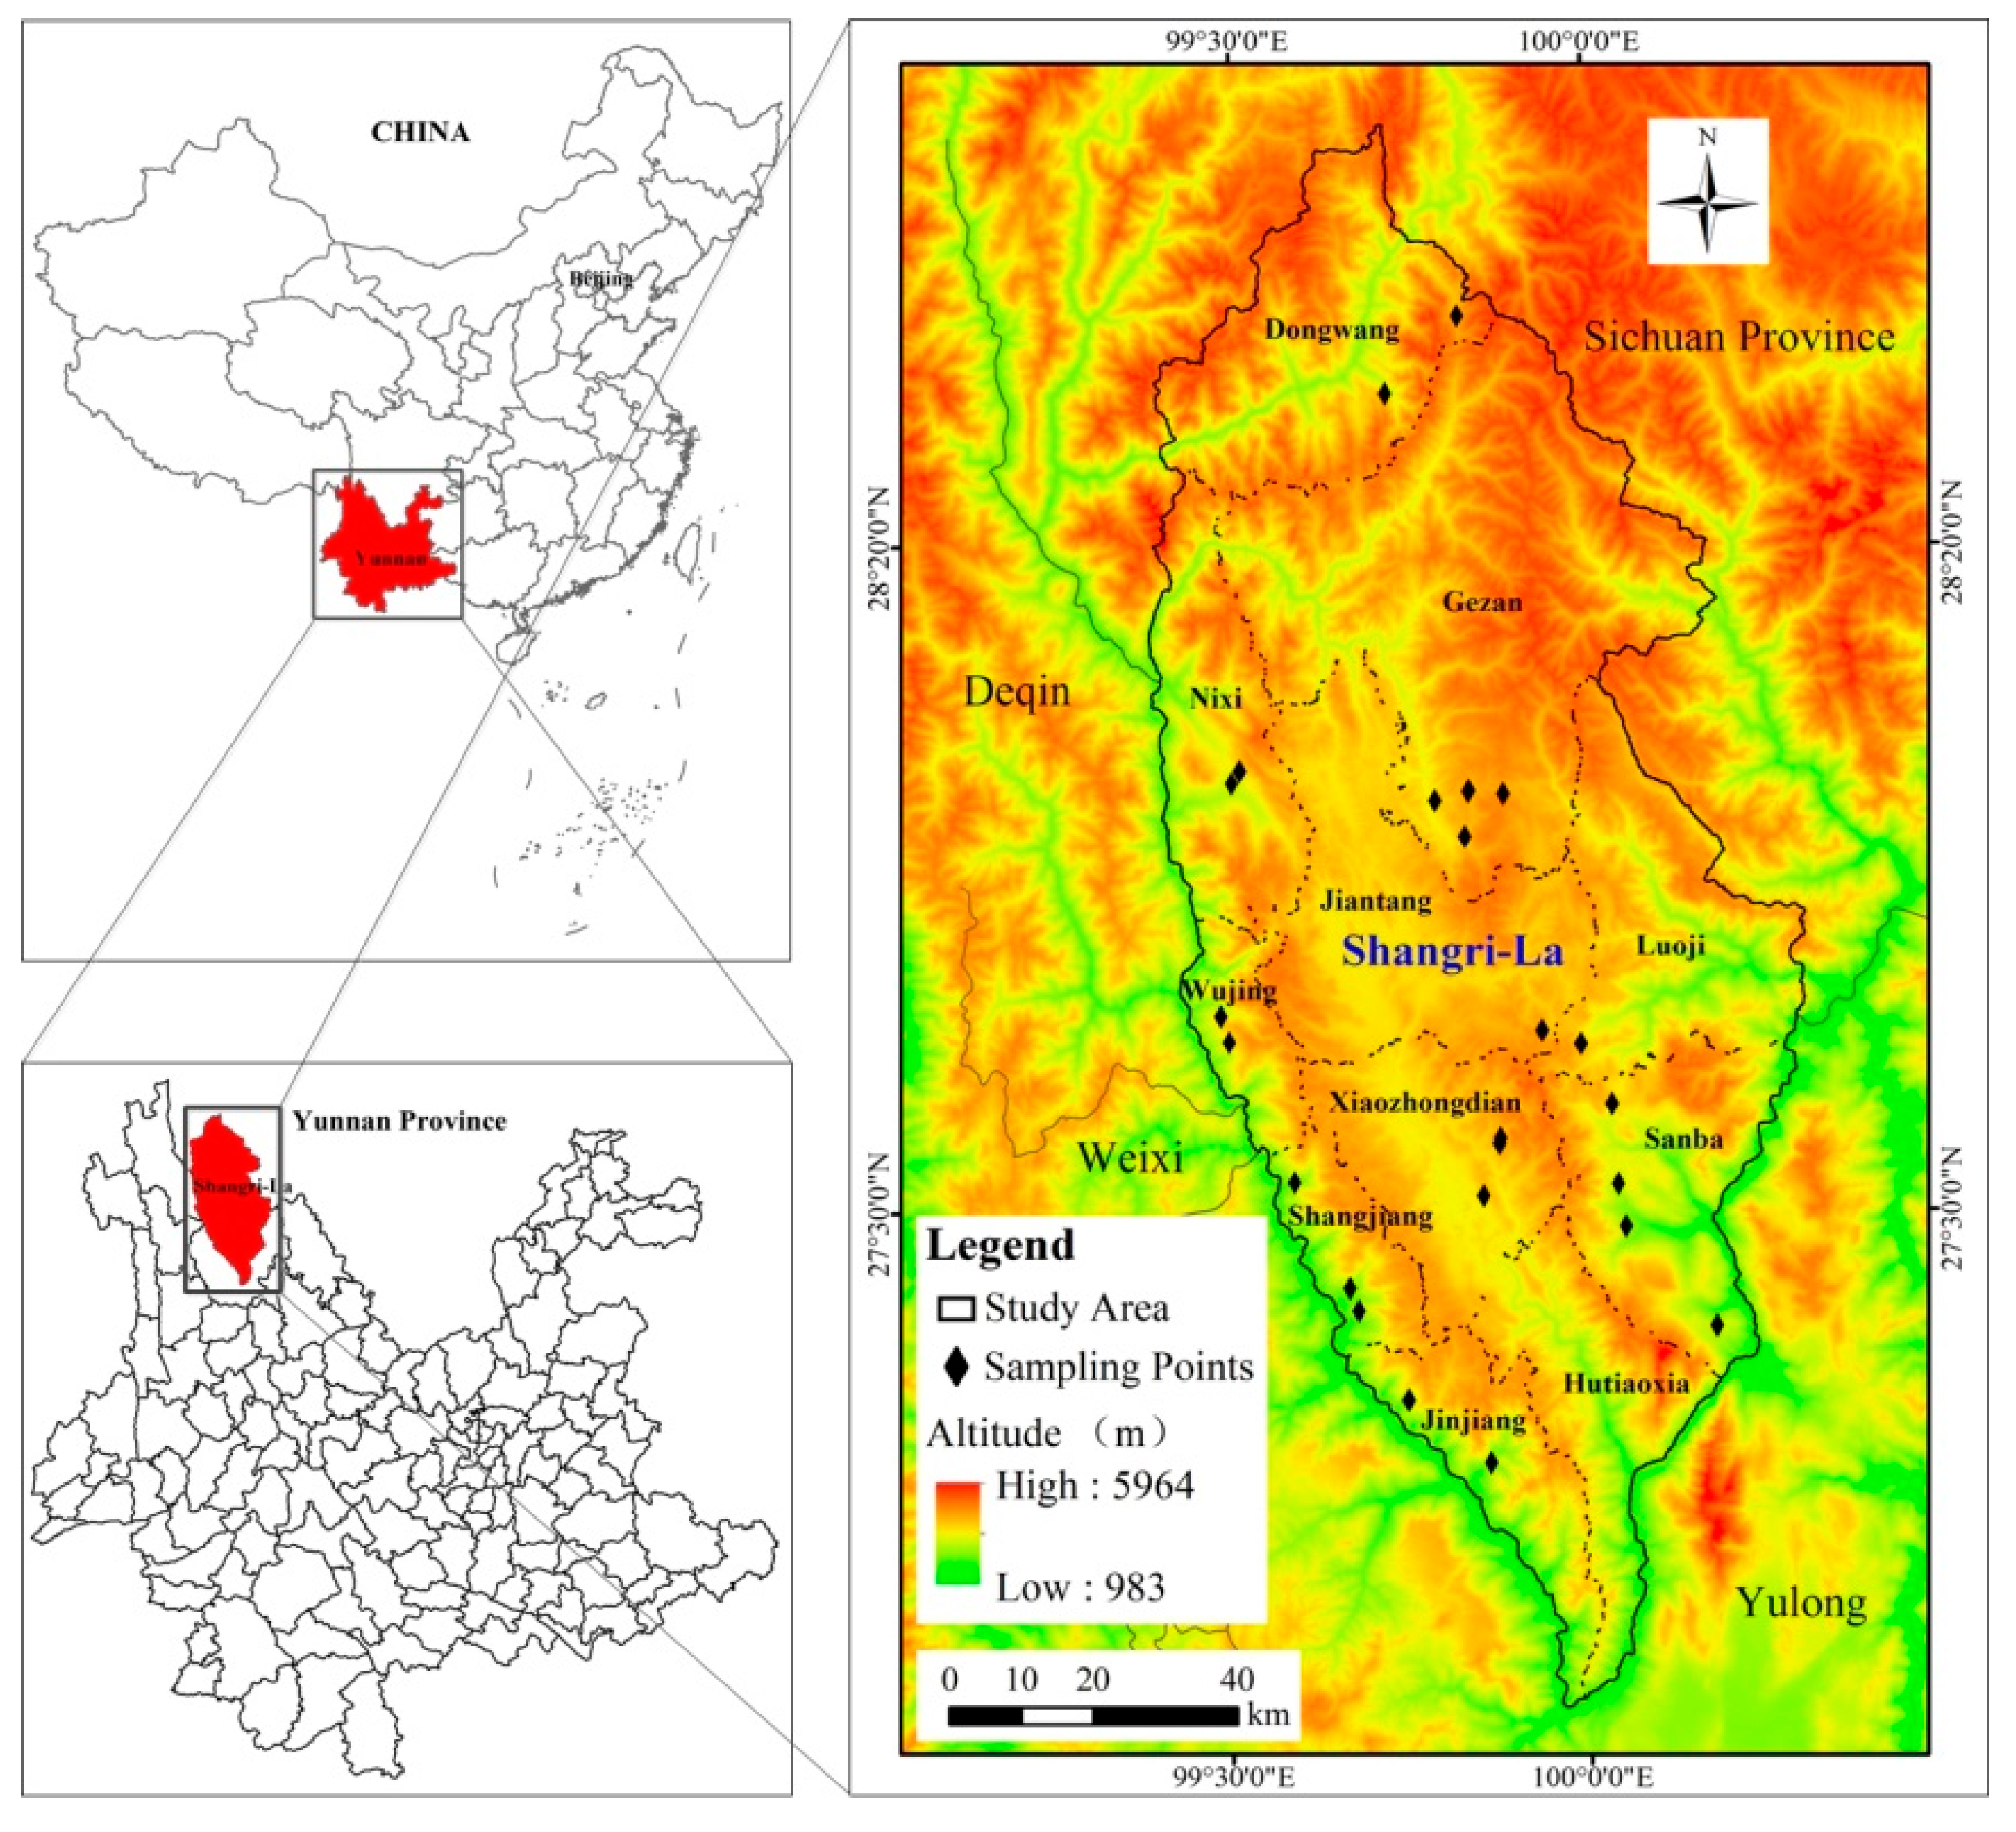
2.1. Study Area
2.2. Soil Sample Collection and Experiment
2.3. Data Pre-processing
2.4. Modeling and Validation
3. Results
3.1. Spectral Characteristics of Soils with Different Particle Sizes
3.2. Feature Band Extraction and Analysis
3.3. Simple Linear Regression (SLR)
3.4. Stepwise Multiple Linear Regression (SMLR)
3.5. Partial Least Squares Regression (PLSR)
4. Discussion
5. Conclusions
Author Contributions
Funding
Acknowledgments
Conflicts of Interest
References
- Six, J.; Paustian, K. Aggregate-associated soil organic matter as an ecosystem property and a measurement tool. Soil Biol. Biochem. 2014, 68, A4–A9. [Google Scholar] [CrossRef]
- Lal, R. Soil carbon sequestration impacts on global climate change and food security. Science 2004, 304, 1623–1627. [Google Scholar] [CrossRef] [PubMed]
- Hong, Y.; Chen, S.; Zhang, Y.; Chen, Y.; Yu, L.; Liu, Y.; Liu, Y.; Cheng, H.; Liu, Y. Rapid identification of soil organic matter level via visible and near-infrared spectroscopy: Effects of two-imensional correlation coefficient and extreme learning machine. Sci. Total Environ. 2018, 644, 1232–1243. [Google Scholar] [CrossRef] [PubMed]
- Nocita, M.; Stevens, A.; Toth, G.; Panagos, P.; Wesemael, B.; Montanarella, L. Prediction of soil organic carbon content by diffuse reflectance spectroscopy using a local partial least square regression approach. Soil Biol. Biochem. 2014, 68, 337–347. [Google Scholar] [CrossRef]
- Gomez, C.; Rossel, R.A.V.; Mcbratney, A.B. Soil organic carbon prediction by hyperspectral remote sensing and field vis-NIR spectroscopy: An Australian case study. Geoderma 2008, 146, 403–411. [Google Scholar] [CrossRef]
- Bao, N.; Wu, L.; Ye, B.; Ke, Y.; Wei, Z. Assessing soil organic matter of reclaimed soil from a large surface coal mine using a field spectroradiometer in laboratory. Geoderma 2017, 288, 47–55. [Google Scholar] [CrossRef]
- Rossel, R.A.V.; Webster, R. Predicting soil properties from the Australian soil visible--near infrared spectroscopic database. Eur. J. Soil Sci. 2012, 63, 848–860. [Google Scholar] [CrossRef]
- Bowers, S.A.; Hanks, R.J. Reflection of Radiant Energy from Soils. Soil Sci. 1971, 100, 130–138. [Google Scholar] [CrossRef]
- Al-Abbas, A.H.; Swain, P.H.; Baumgardner, M.F. Relating Organic Matter and Clay Content to the Multispectral Radiance of Soils. Soil Sci. 1972, 114, 65–82. [Google Scholar] [CrossRef]
- Wu, H.; Fan, Y.M.; He, J.; Jin, G.; Xie, Y.; Chai, D.; He, L. Response of Soil Hyperspectral Characteristics of Different Particle Sizes to Soil Organic Matter. Acta Agrestia Sin. 2014, 22, 266–270. [Google Scholar]
- Krishnsn, P.; Alexander, J.D.; Butler, B.J.; Hummel, J.W. Reflectance technique for predicting soil organic matter. Soil Sci. Soc. Am. J. 1980, 44, 1282–1285. [Google Scholar] [CrossRef]
- Gunsaulis, F.R.; Kocher, M.F.; Griffis, C.L. Surface structure effects on close-range reflectance as a function of soil organic matter content. Trans. ASAE 1991, 34, 641–649. [Google Scholar] [CrossRef]
- Peng, J.; Zhou, Q.; Zhang, Y.; Xiang, H. Effect of soil organic matter on spectral characteristics of soil. Acta Pedol. Sin. 2013, 50, 517–524. [Google Scholar]
- Galvão, L.S.; Vitorello, I. Role of organic matter in obliterating the effects of iron on spectral reflectance and colour of Brazilian tropical soils. Int. J. Remote Sens. 1998, 19, 1969–1979. [Google Scholar] [CrossRef] [Green Version]
- Galvão, L.S.; Pizarro, M.A.; Epiphanio, J.C.N. Variations in Reflectance of Tropical Soils–Spectral-Chemical Composition Relationships from AVIRIS data. Remote Sens. Environ. 2001, 75, 245–255. [Google Scholar] [CrossRef]
- Xu, B. Study on Reflective Spectrum of Soil Profile. Soil 2000, 32, 2–8. [Google Scholar]
- Fang, S.; Yang, M.; Zhao, X.; Guo, X. Spectral characteristics and quantitative estimation of SOM in red soil typical of Ji’an County, Jiangxi Province. Acta Pedol. Sin. 2014, 51, 1003–1010. [Google Scholar]
- Hummel, J.W.; Sudduth, K.A.; Hollinger, S.E. Soil moisture and organic matter prediction of surface and subsurface soils using an NIR soil sensor. Comput. Electron. Agric. 2001, 32, 149–165. [Google Scholar] [CrossRef]
- Vašát, R.; Kodešová, R.; Klement, A.; Borůvka, L. Simple but efficient signal pre-processing in soil organic carbon spectroscopic estimation. Geofis. Int. 2017, 298, 46–53. [Google Scholar] [CrossRef]
- Zhou, P.; Wang, R.; Yan, B.; Yang, S.; Wang, Q. Extraction of Soil Organic Matter Information by Hyperspectral Remote Sensing. Prog. Geogr. 2008, 27, 27–34. [Google Scholar]
- Hu, W.; Ren, H.; Zhuang, D.; Shi, X.; Liu, S.; Huang, Y.; Yu, X. Effects on Application of Spectroscopy in Estimating of Soil Organic Matter Content. Geo-Inf. Sci. 2012, 14, 258–264. [Google Scholar] [CrossRef]
- Yu, L.; Hong, Y.; Lei, G.; Zhou, Y.; Zhu, Q.; Cao, J.; Yan, N. Hyperspectral estimation of soil organic matter content based on partial least squares regression. Trans. Chin. Soc. Agric. Eng. 2015, 31, 103–109. [Google Scholar]
- Hou, Y.; Tiyip, T.; Sawut, M.; Zhang, F. Estimation model of desert soil organic matter content using hyperspectral data. Trans. Chin. Soc. Agric. Eng. 2014, 30, 113–120. [Google Scholar]
- Meyer, J.H. Rapid simultaneous rating of soil texture, organic matter, total nitrogen and nitrogen mineralization potential by near infra-red reflectance. S. Afr. J. Plant Soil 1989, 6, 59–63. [Google Scholar] [CrossRef] [Green Version]
- Chen, F.; Kissel, D.E.; West, L.T.; Adkins, W. Field-scale mapping of surface soil organic carbon using remotely sensed imagery. Soil Sci. Soc. Am. J. 2000, 64, 746–753. [Google Scholar] [CrossRef]
- Liu, J.; Han, J.; Zhang, Y.; Wang, H.; Kong, H.; Shi, L. Prediction of soil organic carbon with different parent materials development using visible-near infrared spectroscopy. Spectrochim. Acta Part A 2018, 204, 33–39. [Google Scholar] [CrossRef] [PubMed]
- Fidêncio, P.H.; Poppi, R.J.; Andrade, J.C.d.; Cantarella, H. Determination of organic matter in soil using near-infrared spectroscopy and partial least squares regression. Commun. Soil Sci. Plant Anal. 2002, 33, 1607–1615. [Google Scholar] [CrossRef]
- Fidêncio, P.H.; Poppi, R.J.; Andrade, J.C.D. Determination of organic matter in soils using radial basis function networks and near infrared spectroscopy. Anal. Chim. Acta 2002, 453, 125–134. [Google Scholar] [CrossRef]
- Dunn, B.W.; Batten, G.D.; Beecher, H.G.; Ciavarella, S. The potential of near-infrared reflectance spectroscopy for soil analysis—A case study from the Riverine Plain of south-eastern Australia. Aust. J. Exp. Agric. 2002, 42, 607–614. [Google Scholar] [CrossRef]
- Kooistra, L.; Wanders, J.; Epema, G.F.; Leuven, R.S.E.W.; Wehrens, R.; Buydens, L.M.C. The potential of field spectroscopy for the assessment of sediment properties in river floodplains. Anal. Chim. Acta 2003, 484, 189–200. [Google Scholar] [CrossRef]
- Palacios-Orueta, A.; Ustin, S.L. Remote Sensing of Soil Properties in the Santa Monica Mountains I. Spectral Analysis. Remote Sens. Environ. 1998, 65, 170–183. [Google Scholar] [CrossRef]
- Chang, C.W.; Laird, D.A.; Mausbach, M.J.; Hurburgh, C.R. Near-Infrared Reflectance Spectroscopy–Principal Components Regression Analyses of Soil Properties. Soil Sci. Soc. Am. J. 2001, 65, 480–490. [Google Scholar] [CrossRef]
- Islam, K.; Singh, B.; Mcbratney, A. Simultaneous Estimation of Several Soil Properties by Ultra-Violet, Visible, and Near-Infrared Reflectance Spectroscopy. Soil Res. 2003, 41, 1101–1114. [Google Scholar] [CrossRef]
- Brown, D.J.; Shepherd, K.D.; Walsh, M.G.; Mays, M.D.; Reinsch, T.G. Global soil characterization with VNIR diffuse reflectance spectroscopy. Geoderma 2006, 132, 273–290. [Google Scholar] [CrossRef]
- Yang, Y.; Gao, X.; Jia, W.; Zhang, W.; Li, J.; Zhang, Y.; Tian, C. Hyperspectral Retrieval of Soil Organic Matter for Different Soil Types in the Three-River Headwaters Region. Remot. Sens. Technol. Appl. 2015, 31, 186–198. [Google Scholar]
- Vasques, G.M.; Grunwald, S.; Sickman, J.O. Comparison of multivariate methods for inferential modeling of soil carbon using visible/near-infrared spectra. Geoderma 2008, 146, 14–25. [Google Scholar] [CrossRef]
- Sadeghi, M.; Babaeian, E.; Tuller, M.; Jones, S.B. Particle size effects on soil reflectance explained by an analytical radiative transfer model. Remote Sens. Environ. 2018, 210, 375–386. [Google Scholar] [CrossRef]
- An, X.; Li, M.; Zheng, L.; Hong, S. Eliminating the interference of soil moisture and particle size on predicting soil total nitrogen content using a NIRS-based portable detector. Comput. Electron. Agric. 2015, 112, 47–53. [Google Scholar] [CrossRef]
- Ma, C.; Shen, G.; Wang, Z.; Wang, Z. Analysis of Spectral Characteristics for Different Soil Particle Sizes. Chin. J. Soil Sci. 2015, 46, 292–298. [Google Scholar]
- Bao, Y.; He, Y.; Fang, H.; Annia, G.P. Spectral Characterization and N Content Prediction of Soil with Different Particle Size and Moisture Content. Spectrosc. Spectral Anal. 2007, 27, 62. [Google Scholar]
- Si, H.; Yao, Y.; Wang, D.; Liu, Y. Influence of Soil Particle Size on the Estimate of Soil Organic Matter by Hyperspectral Spectroscopy. Chin. Agric. Bull. 2015, 31, 173–178. [Google Scholar]
- Li, G.; Gao, X.; Yang, L.; Shi, F.; He, L.; Liu, X.; Gu, X.; Xiao, Y.; Ma, H. Estimating Soil Organic Matter contents from Different Soil Particle Size using Visible and Near-infrared Reflectance Spectrum—A Case Study of the Huangshui Basin. Chin. J. Soil Sci. 2017, 48, 1360–1370. [Google Scholar]
- SFSY; OSSY. Yunan Soil; Yunnan Science and Technology Press: Kunming, China, 1996; pp. 7–118. [Google Scholar]
- Wang, J.; Wang, X.; Yue, C.; Cheng, F.; Xue, T.; Cheng, P.; Wang, X.; Gao, Y. Carbon content rate in dominant species of four forest types in Shangri-la, northwest Yunnan province. Ecol. Environ. 2012, 21, 613–619. [Google Scholar]
- Liu, G.; Wang, J.; Dong, P.; Chen, Y.; Liu, Z. Estimating Individual Tree Height and Diameter at Breast Height (DBH) from Terrestrial Laser Scanning (TLS) Data at Plot Level. Forests 2018, 9, 398. [Google Scholar] [CrossRef]
- MOA. Agricultural Industry Standards of the People’s Republic of China. In Determination of Soil Organic Matter; The ministry of agriculture of the People’s Republic of China: Beijing, China, 2006; Volume NY/T 1121.6-2006. [Google Scholar]
- Shi, T.; Chen, Y.; Liu, Y.; Wu, G. Visible and near-infrared reflectance spectroscopy—An alternative for monitoring soil contamination by heavy metals. J. Hazard. Mater. 2014, 265, 166–176. [Google Scholar] [CrossRef] [PubMed]
- Wu, Y.Z.; Chen, J.; Ji, J.F.; Tian, Q.J.; Wu, X.M. Feasibility of reflectance spectroscopy for the assessment of soil mercury contamination. Environ. Sci. Technol. 2005, 39, 873–878. [Google Scholar] [CrossRef] [PubMed]
- Wold, S.; Sjöström, M.; Eriksson, L. PLS-regression: A basic tool of chemometrics. Chemom. Intell. Lab. Syst. 2001, 58, 109–130. [Google Scholar] [CrossRef]
- Geladi, P.; Kowalski, B.R. Partial least-squares regression: A tutorial. Anal. Chim. Acta 1985, 185, 1–17. [Google Scholar] [CrossRef]
- Shao, X.; Bian, X.; Liu, J.; Min, Z.; Cai, W. Multivariate calibration methods in near infrared spectroscopic analysis. Anal. Methods 2010, 2, 1662–1666. [Google Scholar] [CrossRef]
- Rossel, R.A.V.; Mcglynn, R.N.; Mcbratney, A.B. Determining the composition of mineral-organic mixes using UV–vis–NIR diffuse reflectance spectroscopy. Geoderma 2006, 137, 70–82. [Google Scholar] [CrossRef]
- Han, Z.; Zhu, X.; Liu, Q.; Fang, X.; Wang, Z. Hyperspectral inversion models for soil organic matter content in the Yellow River Delta. J. Plant Nutr. Fertil. 2014, 20, 1545–1552. [Google Scholar]
- Gomez, C.; Lagacherie, P.; Coulouma, G. Regional predictions of eight common soil properties and their spatial structures from hyperspectral Vis–NIR data. Geoderma 2012, 189-190, 176–185. [Google Scholar] [CrossRef]
- Keesstra, S.; Pereira, P.; Novara, A.; Brevik, E.C.; Azorin-Molina, C.; Parras-Alcántara, L.; Jordán, A.; Cerdà, A. Effects of soil management techniques on soil water erosion in apricot orchards. Sci. Total Environ. 2016, 551-552, 357–366. [Google Scholar] [CrossRef] [PubMed]
- Lu, Y.; Bai, Y.; Yang, L.; Lei, W.; He, W. Homogeneity of retrieval models for soil organic matter of different soil types in Northeast Plain using hyperspectral data. J. Plant Nutr. Fertil. 2011, 17, 456–463. [Google Scholar]


| Soil Sample Set | n1 | SOM (g/kg) | SD 5 | CV 6 (%) | ||
|---|---|---|---|---|---|---|
| Min. 2 | Max. 3 | Mean 4 | ||||
| Whole Set | 64 | 2.58 | 257.34 | 63.84 | 61.70 | 0.97 |
| Quercus aquifolioides (Quercus aquifolioides Rehd. et Wils.) forest | 13 | 3.28 | 257.34 | 75.62 | 71.09 | 0.94 |
| Abies georgei (Abies georgei Orr) forest | 18 | 16.56 | 255.49 | 106.24 | 66.13 | 0.62 |
| Alpine pine (Pinus densata Mast.) forest | 12 | 4.13 | 84.55 | 29.23 | 25.06 | 0.86 |
| Yunnan pine (Pinus yunnanensis Franch.) forest | 21 | 2.58 | 186.34 | 39.97 | 43.26 | 1.08 |
| Particle Sizes | Spectral Pre-processing | Characteristic Bands (nm) | Correlation Coefficient |
|---|---|---|---|
| 2 mm | REF | 618.5 | −0.64 |
| RR | 614.4 | 0.75 | |
| LR | 615.8 | −0.71 | |
| FR | 566.1, 838.3, 1018.2, 1365.1, 1413.4, 1600.9, 1738.1, 1798.6, 1924.3, 1970.1, 2178.3 | −0.72, 0.78, 0.64, 0.58, −0.58, 0.53, 0.61, 0.57, −0.66, 0.61, 0.54 | |
| RFR | 791.8, 1048.6, 1424.6, 1520.5, 1738.1, 1798.6, 1924.3, 1956.8, 2168.4 | −0.89, −0.78, 0.53, −0.64, −0.59, −0.56, 0.70, −0.63, −0.56 | |
| LFR | 757.1, 1044.8, 1413.4, 1600.9, 1738.1, 1921.6, 1956.8, 2168.4 | 0.89, 0.75, −0.58, 0.60, 0.65, −0.72, 0.70, 0.58 | |
| 1 mm | REF | 619.9 | −0.641 |
| RR | 617.1 | 0.752 | |
| LR | 615.8 | −0.714 | |
| FR | 575.8, 798.1, 1029.6, 1365.1, 1413.4, 1738.1, 1924.3, 1959.4, 2163.5, 2239.3, 2319.6 | −0.72, 0.76, 0.61, 0.58, −0.59, 0.67, −0.68, 0.66, 0.67, −0.54, 0.52 | |
| RFR | 805.7, 1041, 1428, 1535.2, 1798.6, 1924.3, 1948.7, 2163.5, 2256 | −0.89, −0.77, 0.60, 0.65, −0.61, 0.78, −0.60, −0.63, 0.52 | |
| LFR | 757.1, 1041, 1413.4, 1619.1, 1738.1, 1924.3, 1959.4, 2163.5, 2239.3, 2319.6 | 0.88, 0.76, −0.61, 0.64, 0.67, −0.76, 0.68, 0.67, −0.55, 0.55 | |
| 0.50 mm | REF | 619.9 | −0.639 |
| RR | 615.8 | 0.748 | |
| LR | 617.1 | −0.708 | |
| FR | 564.7, 855.5, 1365.1, 1413.4, 1738.1, 1924.3, 1959.4, 2178.3, 2256 | −0.71, 0.75, 0.56, −0.55, 0.61, −0.67, 0.61, 0.57, −0.55 | |
| RFR | 807, 1044.8, 1424.6, 1619.1, 1738.1, 1921.6, 1967.5, 2178.3, 2312.6 | −0.88, −0.76, 0.60, −0.61, −0.55, 0.78, −0.58, −0.60, −0.55 | |
| LFR | 754.5, 1044.8, 1365.1, 1413.4, 1619.1, 1738.1, 1924.3, 1959.4, 2178.3, 2256, 2312.6 | 0.90, 0.72, 0.59, −0.55, 0.58, 0.63, −0.73, 0.67, 0.61, −0.56, 0.54 | |
| 0.25 mm | REF | 626.7 | −0.667 |
| RR | 618.5 | 0.775 | |
| LR | 619.9 | −0.735 | |
| FR | 566.1, 860.4, 1365.1, 1428.3, 1738.1, 1921.6, 1967.5, 2166, 2251.3 | −0.75, 0.80, 0.52, −0.51, 0.67, −0.67, 0.58, 0.52, −0.51 | |
| RFR | 842, 1048.6, 1428.3, 1553.5, 1738.1, 1921.6, 1956.8, 2190.6, 2248.9 | −0.89, −0.76, 0.55, −0.67, −0.62, 0.77, −0.67, −0.57, 0.52 | |
| LFR | 755.8, 1048.6, 1428.3, 1600.9, 1738.1, 1921.6, 1956.8, 2190.6, 2251.3, 2319.6 | 0.89, 0.72, −0.54, 0.59, 0.69, −0.77, 0.70, 0.53, −0.50, 0.50 |
| Particle Sizes | Pre-processing | Calibration | Validation | |||
|---|---|---|---|---|---|---|
| Rc21 | RMSEc 2 | Rv23 | RMSEv 4 | RPD 5 | ||
| 2 mm | REF | 0.41 | 50.05 | 0.20 | 39.81 | 1.12 |
| RR | 0.55 | 43.41 | 0.38 | 35.06 | 1.27 | |
| LR | 0.50 | 46.14 | 0.29 | 37.67 | 1.18 | |
| FR | 0.62 | 39.91 | 0.61 | 27.72 | 1.61 | |
| RFR | 0.68 | 36.69 | 0.73 | 23.09 | 1.93 | |
| LFR | 0.80 | 28.99 | 0.70 | 23.81 | 1.83 | |
| 1 mm | REF | 0.42 | 49.67 | 0.33 | 36.62 | 1.22 |
| RR | 0.57 | 42.88 | 0.42 | 34.04 | 1.31 | |
| LR | 0.51 | 45.56 | 0.38 | 35.08 | 1.27 | |
| FR | 0.59 | 41.56 | 0.50 | 31.62 | 1.41 | |
| RFR | 0.72 | 34.56 | 0.80 | 19.82 | 2.25 | |
| LFR | 0.78 | 30.62 | 0.72 | 23.69 | 1.88 | |
| 0.5 mm | REF | 0.42 | 49.76 | 0.36 | 35.61 | 1.25 |
| RR | 0.56 | 43.17 | 0.43 | 33.58 | 1.33 | |
| LR | 0.50 | 45.95 | 0.42 | 33.93 | 1.31 | |
| FR | 0.57 | 42.65 | 0.39 | 34.69 | 1.29 | |
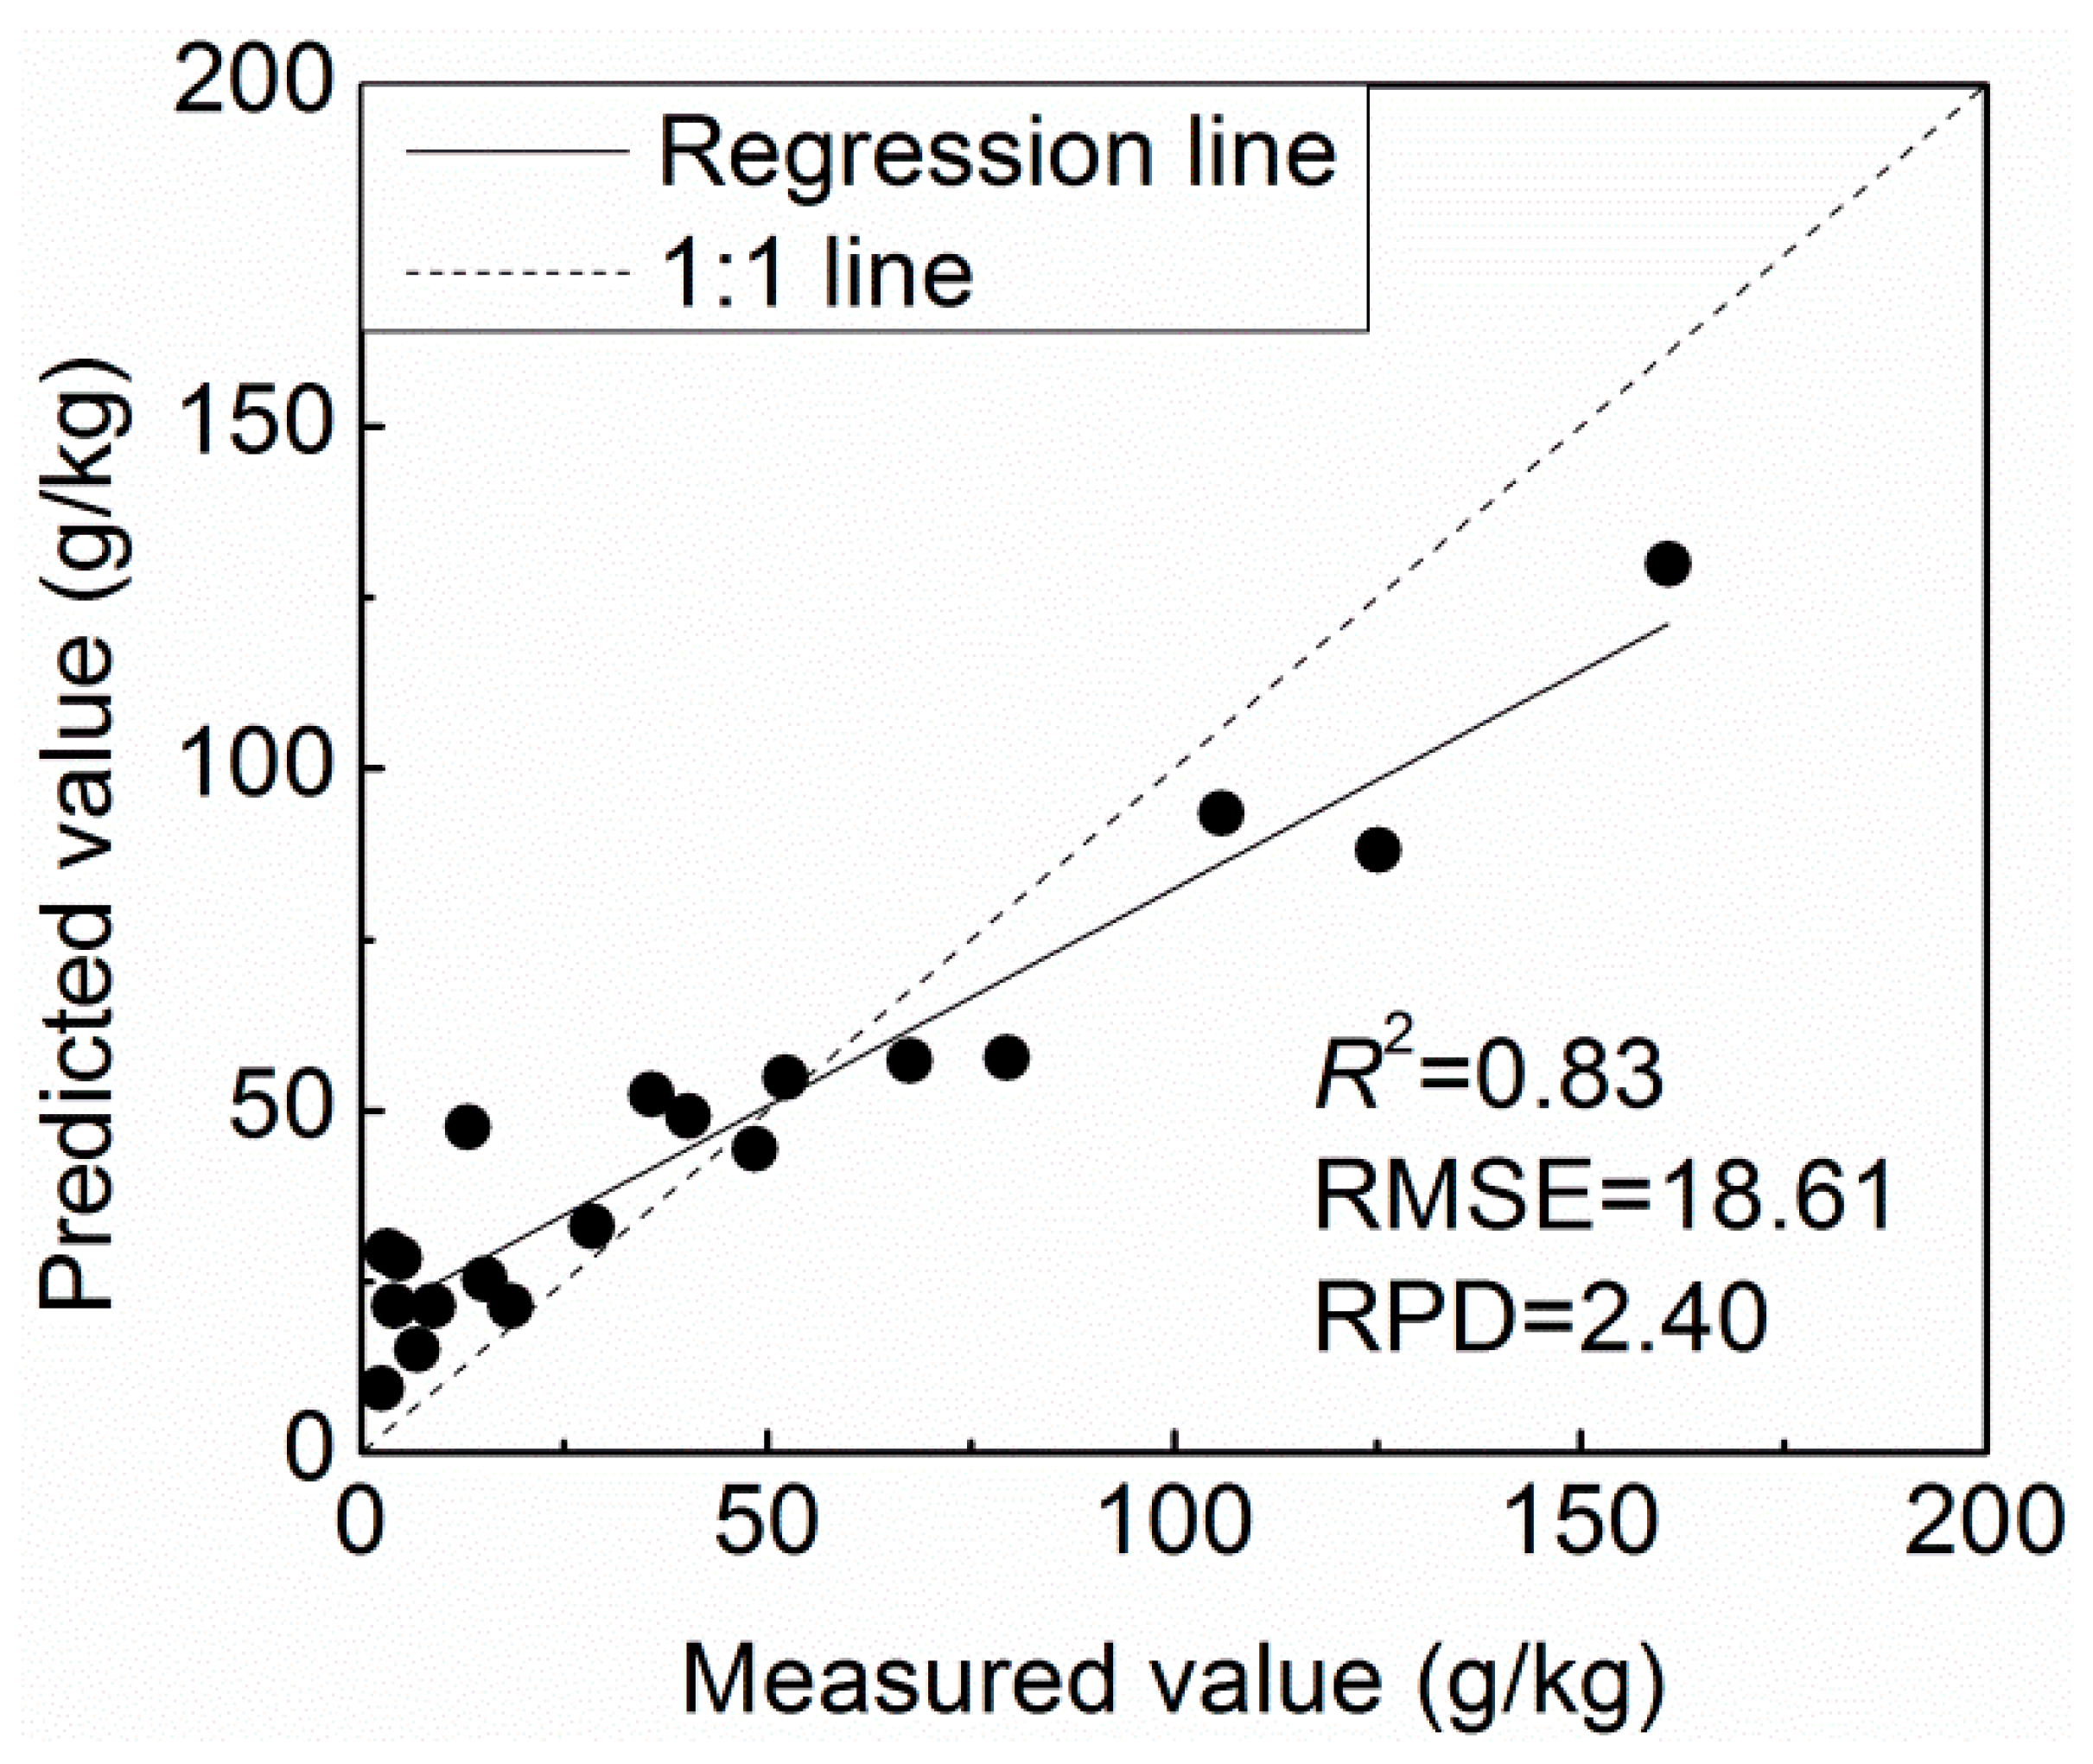
| RFR | 0.69 | 36.39 | 0.83 | 18.61 | 2.40 | |
| LFR | 0.80 | 28.94 | 0.79 | 20.21 | 2.21 | |
| 0.25 mm | REF | 0.46 | 47.76 | 0.28 | 37.83 | 1.18 |
| RR | 0.60 | 41.15 | 0.39 | 34.86 | 1.28 | |
| LR | 0.54 | 43.90 | 0.37 | 35.39 | 1.26 | |
| FR | 0.65 | 38.61 | 0.52 | 30.77 | 1.45 | |
| RFR | 0.76 | 31.56 | 0.70 | 24.25 | 1.84 | |
| LFR | 0.79 | 30.03 | 0.79 | 20.55 | 2.17 | |
| Particle Sizes | Pre-processing | Calibration | Validation | |||
|---|---|---|---|---|---|---|
| Rc2 | RMSEc | Rv2 | RMSEv | RPD | ||
| 2 mm | FR | 0.78 | 30.47 | 0.57 | 32.78 | 1.53 |
| RFR | 0.85 | 25.60 | 0.83 | 20.47 | 2.45 | |
| LFR | 0.88 | 22.36 | 0.74 | 25.72 | 1.95 | |
| 1 mm | FR | 0.82 | 27.37 | 0.55 | 33.69 | 1.49 |
| RFR | 0.85 | 25.61 | 0.79 | 23.21 | 2.16 | |
| LFR | 0.84 | 26.05 | 0.75 | 24.97 | 2.01 | |
| 0.50 mm | FR | 0.83 | 26.58 | 0.55 | 33.75 | 1.49 |
| RFR | 0.89 | 21.46 | 0.79 | 23.05 | 2.18 | |
| LFR | 0.87 | 23.64 | 0.86 | 18.86 | 2.66 | |
| 0.25 mm | FR | 0.83 | 26.82 | 0.29 | 42.38 | 1.18 |
| RFR | 0.90 | 20.68 | 0.78 | 23.73 | 2.12 | |
| LFR | 0.89 | 21.34 | 0.91 | 13.60 | 3.28 | |
| Particle Sizes | Pre-Processing | Calibration | Validation | |||
|---|---|---|---|---|---|---|
| Rc2 | RMSEc | Rv2 | RMSEv | Rc2 | ||
| 2 mm | FR | 0.79 | 29.93 | 0.68 | 25.18 | 1.77 |
| RFR | 0.85 | 25.42 | 0.85 | 17.45 | 2.56 | |
| LFR | 0.87 | 23.84 | 0.75 | 22.14 | 2.01 | |
| 1 mm | FR | 0.84 | 25.73 | 0.65 | 26.27 | 1.70 |
| RFR | 0.84 | 26.12 | 0.78 | 20.91 | 2.13 | |
| LFR | 0.83 | 26.78 | 0.76 | 21.99 | 2.03 | |
| 0.50 mm | FR | 0.80 | 29.27 | 0.74 | 22.57 | 1.98 |
| RFR | 0.89 | 21.36 | 0.79 | 20.35 | 2.19 | |
| LFR | 0.86 | 24.19 | 0.85 | 17.31 | 2.58 | |
| 0.25 mm | FR | 0.82 | 27.41 | 0.70 | 24.46 | 1.82 |
| RFR | 0.90 | 21.00 | 0.81 | 19.53 | 2.28 | |
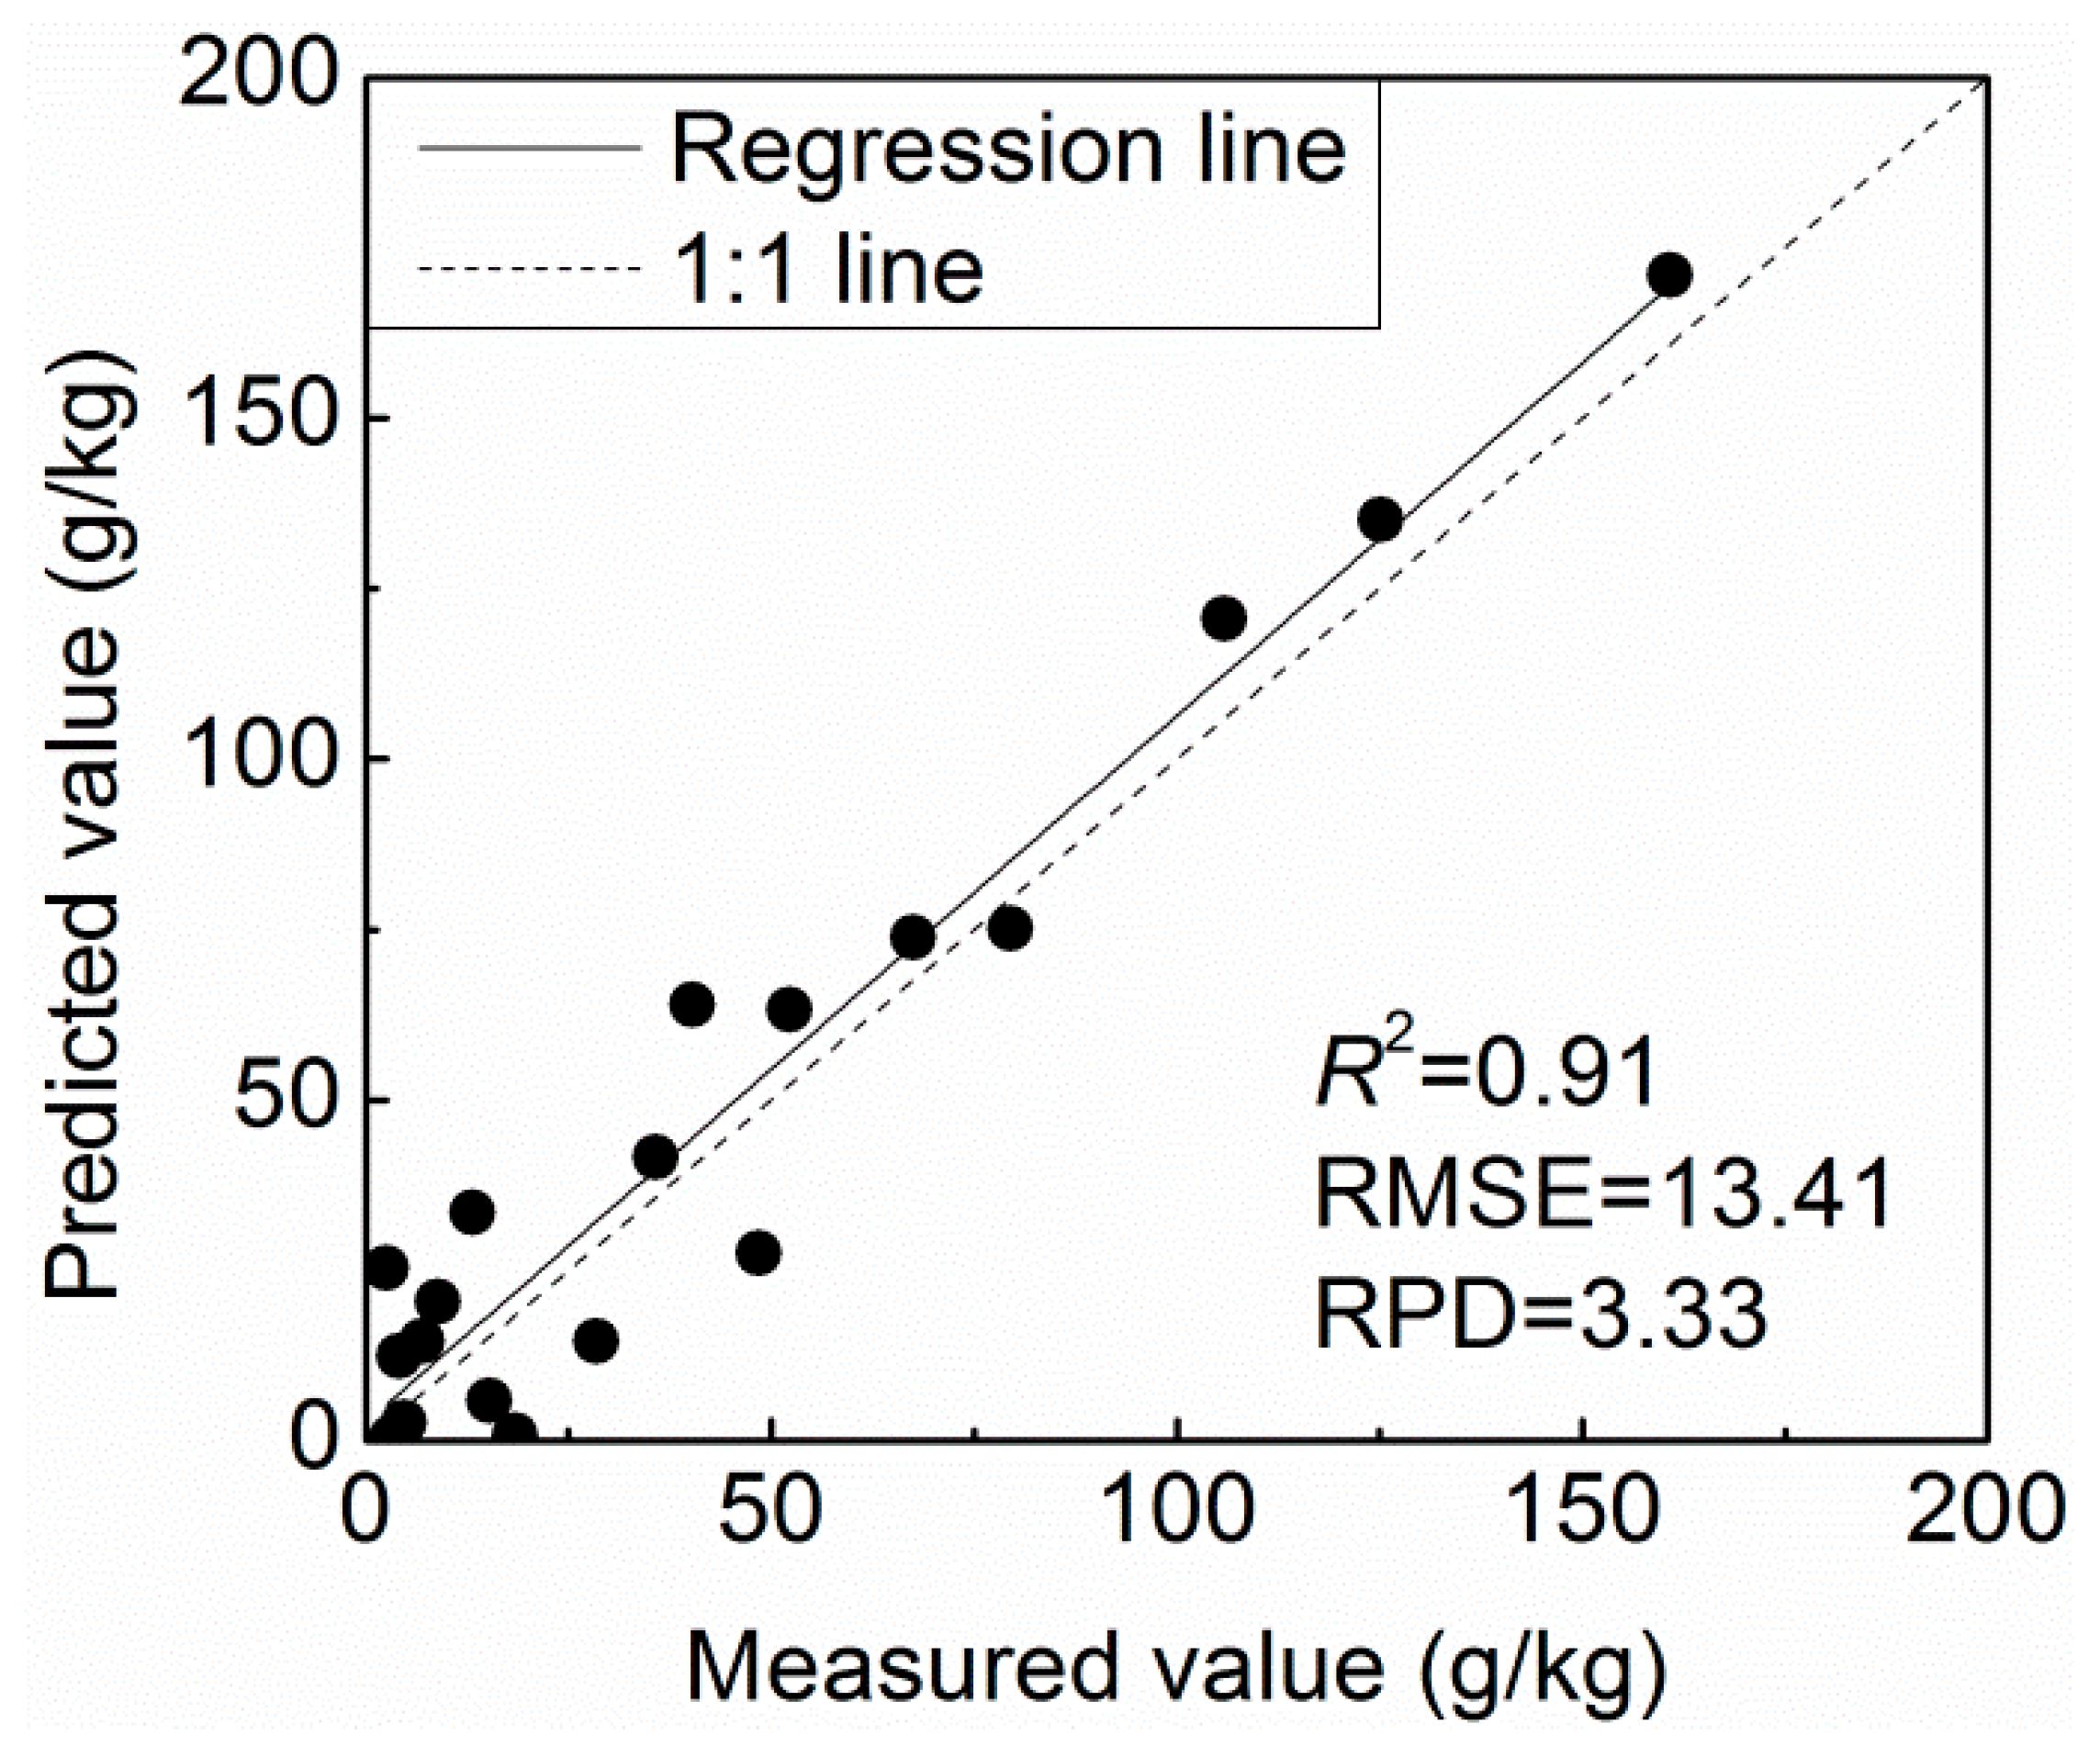
| LFR | 0.89 | 21.69 | 0.91 | 13.41 | 3.33 | |
© 2019 by the authors. Licensee MDPI, Basel, Switzerland. This article is an open access article distributed under the terms and conditions of the Creative Commons Attribution (CC BY) license (http://creativecommons.org/licenses/by/4.0/).
Share and Cite
Chen, Y.; Wang, J.; Liu, G.; Yang, Y.; Liu, Z.; Deng, H. Hyperspectral Estimation Model of Forest Soil Organic Matter in Northwest Yunnan Province, China. Forests 2019, 10, 217. https://doi.org/10.3390/f10030217
Chen Y, Wang J, Liu G, Yang Y, Liu Z, Deng H. Hyperspectral Estimation Model of Forest Soil Organic Matter in Northwest Yunnan Province, China. Forests. 2019; 10(3):217. https://doi.org/10.3390/f10030217
Chicago/Turabian StyleChen, Yun, Jinliang Wang, Guangjie Liu, Yanlin Yang, Zhiyuan Liu, and Huan Deng. 2019. "Hyperspectral Estimation Model of Forest Soil Organic Matter in Northwest Yunnan Province, China" Forests 10, no. 3: 217. https://doi.org/10.3390/f10030217