1. Introduction
Trees and grasses co-occur over roughly 1/8 of the Earth’s land surface [
1]. Over the past century, trees have increased in grasslands and savannas as a result of fire exclusion, grazing, and climate change and is occurring in the Americas, Australia, and Africa, e.g., [
2,
3]. This process is of global importance in part because it alters carbon cycling and can increase carbon ecosystem storage [
1,
4]. A region that is undergoing rapid afforestation due to tree encroachment is the southern Great Plains of the USA, which borders the eastern deciduous forest. Grasslands and savannas in this region are undergoing rapid encroachment from native species, such as
Juniperus virginiana L. [
5], as well as various
Quercus spp., such as
Q. stellata Wangenh. and
Q. marilandica Muenchh. [
6].
In particular,
J. virginiana encroachment is of regional significance. As of the late 2000s, juniper forests had replaced grasslands on over 130,000 ha in Oklahoma, USA and continued to increase at a rate of approximately 4800 ha year
−1 [
5]. This conversion can happen relatively quickly. For instance, in the Flint Hills region of Kansas, USA, grassland converted to closed-canopy
J. virginiana forest in 40 years [
2].
The encroachment of
J. virginiana and other woody plants into the grasslands of the southern Great Plains has profound and dramatic effects on ecosystem functions and services. Conversion from grassland to a closed-canopy
J. virginiana stand reduced herbaceous production and species richness [
2,
7]. When measured at the same research station as the current study, conversion of tallgrass prairie to
J. virginiana forest did not alter annual canopy interception of precipitation [
8], but did decrease runoff to streams [
9,
10] probably because of greater transpiration from the evergreen,
J. virginiana, which can transpire the majority of incoming precipitation [
11].
Juniperus virginiana encroachment also reduces habitat for prairie and savanna fauna [
12].
In particular, carbon dynamics and sequestration are dramatically altered by tree encroachment. With
J. virginiana encroachment and development of a closed-canopy woodland, aboveground litter inputs increased ten-fold to 500 g m
−2 year
−1, litter decay rate decreased, litter C:N decreased, and the soil organic horizon accumulated from near 0 to greater than 1500 g m
−2 [
13]. In addition, aboveground net primary production increased 2 to 3 times, aboveground carbon sequestration increased 10 to 20 times [
14], and soil carbon (combined O- and A-horizon) increased by 55% [
15]. However, afforestation is spatially and temporally heterogeneous because the encroachment process occurs at different rates and densities within a given area. Thus, understanding the spatial and temporal variation in soil carbon, the most stable and recalcitrant ecosystem carbon component, is critical to understand changes in the ecosystem carbon status as grasslands convert to woodlands and forests.
Soil carbon changes based on the balance between carbon inputs and decomposition. Thus, understanding aboveground litter inputs and root density as well as the environmental factors that affect decomposition, i.e., moisture and temperature, are essential to understand the mechanisms controlling changes in soil carbon associated with tree encroachment. Under individual
J. virginiana trees, soil temperature was lower, incident radiation was reduced [
16,
17], and throughfall was 25% to 50% of incoming precipitation [
16], which likely reduces the rate of soil organic matter decomposition. At the same time, greater aboveground litter inputs and the exclusion of fire caused the biomass of the O horizon to increase [
13]. Therefore, soil carbon might increase directly under isolated trees that are encroaching into grasslands. Soil carbon inputs from roots also will differ due to woody plant encroachment. While root turnover rates can vary in ranking between grassland and forest systems, Reich et al. [
18] found that standing root biomass was greater, but fine root turnover was lower in a grassland as opposed to the adjacent oak-dominated forest.
The objectives of our study were to: (1) Determine how soil carbon changes (0–5 cm, 5–10 cm, 10–15 cm, and 15–30 cm) with proximity to isolated J. virginiana and Q. marilandica trees establishing in a tallgrass prairie of northcentral Oklahoma; (2) characterize how litter inputs and accumulation change with proximity to these isolated trees; (3) quantify decomposition rates of J. virginiana, Schizachyrium scoparium (Michx.) Nash (little bluestem) and Q. marilandica leaf litter; and (4) characterize the distribution and density of fine and coarse root biomass in proximity to trees. We expected that root biomass and aboveground litter inputs would increase with proximity to individual tree stems due to greater inputs as well as slower decomposition, such that soil carbon would be greater near individual tree stems and decline with increasing distance from the stems. Results are important in that they provide an estimate of the spatial variability of carbon content and stock resulting from woody plant encroachment, which is the first step to understanding changes in soil carbon under varying encroachment scenarios.
2. Materials and Methods
2.1. Study Area
The research was conducted at the Oklahoma State University Cross Timbers Experimental Range Field Station located 15 km southwest of Stillwater, Payne County, Oklahoma, USA (36° 03′ 46.73″ N, 97° 11′ 03.33″ W; 331 m above sea level). The mean annual daily temperature is 15.0 °C, with an average daily minimum of 4.3 °C in January and an average daily maximum of 34.0 °C in August (Oklahoma Mesonet, Marena station; Oklahoma Climatological Survey). The average annual precipitation is 942 mm (Oklahoma Mesonet, Marena station; Oklahoma Climatological Survey). The study area is in the transitional zone between the deciduous forest to the east and the prairie to the west and includes a mosaic of both ecosystems. Grassland areas are dominated by C
4 grasses, including little bluestem (
S. scoparium), big bluestem (
Andropogon gerardii Vitman), Indiangrass (
Sorghastrum nutans (L.) Nash), switchgrass (
Panicum virgatum L.), and tall dropseed (
Sporobolus asper (Michx.) Kunth) [
7].
Juniperus virginiana trees are present on some parts of the grasslands, as well scattered oaks, including blackjack oak (
Q. marilandica), post oak (
Q. stellata), and chinquapin oak (
Q. muehlenbergii Engelm.).
The study area was cultivated for cotton in the 1930s. As a consequence of the cultivation, severe soil erosion occurred. In the 1950s the agricultural fields were abandoned and naturally re-seeded as prairie. The encroachment of trees on the site started in the 1970s. Prescribed fire, with different return intervals across the area, was introduced in 1983 on a portion of the study area containing a subset of sample trees (additional details below).
2.2. Tree Selection
Six replicate trees of Q. marilandica and J. virginiana were selected in the grassland area using several criteria. To minimize the influence of other trees, the distance between a study tree and any other tree was greater than the crown radius of the sample tree. For J. virginiana trees, significant noticeable fire impacts to the canopy were avoided. Based on these criteria, three Q. marilandica trees were selected from an area with a five-year fire return interval. The other three Q. marilandica trees were chosen in an area with no regular fire regime. The six J. virginiana trees were located in an area where fire was applied in the summer. Burning may influence soil carbon. However, for several years before the study, the J. virginiana area was excluded from fire and we specifically chose trees that did not show any signs of previous fire effects indicating minor local impacts on and adjacent to study trees. The area sampled around each tree varied as measurements associated with individual trees were based on positions relative to the canopy radius. At the beginning of the experiment, fencing was installed around individual trees to prevent grazing and interference from cows. While some grazing may have occurred the year before the experiment as cows occasionally moved through the area, grazing pressure was very light and no visible signs grazing were noted at the beginning of the experiment.
The soil series for three trees of each species were Zaneis (fine-loamy, siliceous, active, thermic Udic Argiustolls)–Huska (fine, mixed, superactive, thermic Mollic Natrustalfs) complex. Two
Q. marilandica and three
J. virginiana were located on the Coyle soil series (fine-loamy, siliceous, active, thermic Udic Argiustolls) and one
Q. marilandica was situated on the Renfrow soil series (fine, mixed, superactive, thermic Udertic Paleustolls) (USDA, National Resources Conservations Service,
https://soilseries.sc.egov.usda.gov). A Vertex IV hypsometer (Haglöf, Sweden) was used to measure the canopy diameter in the north-south and east-west directions, as well as tree height. Stem diameter was measured with a diameter tape at breast height (1.37 m above ground level). Stem age was measured by taking a core with in increment borer at 1.37 m above ground level. Cores were sanded and annual growth rings counted under magnification. Measurements underestimated age slightly as it takes several years for the trees to reach 1.37 m tall.
2.3. Environmental Conditions
Three of the six study trees of each species were randomly chosen for soil temperature measurements. Twelve ibuttons (DS1921G, Maxim Integrated, San Jose, CA, USA), were placed on the soil surface after the litter layer was removed at three positions along each cardinal direction. The three positions were the midpoint of the canopy, the edge of the canopy, and beyond the tree canopy at a distance equivalent to half the canopy radius. Measurements from the different cardinal directions were averaged according to point position. Another two sensors were placed 5 cm deep in the soil in a northeast direction at positions under the tree canopy and beyond the tree canopy. Measurements were collected every three hours from February to October in 2016, and averaged by week for statistical analysis. Data were reported as the weekly mean temperature.
For all six study trees per species, soil volumetric water content was measured between 0 to 12 cm using a Hydrosense II (Campbell Scientific, Inc. Logan, UT, USA) at four sample points in each cardinal direction (N, E, S, and W). The four positions were adjacent (approximately 10 cm) to the tree stem (point 1), the midpoint of the canopy (point 2), the edge of the canopy (point 3), and beyond the tree canopy at a distance equivalent to half the canopy radius (point 4). Measurements from different cardinal directions were averaged according to the point position. Measurements were collected every two weeks from April to December in 2016.
2.4. Carbon Inputs
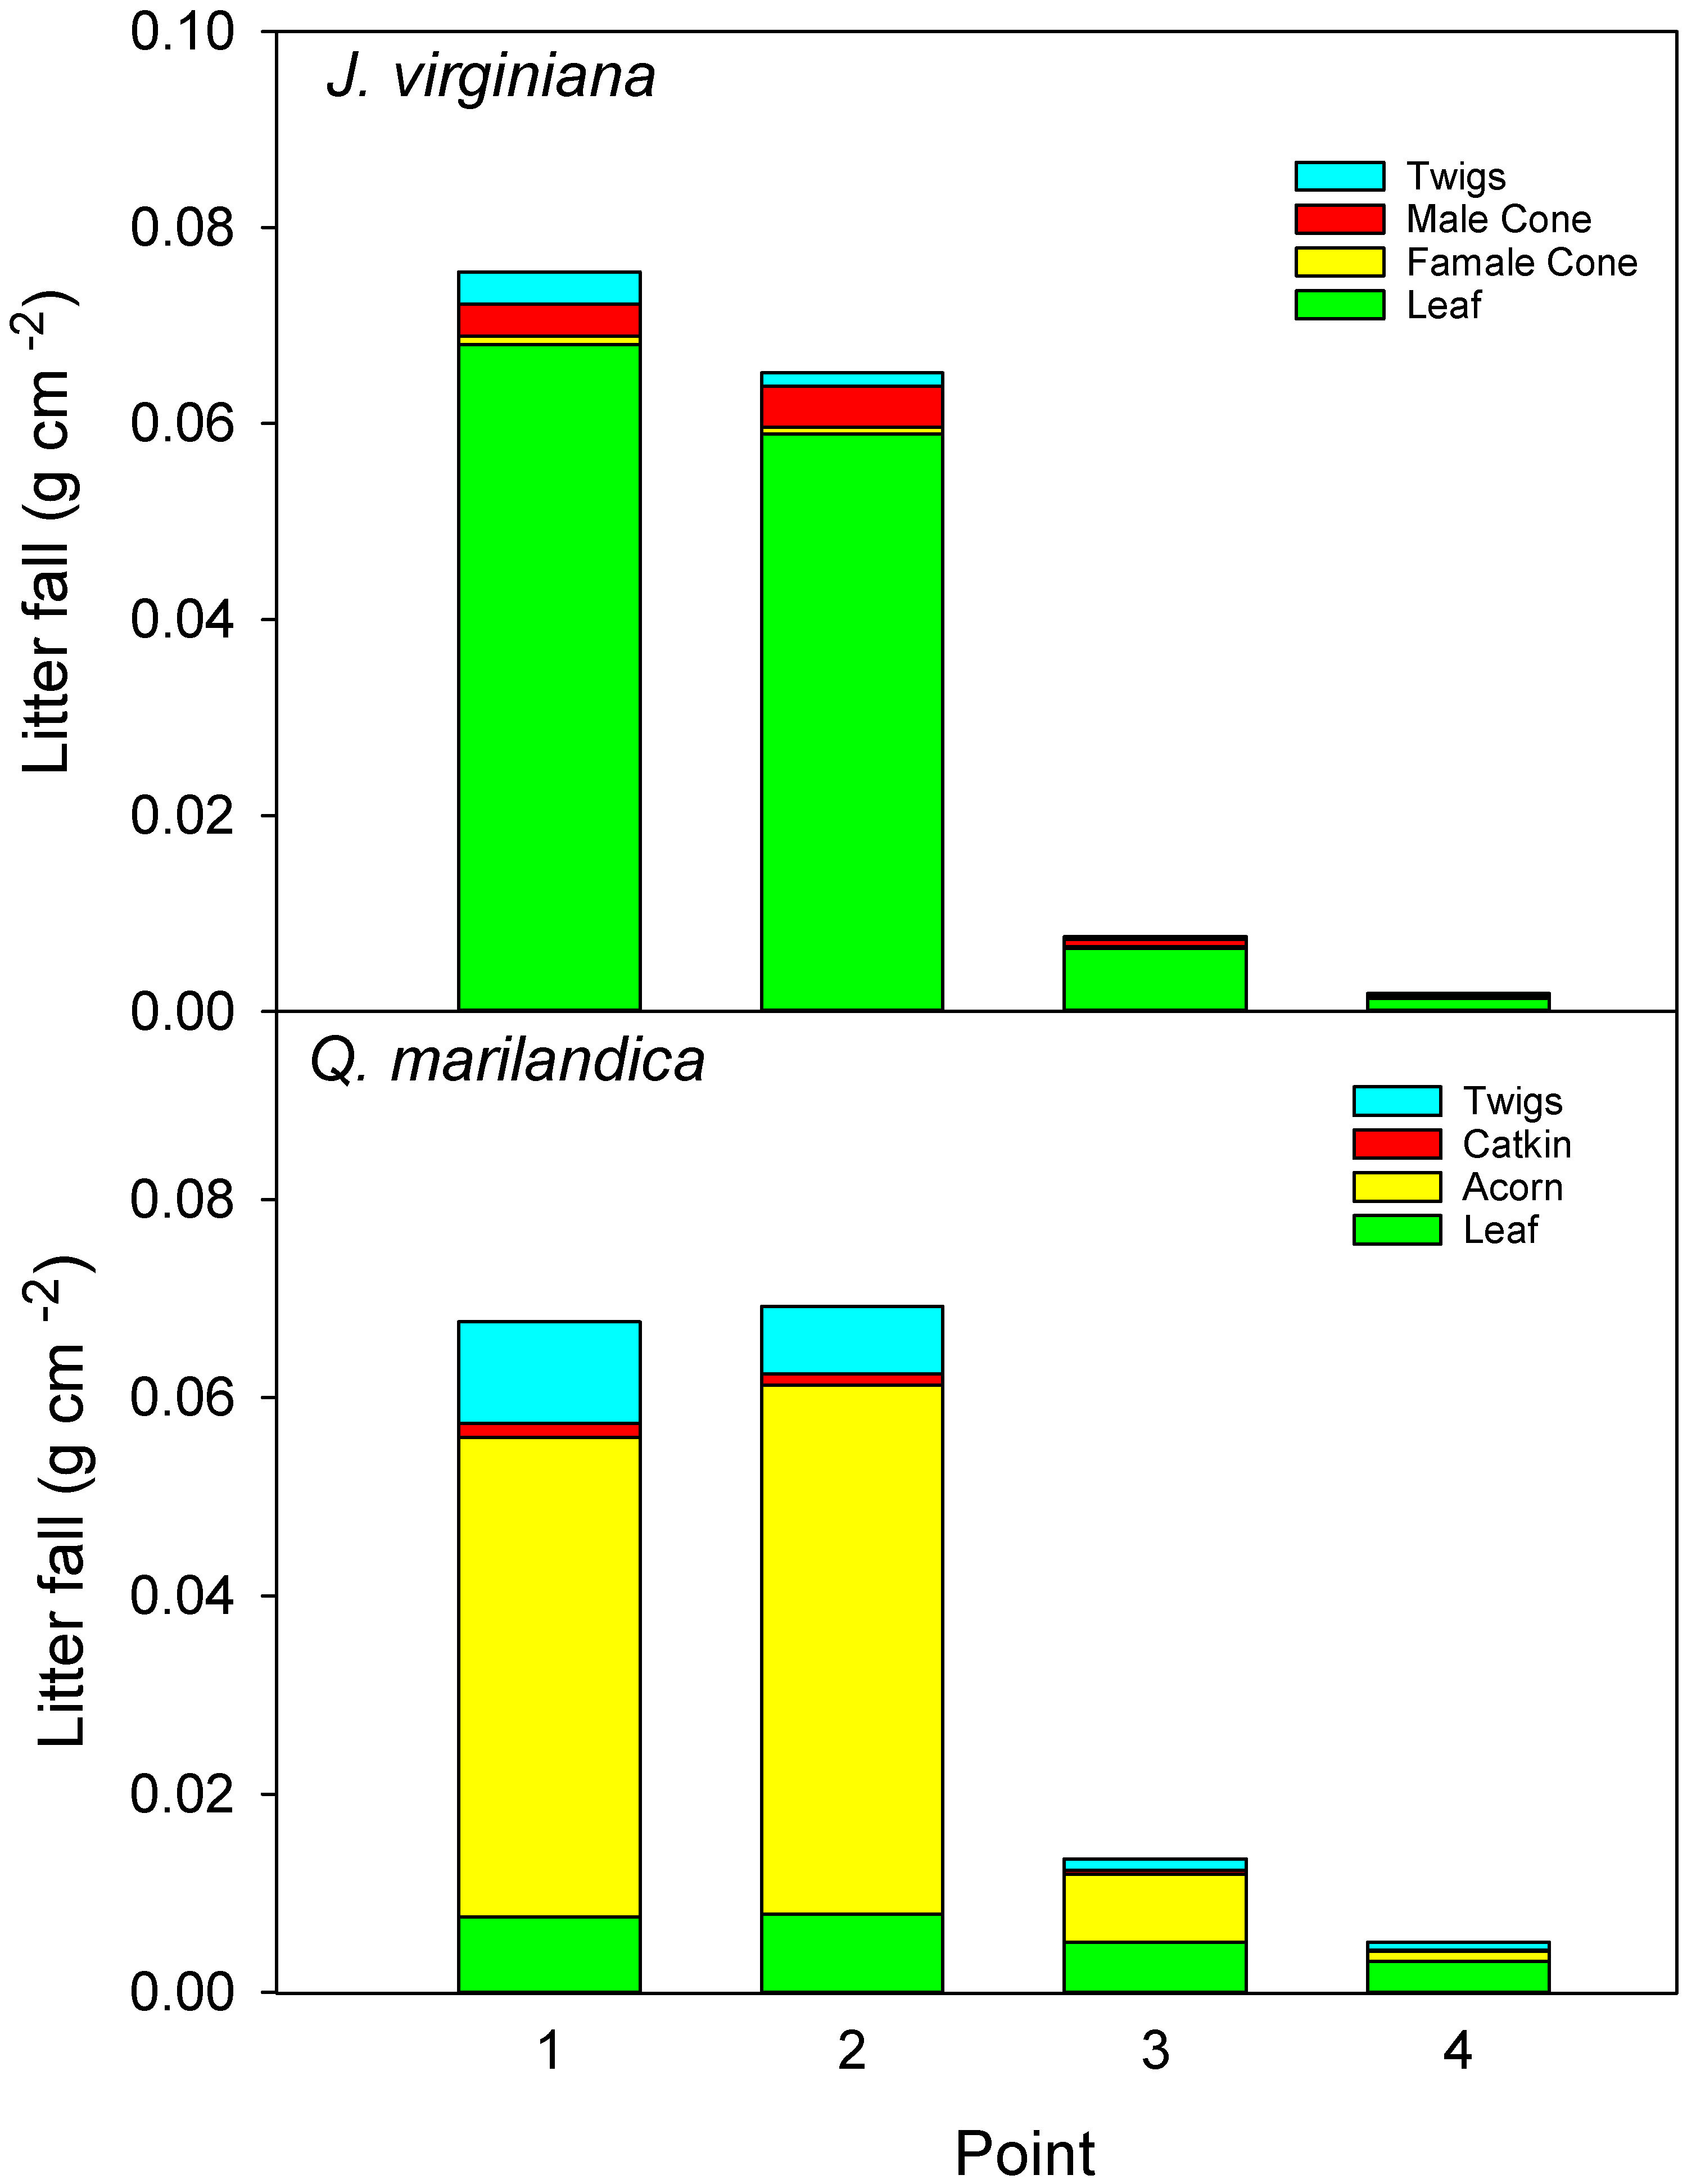
For all the study trees, eight litter traps of a 30 × 30 cm size, made from a plastic basket covered by a fine mesh, were arranged in a northwest to southeast transect. Traps were placed at point 1 (adjacent to tree), point 2 (midpoint of the canopy), point 3 (edge of canopy), and point 4 (beyond canopy). Litter was collected once a month from March 2016 to December 2016. While Q. marilandica may retain its senesced leaves on the tree until early spring, the trees in our study completed abscission before our last litterfall collection. Juniperus virginiana drops litter year round, but January to February is a time of minimal litterfall and represents a small fraction of the annual production. Litter was sorted by species and component, i.e., foliage, reproductive, and twig, dried at 60 °C until a constant weight was reached, and weighed. The litter collected by the two traps at the same distance was composited as one sample.
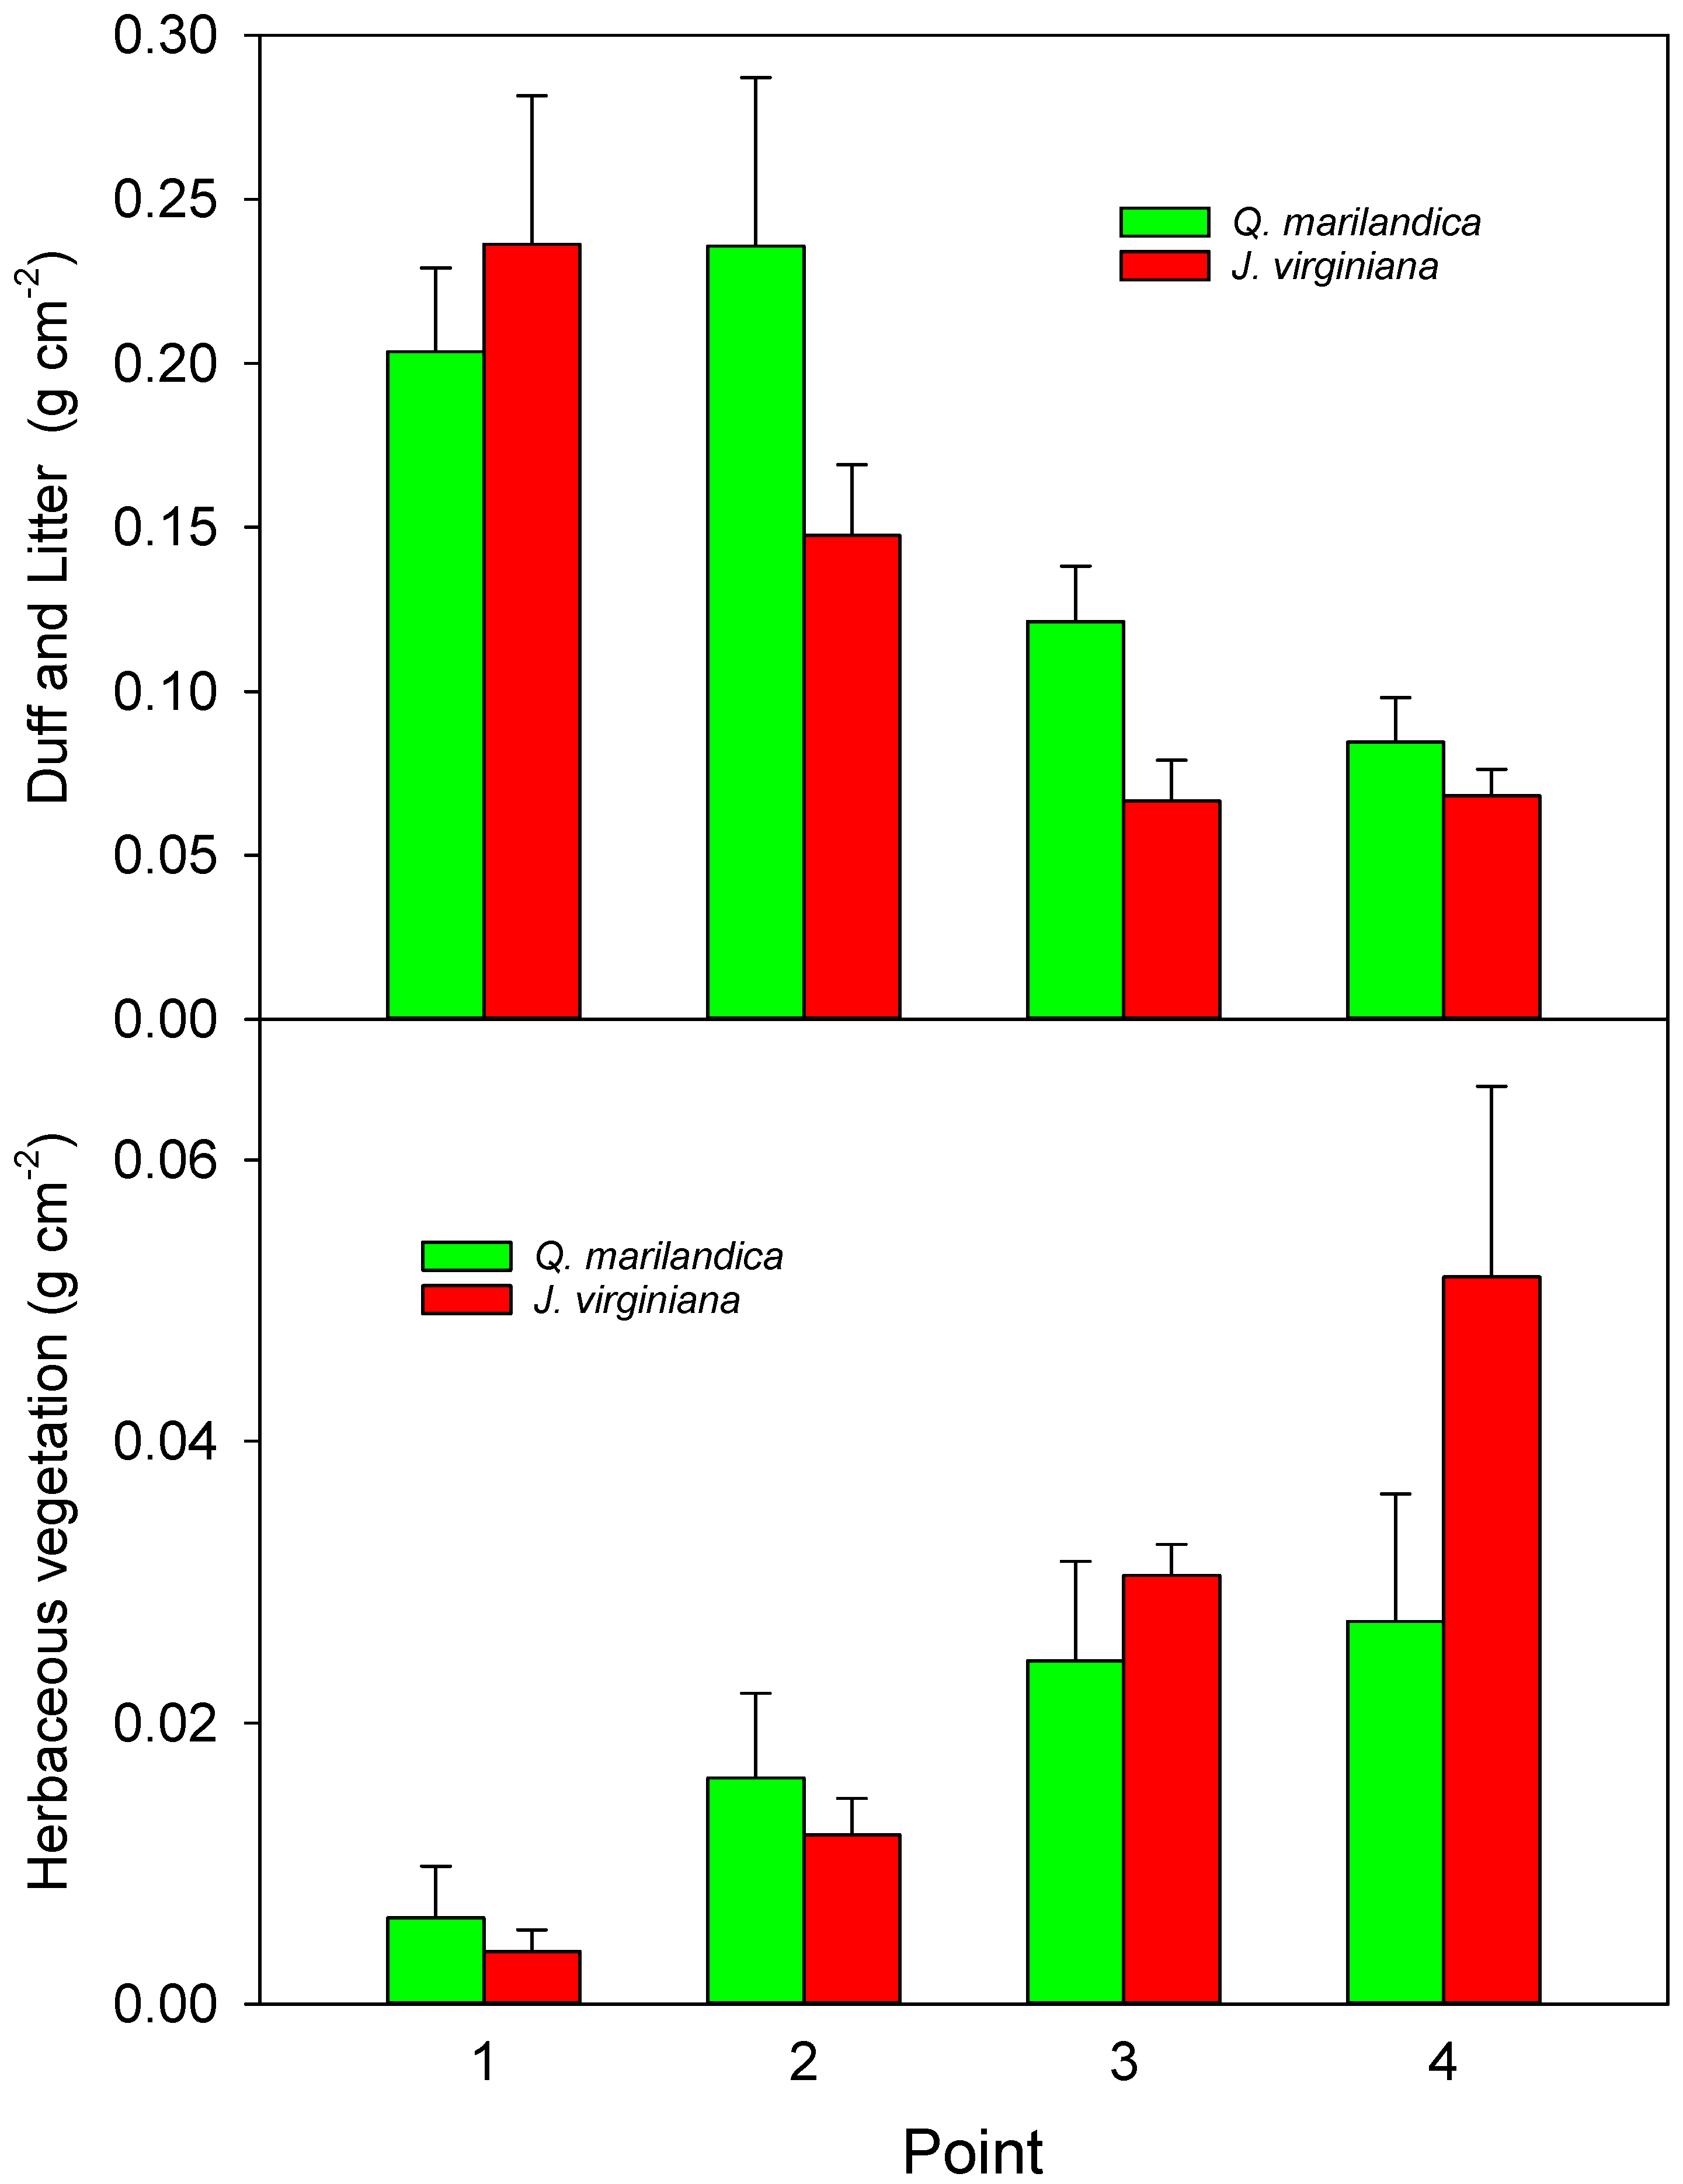
The total biomass of the existing litter and duff layer was determined for point 1 (adjacent to the stem), point 2 (midpoint of tree canopy), point 3 (edge of tree canopy), and point 4 (beyond the tree canopy) for each cardinal direction in a 15 × 15 cm area during the first week of March 2016. Samples were placed in a paper bag, dried at 60 °C, and weighed. All plants from the 15 × 15 cm quadrat were cut at the soil surface, removed, dried at 60 °C, and weighed to estimate herbaceous aboveground net primary productivity (ANPP) for the 2015 growing season. For both the litter/duff layer and understory plants, the four quadrats for each cardinal direction were averaged according to point position.
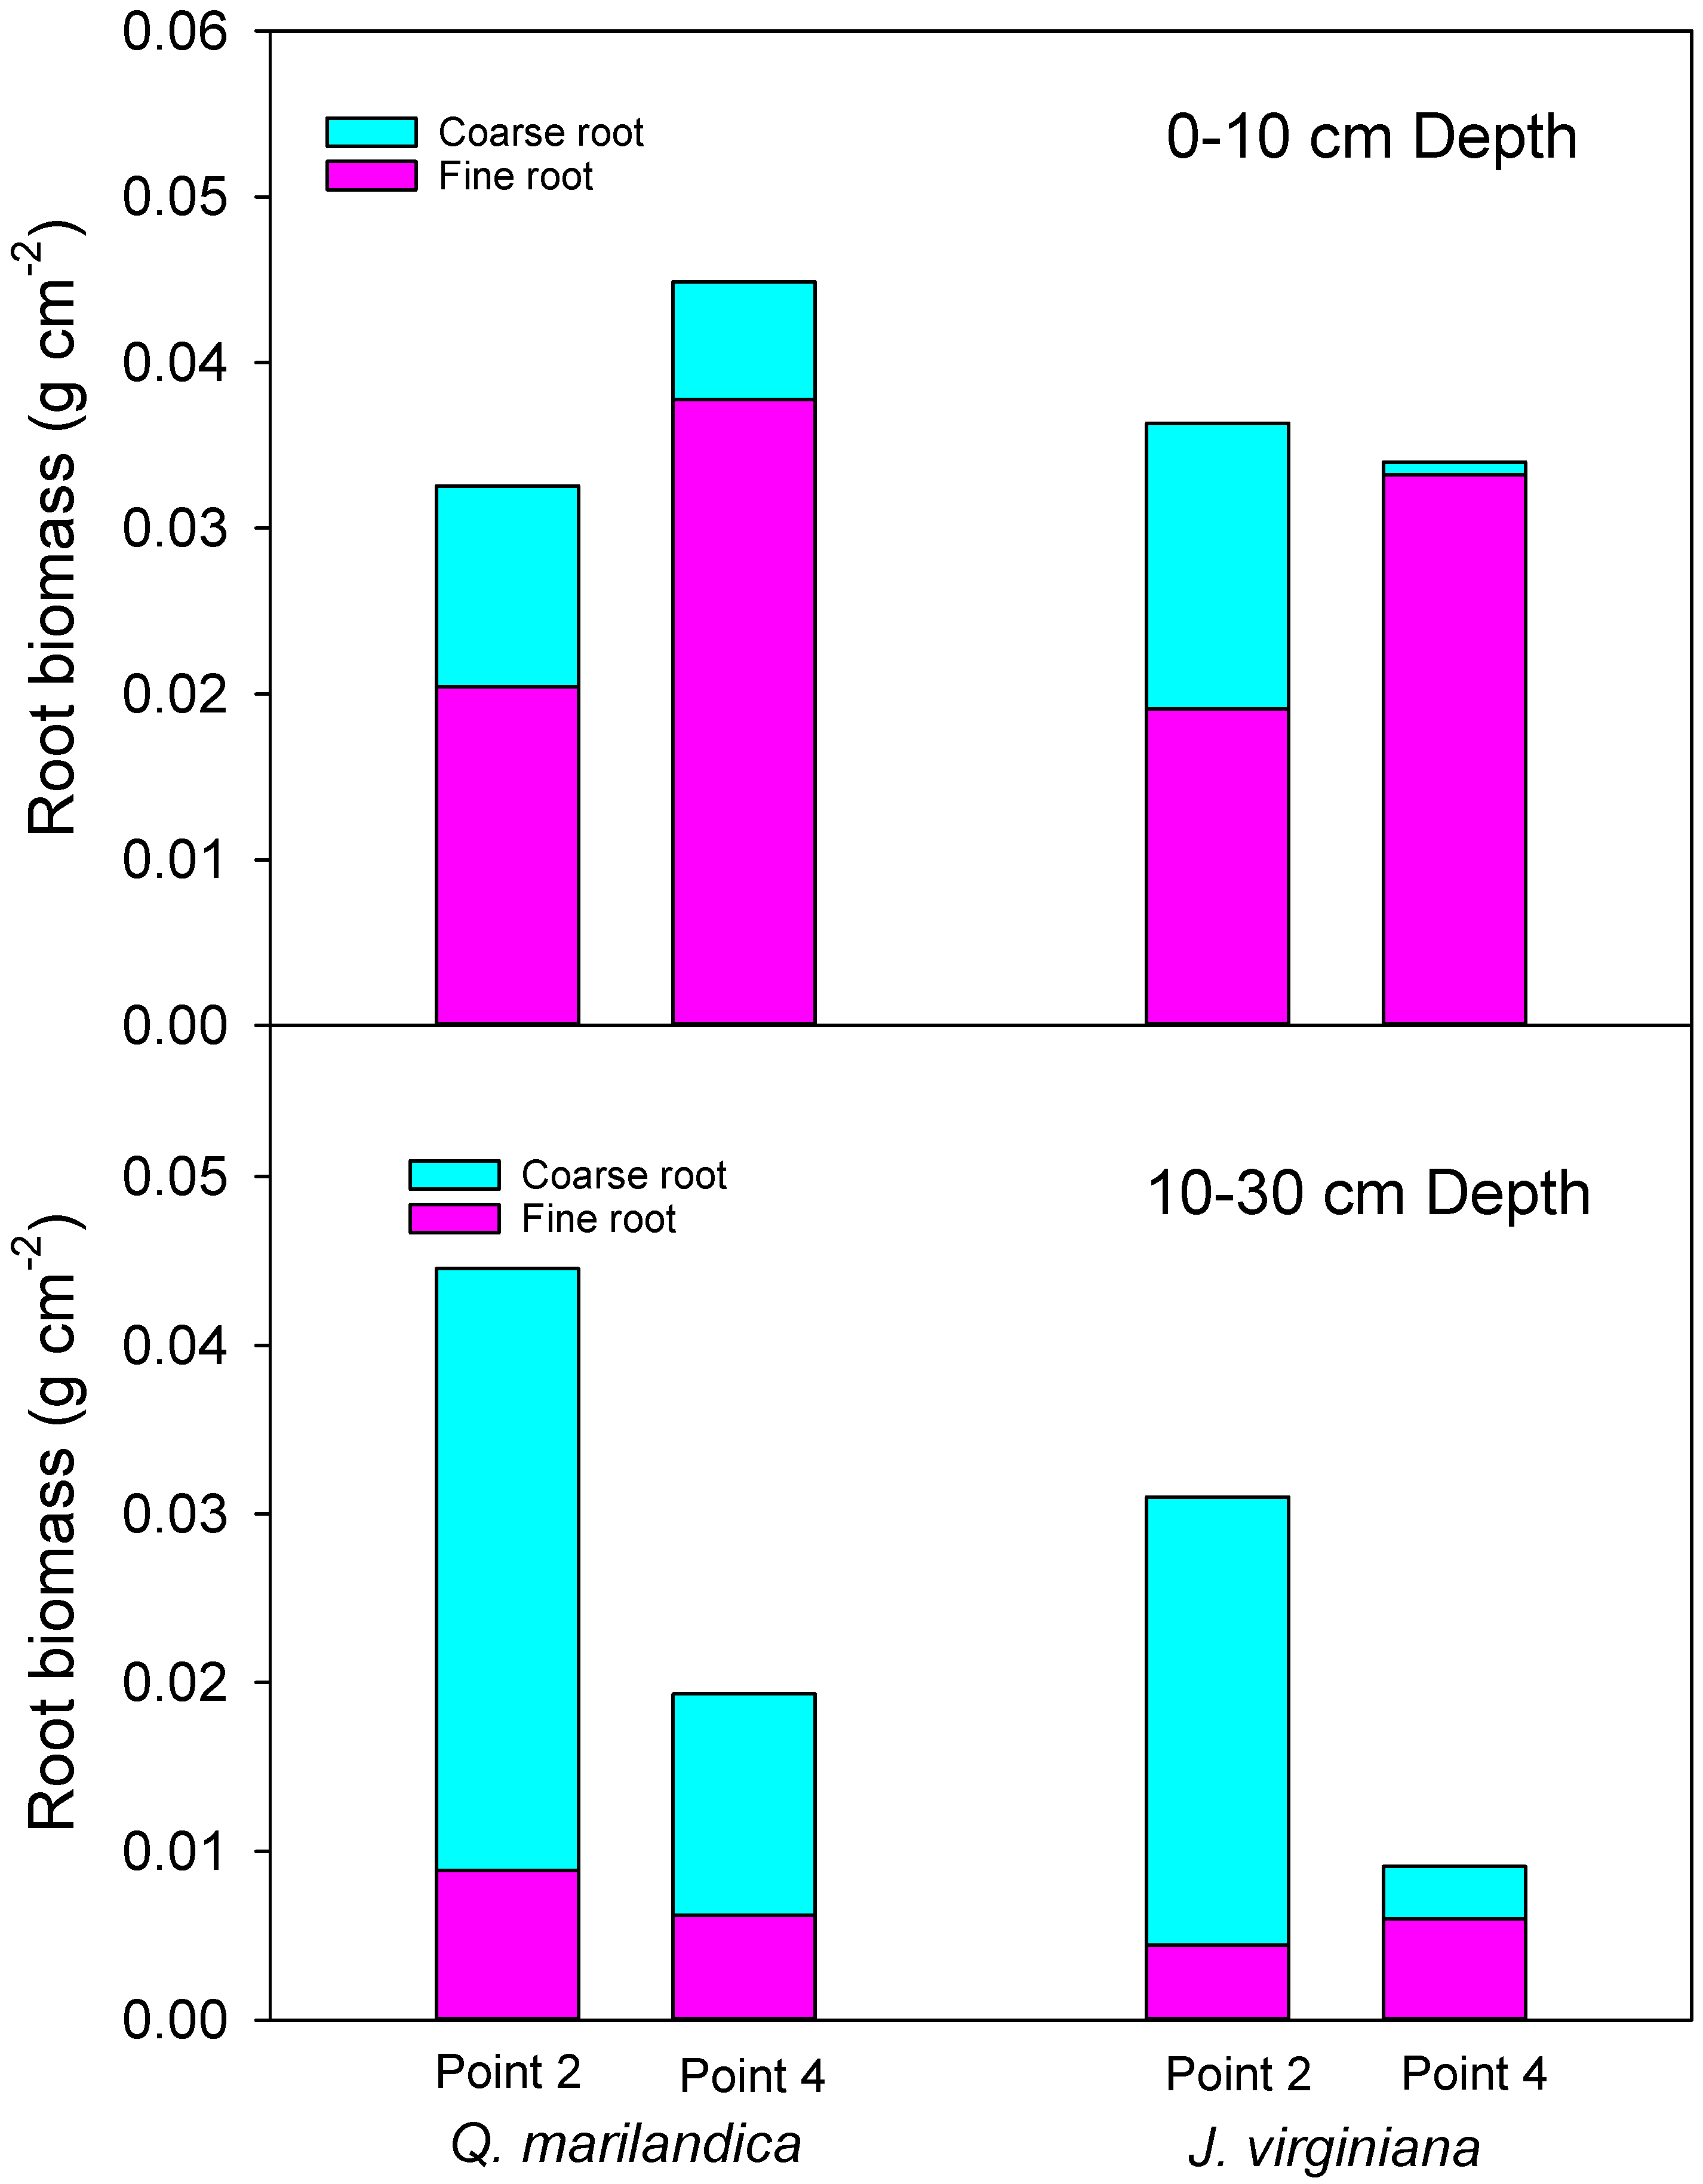
Root biomass was estimated by measuring fine root (<2 mm diameter) and coarse root (>2 mm diameter) size classes. Samples were collected using a sharp, non-curved spade during November 2016 from a 30 × 30 cm quadrat for two depths, 0 to 10 cm and 10 to 30 cm, at points 2 (midpoint of tree canopy) and 4 (beyond the tree canopy) along a northeast to southwest transect (two samples for each position per tree). Soil was sieved to separate roots from soil. Samples were composited by point, depth, and position. After this process, the roots were washed and placed in a drying oven at 60 °C until they reached a constant weight.
2.5. Litter Decomposition
Leaf litter decomposition bags were made from 2 mm fiberglass mesh approximately 20 × 20 cm in size and filled with one of three types of substrate; approximately 40 g of senesced, air-dried leaf litter from J. virginiana, approximately 12 g air-dried, senesced litter from Q. marilandica, and approximately 20 g of air-dried, senesced litter from S. scoparium. Different weights for the three species were used because the bags were filled based on volume. Litter for this portion of the experiment was collected in November 2015 from locations adjacent to the sample trees. One litter bag of each type was placed directly on the soil surface at point 2 (midpoint of tree canopy), point 3 (edge of tree canopy), and point 4 (beyond the tree canopy) in each cardinal direction under each sample tree on March 17, 2016. At the time of field placement, three extra litterbags of each type were returned to the lab and oven dried to determine moisture content at the time of placement. At each collection period, one litter bag of each type was collected from one of the cardinal directions from every tree. The first collection was September 19, 2016, the second collection was December 12, 2016, and the third collection was March 10, 2017. Collected litterbags were placed in a paper bag and oven-dried. The percent of mass loss of leaf litter was calculated after correction of the initial weight. It should be noted that the 2 mm mesh might cause an underestimation of decomposition because the small openings might exclude larger soil mesophauna that play an important role in litter decomposition.
2.6. Soil Carbon
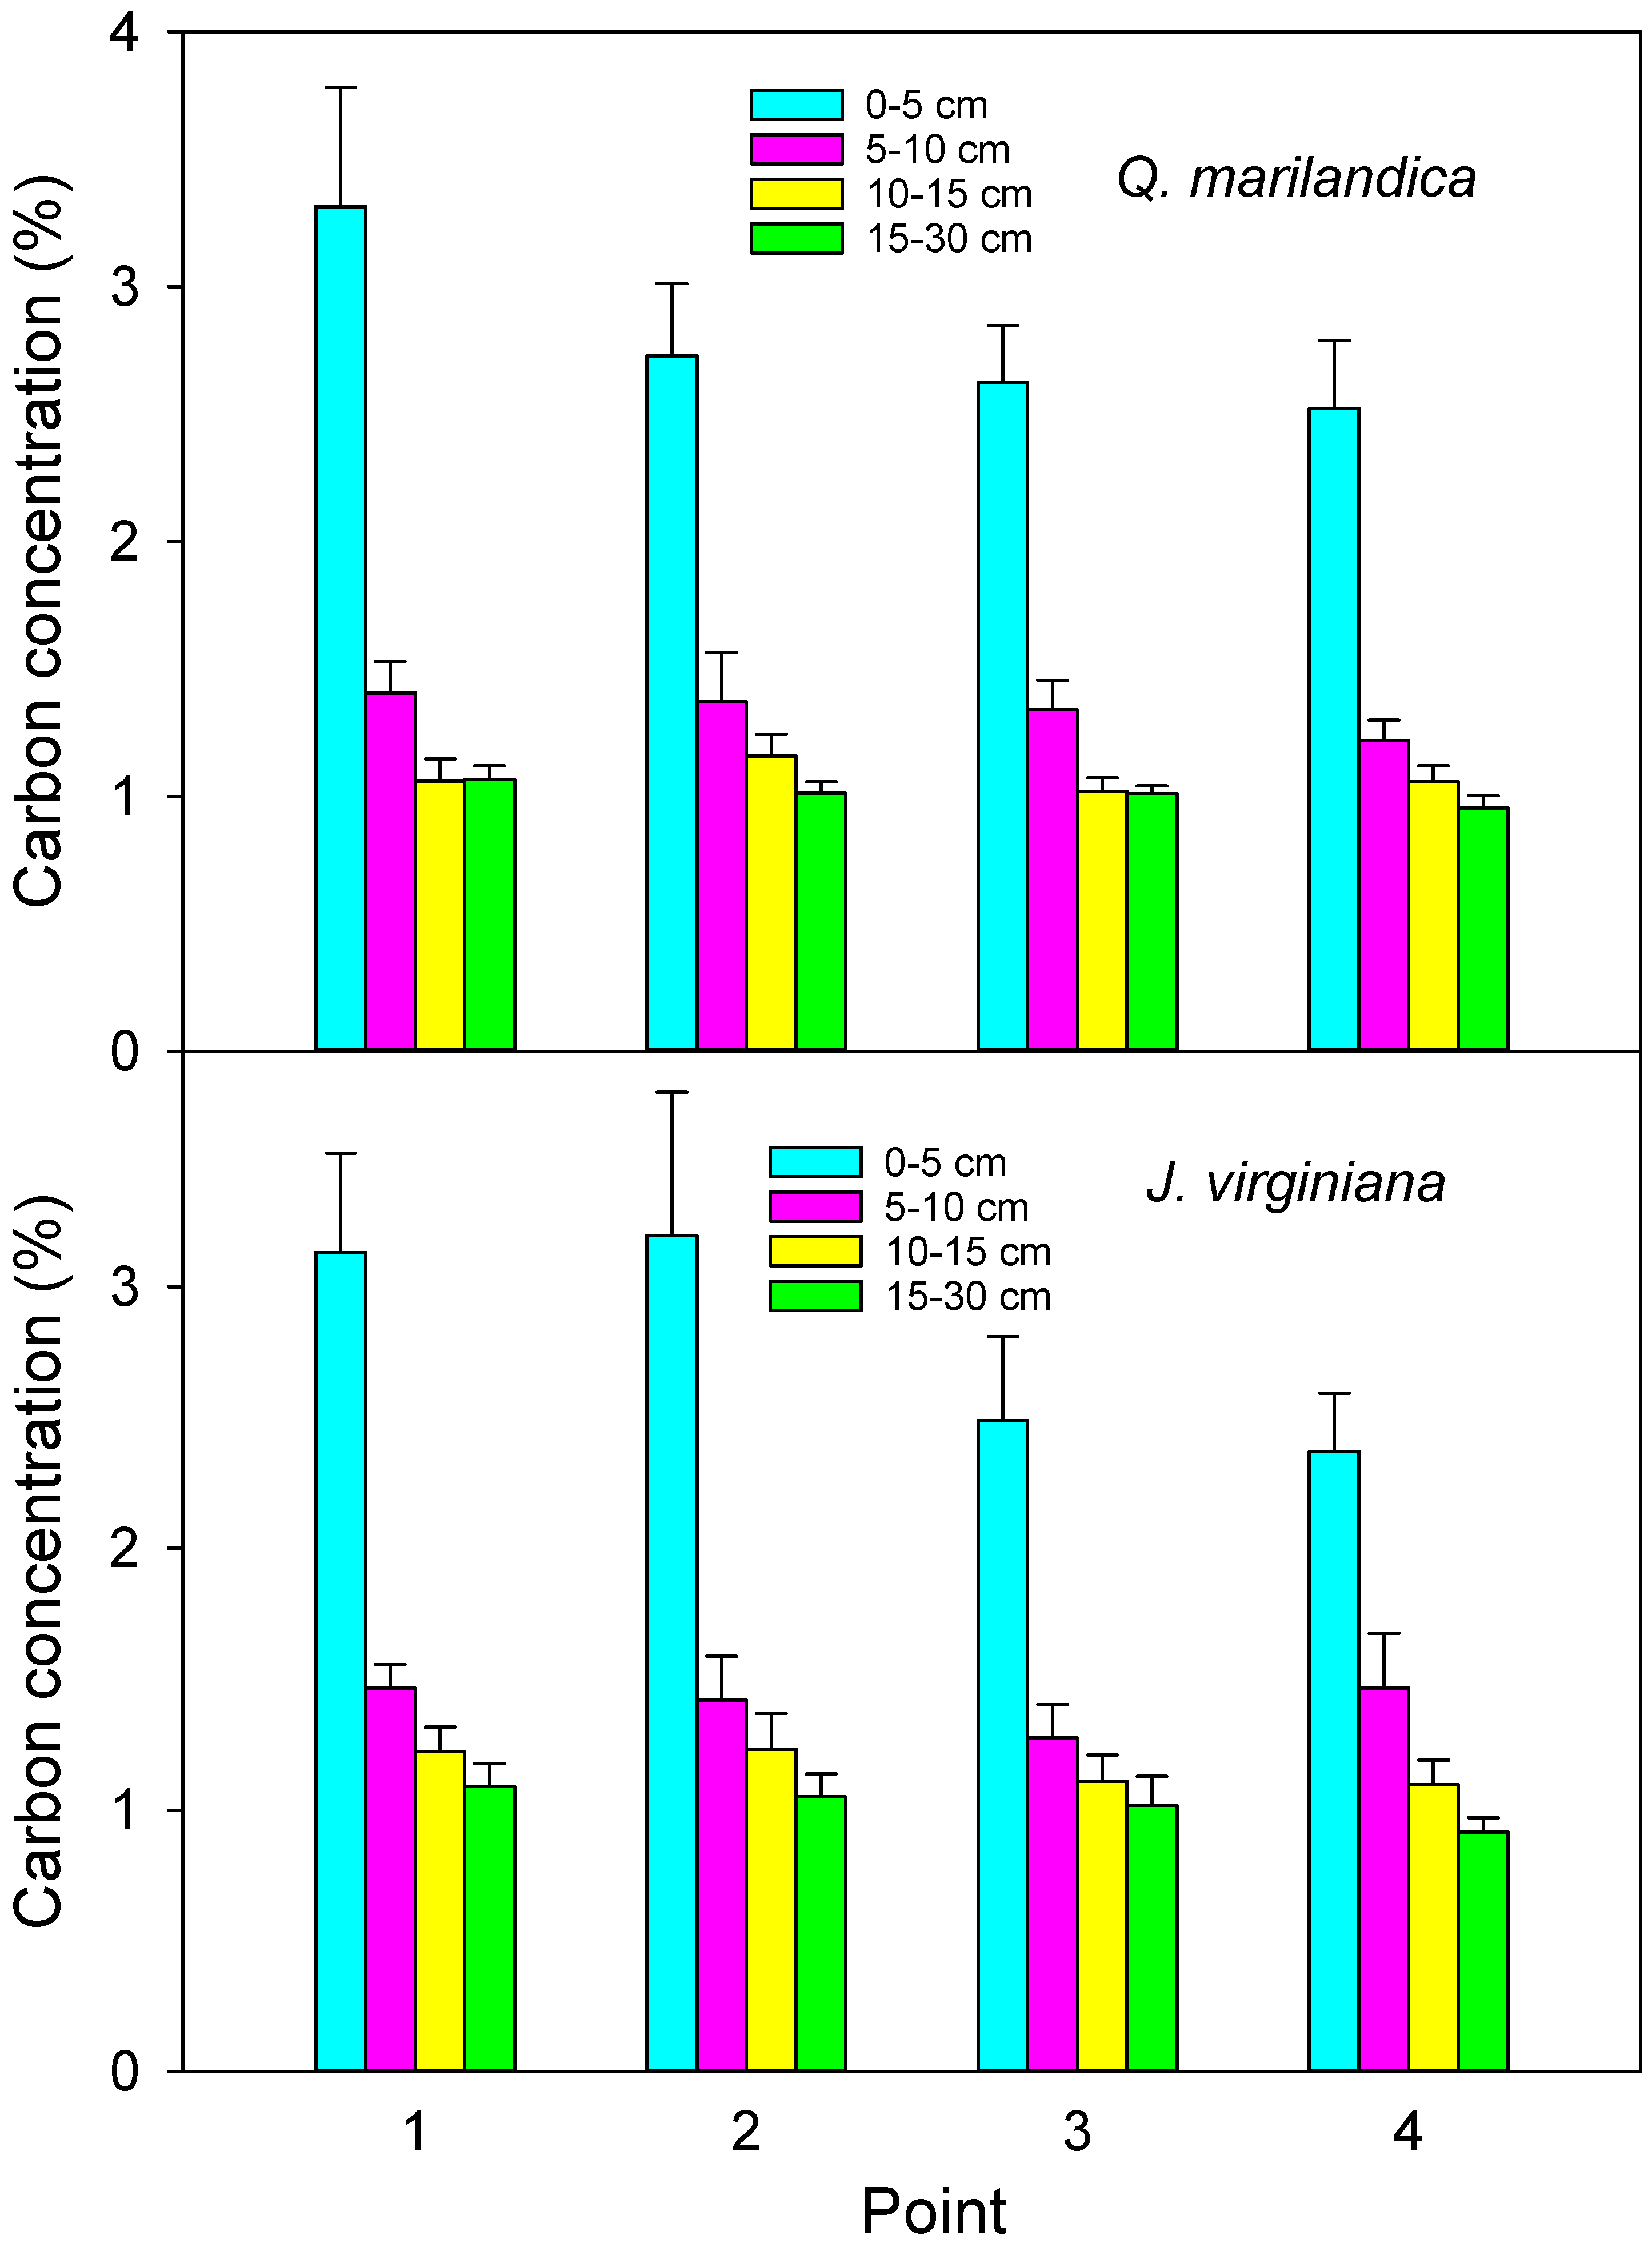
Four sample points in each cardinal direction (N, E, S, and W) were sampled for soil organic carbon. Sample points were point 1 (adjacent to the stem), point 2 (midpoint of tree canopy), point 3 (edge of tree canopy), and point 4 (beyond the tree canopy). Soil was collected with a 3.5 cm diameter soil probe at depths of 0 to 5 cm, 5 to 10 cm, 10 to 15 cm, and 15 to 30 cm during August 2016. Samples were composited for each radial position and depth combination. The soil was passed through a 2 mm sieve and visible roots and organic debris were removed. Samples were dried at 60 °C and ground. Organic carbon fraction was analyzed directly by the loss on ignition method (LECO CN-2000, LECO Corporation, Saint Joseph, MI, USA) by the Soil, Water, and Forage Analytical Laboratory at Oklahoma State University.
To determine soil bulk density, soil cores were taken on positions 2 and 4 along a northeast transect. Samples were taken with a 5 cm diameter auger to a 0 to 5 cm, 5 to 10 cm, 10 to 15 cm, and 15 to 30 cm depth during the first week of March 2016. Care was taken to ensure an accurate volume of soil was excavated for each sample. Samples were oven dried at 90 °C until they reached a constant weight. Bulk density was calculated as dry mass/volume of the soil. Soil carbon content was calculated as bulk density*carbon concentration according to the point and soil depth with the bulk density from point 2 used for calculations for points 1 and 2 and the bulk density from point 4 used to calculate carbon content for points 3 and 4.
2.7. Statistical Analyses
All data were statistically analyzed with software SAS 9.3 (SAS Institute Inc. 2010, Cary, NC, USA) using Proc Mixed. The overall design was a split-plot analysis with species serving as the whole-plot factor and point serving as the split-plot factor. The trees of a given species were spatially separate from those of the other species. Therefore, we make no inference regarding species differences. However, inference regarding whether the effect of point was consistent among the two species, i.e., point × species interaction, is permitted. When the point × species interaction was significant, species were analyzed separately. When data included repeated measures, e.g., temperature, a repeated measures component was added using the autoregressive 1 (AR1) covariance structure. When different soil depths were included, e.g., soil carbon, soil depth was added as a second split-plot factor. Data were log transformed (log (value +1)) as necessary to meet the assumption of homogeneous variance. The sample size for testing point effects was 6 for each species. Given the split-plot approach, the degrees of freedom for tests involving point and involving the point × species interaction were 3 for the numerator and 30 for the denominator when not considering repeated measures. Degrees of freedom for the denominator increased with repeated measures in accordance with how many times variables were sampled.
4. Discussion
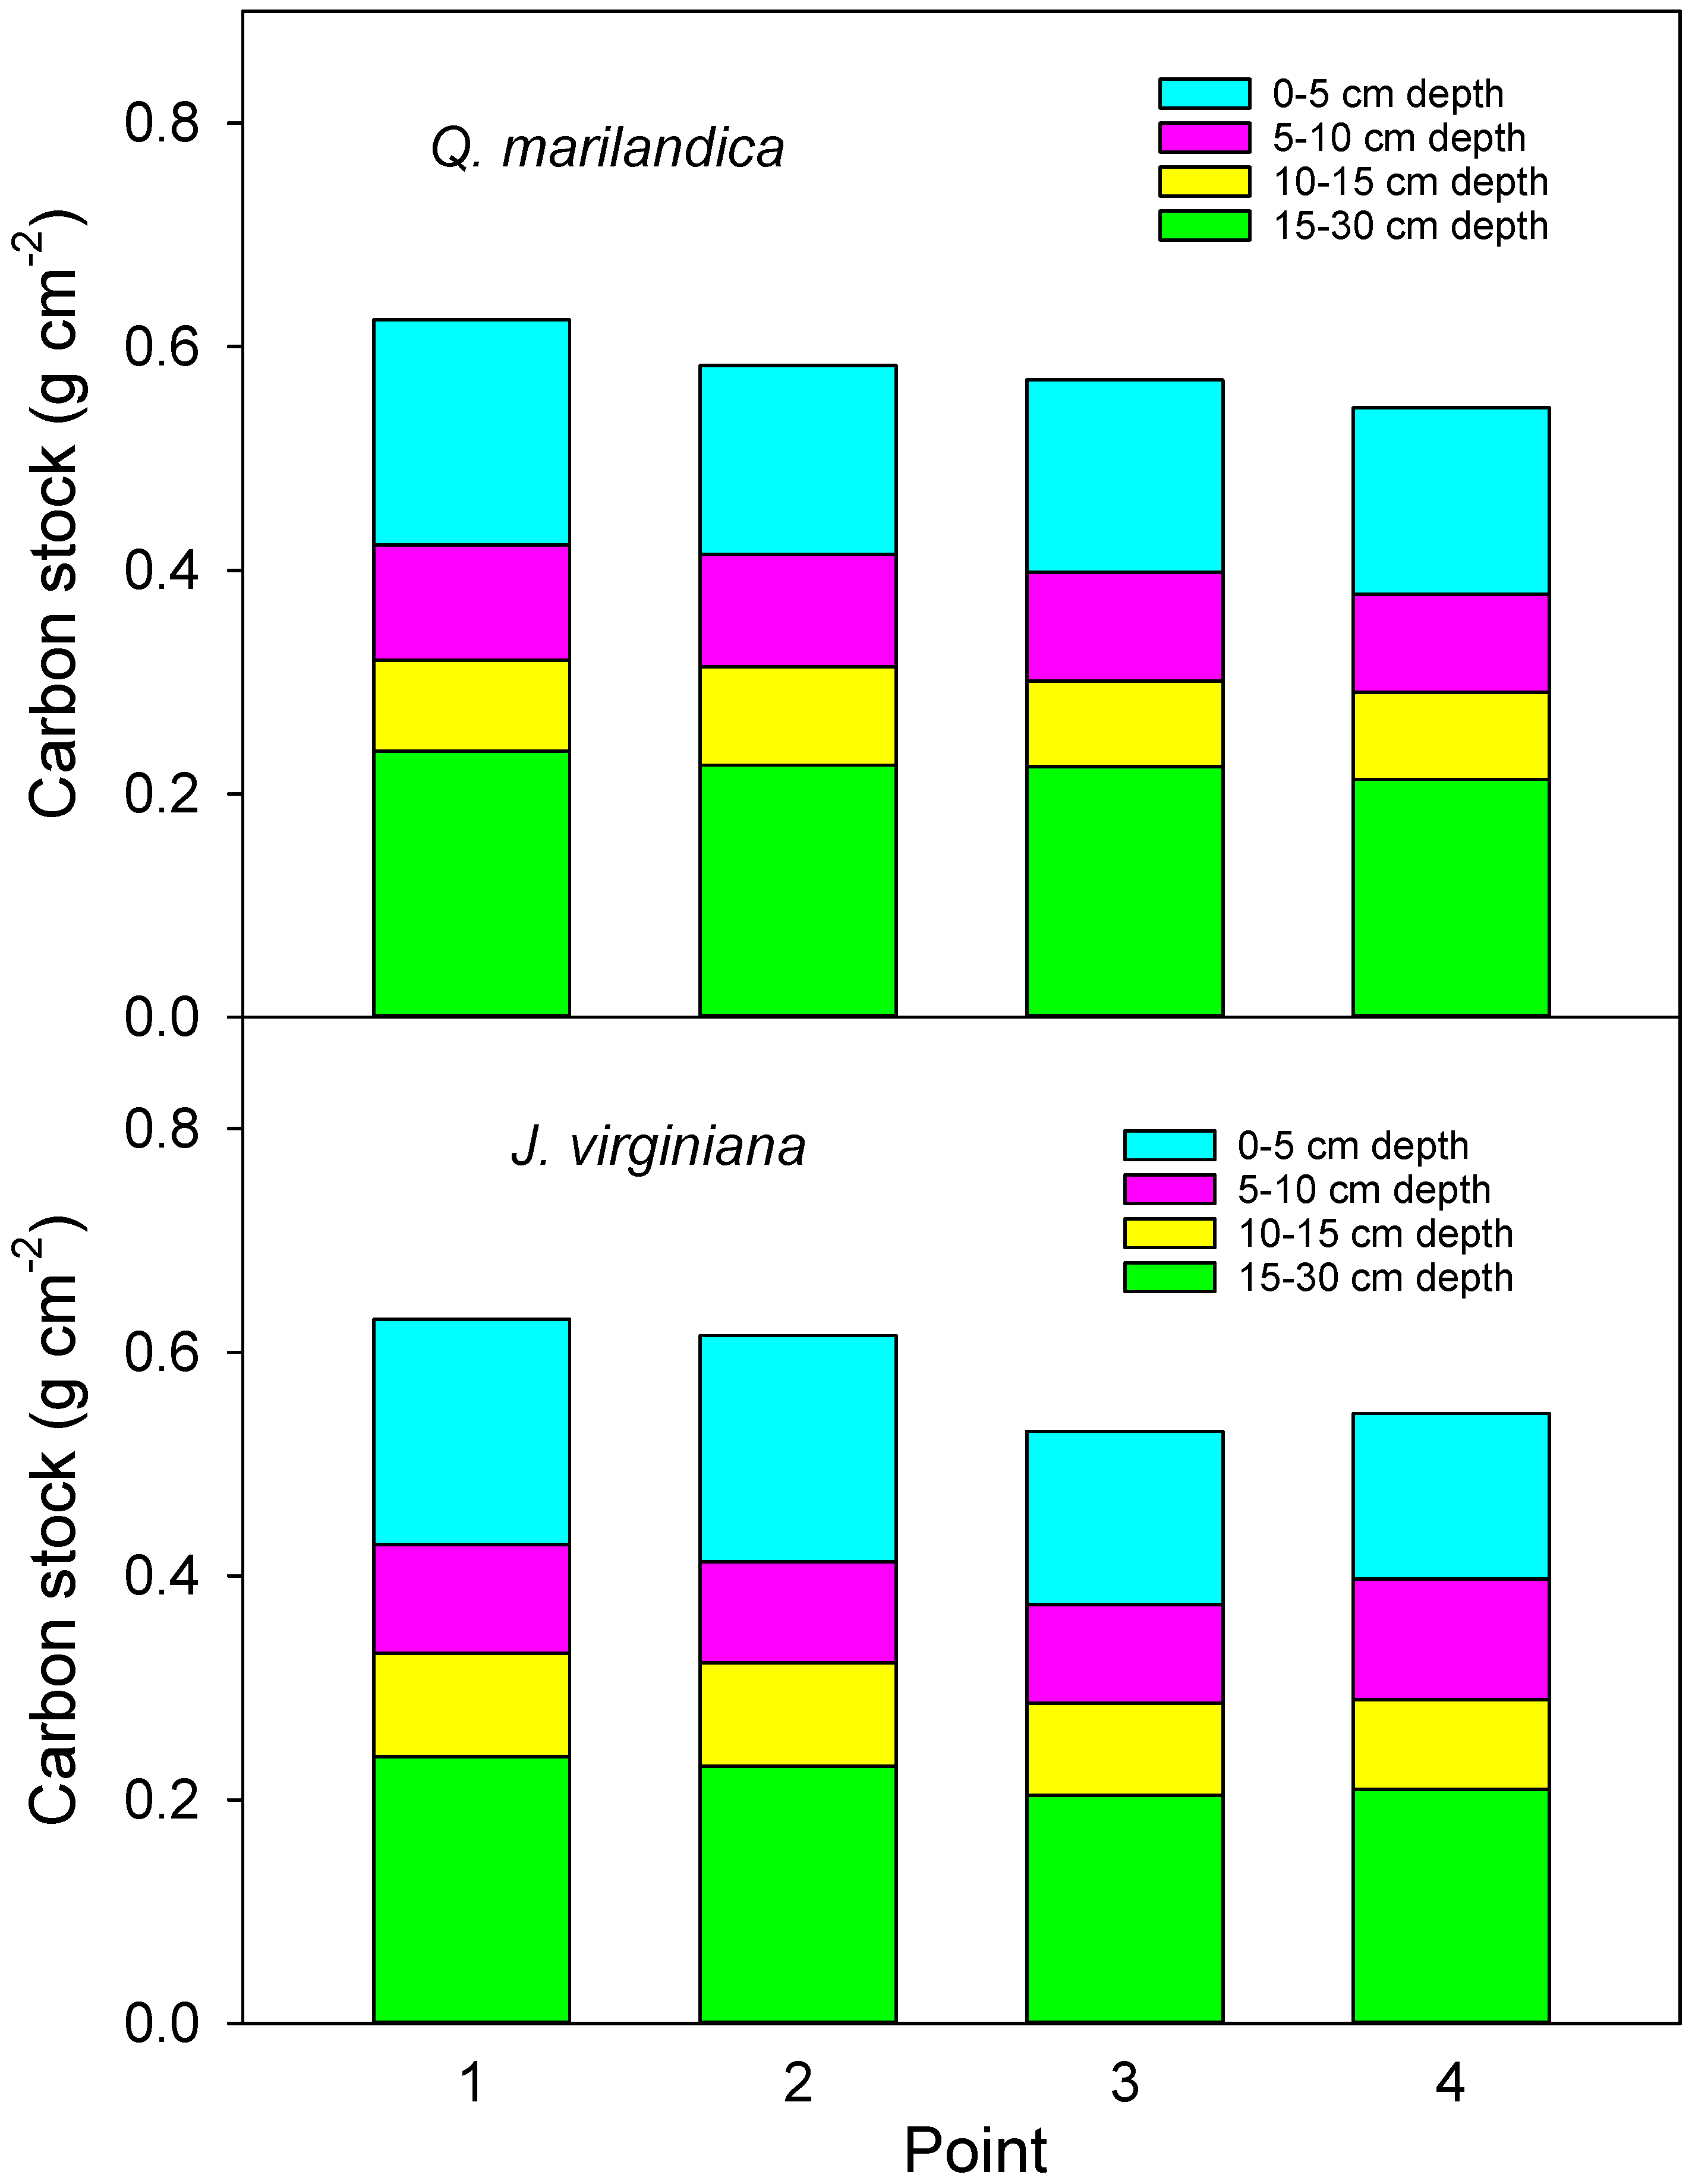
We found that soil carbon concentration and carbon stock beneath encroaching trees was greater than in the adjacent grassland areas. This is probably due to increased aboveground and belowground inputs. Aboveground litter inputs were approximately 50% greater under trees than for herbaceous annual aboveground productivity beyond the tree canopies. Root biomass was greater in the deeper soil layer under trees than beyond the tree canopy. While leaf litter decomposition was slightly slower under trees, probably due to cooler and drier soil conditions, the much faster rate of the tree foliage decomposition, as compared to grass, indicates a faster turnover and possible incorporation of recalcitrant humus into the soil. The net result was carbon stock that was 15% greater adjacent to tree stems than beyond the tree canopy drip line after approximately 40 years of tree influence.
Soil carbon beneath pasture or grasslands can be greater than under adjacent forest or tree plantations (see meta-analysis [
19]). However, the increase of soil carbon under trees encroaching into grasslands that we found is supported by previous studies, e.g., [
20,
21,
22,
23,
24]. Differences could be related to the fact that we measured the effects of encroaching trees, not the effects of forest conversion to pasture or forest plantation. Likewise, soil type, land use history, and climate could influence the direction of change. Our study site was previously farmed for cotton in the early 1900s, which likely depleted soil carbon stocks, such that we were starting from a relatively low carbon state. Our annual precipitation is near the predicted threshold whereby woody plant encroachment could either increase or decrease soil carbon [
25]. Study locations with annual precipitation greater than ours likely would lose soil carbon with woody plant encroachment.
Comparing similar studies examining
Juniperus encroachment in the USA, McKinley and Blair [
15] found increases in soil carbon similar in magnitude when comparing closed-canopy
J. virginiana woodlands adjacent to tallgrass prairie areas in Kansas, USA. In contrast, Pierce and Reich [
17] did not find significant differences in soil carbon near individual encroaching
J. virginiana trees, but only compared locations at the dripline to areas beyond the dripline. Following a similar protocol, we also would not have found differences, i.e., point 3 (at the edge of the canopy) and point 4 (beyond the canopy) were similar in our study, emphasizing the relatively fine spatial scale of soil carbon change with early stages of woody plant encroachment. Klemmedson and Tiedemann [
20] measured the spatial pattern of carbon surrounding encroaching
J. occidentalis (Hook.) trees in eastern Oregon and found larger differences in soil organic carbon than we did (30% to 100% greater near the stem than at the dripline). The reason for the greater difference could be that their study was in a more arid, lower productivity system (266 cm annual precipitation), such that the effects of trees on soil carbon were greater. Tree encroachment into arid and semiarid regions is known to produce a “fertile island” around individual trees (e.g., [
20]).
Jackson et al. [
25] found a negative relationship between mean annual precipitation and soil organic carbon change associated with woody plant encroachment in Texas, USA. Their relationship predicts a small decrease in soil carbon due to woody plant encroachment given our annual precipitation (~940 mm). The fact that we and others, e.g., [
15,
19], found increased soil carbon in the southern Great Plains associated with the encroachment of woody species indicates that the finding of Jackson et al. [
25] may not be generally applicable throughout the region and may depend on factors, such as previous land use history, the potential evapotranspiration/annual precipitation, time since encroachment, and soil type.
The increase in soil carbon stock of approximately 15% adjacent to stems was consistent for both
Q. marilandica and
J. virginiana in our study. Given spatial heterogeneity in soil carbon measurements, an increase of ~15% of soil carbon may sometimes not be statistically conclusive. For instance, Smith and Johnson [
23] found a similar ~15% increase in soil carbon under
J. virginiana forest compared to tallgrass prairie, but concluded that there was no effect based on associated variability and lack of statistical differences. While modest, the increase in soil carbon under the trees we measured, combined with much greater carbon storage in the aboveground biomass of trees [
14] results in greater carbon sequestration in forest ecosystems that develop as a result of woody plant encroachment.
The additional soil carbon we found associated with encroaching trees was likely due to greater inputs from the trees. Using the different carbon isotope signatures of the C
4 grasses and the C
3 J. virginiana, McKinley and Blair [
15] determined that an increase in soil carbon in
J. virginiana woodlands was primarily due to increased tree inputs, particularly in the upper 2 cm of the soil. Greater inputs in our study were associated with aboveground, and likely belowground, sources as well.
Total aboveground litter input was greater under trees than in grasslands (assuming herbaceous ANPP is equivalent to aboveground litter inputs in non-burned prairie). When converted to a g m
−2 year
−1 basis, litter inputs directly beneath the trees was approximately 700 g m
−2 year
−1 and herbaceous productivity beyond the canopy was approximately 400 g m
−2 year
−1 on average (no fire or grazing). Results for
J. virginiana corroborate Norris et al. [
13], who found an annual litter production of 500 g m
−2 year
−1 for
J. virginiana woodlands and 52 g m
−2 year
−1 for a grassland in Kansas, USA. Acorns were the primary source of aboveground inputs for
Q. marilandica. The greater biomass of acorns than leaves contradicts Lang [
26], who found that leaf biomass was the major component of litter fall in a closed-canopy, mixed-oak forest in New Jersey, USA. Given that we measured acorn production for just one year and because oaks are known to exhibit high annual variability in acorn production, we do not know whether our results are typical. One explanation for the relatively low leaf litter collection is that single oak trees encroaching into grasslands are exposed to high winds, which blow leaves away from the tree and undoubtedly reduced the litter input near trees in our study. In contrast, leaf litter of
J. virginiana is smaller and has a needle/scale-like leaf morphology, which reduces its potential for wind driven off-site movement.
Coarse root biomass is predominantly from trees, while fine root biomass is produced by both herbaceous vegetation and trees. Not surprisingly, therefore, coarse root biomass was greater under the tree canopy when compared to the point beyond the tree dripline. Moreover, the majority of coarse root biomass was distributed in the 10 to 30 cm soil depth. These results agree with Ansley et al. [
27], who also observed greater coarse root biomass in deeper soil profiles associated with
Prosopis glandulosa Torr. in Texas, USA. On the other hand, fine root biomass was concentrated in the upper 10 cm of soil. The increase in fine root biomass in the upper soil layer with distance from trees was probably due to the co-occurrence of grass and tree fine roots beyond the dripline and the fact that grasslands often have greater standing root biomass than forests [
28,
29].
In the context of carbon inputs to soil, root turnover, rather than standing root biomass, is probably more important. While some studies found faster root turnover in grasslands than forests, (e.g., [
28,
29]), a robust meta-analysis looking at patterns of fine root turnover found that tree fine roots typically have faster turnover rates than fine roots in grassland systems in temperate regions, especially when restricting tree fine roots to a <2 mm diameter [
30]. The faster turnover rate of tree roots may have increased fine root inputs near the trees even though there was greater standing fine root biomass beyond the canopy. In an area with similar conditions to ours in Wisconsin, USA, Reich et al. [
18] found greater fine root biomass in grass-dominated areas when compared to tree-dominated areas. The authors attributed the greater fine root biomass under grass-dominated areas to slower fine root turnover, not greater belowground net primary production. We did not measure root exudates, mycorrhizal biomass, or other non-root carbon inputs, which also affect soil carbon.
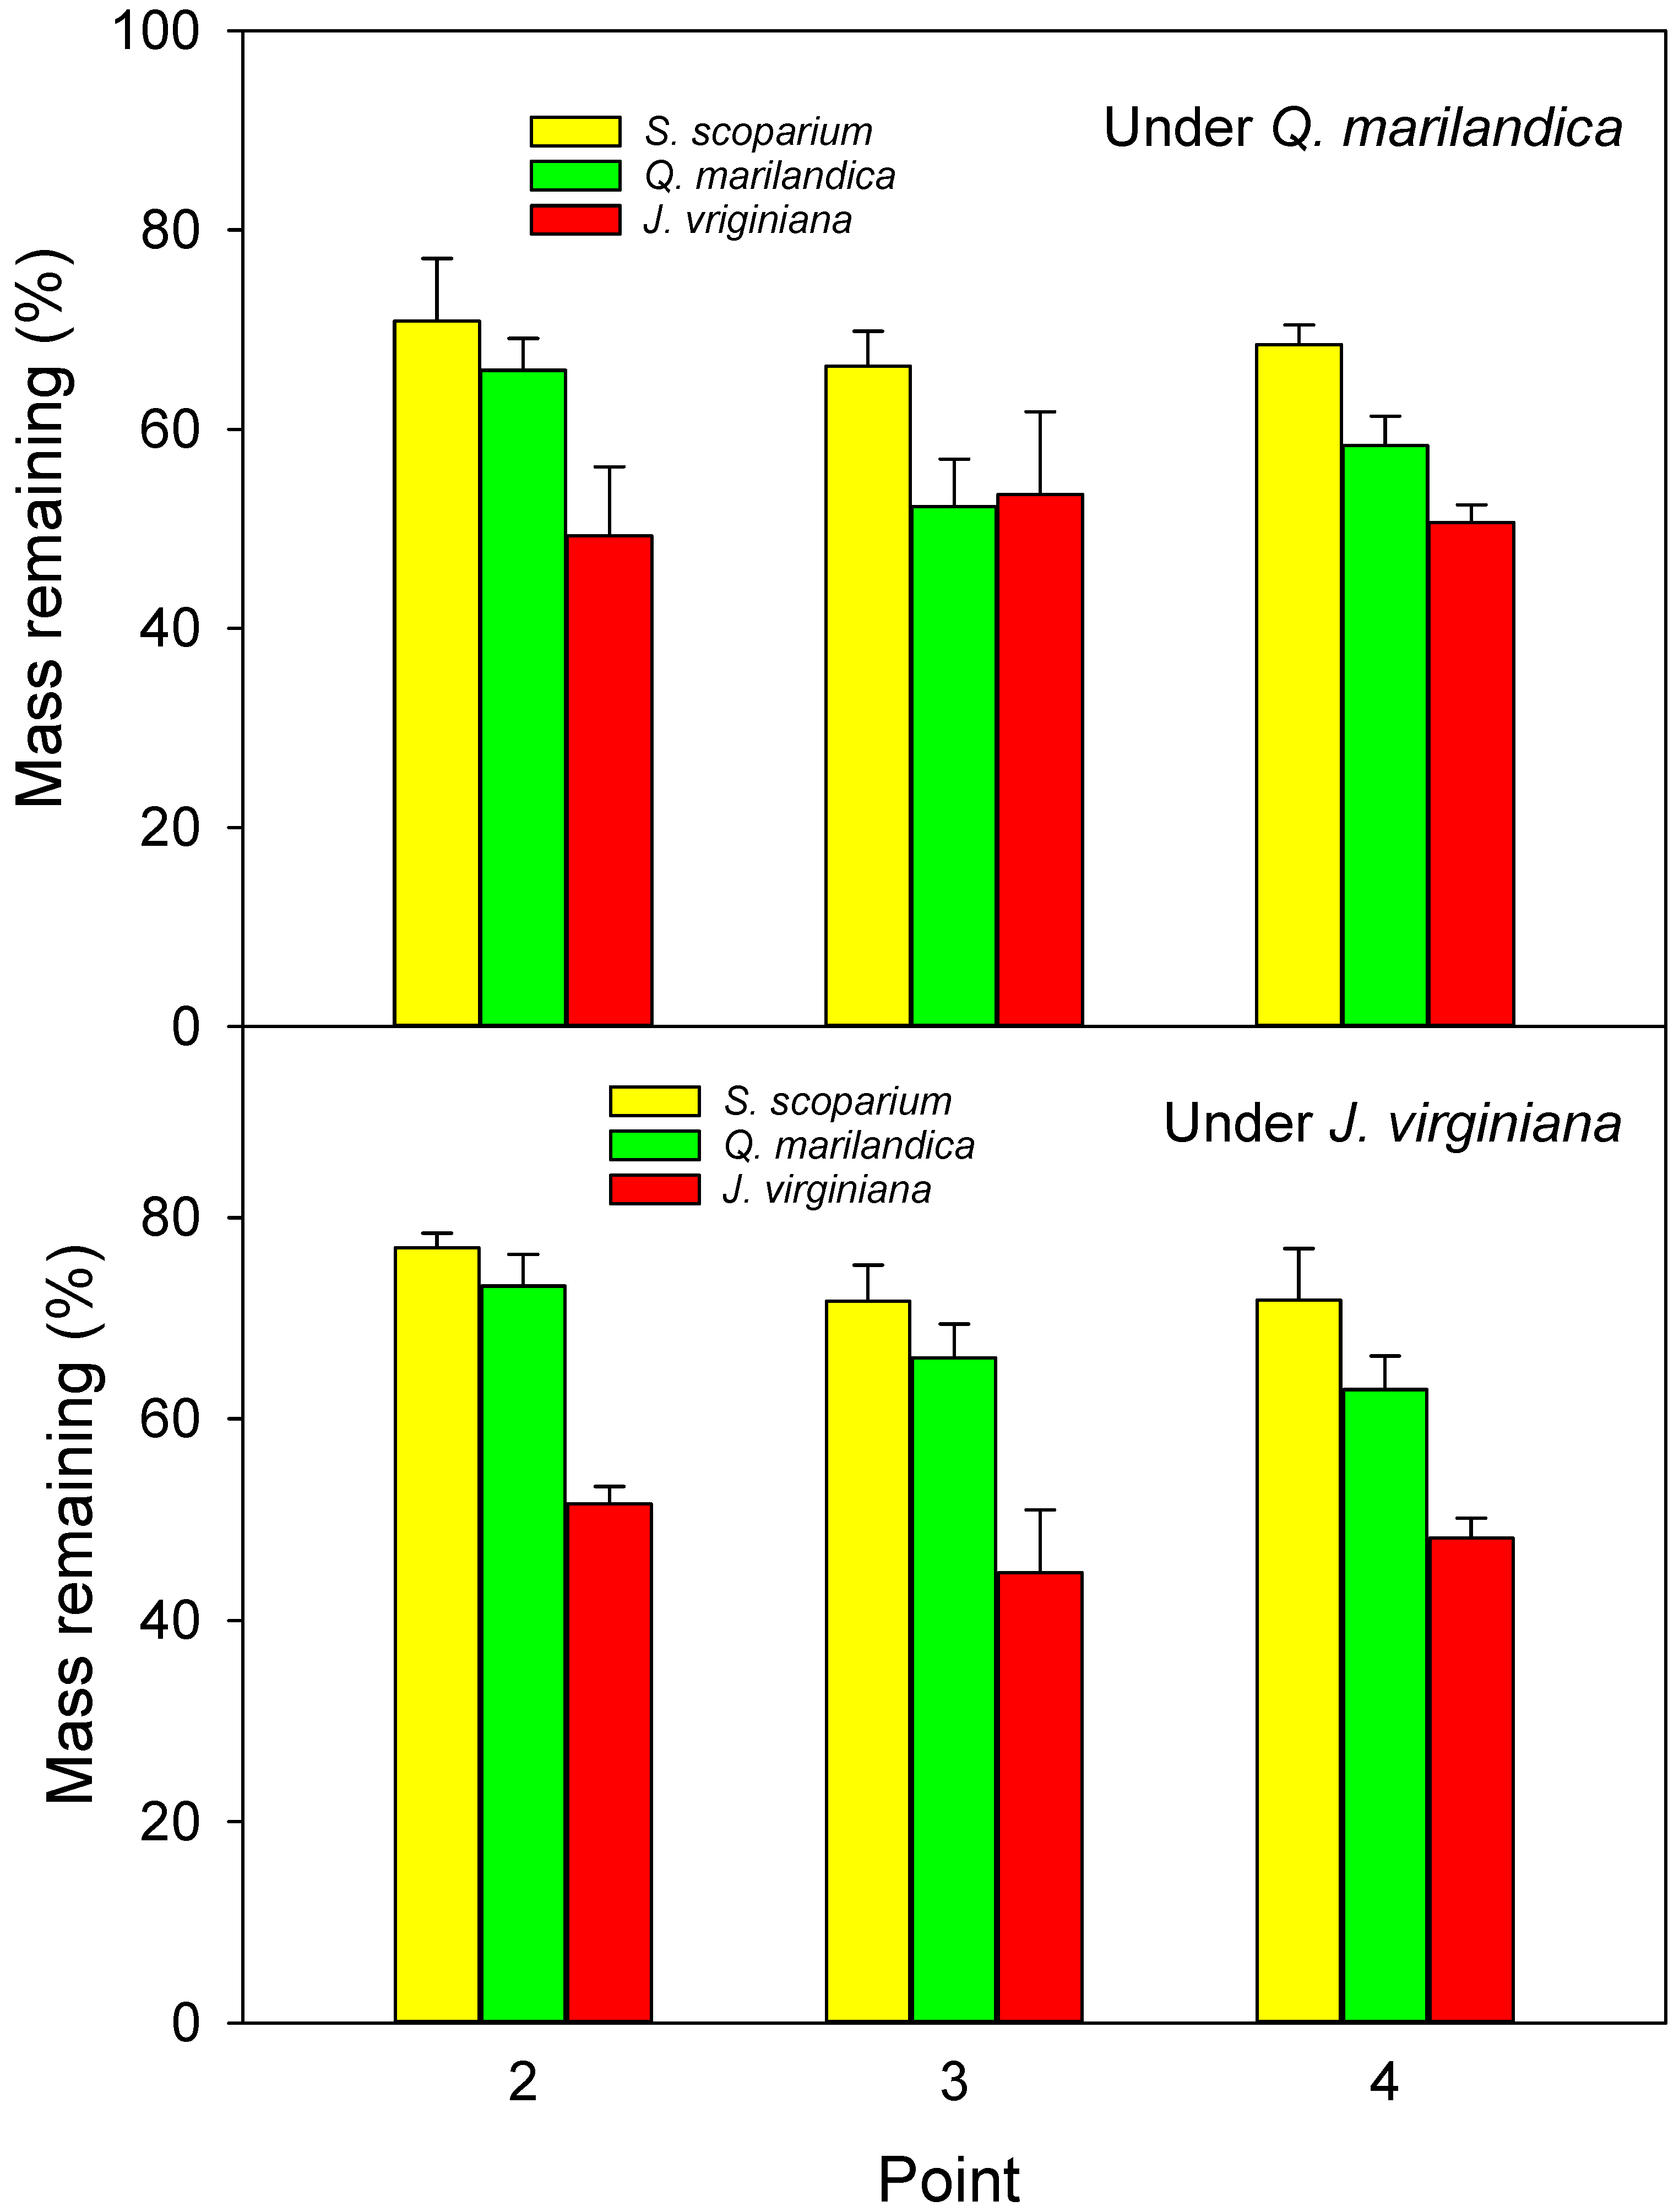
The rate of leaf litter decomposition was marginally slower under the trees than in the adjacent grass-dominated areas (64.5% vs. 60.3% remaining after 12 months), which agrees with previous studies, e.g., [
13,
31]. This was probably due to the cooler and drier conditions under the canopies. However, we did not specifically measure the moisture content of the litter, which could be more responsive to atmospheric vapor pressure deficit, which may have been lower under the tree canopies due to cooler conditions and higher humidity. Litter decomposition rate is often related to temperature [
13,
32,
33,
34]. Lower temperatures under the tree canopies was due to shading as photosynthetically active radiation under the canopies was approximately 15% of that in the open (data not shown). In addition to temperature, mean annual precipitation is related to litter decomposition, with precipitation increasing in importance for desert or semi-arid regions [
35,
36]. The reduction in soil moisture under tree canopies in our study was probably due in part to greater canopy and litter interception of incoming precipitation. Tree canopy and litter interception of precipitation are greater than for grasslands at other semiarid and subhumid sites [
37,
38,
39,
40], resulting in reduced soil moisture beneath tree canopies. In addition, transpiration of trees can be greater than for prairie vegetation [
10]. Caterina et al. [
11] found that
J. virginiana trees could transpire all the rainfall that reaches the soil at a location near the current study. Acorn inputs were the largest contributor under the oak trees and potentially play an important role in carbon cycling. However, we did not measure the rate of acorn decomposition and their ultimate importance is unknown and influenced by annual variation in production and the extent of acorn herbivory by animals.
In addition to environmental conditions, litter quality has a large effect on decomposition. In our study, decomposition of litter from tree species was greater than for grass (42% difference between
J. virginiana and
S. scoparium; 7% difference between
Q. marilandica and
S. scoparium). Similarly, Gholz et al. [
41] found faster decay rates for tree litter than grass litter. However, those results contrast with Norris et al. [
13], who found a faster decomposition for
S. scoparium than for
J. virginiana. The authors attributed the lower decay rates of
J. virginiana leaf litter in their study to greater lignin content. In addition to lignin, other factors influence the rate of litter decomposition, including C:N, phenolics, and other secondary compounds (we did not measure).
Greater annual inputs under tree canopies translated into greater accumulations of litter and duff on the soil surface even though the tree-derived litter decomposed more quickly. We found values of approximately 2200 g m
−2 under trees and approximately 500 g m
−2 beyond the trees (non-burned and non-grazed). These results agree with Norris et al. [
13], who found a mass of litter layer (Oi and Oa horizon) of 2628 g m
−2 under
J. virginiana forests. Along with lower light availability, the greater duff/litter layer under the trees probably contributed to the reduced herbaceous productivity under the trees [
42,
43,
44].
While beyond the scope of this study, the next step for this research is scaling results to the landscape based on aerial images or stand-level sampling. To provide an value to permit scaling, we estimated the carbon increase associated with an individual tree by weighting carbon content at each point by the area represented by each point. Doing so resulted in an increase in soil carbon of 4.6% under a tree of average size in our study. To calculate this, we used an average canopy spread of 9 m and applied the average carbon stock at each point to either an inner circle with a radius of 1.125 m (point 1) or concentric rings with an area spanning between radii of 1.125 and 3.375 m (point 2) and radii between 3.374 and 5.625 m (point 3). The result was 56.9 kg m−2 carbon under the tree’s influence as compared to 54.4 kg m−2 measured beyond the tree. Because the areas under the outer portion of the canopy (point 3) had lower carbon stock than points 1 and 2, but the largest area, this mutes the impact somewhat. However, the effects will continue to get larger with the length of time and canopy expansion. For trees of similar species and sizes, this value could be used to estimate stand-level changes based on the percent aerial coverage, up to the point where tree density reaches a point where tree influences overlap.


