1. Introduction
The natural range of the black alder (
Alnus glutinosa (L.) Gaertn.) extends through most of Europe, from central Scandinavia to the southern coast of the Mediterranean Sea [
1,
2]. In Poland, the black alder is widespread in the lowlands, especially in the northern and central parts of the country; in the south it is less common and generally does not occur above 500 m above sea level [
3]. The black alder is an economically important species in Poland, covering 522,000 ha (5.7%) with a growing stock estimated at 137 million m
3 (263 m
3·ha
−1), which accounts for 5.3% of the country’s overall growing stock [
4]. In wet soils with high groundwater levels, it mostly forms pure, even-aged, one-storey stands. On mesic sites, in mixed deciduous forests, the black alder may be used as a valuable admixture for improving timber production or for biocenotic considerations. Due to its robust root system and symbiosis with bacteria of genus
Frankia, which produce nitrogen-fixing nodules on fine roots, it actively transforms its habitats [
3]. In addition, as a result of open mineral metabolism, black alder leaf fall contributes 30–130 kg·ha
−1·year
−1 of nitrogen to the soil [
1], and increases the availability of phosphorus, magnesium, manganese, and zinc [
1]. These ecological properties of the black alder make it suitable for reclamation of post-industrial sites [
5,
6]. In addition to providing valuable timber, black alder stands for unique niches, offering habitats to riverine and riparian flora and fauna.
The implementation of economic and non-economic forest functions requires efficient forest management planning that provides reliable and detailed information about forest resources. The optimum level of detail required for economic decision-making includes data about the distribution of stand characteristics by tree-size classes [
7]. Diameter distribution defined as the number of trees within a certain diameter range at breast height (DBH) [
8,
9], is crucial for the determination of stand volume and value [
8], biodiversity [
10], stability [
11], development stage [
12], and for predicting growth dynamics [
13].
Accurate determination of diameter distribution entails substantial costs associated with measuring DBH for a large number of trees while conducting an inventory [
14,
15]. In practice, in order to reduce survey costs, only selected stand features are measured; these include quadratic mean diameter (
QMD), mean tree height, basal area (BA), etc. Diameter distribution models can be used to estimate the number of trees falling into different DBH classes. The application of diameter distribution models in conjunction with stand characteristics generates results convergent with actual DBH measurements [
16].
Diameter distribution modeling may also improve the utility of existing growth models. While complex individual tree-level models, which account for interactions between trees and their environment, accurately describe tree growth processes, they are impracticable due to the prohibitive costs of acquiring the necessary input data [
17]. Diameter distribution models can be used with individual tree-level or taper models and can minimize the measurement work needed for their implementation [
16,
17,
18]. The combination of diameter distribution models and individual tree-level or stand models gives rise to an integrated system that not only enhances the accuracy of stand characteristics assessment, but also ensures a convergence of estimates made at different levels of prediction [
19].
Diameter distribution models are typically constructed using various theoretical distributions, including normal [
20,
21], log-normal [
20,
21], double normal [
21,
22], Weibull [
8,
23,
24,
25,
26,
27,
28,
29,
30,
31], Johnson S
B [
32,
33,
34,
35], and beta [
16,
18]. From among the above, the Weibull function is most often used for modeling unimodal diameter distributions, as it has a simple form of the cumulative function [
7,
8,
36] and due to its flexibility in fitting distributions of various shapes and degrees of skewness and ease of parameter estimation. The parameters of the probability density function may be estimated using two methods—the parameter prediction method (PPM), in which they are predicted directly from stand characteristics, and the parameter recovery method (PRM), in which they are computed from the moments or percentiles of diameter distribution predicted from stand characteristics [
37].
An alternative approach to the widely used parametric distributions is the percentile-based method, in which diameter distribution is defined by 12 percentiles estimated directly from stand characteristics [
38]. The method has been applied in practice by Siipilehto [
39], Kangas and Maltamo [
40,
41], Mehtätalo [
14], Stankova and Diéguez-Aranda [
42], and Stankova and Zlatanov [
43], and has been deemed appropriate for describing multimodal distributions and those with irregular probability density functions [
38,
43].
The objective of the study was to develop a diameter distribution model for black alder stands using a two-parameter Weibull function and a non-parametric percentile-based approach. The predictive power of the resulting models was evaluated using a random sample of stands from the western part of the Sandomierz Basin in southeastern Poland.
4. Discussion
The study led to the development of two diameter distribution models, which in conjunction with the previously proposed generalized height-diameter model for black alder [
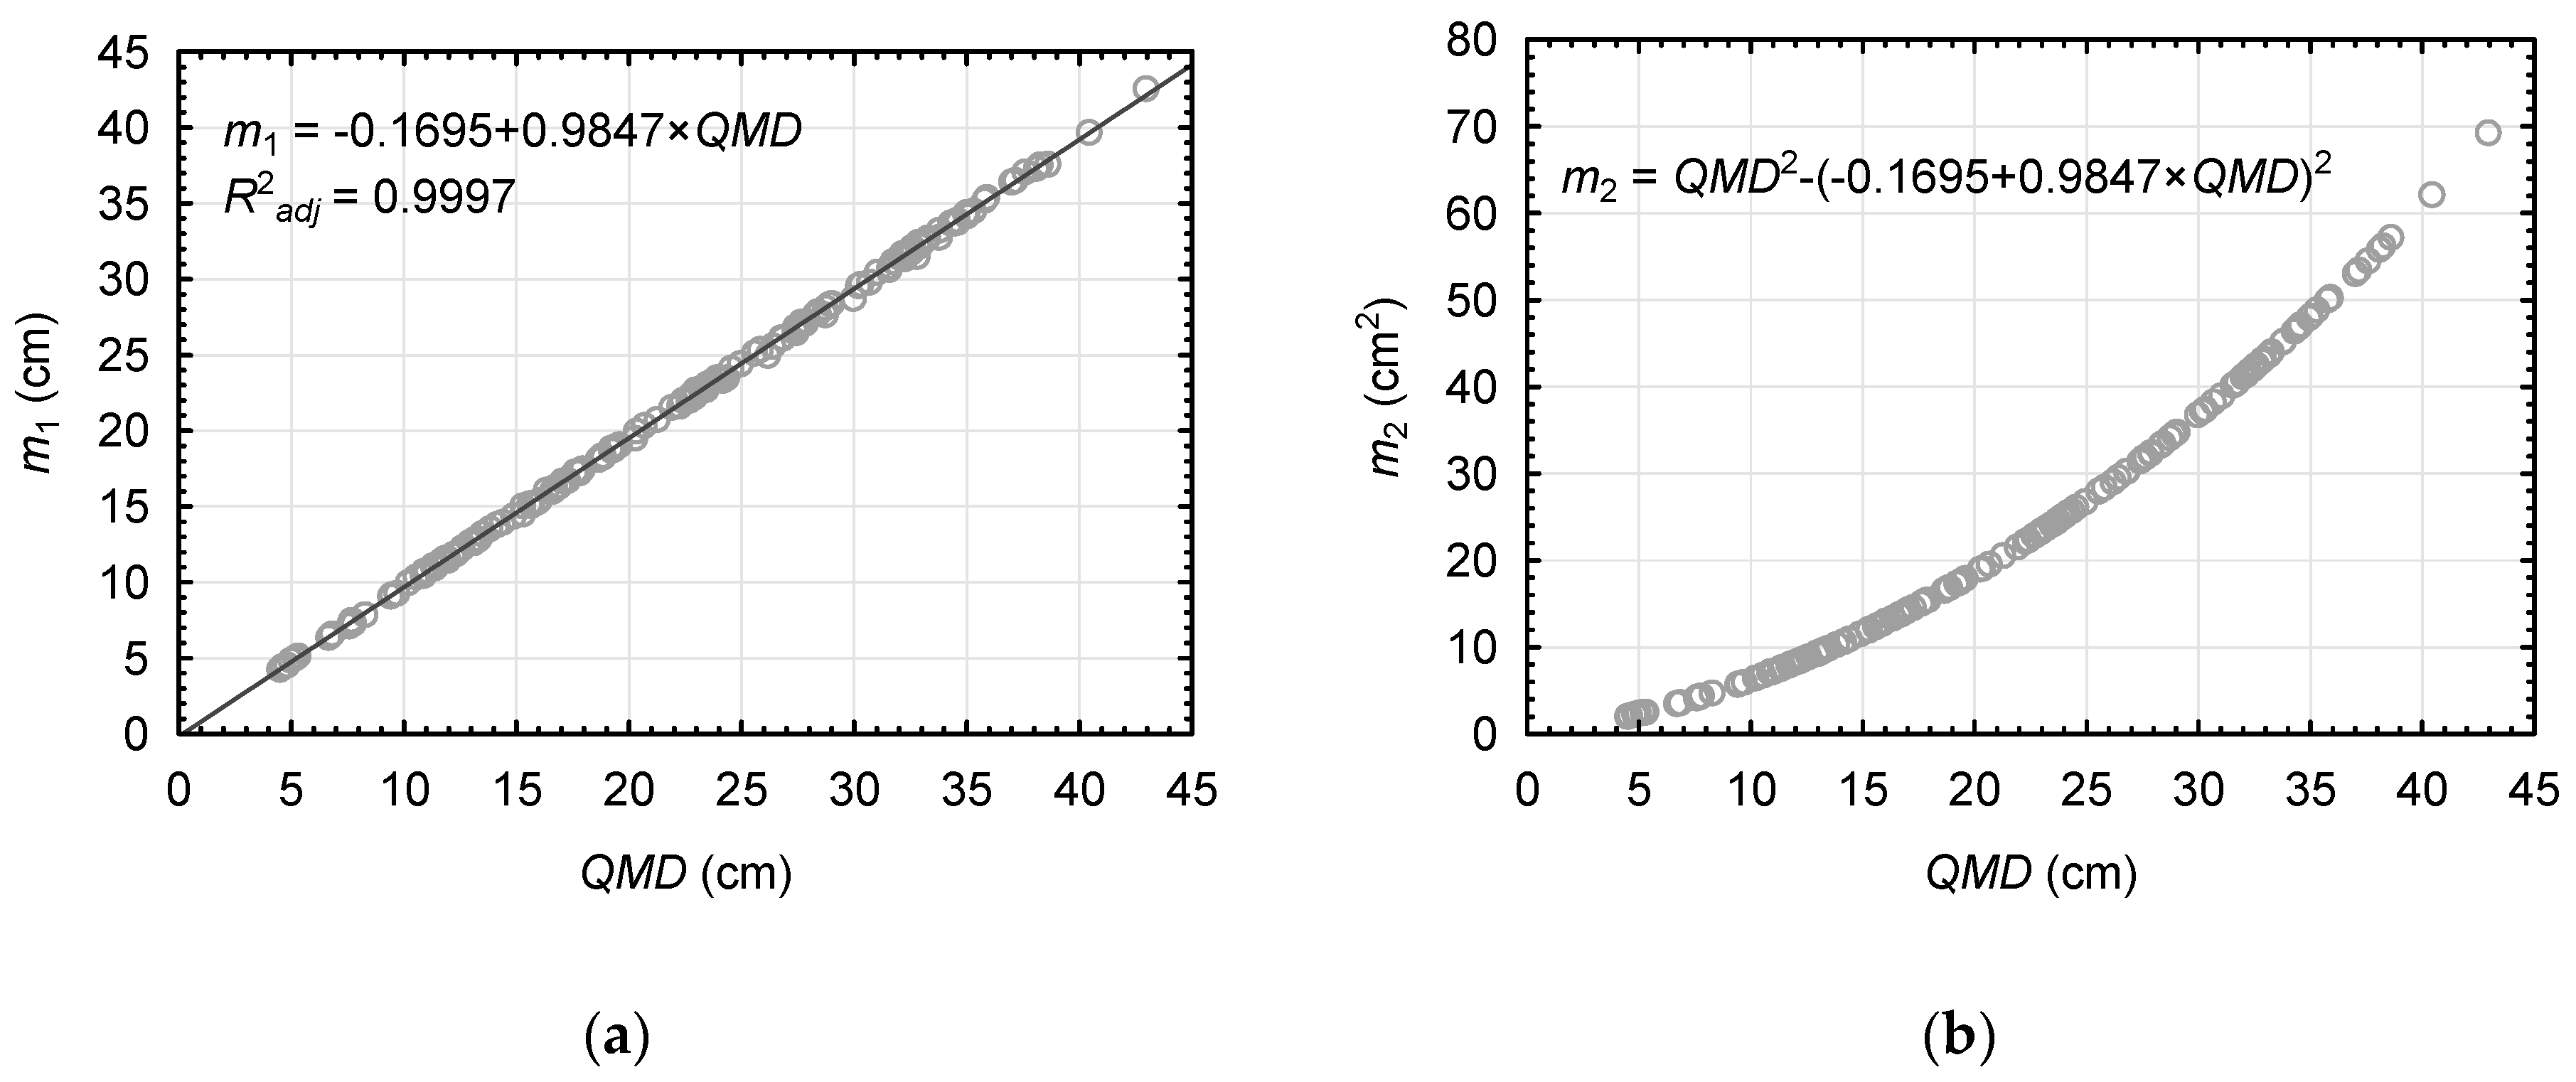
55] may serve as a useful tool supporting the management of alder stands. In the earlier models, the frequency of trees in the various DBH classes is predicted only from the
QMD, which is a commonly used measure in forestry [
56]. Borders and Patterson [
26] emphasize that parsimony is a desirable feature of empirical models. A similar view is expressed by the authors, the more so as the constructed models of diameter distribution will be used mainly for practical applications rather than in scientific research. That is why, a simpler two-parameter form of the Weibull distribution was applied, especially, as it often gives better results as compared to the three-parameter form [
18], and excludes the problem associated with the risk of obtaining a negative scale parameter as stated by Lei [
57], and also by the present authors in a previous paper [
21]. To prevent a negative value for this parameter, it is often arbitrarily fixed as half of the smallest DBH in a given stand [
19,
28,
30,
58,
59]. On the other hand, the act of adopting an arbitrary value for a parameter describing the PDF remains controversial and theoretically unjustified.
The other approach to modeling diameter distributions was the non-parametric percentile-based method [
38], in which it is not necessary to adopt a priori any theoretical function form, and so it can be used for modeling distributions of any shape. Maltamo et al. [
18] pointed out, that there are no mathematical, and especially, no biological grounds for assuming any theoretical distribution for tree diameters. Furthermore, according to Zhang et al. [
51] and Palahí et al. [
16], the final evaluation of a given density function often depends on the applied method of estimation of its coefficient. In the case of the method proposed by Borders et al. [
38], some objections may be raised as to the selection of a given number of percentiles and the assumption as to the existence of a relationship between percentile values and stand characteristic(s). Thus, for the sake of parsimony, the present study adopted 12 percentiles describing the distribution function, but without the application of a driver percentile, especially as Stankova and Zlatanov [
43] reported that the simplified method was more accurate.
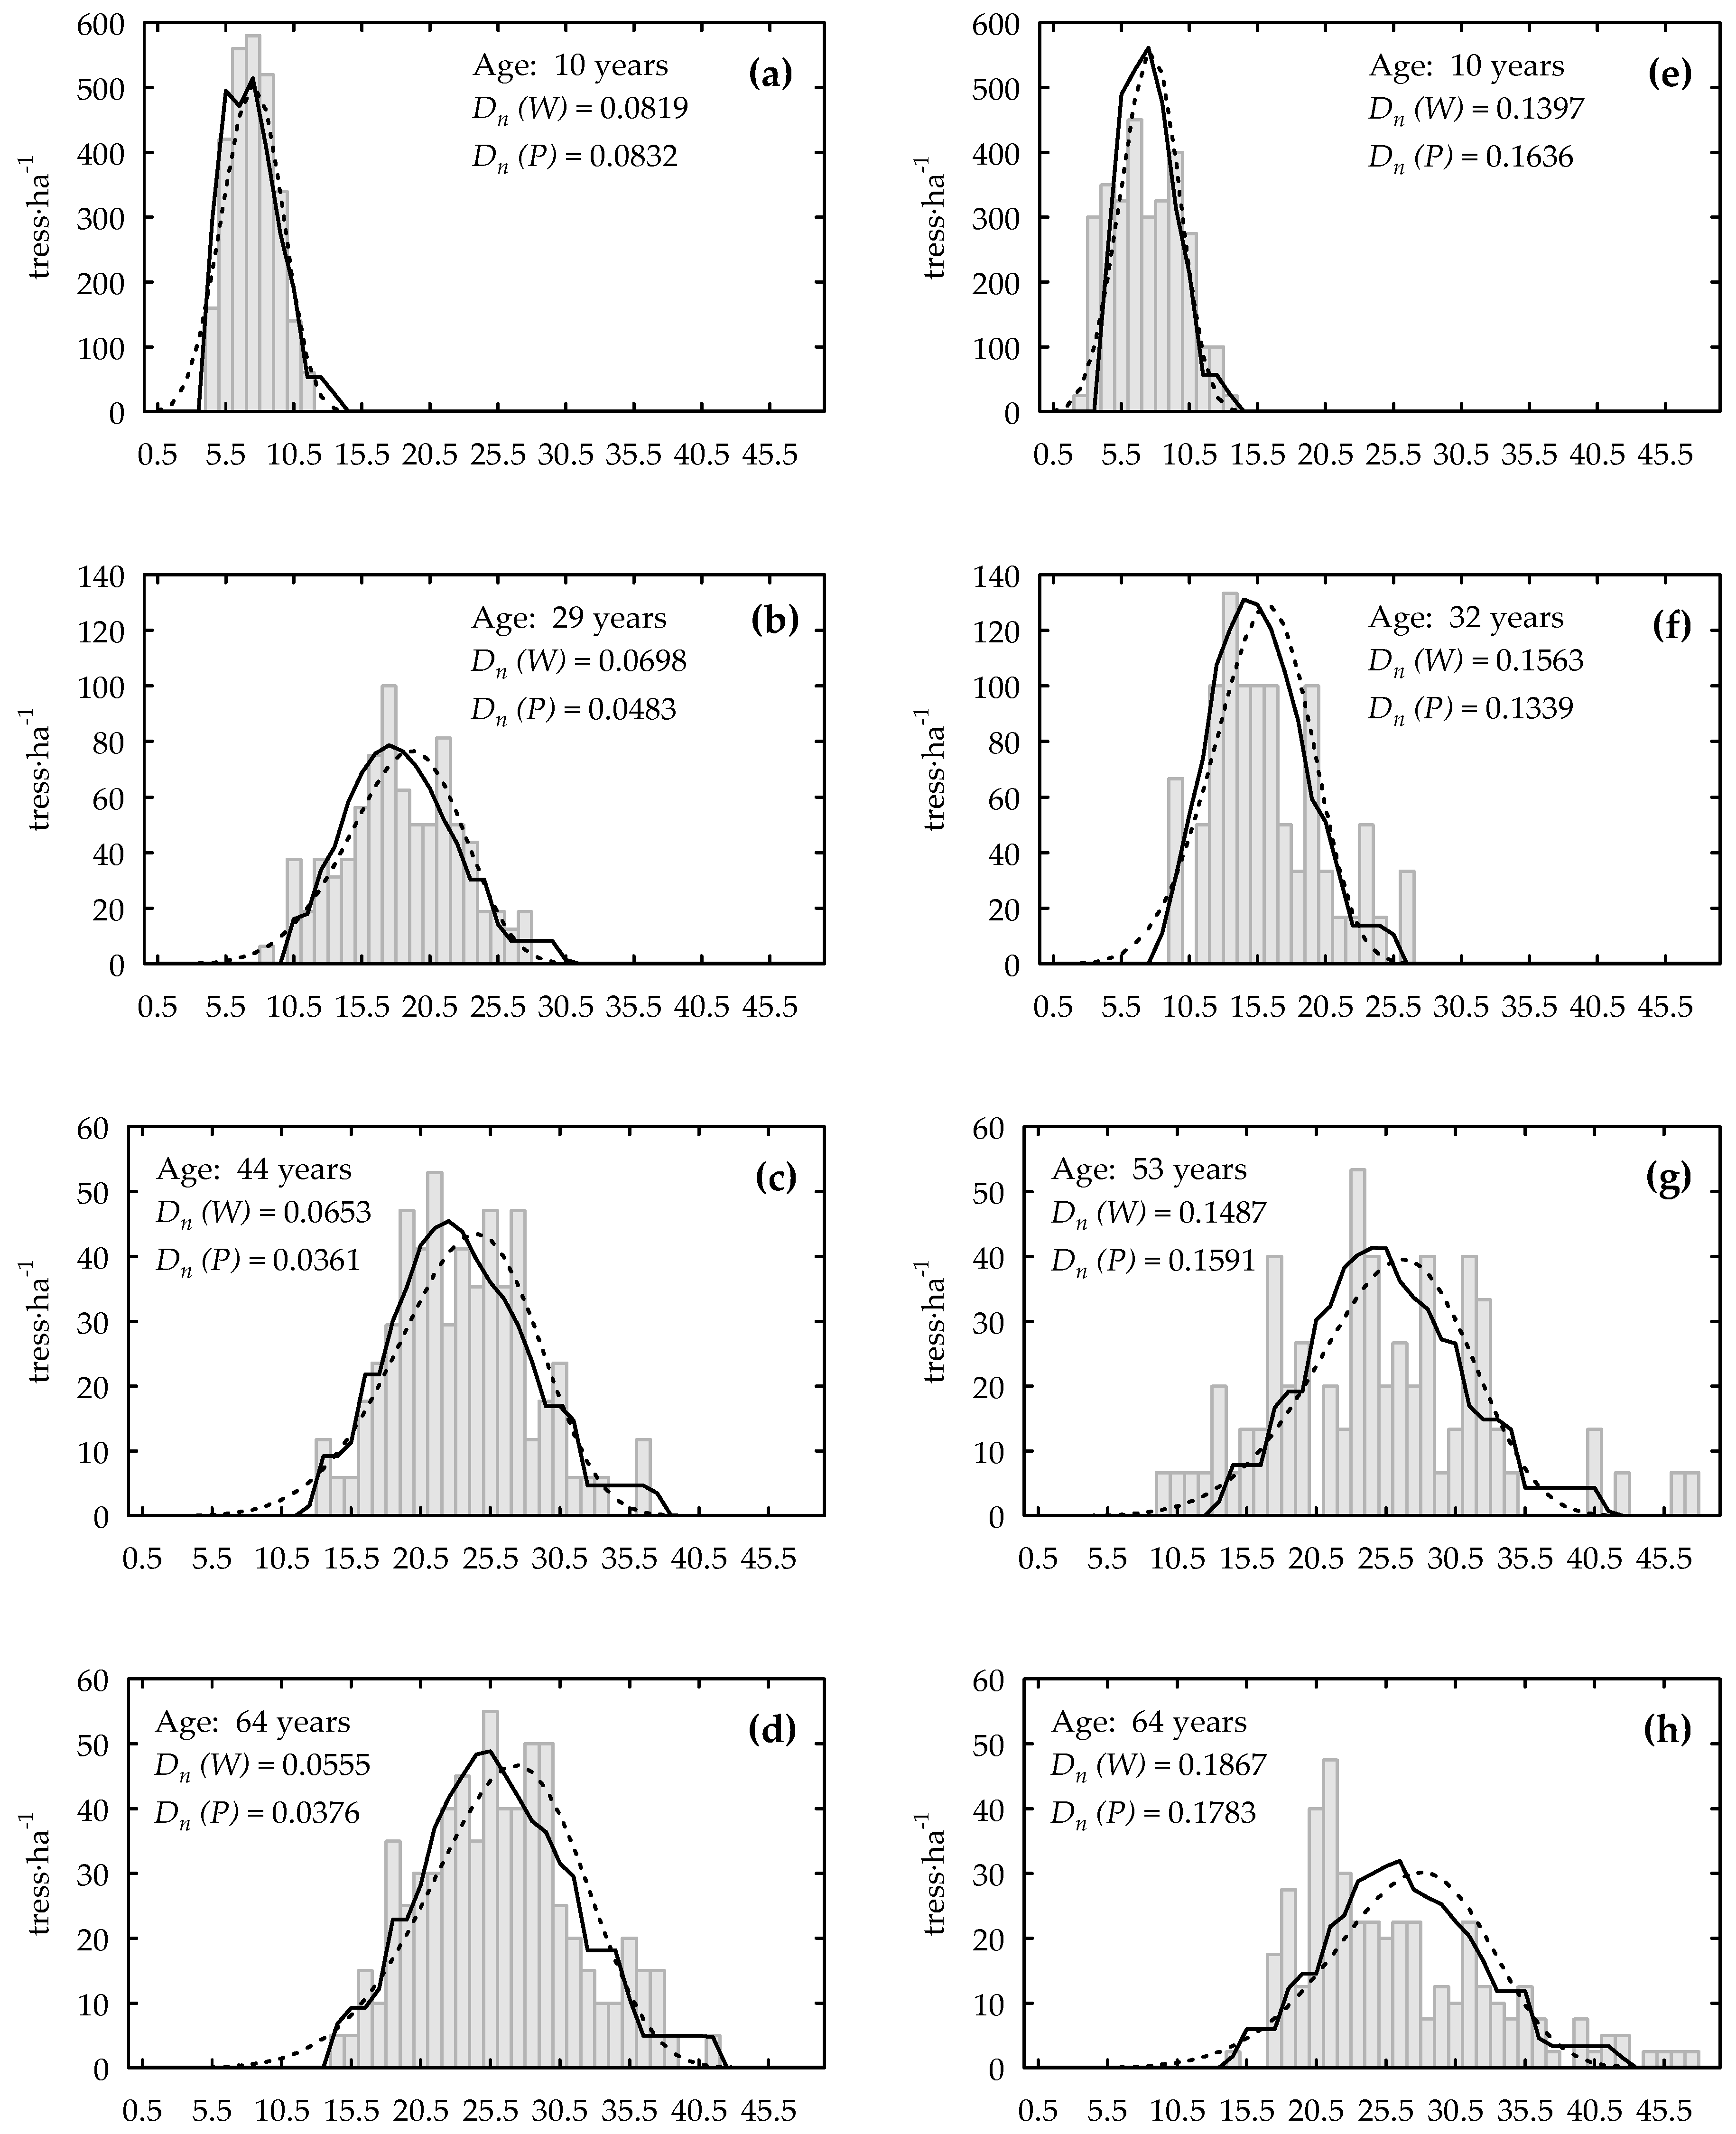
The main challenge in constructing diameter distribution models for a stand, group of stands, or another set of trees is to obtain the best possible approximation of their observed distributions using the basic stand characteristics available from inventory data. The developed percentile model accurately predicted diameter distributions in 88.4% of black alder stands as compared to 81.9% for the Weibull model (Kolmogorov–Smirnov test). Similar models developed for black pine plantations in Bulgaria led to 97% and 98% agreement for the percentile and Weibull models, respectively, but it should be noted that those results were obtained with the teaching dataset, for which the models were constructed [
43]. A comparison of the proposed models using other statistics evaluating goodness-of-fit to empirical distributions indicated that the non-parametric percentile model was superior to the parametric Weibull model, especially in stands older than 20 years. In the youngest stands, the two models were accurate only in 57% of the cases and did not differ significantly with respect to goodness-of-fit. These findings differ from the models developed by Stankova and Zlatanov [
43] for Austrian black pine plantations, where the two-parameter Weibull distribution was markedly better than the percentile model, especially in the youngest stands. The two-parameter Weibull distribution was similarly effective in characterizing DBH for young stands in a study by Bullock and Burkhart [
60].
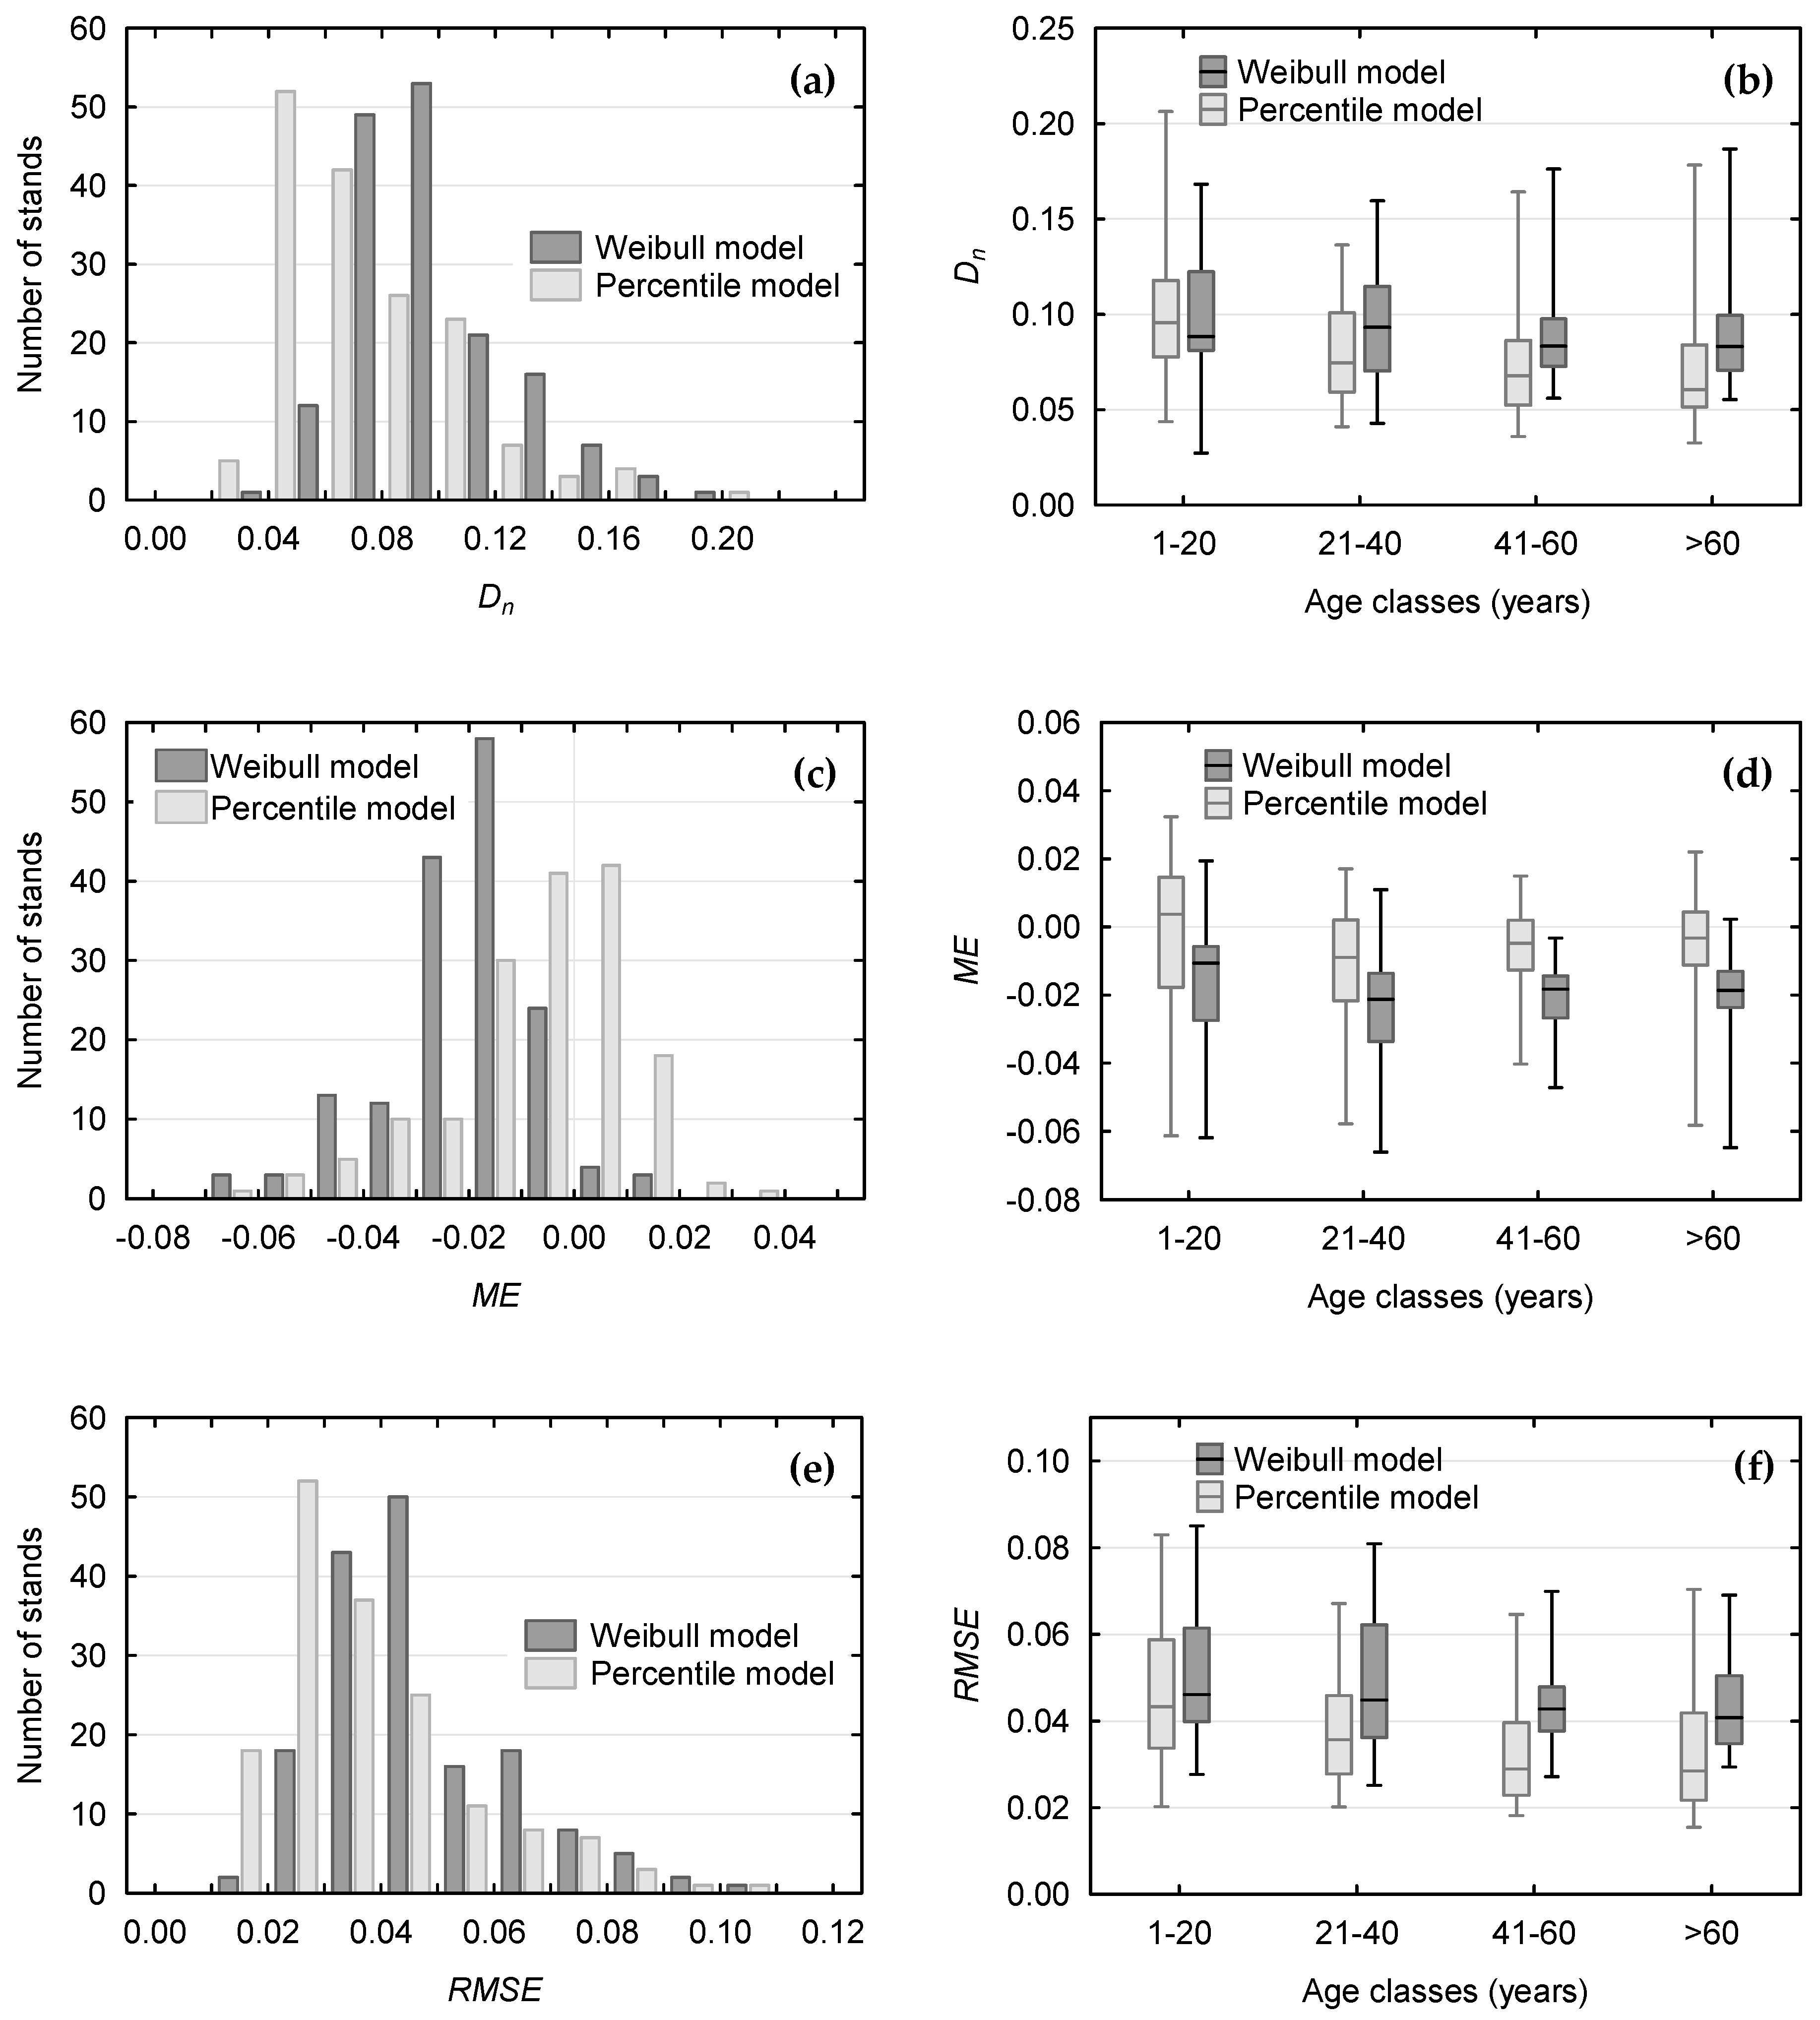
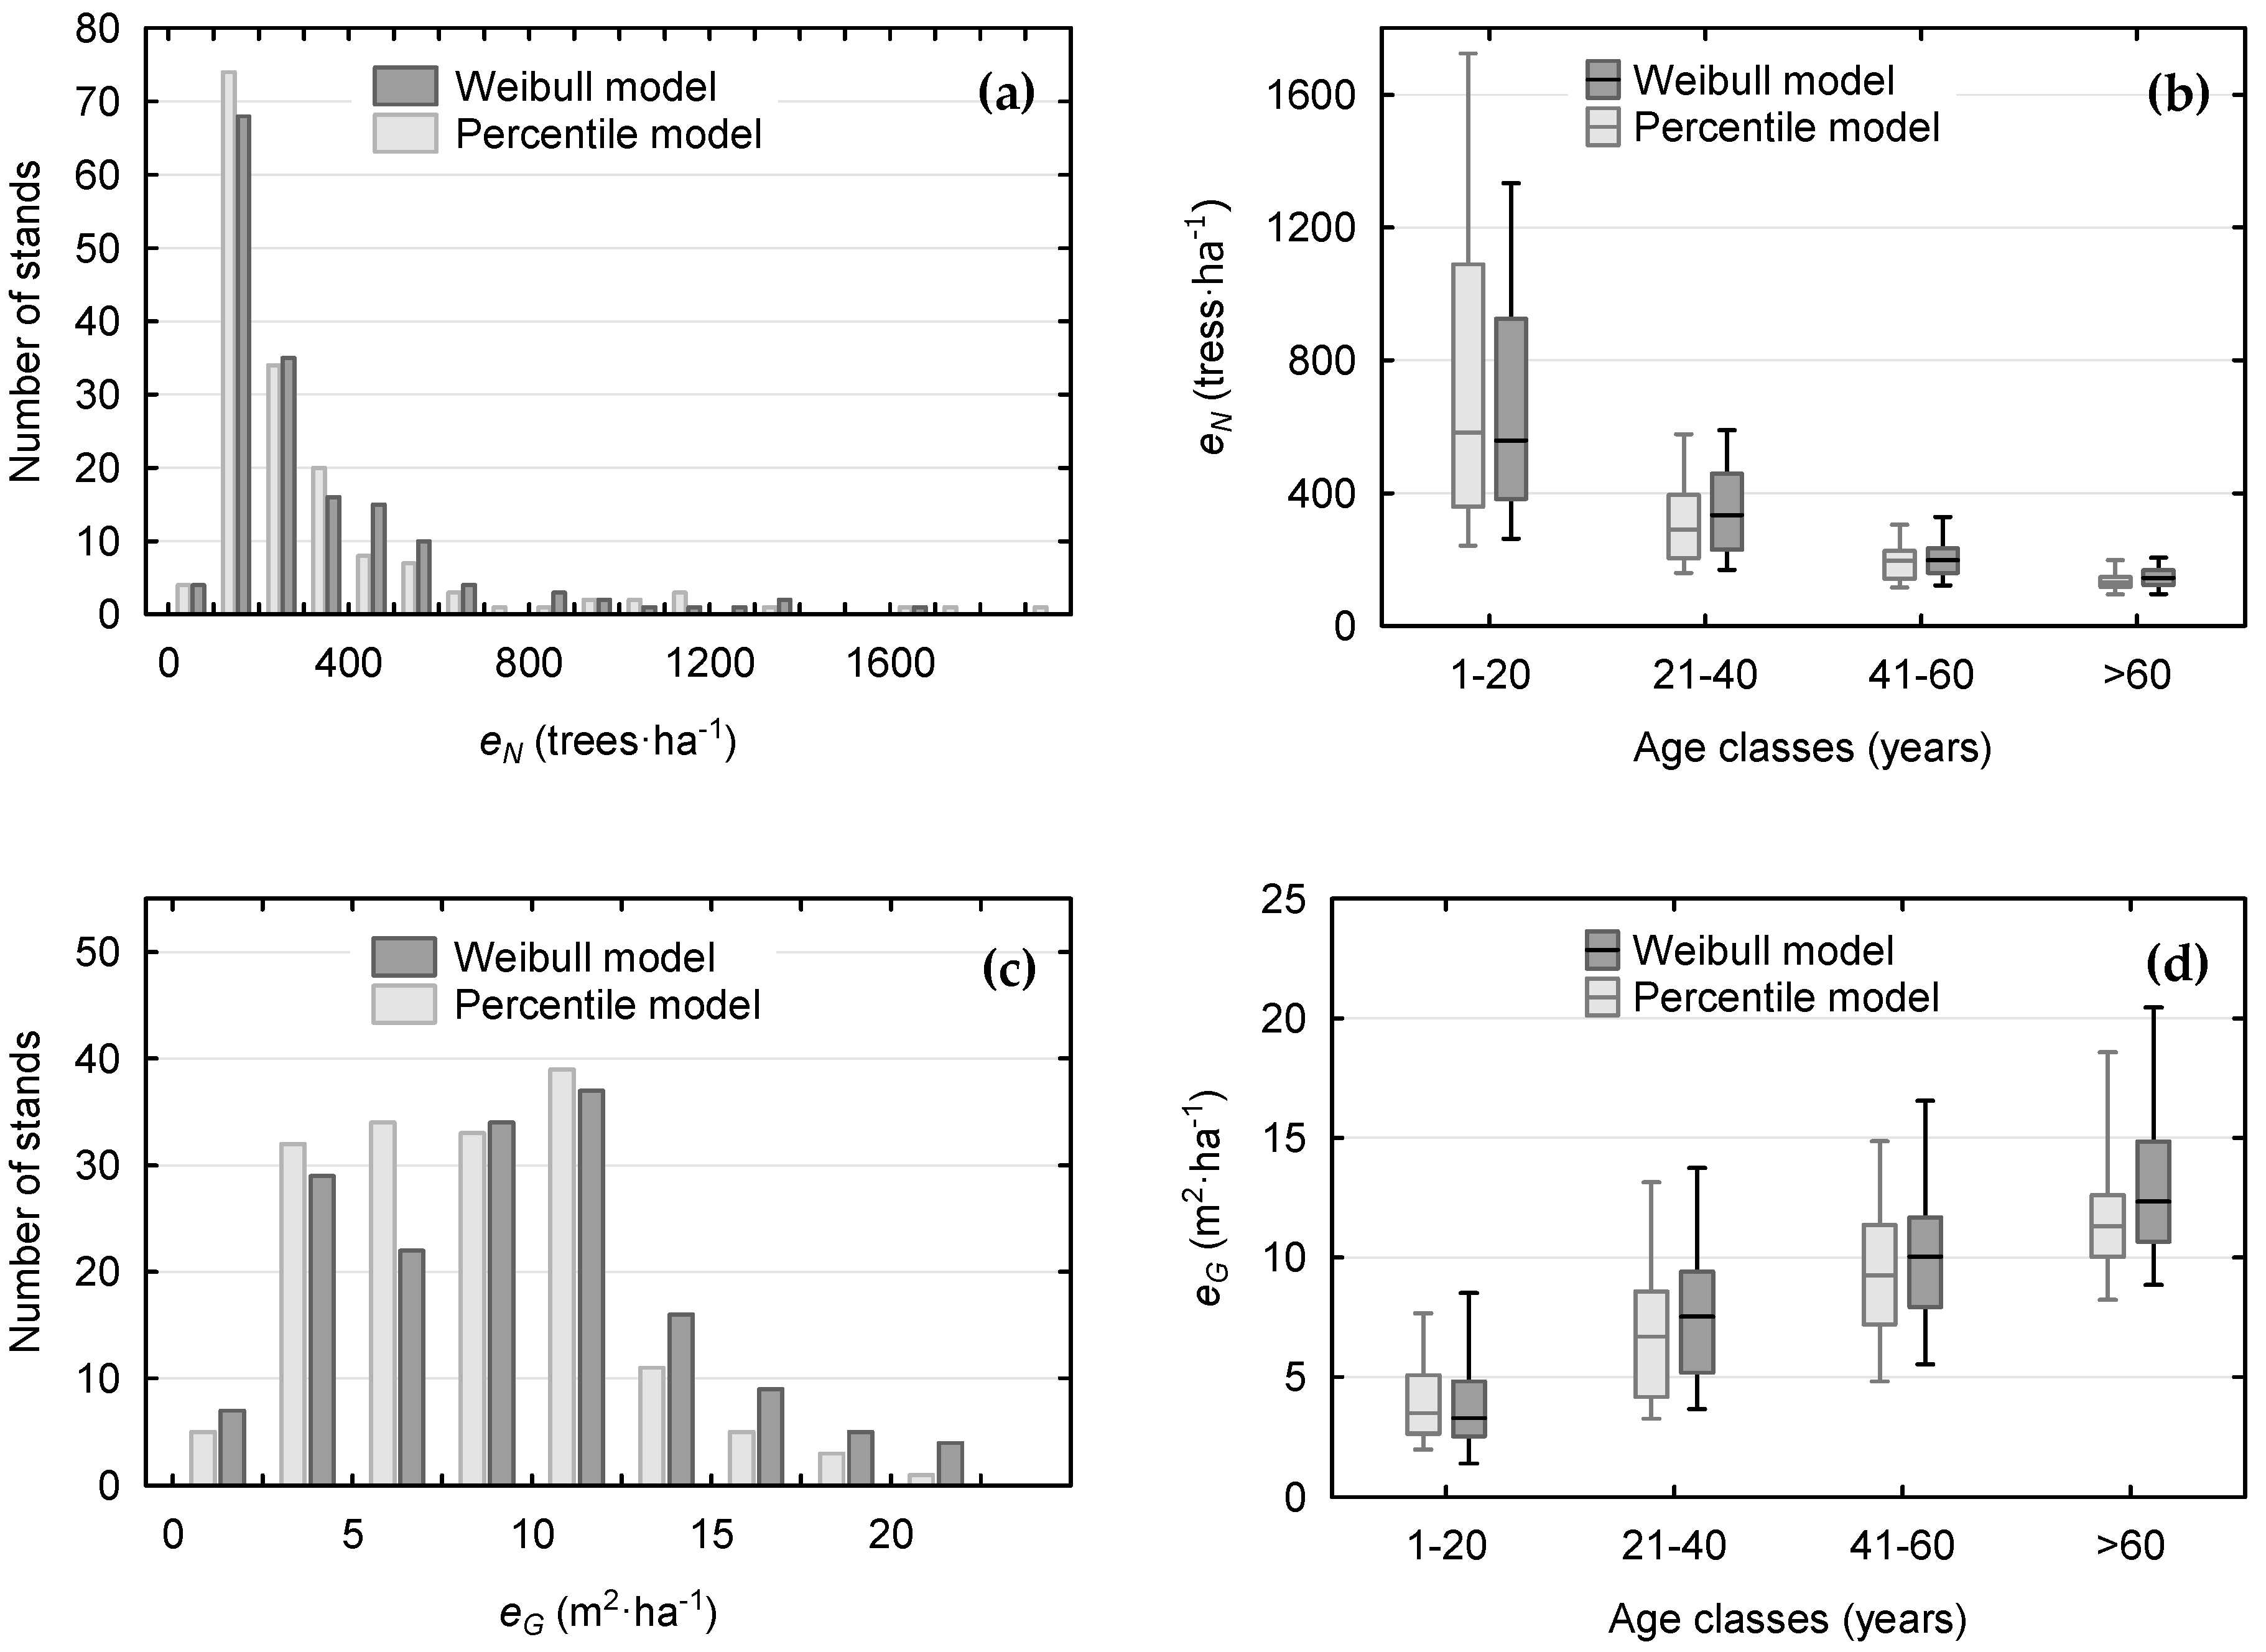
Both models were assessed by means of different statistics including ME, RMSE and error indexes
eN and
eG. While the first two rely only on differences in CDFs, the third requires information about the number of trees per hectare. In our analysis, we obtain this characteristics based on field measurements on sample plots of known area. There are also other ways like the application of existing whole stand models [
34] or using airborne laser scanning data [
15]. It seems that, regardless of the method used to determine the number of trees per hectare, the final conclusions regarding the comparison of our two models should not be affected. However, it should be expected that the range and variability of
eN and
eG will be larger compared to our results, especially when the stand density is predicted based on whole stand models.
According to Nord-Larsen and Cao [
17], the use of the basic stand characteristics to estimate the frequency of trees in various DBH classes may be insufficient. This objection, in particular, pertains to the fact that stands treated according to different thinning regimes may reveal similar characteristics, while being completely different in terms of diameter distribution. Our study results, especially the values of goodness-of-fit statistics and their variation, confirm that while the distribution models generated accurate estimates for some stands, in other cases the predicted results were significantly different from the observed values (
Figure 3). Such a situation may be caused not only by thinning, but also by natural factors affecting diameter distribution, such as heterogeneous site conditions and irregular tree density caused by wind or snow damages. Von Gadow et al. [
61] noted that a given diameter distribution may correspond to many different spatial tree distributions, and so one should incorporate information about tree location in the process of diameter distribution modeling [
62]. While a greater number of factors included in a model may certainly improve prediction quality, it may also decrease the application potential of the resulting solution, thus running contrary to the parsimony principle.
While some of the latest works devoted to diameter distributions of stands have applied remote sensing tools, such as airborne laser scanning [
15], at the current stage of technological development, it is still necessary to estimate those distributions indirectly by means of prediction models [
15]. It seems that the constructed models may provide valuable assistance to cutting-edge technologies in modeling diameter distributions for black alder stands. Nevertheless, the primary application of the developed models is the projection of future diameter distributions to optimize management processes in black alder stands [
63]. This task may be facilitated by inclusion of predicted changes in
QMD over time into elaborated distribution models.


