Article

Effects of Initial Soil Properties on Three-Year Performance of Six Tree Species in Tropical Dry Forest Restoration Plantings

by
Valentina Carrasco-Carballido
1,
Cristina Martínez-Garza
1,*,
Héctor Jiménez-Hernández
2,
Flavio Márquez-Torres
1 and
Julio Campo
3
1
Centro de Investigación en Biodiversidad y Conservación, Universidad Autónoma del Estado de Morelos, Universidad 1001, Colonia Chamilpa, Cuernavaca 62209, Mexico
2
Facultad de Ciencias Biológicas, Universidad Autónoma del Estado de Morelos, Universidad 1001, Colonia Chamilpa, Cuernavaca 62209, Mexico
3
Instituto de Ecología, Universidad Nacional Autónoma de México, Ciudad Universitaria, Mexico City 04510, Mexico
*
Author to whom correspondence should be addressed.
Forests 2019, 10(5), 428; https://doi.org/10.3390/f10050428
Submission received: 25 March 2019 / Revised: 14 May 2019 / Accepted: 15 May 2019 / Published: 17 May 2019
(This article belongs to the Special Issue Monitoring and Management of Forest Recovery)

Abstract

:
Deforestation of tropical dry forest reduces soil fertility, with negative effects on future restoration intervention. To evaluate the effect of initial soil properties on three-year performance of six tree species in restoration settings, we measured C, N, and P contents in topsoils of 48 plots under minimal (exclusions of livestock grazing) and maximal (plantings of six native species) restoration intervention during two years in tropical dry forest in central Mexico. Survival and height and diameter relative growth rates were evaluated by species and by growth rank (three fast- and three slow-growing species). After two years, organic C and the C:N ratio increased early during natural succession; these increases might be related to high density of N2-fixing recruits at both intervention levels. Changes in N availability for plants (i.e., NO3 and NH4+ contents) occurred after cattle exclusion. After 40 months, the fast-growing legume Leucaena esculenta (DC.) Benth. had the highest survival (65.55%) and relative growth rate in both height (3.16%) and diameter (5.67%). Fast-growing species had higher survival and diameter growth rates than slow-growing species. Higher diameter growth rates for fast-growing species may be associated with a higher ability to forage for soil resources, whereas similar height growth rates for slow and fast-growing species suggested low competition for light due to slow natural succession at the site. Planted seedlings had higher survival possibly due to initial high NO3 content in the soil. Also, fast-growing species seem to benefit from initially higher pH in the soil. Both soil properties (i.e., pH and NO3) may be augmented to favor the performance of fast-growing species in restoration plantings and to further accelerate soil recovery in tropical dry forests.

1. Introduction

Tropical dry forest (TDF) is threatened by an alarming rate of conversion to agriculture [1,2]. In Mexico, this ecosystem covers 60% of the tropical region, but only 7.9 million hectares (7%) are in conserved condition [3,4]. In TDFs, natural succession is a slow process due to a long drought period, a short growing season, and low water availability [5]. In addition, natural limitation of productivity due to low availability of nitrogen (N) and phosphorus (P) is aggravated by large nutrient and organic matter losses during the land-use change [6,7,8]. Thus, in TDFs, while some vegetation structure such as original number of tree species may be reached within five years [9,10,11], recovery of former soil C and N levels may require up to six decades [12]. The combination of nutrient deficiency and limited water availability makes natural succession a slow process.
Litterfall and root decomposition of trees add organic matter to soil [13], and the large amounts of C allocated to fine roots in TDF trees due to water stress could act as an important input of organic matter and nutrients to the soil [14]. Therefore, the establishment of vegetative cover is a critical first step in TDF recovery, and thus a major goal of restoration actions. Minimal restoration intervention, also known as unassisted forest regeneration [15], excludes the disturbance that leads to loss of vegetation (often livestock grazing), allowing natural succession to occur [16]. In maximal restoration intervention, plantings are established to accelerate the process of recovery [17]. Therefore, maximal intervention may accelerate the recovery of soil fertility compared to minimal intervention, although the time frame required to recover soil fertility is still unknown.
The species used for restoration plantings matter. Early successionals, usually ranked as fast-growing species [18,19,20], are recommended for sites with low potential for natural recovery [21]. Some tree species have been categorized as fast- or slow-growing species in greenhouse conditions under high resource availability [22], or based on their performance during secondary succession [23,24,25,26]. Fewer tree species, mostly fast-growing species, have been planted in the harsh conditions of restoration settings [27,28]. Further, some fast-growing species may suffer from higher herbivory [29], and therefore show lower survival in early successional environments. On the other hand, some species formerly classified as slow-growing species have shown high performance in restoration settings [30]. Adding slow-growing, late-successional species in restoration plantings may further accelerate succession back to mature forest [20]. Finally, tree species respond differently to soil conditions [31]. For example, in restoration plantings in the humid forest, slow-growing species were not as sensitive to soil conditions as fast-growing species [32]. In TDF, fast-growing species have a regenerative strategy associated with high availability of light [33], soil nutrients [22,34], and susceptibility to drought [35]. Fast-growing species may have higher performance than slow-growing species in early successional environments, but they may also be more affected by initial soil conditions.
The effect of minimal and maximal restoration interventions on C, N, and P contents in soils and the effect of initial soil properties on three-year-old restoration plantings were evaluated in a secondary TDF in central Mexico. Specifically, we expected soil nutrients to increase over time and be higher in the maximal intervention level. We also expected species formerly ranked as fast-growing species in greenhouse conditions or during secondary succession [22,23,24,25,26] to have higher survival and growth rates than those ranked as slow-growing species. Finally, we expected fast-growing species to be more sensitive to soil nutrients than slow-growing species [22,34,35]. Detailed analysis of soil recovery under minimal and maximal restoration interventions may allow for more informed decisions on restoration strategies, and in the case of maximal intervention, to validate categories of growth rank to select tree species to accelerate soil recovery in dry forests.

2. Materials and Methods

2.1. Study Site

The experiment was carried out near the town of Quilamula (18°30′37″ N, 99°01′10″ W) in the state of Morelos in central Mexico. The native vegetation in this region is TDF, dominated by leguminous trees [36]. The region is characterized by a distinct period of low precipitation, and the climate in the area is hot and subhumid [37]. Long-term climate data from weather stations show that average monthly temperature is 24.5 °C and varies little, ranging from 22.8 to 26.2 °C [36]. Mean annual precipitation is 909 ± 24 mm (mean ± SE from 1951 to 2010), 90% of which falls between May and October (Figure S1.1, [38]). For the study years, mean annual precipitation was 840 ± 25 mm (2011–2012) and 1163 ± 32 mm (2013–2014) (Figure S1.2; [39]).
The landscape consists of steep mountains (around 1000 m above sea level [m a.s.l.]). Dominant soils (Leptosols and Cambisols) derived from underlying granites are mainly shallow (<30 cm in depth), with sandy–loam texture; approximately 50% of the soil organic matter content is concentrated within the first 10 cm of depth [12]. Soils under native vegetation have a pH close to neutral (6.9 to 7.3) and the bulk density varies from 0.88 to 0.96 g cm−3 [12].
Over the past 40 years, land use has changed from TDF to agricultural activities [3]. This generates a strong economic dependence of local inhabitants on the land, and they have perceived a decrease in productivity over the recent past [40]. This shift has created a mosaic of areas currently grazed by cattle, degraded land that has been abandoned and is undergoing natural succession, and fragments of dry forest with different degrees of conservation.
In 2012, two sites were excluded from disturbance by cattle, and remnant trees (Acacia cochliacantha Humb. & Bonpl. ex Willd. and Ipomoea sp.) were cut. Initial conditions of the soil were described at four points following [41]. The soil in the study plots were Leptosol and Cambisol according to the World Reference Base for Soil Resources [42]. The main incipient process of pedogenesis was accumulation of clays, structure formation, and neoformation of clays. There was evidence of reductomorphy in the Leptosol and bioturbation in Leptosol and Cambisol. The depth of the superficial horizon with evidence of organic matter (Ah) varied between 2 and 5 cm, and bulk density was 0.98 ± 0.11 g cm−3 (estimated with the dry weight of known volume of soil; cylinder of 100 mL). These soils had pH close to neutrality (6.64 ± 0.98), with a C:N ratio close to 10, a NO3:NH4+ ratio below 1, and low concentration of available P (Table S1).

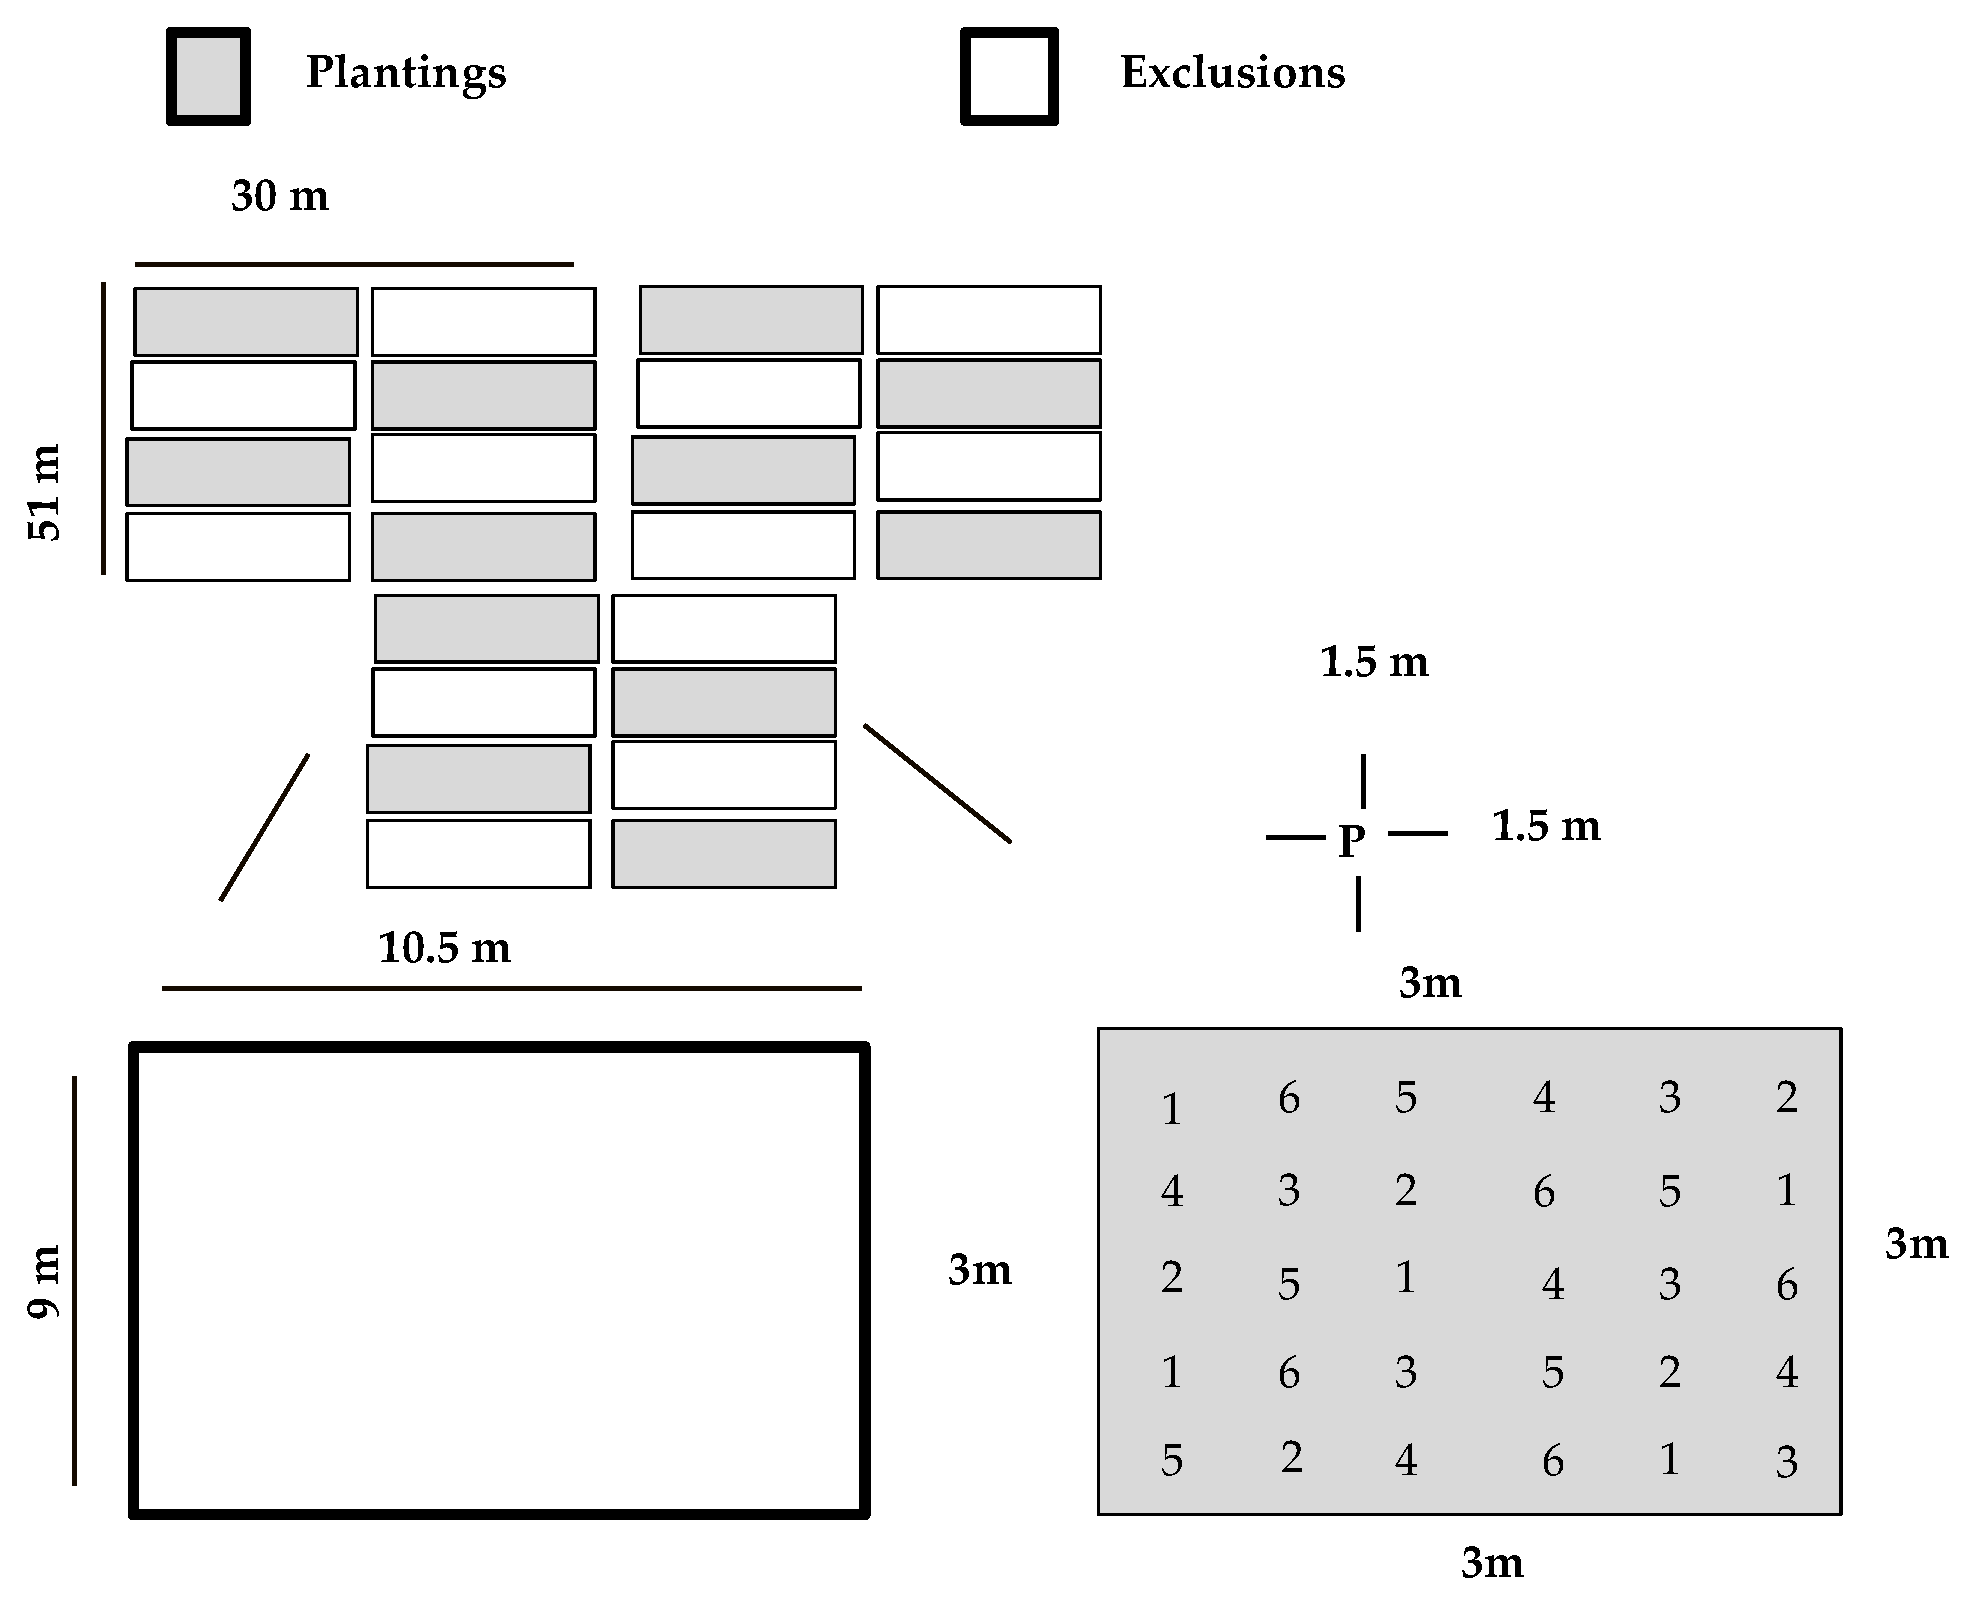
2.2. Plantings Design

The experiment was carried out in two locations. Location A was 1124 m a.s.l. with a 25% slope, and location B was 1116 m a.s.l. with a slope of 16%. Three 51 m × 30 m sites were established in each location. Each site had eight 10.5 m × 9 m plots separated by 3 m, for a total of 48 plots. Plots were systematically assigned to one of two restoration interventions (Figure 1). Twenty-four plots from both locations were left to undergo natural succession (minimal intervention) and in the other 24 plots, mixed plantings of six native tree species were established in July 2013. Seedlings were planted with 1.5 m of separation, with five seedlings per species per plot. Three of the species have been ranked as fast-growing (Acacia coulteri Benth., Leucaena esculenta (DC.) Benth. and Spondias mombin L.), and the other three species have been ranked as slow-growing (Erythrina americana Mill., Lysiloma divaricatum (Jacq.) J.F. Macbr. and Crescentia alata Kunth; Table 1). All plants were donated by the Ministry of Sustainable Development of the Government of the State of Morelos; they were one year old and 30–50 cm in height. Seedling survival and height and base diameter were evaluated at the beginning (July) and end of the rainy season (November) from 2013 to 2016.

2.3. Soil Conditions: Carbon, Nitrogen, and Phosphorus Contents

Soil was sampled in the dry season of 2013 and 2014. During each sampling, six samples were collected from 0 to 10 cm depth of the soil profile in each of the 48 plots. For all of the physico-chemical and chemical analyses, we used composite samples of the six samples for each plot. In this forest type, microbial biomass, soil organic matter, and available N and P are concentrated in the upper 10 cm of the soil profile [12]. Soil was air-dried and sieved through a 2 mm mesh prior to physico-chemical and chemical analyses. The pH of each soil sample was determined in water. Soil C was analyzed in an automated C-analyzer (SHIMADZU 5005A) after grinding a 5 g air-dried subsample passed through a 100-mesh screen. The total soil N concentration was determined by acid digestion in concentrated H2SO4 [46] using an NP elemental analyzer (Technicon Autoanalyzer II). Exchangeable N concentrations (hereafter referred to as NO3 and NH4+) were measured by extracting a 15 g subsample of each composite soil sample in 100 mL 2 M KCl [46]. The soil KCl solution was shaken for 1 h and allowed to settle overnight. A 20 mL aliquot of the supernatant was transferred into sample vials and frozen for later analysis. Soil bicarbonate-P was determined in duplicate; 0.5 g soil samples were placed in 50 cc centrifuge tubes and shaken with 30 mL of 0.5 N NaHCO3 for 16 h and centrifuged. The supernatant was analyzed for bicarbonate-P. Masses of C, N, and P were transformed into area units (g m−2) using the bulk densities for each plot.

2.4. Statistical Analysis

For soil samples, the six samples taken in each plot were mixed to analyze one composite sample per plot. Data on soil nutrients were analyzed in terms of content (n = 48 samples per year). A separate two-way analysis of variance was carried out for each of the contents (pH, soil organic C, total N, NH4+, NO3, total P, and available P), with the level of intervention (minimal [exclusions] and maximal [plantings]) and time as factors; the interactions of these two factors were also tested. To fulfill assumptions of the analysis of variance, total N and NO3 were log-transformed. Two principal component analyses (PCAs) were run to ordinate seven variables of topsoil (0–10 cm depth) in each of the 24 plots with plantings separately for each of the two years of the study. The first two axes of both PCAs were used to predict tree survival and relative growth rates by species using linear regressions. Correlations and variance explained by each soil property were calculated; soil properties highly related to PCA axis and contributing the most to explained variance were discussed in relation to performance [47].
Differences in survival by species and by growth rank were evaluated with Kaplar–Meier curves and log-rank test; a contingency table and chi-square test were used to evaluate differences in final survival rate by species [48]. Survival after 40 months is reported in results.
The relative growth rates (RGR) in height and diameter were calculated at 40 months (from July 2013 to November 2016) using the following equation:
lnRGR = ln [(lnD2 − lnD1)/(t2 − t1)]
where D refers to difference in diameter or height between the initial and final measurements, t refers to time, and the subscripts 1 and 2 refer to the beginning and end of the measuring period, respectively. Using the natural logarithm of the relative growth rate largely normalizes the residuals in the analysis of variance [49]. For growth rate analysis, seedlings were used as replicates. Differences in RGR among species were evaluated with analysis of variance (ANOVA) and Tukey post hoc tests when significant. Erythrina americana was removed from RGR analysis because only two individuals were alive at the end of the study. Previous analysis of soil properties revealed similar results between the two locations and therefore, this factor was removed. All analyses were performed in STATISTICA 7.0 (http://www.statsoft.com/Products/STATISTICA-Features [47]).

3. Results

3.1. Soil Characteristics

3.1.1. Time

Seven soil properties were evaluated during the first two years at superficial soil depth (0–10 cm; Table 2). After two years of restoration intervention, organic C content (SOC) and C:N ratio increased significantly. In contrast, inorganic N (i.e., NH4+ and NO3) content and NO3:NH4+ ratio decreased significantly. Soil pH, total N, total P, and available P contents in the soils did not change with time.
For the PCA from 2013, the first two axes explained 55% of the variation in soil variables among 24 plots with plantings (Figure S2). The PCA axis 1 was positively correlated with soil available P content (0.47) and this variable explained 8% of the variance in this axis; this axis was also highly negatively correlated with total N (−0.93) and total P (−0.93) and each of these variables explained 33% of the variance of this axis (Table S2). The PCA axis 2 was positively correlated with soil pH (0.53) and this variable explained 23% of the variance of this axis (Table S2).
For the PCA of 2014, the first two axes explained 69% of the variation in soil variables among the 24 plots with plantings (Figure S3). The PCA axis 1 was highly negatively correlated with total N content (−0.91) and total P content (−0.91), and each of these variables explained 23% of the variance of this axis (Table S3). The PCA axis 2 was highly positively correlated with soil pH (0.88) and this variable explained 64% of the variance of this axis; this axis was also negatively correlated with NO3 content (−0.40) and this variable explained 13% of the variance of this axis (Table S3).

3.1.2. Restoration Intervention

Soil properties varied little between levels of restoration (Table 2). The analysis of variance showed that all soil properties were statistically similar under minimal and maximal intervention (Table 2). The interactions of time and intervention were not significant.

3.2. Tree Performance

3.2.1. Survival

After 40 months, the fast-growing species Leucaena esculenta had the highest survival (65.55%), while Erythrina americana had the lowest survival (1.67%). The chi-square test revealed that species showed different survival (X2 = 152.31, p < 0.00001) (Figure 2a). The log-rank comparison showed that Leucaena esculenta, Lysiloma divaricatum, and Acacia coulteri showed similar survival whereas the survival of Erythrina was significantly lower than the rest of the species; Spondias mombin had similar survival to Acacia (Figure 2a). Overall, the survival of fast-growing species was significantly higher (56.55%) than the survival of slow-growing species (32.41%) (Log-rank test = 6.69, p < 0.00001; Figure 2b).

3.2.2. Height Relative Growth Rate

Logarithmic relative growth rates in height (height lnRGR) after 40 months were similar for two slow-growing species (RGR = 2.54%) and three fast-growing species (RGR = 2.45%) (F (1, 301) = 0.30, p = 0.58). Leucaena had the highest height lnRGR (RGR = 3.16%) whereas Spondias had the slowest height lnRGR (RGR=1.89%). The analysis of variance revealed significant differences in height lnRGR among species (F (4, 296) = 8.51, p < 0.00001). The post hoc Tukey test revealed that Leucaena and Lysiloma had similar height lnRGR, which was significantly higher than that of Spondias (Figure 3).

3.2.3. Diameter Relative Growth Rate

Logarithmic relative growth rates in diameter at the base (diameter lnRGR) after 40 months of growth varied twice among five tree species. On average, three fast-growing species had significantly higher diameter lnRGR (RGR = 4.31%) than two slow-growing species (RGR = 3.39%) (F (1, 305) = 22.57, p < 0.00001; Figure 4a). Leucaena had the highest diameter lnRGR (RGR = 5.67%) and Crescentia the lowest diameter lnRGR (RGR = 2.38%). The analysis of variance revealed significant differences in diameter lnRGR among species (F (4, 302) = 40.92, p < 0.00001). The post hoc Tukey test revealed that Leucaena had significantly higher diameter lnRGR than the rest of the species (Figure 4b).

3.3. Effect of Initial Soil Properties on Tree Performance
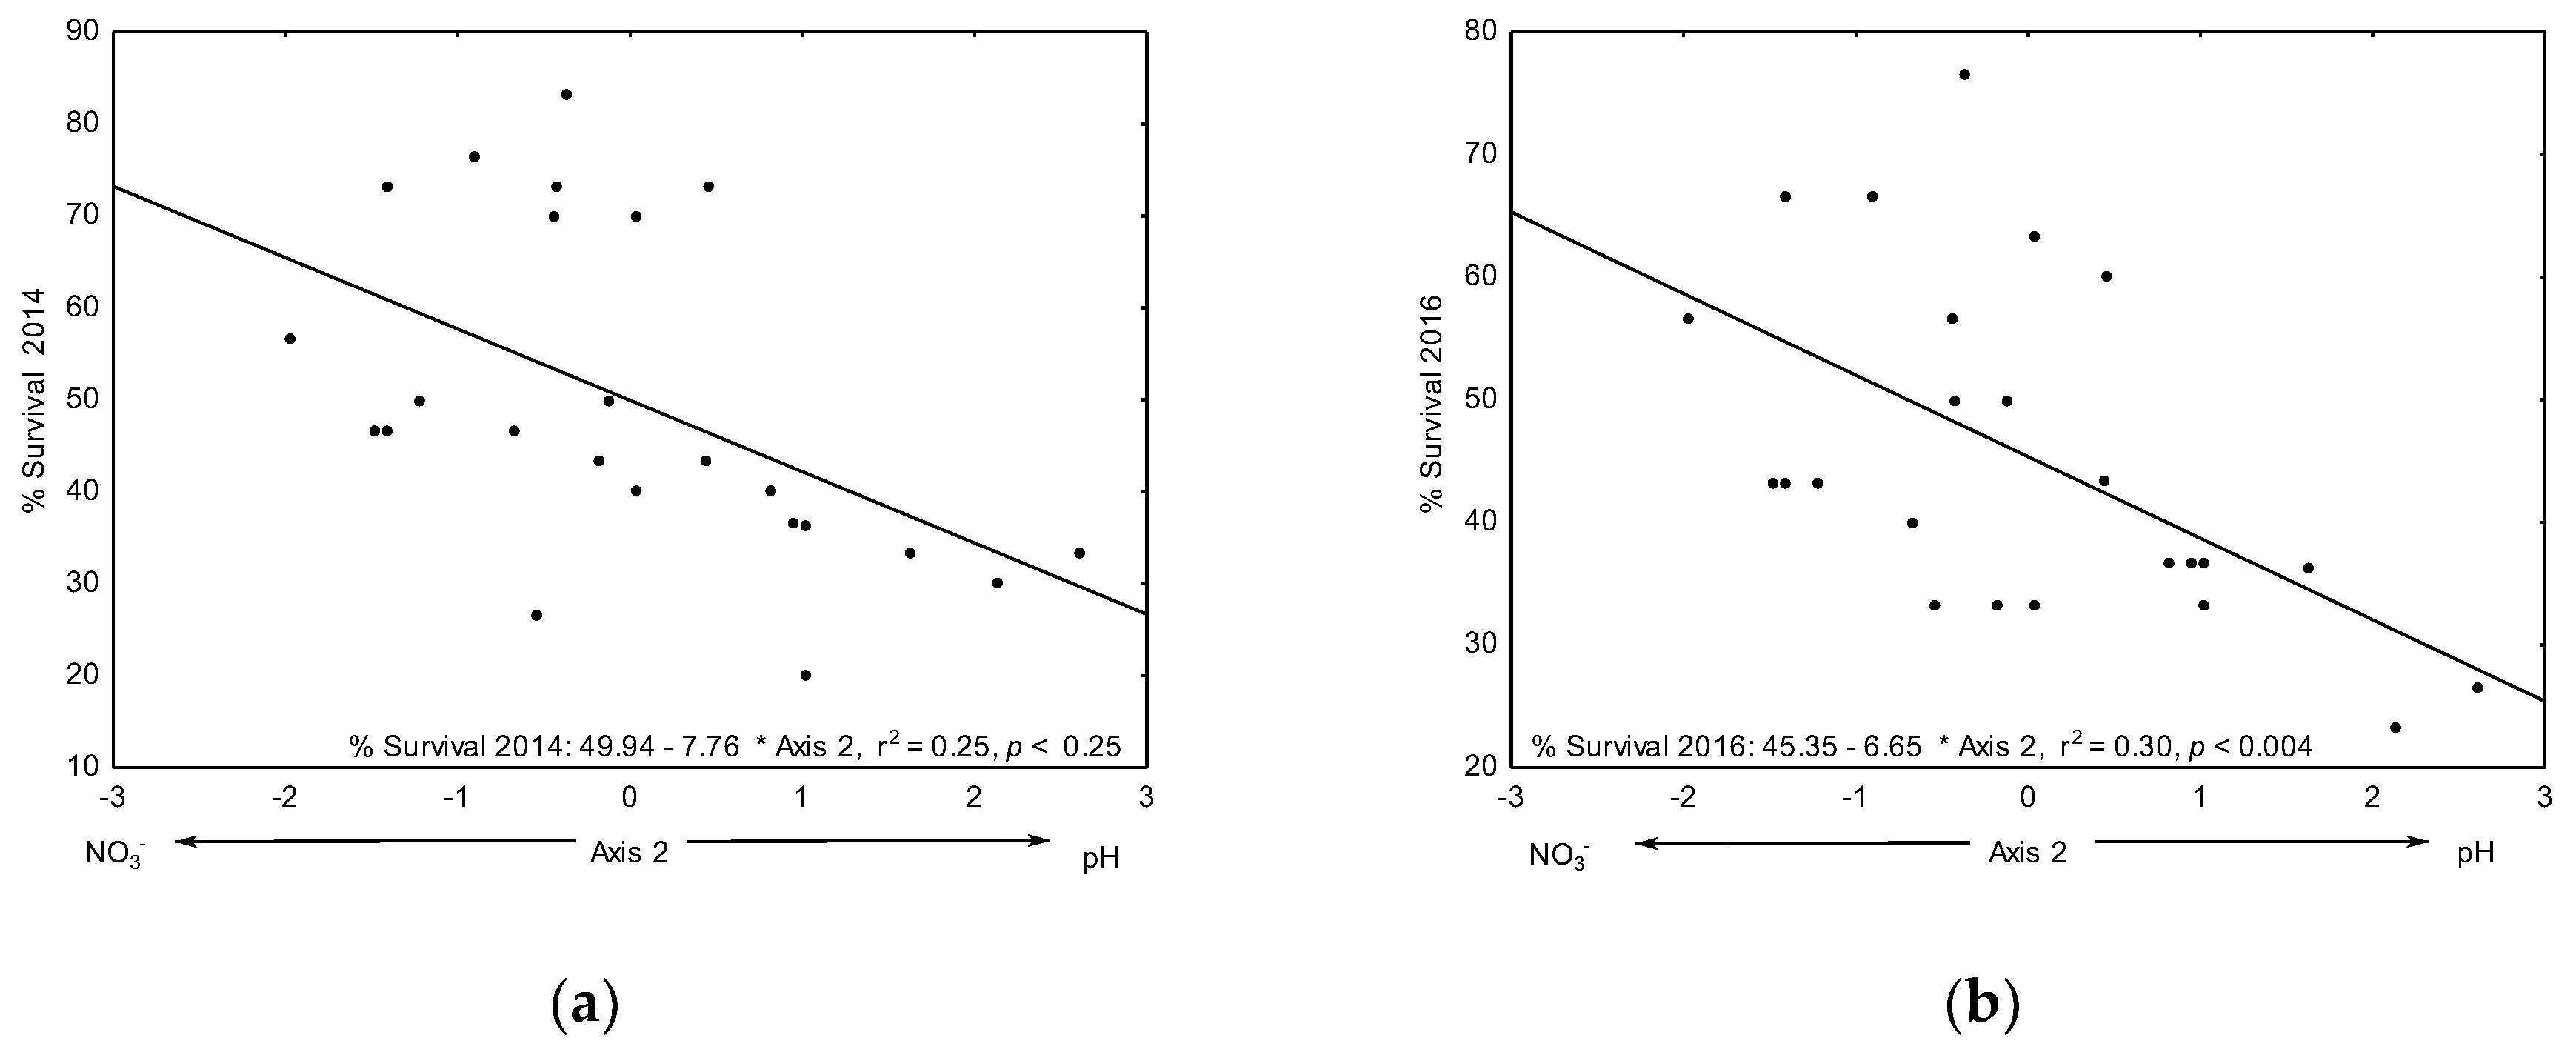
3.3.1. Survival

The first two axes of the Principal Component Analysis of soil properties for 2013 were not correlated with the survival of all six tree species in 2014 and 2016 (Table S4a), nor with the survival of fast- or slow-growing species (Table S4b). The PCA axis 1 of soil properties for 2014 was not correlated with the survival of 2014 and 2016 (Table S5a) nor with the survival of fast- or slow-growing species (Table S5b). The PCA axis 2 of soil properties for 2014 was correlated with the survival of 2014 (Figure 5a) and the survival of 2016 (Figure 5b) for all species. The PCA axis 2 of soil properties for 2014 was correlated with the survival of slow-growing species in 2014 (Figure 6a) and in 2016 (Figure 6b).

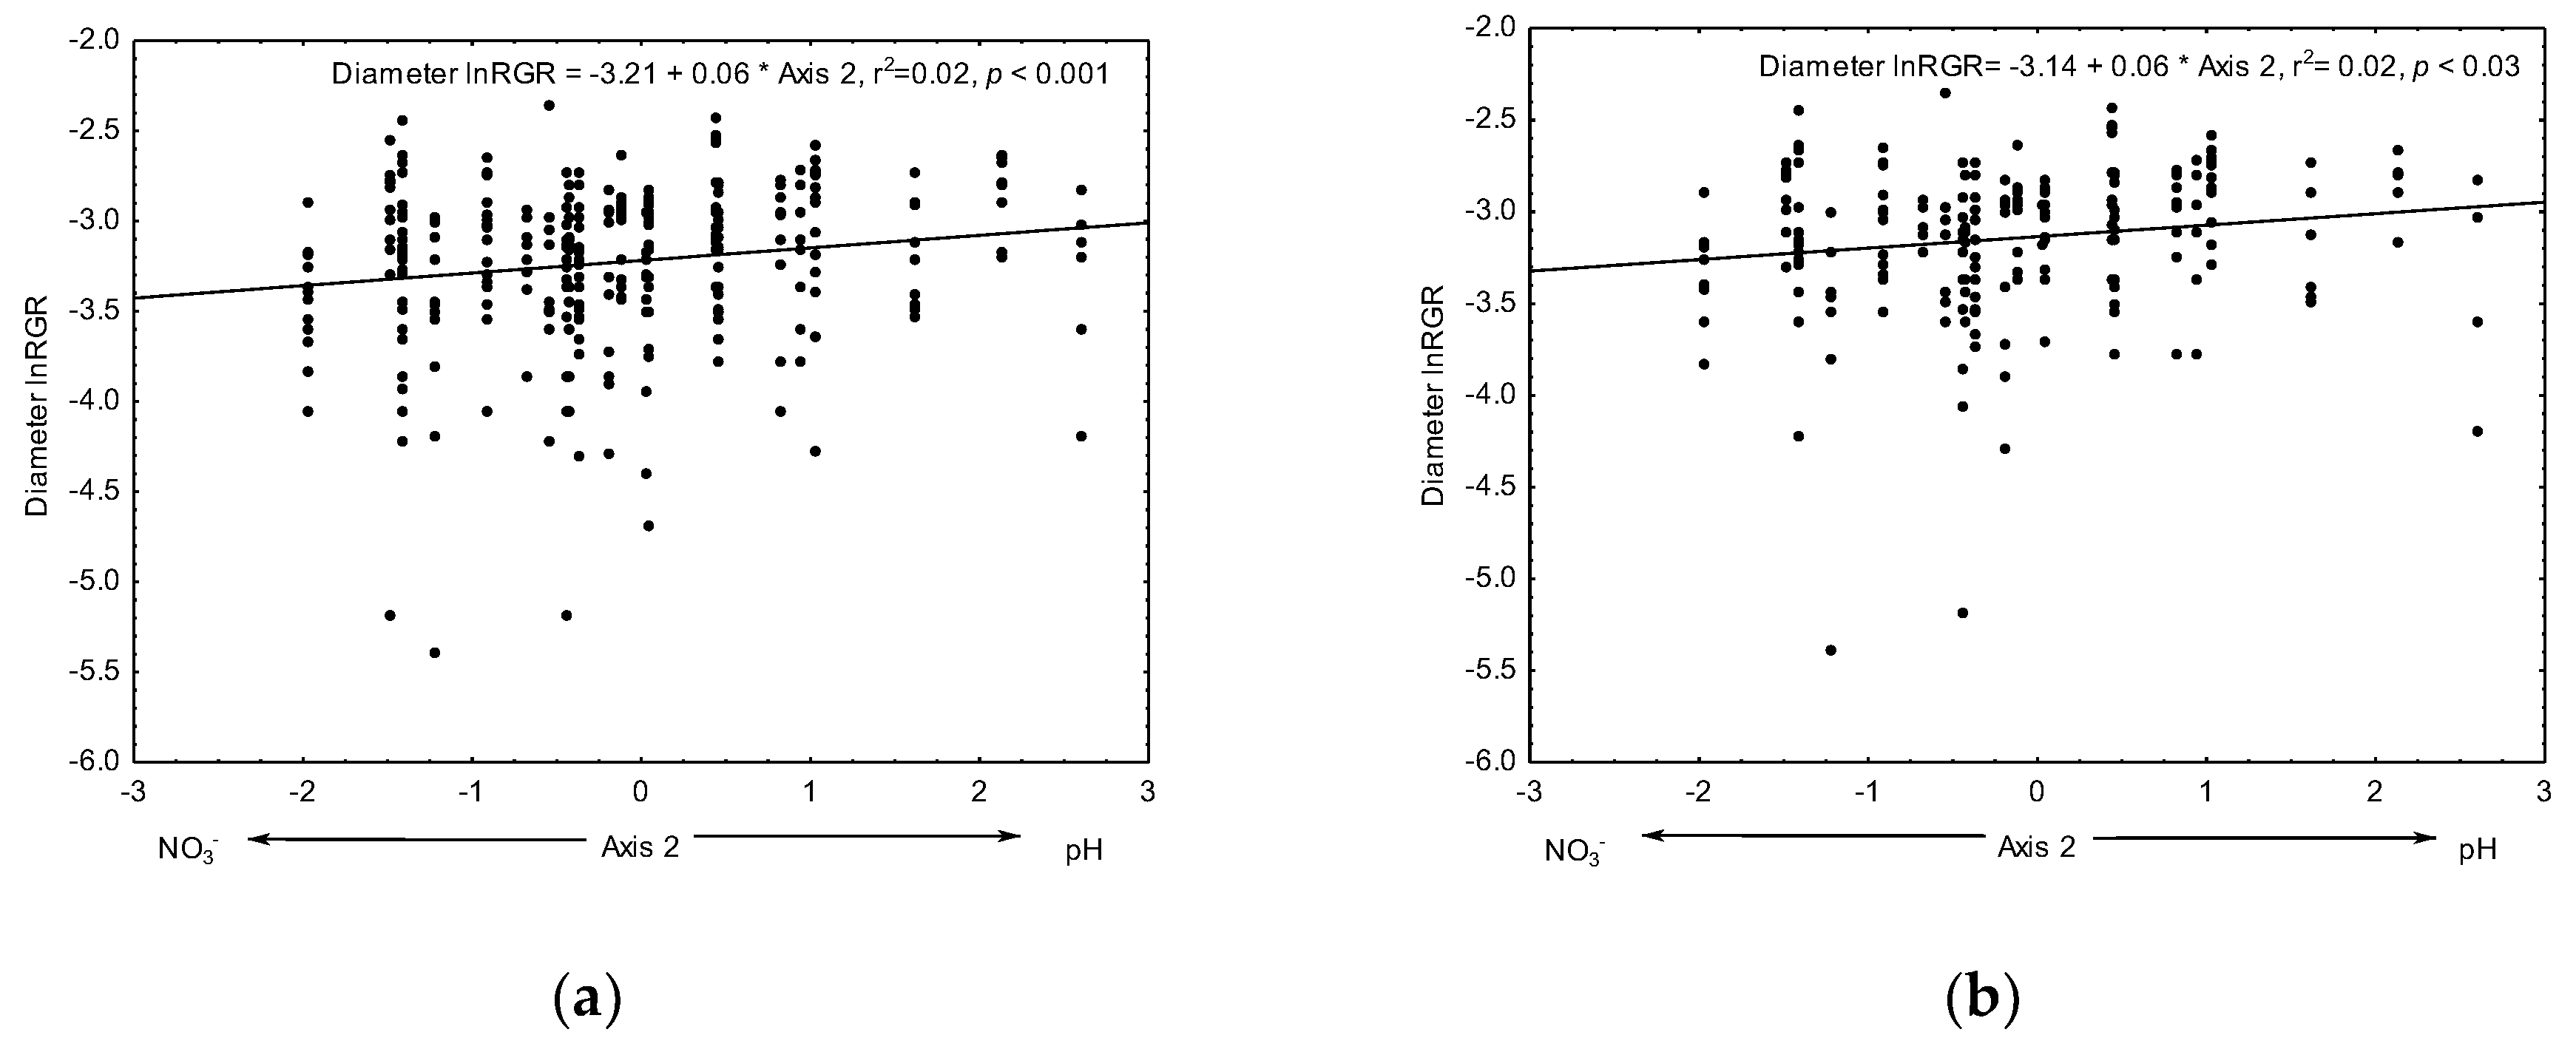
3.3.2. Relative Growth

The first two axes of the PCA of soil characteristics for 2013 and 2014 were not correlated with the height lnRGR for the six tree species (Table S6) nor with the height lnRGR of fast- or slow-growing species (Table S6). The first two axes of the PCA of soil characteristics for 2013 were not correlated with the diameter lnRGR for the six tree species (Table S7) nor with the diameter lnRGR of fast- or slow-growing species (Table S7). The PCA axis 1 of soil characteristics for 2014 was not correlated with the diameter lnRGR (Table S7) nor with the diameter lnRGR of fast- or slow-growing species (Table S7). The PCA axis 2 of soil characteristics for 2014 was correlated with the diameter lnRGR for all species (Figure 7a) and for fast-growing species (Figure 7b).

4. Discussion

After two years, soil organic C and C:N ratio increased during natural succession whereas the N availability for plants (i.e., NO3 and NH4+ contents) decreased. Fast-growing species had higher survival and diameter growth rates than slow-growing species. Fast- and slow-growing species had similar height growth rates. Planted seedlings responded to initial content of NO3 in the soil by having higher survival. Also, seedlings planted in soils with higher pH had higher growth rates.

4.1. Soil Conditions

Consistent with our hypothesis, organic C and the C:N ratio increased after two years of exclusion. In the TDF of Morelos, Mexico, soil organic C was found to increase with vegetation cover (Table 1 of [50]). Further, a global review of temperate, subtropical, and tropical ecosystems showed that accumulation of soil C is highest in areas with N2-fixing species [51]. In experimental plantations in Puerto Rico, 24 trees and shrubs from 20 families were found recruiting under plantations while in unplanted controls, only the legume Albizia lebbek (L.) Benth. was recorded [52]. Further, in TDF of Morelos, Mexico after two years of cattle exclusion, the legume trees Mimosa benthamii J.F. Macbr. and Acacia cochliacantha were the most abundant recruits [24]. In our study, plantings included four legume tree species (see Table 1) and there was a high abundance of two legume trees (Acacia cochliacantha and Lysiloma divaricatum) and Ipomoea pauciflora M. Martens & Galeotti recruits in both exclusions and plantings [53]. In conclusion, increases in organic C and the C:N ratio were possibly related to the high recruitment of N2-fixing species during early succession, but further studies need to address this hypothesis.
Our results showed that the soil NO3:NH4+ ratio decreased after two years of cattle exclusion. Given that soil N transformation is negatively affected by deforestation [54], the process is expected to recover with revegetation. Further, in remnant Eucalyptus salmonophloia F. Muell. woodland in Australia, an increase of NH4+ and NO3 concentrations was found because of deposition of cattle excrement and urine [55]. Also, inorganic N (both NH4+ and NO3 concentrations) decreases due to the demand of growing vegetation [56], which is fastest during early succession (<5 years; [10]). Further, NH4+ and NO3 content were lower in the year with higher amount of precipitation, suggesting higher losses by leaching. Even when a chronosequence in the TDF of Morelos suggested that the N cycling recovered after 60 years of natural succession [12], the changes in the N pools in the first two years of succession suggest that soil N transformations is taking place and it can be a combination of lack of fertilization from browsers, revegetation processes, and higher rainfall.

4.2. Restoration Intervention

Contrary to our hypothesis, there was no difference in soil properties after two years between minimal (exclusion) and maximal (plantings) restoration interventions. Some studies have evaluated the effect of monocultures or polycultures in arid and semiarid forest soils in the medium and long term. For example, in monocultures of Hippophae rhamnoides L. (sea-buckthorn) in China, the dynamics of soil microbial community structures improved after 8 years and up to 18 years [57]. Also, in monocultures of Jatropha curcas L. in India, biochemical and microbial characteristics improved after nine years [58]. Finally, under polycultures of 12 tree species in India, the soil organic C, N, and available P contents were improved after 16 years [59]. Plantings thus generally seem to improve soil conditions in the medium term (eight years). In our study, planted trees were on average 89.3 ± 55.2 cm in height after two years and perhaps too small to affect soil properties. On the other hand, recruitment processes take place under plantings as well as in exclusions. For example, in 10-year-old exclusions in a TDF in Costa Rica, the most abundant species recruited was the legume tree Acacia collinsii Saff. [60], and in a TDF in Morelos, Mexico, the legume trees Mimosa benthamii and Acacia cochliacantha were the most abundant recruits after two years of succession [24]. Finally, after three years of TDF succession in Panama, Guazuma ulmifolia Lam. (Sterculiaceae) was the most abundant recruit followed by Acacia collinsii [61]. Similar soil properties under minimal and maximal intervention were probably due to a high recruitment of N2-fixing species in both habitats.

4.3. Performance of Fast- and Slow-Growing Species

As predicted, species classified as fast-growing species had higher survival than slow-growing species. Similar to our results, in plantings in a deciduous forest in Costa Rica, two fast-growing species showed higher survival than two slow-growing species during the first two years [62]. In Chamela, Mexico, three months after planting, two fast-growing species showed higher survival than one slow-growing species in a dry year [63]. Further, in restoration plantings in Brazil, seven fast-growing species had higher survival than six slow-growing species [64]. Fast-growing species usually outperform slow-growing species in early successional environments under standard rainfall conditions. However, in this study, variation in survival within growth rank groups was high: one slow-growing legume, Lysiloma divaricatum, showed a survival rate as high as the one shown by two fast-growing legumes (Leucaena and Acacia). In plantings in Chamela, in a year with a hurricane event, five fast-growing species showed similar survival to five slow-growing species [30]. At our site, during the second year, precipitation was 377 mm higher than the long-term average (41% more than the mean annual precipitation; Figure S1). This abnormally wet year was due to abundant precipitation at the start of the rainy season (June); therefore, this additional precipitation may have favored the higher survival of some slow-growing species. Early survival of tree species in plantings was associated to growth rank and species identity.
Consistent with our prediction, fast-growing species had higher diameter growth rates than slow-growing species, whereas height growth rates were similar for fast- and slow-growing species. Height growth rates are usually reported for tree species in plantings; for example, fast-growing species had higher height growth rates than slow-growing species in plantings in Costa Rica [62], Mexico [63], and Brazil [64]. Height growth rates are usually associated with maximal tree height and competition for light [65]. Under heterogeneous soil resources, TDF trees increase root biomass to forage for resources; slow-growing species may not develop roots as fast and therefore they may not find patches of high resources as fast-growing species do [66]. Also, diameter at the base of plantings was positively associated with root development for trees growing under the arid conditions of pastures; trees with higher diameter at the base had higher root biomass [67]. In plantings in a transitional zone from oak forest (Quercus glaucoides M. Martens & Galeotti) to TDF in Morelos, Mexico, two legume tree species showed increases in diameter but not in height in the first year of growth [68]; there, natural succession was very slow and plantings were exposed to high light conditions for a long time (see [69]). In our experiment, natural succession was taking place in plantings and exclusions (see above); a census of December 2015 showed that recruits (110.01 ± 95 cm; mean ± 1 SE) and plantings (124.55 ± 77 cm) had similar height [70], therefore, they were not yet competing for light. Higher height growth rates may suggest faster vegetation recovery and therefore higher competition for light, which was not the case in our plantings.

4.4. Effects of Initial Soil Nutrients on Tree Performance

Performance of tree species was related to initial soil nutrient content. Higher tree survival was related to higher NO3 contents, especially for slow-growing species, whereas higher diameter growth rates were related to higher soil pH, especially for fast-growing species. Nitrogen is one of the essential components for plant development and growth [71,72]. Similar to our results with respect to the importance of soil N availability for plant survival in TDFs, in Yucatán, Mexico, addition of inorganic N to soils resulted in an increase of both recruited [6] and planted seedling survival [73]. Similar to our results with respect to soil pH, in restoration plantings in the humid forest of Veracruz, Mexico [32] and in Chiapas, Mexico [74], diameter growth rates were related to higher soil pH. Also, in restoration plantings in Australia, fast-growing species had higher height growth rates on less acidic soils [75]. Soils in the TDF are extremely poor in nitrogen [76], and the availability of N for plants decreases with environmental disturbance [77]. Given that plants require N to achieve high growth rates [78], and stable isotopes of nitrogen reveal that TDFs have an open N cycle (i.e., high losses of NO3 by leaching and losses by N2O emissions [79]), a high initial NO3 availability in the soil favored the growth rates of fast-growing species. For example, two fast-growing tree species from the TDF had a higher ability to forage for soil nutrients by producing more roots than two slow-growing species under high light availability in greenhouse conditions [66]. In this study, fast-growing species were probably more capable of foraging for soil resources by producing more roots than slow-growing species. However, even when soil attributes predicted diameter growth rates, only 2% of the variation was explained. Similar studies in the humid forest showed that soil attributes explained 4–12% of variation in growth rates [32]; further analysis, including other sources of variation in the field (i.e., microenvironmental conditions) is needed. For restoration plantings, a mix of fast- and slow-growing species should be planted because some species formerly ranked as slow-growing may perform as well as fast-growing species (i.e., Lysiloma divaricatum) in the harsh conditions of restoration settings. Further, many fast-growing species may recruit naturally, whereas slow-growing species, which shape conserved forest, may take decades to arrive by themselves.

5. Conclusions

After two years, organic C and the C:N ratio increased under both minimal and maximal intervention. Changes in NO3 and NH4+ suggest that their transformation in soils is taking place due to cattle exclusion. Species formerly classified as fast-growing had higher survival and diameter growth rates after 40 months. Planted seedlings responded to initial pH and content of NO3 in the topsoil. Both of these soil properties could be augmented to favor the performance of fast-growing species in restoration plantings and to further accelerate soil recovery in tropical dry forests. For the first two years of intervention, exclusion of cattle was enough to initiate the recovery of soil properties, however, planting slow-growing species which may take decades to recruit naturally may also accelerate successional processes in terms of composition.

Supplementary Materials

The following are available online at https://www.mdpi.com/1999-4907/10/5/428/s1, Figure S1: Average precipitation by month near Quilamula, Sierra de Huautla, Morelos, Figure S2: Trait loading of PCA axes 1 and 2 of an ordination based on seven properties of soil contents in 2013, Figure S3: Trait loading of PCA axes 1 and 2 of an ordination based on seven properties of soil contents in 2014, Table S1: Means and standard errors of initial soil properties (0–10 cm depth) in 2012, Table S2: Correlations and variance explained (%) of seven soil properties for 2013 to PCA axes, Table S3: Correlations and variance explained (%) of seven soil properties for 2014 to PCA axes, Table S4: Pearson correlation coefficient (r) of PCA axes 1 and 2 of soil properties for 2013 and survival (2014, 2016) for six tree species (a) and by growth rank (b), Table S5: Pearson correlation coefficient (r) of PCA axes 1 and 2 of soil properties for 2014 and survival (2014, 2016) for six tree species (a) and by growth rank (b), Table S6: Pearson correlation coefficient (r) of PCA axes 1 and 2 of soil characteristics for 2013 and 2014 and height lnRGR for six tree species (a) and by growth rank (b), Table S7: Pearson correlation coefficient (r) of PCA axes 1 and 2 of soil characteristics for 2013 and 2014 and diameter lnRGR for six tree species (a) and by growth rank (b).

Author Contributions

Conceptualization, V.C.-C., C.M.-G., and J.C.; methodology, V.C.-C., C.M.-G., and J.C.; formal analysis, V.C.-C. and C.M.-G.; investigation, V.C.-C., C.M.-G., F.M.-T., H.J.-H., and J.C.; resources, C.M.-G. and J.C.; data curation, V.C.-C. and C.M.-G.; writing—original draft preparation, V.C.-C., C.M.-G., F.M.-T., H.J.-H.; writing—review and editing, V.C.-C., C.M.-G., F.M.-T., H.J.-H.; visualization, V.C.-C. and C.M.-G.; project administration, V.C.-C. and F.M.-T.; funding acquisition, V.C.-C. and F.M.-T.

Funding

This research was funded by the Ministry of Sustainable Development of the Government of the State of Morelos (Secretaría de Desarollo Sustentable, Gobierno del Estado de Morelos), the State University of Morelos (Universidad Autónoma del Estado de Morelos, UAEM) and A. Azuela of the Nursery Vivero de Tebanca, A.C. F.M.-T. was supported by a Master scholarship from the Mexican Council of Science and Technology (Consejo Nacional de Ciencia y Tecnología, CONACYT).

Acknowledgments

We are grateful to Enrique Solís for logistical support in soil analyses and Luz María Ayestarán and Evodio Rendón for expert field assistance. Also, thanks to students of Restoration ecology classes at UAEM 2012–2016 for help in field work. The authors gratefully acknowledge the financial and logistical support from the owners of the sites of study in Quilamula, Morelos: O. García Soriano, H. Sánchez García, E. García Soriano, D. García Cervantes, and J. García Cervantes. We want to thank Lynna Kiere for editing early versions of this ms. Finally, we thank two anonymous reviewers for their detailed evaluation and valuable suggestions.

Conflicts of Interest

The authors declare no conflict of interest. The funders had no role in the design of the study; in the collection, analyses, or interpretation of data; in the writing of the manuscript, or in the decision to publish the results.

References

  1. Miles, L.; Newton, A.C.; DeFries, R.S.; Ravilious, C.; May, I.; Blyth, S.; Kapos, V.; E Gordon, J. A global overview of the conservation status of tropical dry forests. J. Biogeogr. 2006, 33, 491–505. [Google Scholar] [CrossRef]
  2. Sánchez-Azofeifa, G.A.; Portillo-Quintero, C. Extent and Drivers of Change of Neotropical Seasonally Dry Tropical Forests. In Seasonally Dry Tropical Forests; Island Press: Washington, DC, USA, 2011; pp. 45–57. [Google Scholar]
  3. Trejo, I.; Dirzo, R. Deforestation of seasonally dry tropical forest: a national and local analysis in Mexico. Biol. Conserv. 2000, 49, 133–142. [Google Scholar] [CrossRef]
  4. CONABIO. Capital Natural de México, Vol. I: Conocimiento Actual de la Biodiversidad; Comisión Nacional para el Conocimiento y Uso de la Biodiversidad: Ciudad de México, Mexico, 2008. Available online: https://www.biodiversidad.gob.mx/pais/conocimientoActual.html (accessed on 1 April 2016).
  5. Murphy, P.G.; E Lugo, A. Ecology of Tropical Dry Forest. Annu. Ecol. Syst. 1986, 17, 67–88. [Google Scholar] [CrossRef] [Green Version]
  6. Ceccon, E.; Huante, P.; Campo, J. Effects of nitrogen and phosphorus fertilization on the survival and recruitment of seedlings of dominant tree species in two abandoned tropical dry forests in Yucatán, Mexico. Ecol. Manag. 2003, 182, 387–402. [Google Scholar] [CrossRef]
  7. Maass, J.M. Conversion of tropical dry forest to pasture and agriculture. In Seasonally Dry Tropical Forests; Bullock, S.H., Mooney, H.A., Medina, E., Eds.; Cambridge University Press: Cambridge, UK, 1995; pp. 399–422. [Google Scholar]
  8. Campo, J. Shift from ecosystem P to N limitation at precipitation gradient in tropical dry forests at Yucatan, Mexico. Environ. Lett. 2016, 11, 95006. [Google Scholar] [CrossRef]
  9. Kennard, D.K. Secondary forest succession in a tropical dry forest: patterns of development across a 50-year chronosequence in lowland Bolivia. J. Trop. Ecol. 2002, 18, 53–66. [Google Scholar] [CrossRef]
  10. Lebrija-Trejos, E.; Meave, J.A.; Poorter, L.; Pérez-García, E.A.; Bongers, F. Pathways, mechanisms and predictability of vegetation change during tropical dry forest succession. Perspect. Plant Ecol. Evol. Syst. 2010, 12, 267–275. [Google Scholar] [CrossRef]
  11. Pascarella, J.B.; Marcano-Vega, H.; Aide, T.M.; Zimmerman, J.K.; Rivera, L. Forest Regeneration in a Chronosequence of Tropical Abandoned Pastures: Implications for Restoration Ecology. Restor. Ecol. 2000, 8, 328–338. [Google Scholar]
  12. Saynes, V.; Hidalgo, C.; Etchevers, J.D.; Campo, J.E. Soil C and N dynamics in primary and secondary seasonally dry tropical forests in Mexico. Appl. Soil Ecol. 2005, 29, 282–289. [Google Scholar] [CrossRef]
  13. Campo, J.; Maass, M.; Jaramillo, V.J.; Martínez-Yrizar, A.; Sarukhán, J. Phosphorus cycling in a Mexican tropical dry forest ecosystem. Biogeochemistry 2001, 53, 161–179. [Google Scholar] [CrossRef]
  14. Roa-Fuentes, L.L.; Campo, J.; Parra-Tabla, V. Plant Biomass Allocation across a Precipitation Gradient: An Approach to Seasonally Dry Tropical Forest at Yucatán, Mexico. Ecosystems 2012, 15, 1234–1244. [Google Scholar] [CrossRef]
  15. Chazdon, R.L. Second Growth: The Promise of Tropical Forest Regeneration in an Age of Deforestation; University of Chicago Press: Chicago, IL, USA, 2014. [Google Scholar]
  16. Martínez-Garza, C.; Osorio-Beristain, M.; Alcala, R.; Valenzuela-Galván, D.; Mariano, N. Ocho años de restauración experimental en las selvas estacionales de México. In Experiencias Mexicanas en la Restauración de los Ecosistemas; Ceccon, E., Martínez-Garza, C., Eds.; CONABIO-UNAM-UAEM: Mexico City, Mexico, 2016; pp. 385–406. [Google Scholar]
  17. Lamb, D.; Erskine, P.D.; Parrotta, J.A. Restoration of Degraded Tropical Forest Landscapes. Science 2005, 310, 1628–1632. [Google Scholar] [CrossRef]
  18. Whitmore, T.C. Canopy Gaps and the Two Major Groups of Forest Trees. Ecology 1989, 70, 536–538. [Google Scholar] [CrossRef]
  19. Swaine, M.D.; Whitmore, T.C. On the definition of ecological species groups in tropical rain forests. Vegetatio 1998, 75, 81–86. [Google Scholar] [CrossRef]
  20. Martínez-Garza, C.; Howe, H.F.; Martínez-Garza, C. Restoring tropical diversity: beating the time tax on species loss. J. Appl. Ecol. 2003, 40, 423–429. [Google Scholar] [CrossRef] [Green Version]
  21. Holl, K.D.; Zahawi, R.A.; Cole, R.J.; Ostertag, R.; Cordell, S. Planting Seedlings in Tree Islands Versus Plantations as a Large-Scale Tropical Forest Restoration Strategy. Rest. Ecol. 2011, 19, 470–479. [Google Scholar] [CrossRef]
  22. Huante, P.; Rincon, E.; Acosta, I. Nutrient Availability and growth Rate of 34 Woody Species from a Tropical Deciduous Forest in Mexico. Funct. Ecol. 1995, 9, 849. [Google Scholar] [CrossRef]
  23. Granados-Victorino, R.L.; Sánchez-González, A.; Martínez-Cabrera, D.; Octavio-Aguilar, P. Estructura y composición arbórea de tres estadios sucesionales de selva mediana subperennifolia del municipio de Huautla, Hidalgo, México. Rev. Mex. Biodivers. 2017, 88, 122–135. [Google Scholar] [CrossRef]
  24. Alba-García, L. Reclutamiento de leñosas en la selva seca de la localidad de El Limón de Cuauchichinola, Sierra de Huautla, Morelos, México. Ph.D. Thesis, Universidad Autónoma del Estado de Morelos, Cuernavaca, Morelos, Mexico, August 2011. [Google Scholar]
  25. Casas, A.; Vázquez, M.D.C.; Viveros, J.L.; Caballero, J. Plant management among the Nahua and the Mixtec in the Balsas River Basin, Mexico: An ethnobotanical approach to the study of plant domestication. Hum. Ecol. 1996, 24, 455–478. [Google Scholar] [CrossRef]
  26. Esquivel, M.J.; Harvey, C.A.; Finegan, B.; Casanoves, F.; Skarpe, C.; Nieuwenhuyse, A. Regeneración Natural de Árboles y Arbustos en Potreros Activos de Nicaragua. Available online: http://repositorio.bibliotecaorton.catie.ac.cr/handle/11554/6769?show=full (accessed on 1 April 2016).
  27. Bonfil, C.; Trejo, I. Plant Propagation and the Ecological Restoration of Mexican Tropical Deciduous Forests. Ecol. Restor. 2010, 28, 369–376. [Google Scholar] [CrossRef]
  28. Singh, A.N.; Singh, J.S. Experiments on Ecological Restoration of Coal Mine Spoil using Native Trees in a Dry Tropical Environment, India: A Synthesis. New For. 2006, 31, 25–39. [Google Scholar] [CrossRef]
  29. Mariano, N.A.; Martínez-Garza, C.; Alcalá, R.E. Differential herbivory and successional status in five tropical tree species. Rev. Mex. Biodivers. 2018, 89, 1107–1114. [Google Scholar] [CrossRef]
  30. González-Tokman, D.M.; Barradas, V.L.; Boege, K.; Domínguez, C.A.; del-Val, E.; Saucedo, E.; Martínez-Garza, C. Performance of 11 tree species under different management treatments in restoration plantings in a tropical dry forest. Rest. Ecol. 2018, 26, 642–649. [Google Scholar] [CrossRef]
  31. Cheesman, A.W.; Preece, N.D.; Van Oosterzee, P.; Erskine, P.D.; Cernusak, L.A.; Oosterzee, P. The role of topography and plant functional traits in determining tropical reforestation success. J. Appl. Ecol. 2017, 55, 1029–1039. [Google Scholar] [CrossRef]
  32. Martínez-Garza, C.; Campo, J.; Ricker, M.; Tobón, W. Effect of initial soil properties on six-year growth of 15 tree species in tropical restoration plantings. Ecol. Evol. 2016, 6, 8686–8694. [Google Scholar] [CrossRef]
  33. Huante, P. Growth responses of tropical deciduous tree seedlings to contrasting light conditions. Trees 1993, 7, 202–207. [Google Scholar]
  34. Huante, P. Influence of mineral nutrient availability on growth of tree seedlings from the tropical deciduous forest. Trees 1994, 9, 93–97. [Google Scholar]
  35. Markesteijn, L.; Poorter, L.; Bongers, F.; Paz, H.; Sack, L. Hydraulics and life history of tropical dry forest tree species: coordination of species’ drought and shade tolerance. New Phytol. 2011, 191, 480–495. [Google Scholar] [CrossRef] [Green Version]
  36. Dorado, O.; Maldonado, B.; Arias, D.M.; Sorani, V.; Ramírez, R.; Leyva, E.; Valenzuela, D. Programa de Conservación y Manejo Reserva de la Biosfera Sierra de Huautla, México; CONANP: Mexico City, Mexico, 2005; pp. 26–36.
  37. García, E. Modificaciones al Sistema de Clasificación Climática de Köppen (Para Adaptarlo a las Condiciones de la República Mexicana), 5th ed.; Instituto de Geología, UNAM: Mexico City, Mexico, 2004; pp. 19–20. [Google Scholar]
  38. CONAGUA. Servicio Metereólogico Nacional de la Comisión del Agua. Available online: https://smn.cna.gob.mx/es/ (accessed on 10 February 2016).
  39. CONAGUA. Comisión Nacional del Agua. Gerencia Regional Balsas. Available online: http://smn.cna.gob.mx/climatologia/normales/estacion/mor/NORMAL17057.TXT (accessed on 10 February 2016).
  40. García-Soriano, O.; Poblador de Quilamula, Morelos, Mexico; García-Soriano, E.; Poblador de Quilamula, Morelos, Mexico; Sánchez-García, H.; Poblador de Quilamula, Morelos, Mexico. Personal Communication, 2013.
  41. Siebe, C.; Jahn, R.; Stahr, K. Manual Para la Descripción y Evaluación Ecológica de Suelos en Campo, 2nd ed.; Instituto de Geología-UNAM: Mexico City, Mexico, 2006. [Google Scholar]
  42. IUSS Working Group WRB. World Reference Base for Soil Resources 2014, Update 2015 International Soil Classification Systems for Naming Soils and Creating Legends for Soil Maps; FAO: Rome, Italy, 2015. [Google Scholar]
  43. Villaseñor, J.L. Checklist of the native vascular plants of Mexico. Rev. Mex. de Biodivers. 2016, 87, 559–902. [Google Scholar] [CrossRef] [Green Version]
  44. Tropicos. Missouri Botanical Garden. Available online: http://www.tropicos.org (accessed on 26 November 2018).
  45. Ceccon, E.; Sanchez, S.; Campo, J. Tree seedling dynamics in two abandoned tropical dry forests of differing successional status in Yucatán, Mexico: a field experiment with N and P fertilization. Plant Ecol. 2004, 170, 277–285. [Google Scholar] [CrossRef]
  46. Anderson, J.; Ingram, J. Tropical Soil Biology and Fertility: A Handbook of Methods; C.A.B. International: Wallingford, UK, 1993. [Google Scholar]
  47. StatSoft, I. STATISTICA for Windows [computer program manual]. 7.0. Available online: http://www.statsoft.com (accessed on 10 May 2019).
  48. Zar, H.J. Biostatistical Analysis, 3rd ed.; Prentice-Hall, Inc.: Englewood Cliffs, NJ, USA, 1996. [Google Scholar]
  49. Ricker, M.; Ramírez, V.M.P.; Von Rosen, D. A New Method to Compare Statistical Tree Growth Curves: The PL-GMANOVA Model and Its Application with Dendrochronological Data. PLOS ONE 2014, 9, 112396. [Google Scholar] [CrossRef]
  50. Jara, P.; Martinez, E.; Campo, J. N and P dynamics in the litter layer and soil of Mexican semi-arid forests, state of Morelos. Agric. Ecosyst. 2009, 130, 164–170. [Google Scholar] [CrossRef]
  51. Paul, K.; Polglase, P.; Nyakuengama, J.; Khanna, P. Change in soil carbon following afforestation. Ecol. Manag. 2002, 168, 241–257. [Google Scholar] [CrossRef]
  52. Parrotta, J.A. Productivity, nutrient cycling, and succession in single- and mixed-species plantations of Casuarina equisetifolia, Eucalyptus robusta, and Leucaena leucocephala in Puerto Rico. Ecol. Manag. 1999, 124, 45–77. [Google Scholar] [CrossRef]
  53. Carrasco-Carballido, V. Early recruitment dynamics in tropical dry forest restoration settings. Manuscript in preparation.
  54. Tripathi, N.; Singh, R.S. Influence of different land uses on soil nitrogen transformations after conversion from an Indian dry tropical forest. CATENA 2009, 77, 216–223. [Google Scholar] [CrossRef]
  55. Yates, C.J.; Norton, D.A.; Hobbs, R.J. Grazing effects on plant cover, soil and microclimate in fragmented woodlands in south-western Australia: implications for restoration. Austral. Ecol. 2000, 25, 36–47. [Google Scholar] [CrossRef]
  56. Raghubanshi, A.S.; Srivastava, S.C.; Singh, R.S.; Singh, J.S. Nutrient release in leaf litter. Nat. Cell Boil. 1990, 346, 227. [Google Scholar] [CrossRef]
  57. Yang, M.; Yang, D.; Yu, X. Soil microbial communities and enzyme activities in sea-buckthorn (Hippophae rhamnoides) plantation at different ages. PLOS ONE 2018, 13, e0190959. [Google Scholar] [CrossRef] [PubMed]
  58. Mahmoud, A.; Singh, S.D.; Muralikrishna, K.S.; Pathak, H.; Saha, N.D. Soil microbial responses as influenced by Jatropha plantation under rainfed condition in north-west India. Agrofor. Syst. 2018, 92, 47–58. [Google Scholar] [CrossRef]
  59. Ahirwal, J.; Maiti, S.K. Development of Technosol properties and recovery of carbon stock after 16 years of revegetation on coal mine degraded lands, India. CATENA 2018, 166, 114–123. [Google Scholar] [CrossRef]
  60. Stern, M.; Quesada, M.; Stoner, K. Changes in Composition and Structure of a Tropical Dry Forest Following Intermittent Cattle Grazing. Rev. Biol. Trop. 2002, 50, 1021–1034. [Google Scholar]
  61. Griscom, H.P.; Griscom, B.W.; Ashton, M.S. Forest Regeneration from Pasture in the Dry Tropics of Panama: Effects of Cattle, Exotic Grass, and Forested Riparia. Restor. Ecol. 2009, 17, 117–126. [Google Scholar] [CrossRef]
  62. Gerhardt, K. Effects of root competition and canopy openness on survival and growth of tree seedlings in a tropical seasonal dry forest. Ecol. Manag. 1996, 82, 33–48. [Google Scholar] [CrossRef]
  63. Barajas-Guzmán, M.G.; Campo, J.; Barradas, V.L. Soil water, nutrient availability and sapling survival under organic and polyethylene mulch in a seasonally dry tropical forest. Plant Soil 2006, 287, 347–357. [Google Scholar] [CrossRef]
  64. Sampaio, A.B.; Holl, K.D.; Scariot, A. Does Restoration Enhance Regeneration of Seasonal Deciduous Forests in Pastures in Central Brazil? Restor. Ecol. 2007, 15, 462–471. [Google Scholar] [CrossRef]
  65. Thomas, S.C. Asymptotic height as a predictor of growth and allometric characteristics in malaysian rain forest trees. Am. J. Bot. 1996, 83, 556–566. [Google Scholar] [CrossRef]
  66. Huante, P.; Rincón, E.; Chapin, F.S., III. Foraging for nutrients, responses to changes in light, and competition in tropical deciduous tree seedlings. Oecologia 1998, 117, 209–216. [Google Scholar] [CrossRef]
  67. Martínez-Garza, C.; Tobon, W.; Campo, J.; Howe, H.F. Drought mortality of tree seedlings in an eroded tropical pasture. Land Degrad. Develop. 2013, 24, 287–295. [Google Scholar] [CrossRef]
  68. Núñez-Cruz, A.; Bonfil, C. Establecimiento inicial de tres especies del Bosque Tropical Seco en un pastizal degradado: efectos del uso de acolchado y composta. Agrociencias 2013, 47, 609–620. [Google Scholar]
  69. Bonfil, C.; Barrales-Alcalá, B.; Mendoza-Hernández, P.E.; Alavez, M.; García-Barrios, R. Los límites sociales del manejo y la restauración de ecosistemas: una historia en Morelos. In Experiencias Mexicanas en la Restauración de Los Ecosistemas; Ceccon, E., Martínez-Garza, C., Eds.; CONABIO-UNAM-, UAEM: Mexico City-Cuernavaca, Morelos, Mexico, 2016; pp. 323–345. [Google Scholar]
  70. Carrasco-Carballido, V. Evaluación de la sucesión natural y la recuperación de la función del ecosistema en la Selva Baja Caducifolia. Manuscript in preparation.
  71. Reich, P.B.; Hobbie, S.E.; Lee, T.; Ellsworth, D.S.; West, J.B.; Tilman, D.; Knops, J.M.H.; Naeem, S.; Trost, J. Nitrogen limitation constrains sustainability of ecosystem response to CO2. Nature 2005, 440, 922–925. [Google Scholar] [CrossRef]
  72. Elser, J.J.; Bracken, M.E.; Cleland, E.E.; Gruner, D.S.; Harpole, W.S.; Hillebrand, H.; Ngai, J.T.; Seabloom, E.W.; Shurin, J.B.; Smith, J.E. Global analysis of nitrogen and phosphorus limitation of primary producers in freshwater, marine and terrestrial ecosystems. Ecol. Lett. 2007, 10, 1135–1142. [Google Scholar] [CrossRef] [Green Version]
  73. Salinas-Peba, L.; Parra-Tabla, V.; Campo, J.; Munguía-Rosas, M.A. Survival and growth of dominant tree seedlings in seasonally tropical dry forests of Yucatan: site and fertilization effects. J. Plant Ecol. 2013, 7, 470–479. [Google Scholar] [CrossRef] [Green Version]
  74. Román-Dañobeytia, F.J.; Levy-Tacher, S.I.; Aronson, J.; Rodrigues, R.R.; Castellanos-Albores, J. Testing the Performance of Fourteen Native Tropical Tree Species in Two Abandoned Pastures of the Lacandon Rainforest Region of Chiapas, Mexico. Restor. Ecol. 2012, 20, 378–386. [Google Scholar] [CrossRef]
  75. Paul, M.; Catterall, C.P.; Pollard, P.C.; Kanowski, J. Recovery of soil properties and functions in different rainforest restoration pathways. Ecol. Manag. 2010, 259, 2083–2092. [Google Scholar] [CrossRef]
  76. Singh, J.S.; Raghubanshi, A.S.; Singh, R.S.; Srivastava, S.C. Microbial biomass acts as a source of plant nutrients in dry tropical forest and savanna. Nat. Cell Boil. 1989, 338, 499–500. [Google Scholar] [CrossRef]
  77. Roy, S.; Singh, J. Seasonal and spatial dynamics of plant-available N and P pools and N-mineralization in relation to fine roots in a dry tropical forest habitat. Soil Boil. Biochem. 1995, 27, 33–40. [Google Scholar] [CrossRef]
  78. Chapin, F.S.; Vitousek, P.M.; Van Cleve, K. The Nature of Nutrient Limitation in Plant Communities. Am. Nat. 1986, 127, 48–58. [Google Scholar] [CrossRef]
  79. Rivero-Villar, A.; Templer, P.H.; Parra-Tabla, V.; Campo, J. Differences in nitrogen cycling between tropical dry forests with contrasting precipitation revealed by stable isotopes of nitrogen in plants and soils. Biotropica 2018, 50, 859–867. [Google Scholar] [CrossRef]
Figure 1. Experimental design.
Forests 10 00428 g001
Figure 2. Kaplar–Meier curves of survival of (a) six tree species and (b) slow- and fast-growing species after 40 months growing in fenced plots at Quilamula, Morelos, Mexico. Species that do not share a letter showed significantly different survival under the log-rank comparison tests.
Forests 10 00428 g002
Figure 3. Forty months’ height lnRGR of six tree species growing in fenced plots at Quilamula, Morelos, Mexico. Height lnRGR for Erythrina americana is shown but this species was removed from RGR analysis due to low survival. Different letters show significant differences evaluated with Tukey test. Genera of fast-growing species are shown in bold.
Forests 10 00428 g003
Figure 4. Forty months’ diameter lnRGR of slow- (n = 2) and fast- (n = 3) growing species (a) and six tree species (b) growing in fenced plots at Quilamula, Morelos, Mexico. Diameter lnRGR for Erythrina americana is shown but this species was removed from RGR analysis due to low survival. Different letters show significant differences evaluated with Tukey test. Genera of fast-growing species are shown in bold.
Forests 10 00428 g004
Figure 5. Regression of survival as a function of PCA scores of soil properties in 2014 (a) for survival in 2014 and (b) survival in 2016 for all tree species irrespective of growth rank. Value of r2, regression line, and equation are shown.
Forests 10 00428 g005
Figure 6. Regression of survival as a function of PCA scores of soil properties in 2014 (a) for survival in 2014 and (b) survival in 2016 for slow-growing tree species. Value of r2, regression line, and equation are shown.
Forests 10 00428 g006
Figure 7. Regression of diameter lnRGR for (a) all tree species and (b) for fast-growing species as a function of PCA scores with soil properties in 2014. Value of r2, regression line, and equation are shown.
Forests 10 00428 g007
Table 1. Species and family by growth rank and references used for ranking of six species established in mixed plantings in Quilamula, Morelos, Mexico. Nomenclature follows [43] and [44].
SpeciesFamilyReference
Slow-growing species
Erythrina americana Mill.Fabaceae[23]
Crescentia alata KunthBignoniaceae [45]
Lysiloma divaricatum (Jacq.) J.F. Macbr.Fabaceae [24]
Fast-growing species
Spondias mombin L.Anacardiaceae[26]
Acacia coulteri Benth. 1Fabaceae[23]
Leucaena esculenta (DC) Benth.Fabaceae[25]
1 Other accepted name Mariosousa coulteri (Benth.) Seigler & Ebinger.
Table 2. Mean and standard error of topsoil (0–10 cm depth) properties in Quilamula, Morelos, Mexico. Soil properties in 2013 and 2014 and under minimal and maximal restoration intervention are shown. F and p values are from ANOVAs between years (2013 and 2014) and intervention (minimal and maximal).
Soil PropertiesYear Restoration Intervention
20132014F (1, 92)MinimalMaximalF (1,92)
pH6.61 ± 0.106.63 ± 0.110.020 ns6.57 ± 0.106.66 ± 0.110.39 ns
SOC (g m−2)19.16 ± 0.5424.16 ± 0.9719.71 **21.8 ± 0.7921.4 ± 0.930.150 ns
total N (g m−2)1.55 ± 0.041.54 ± 0.050.2 ns1.56 ± 0.041.53 ± 0.050.18 ns
C:N ratio12.48 ± 0.315.94 ± 0.625.97 **14.1 ± 0.4714.2 ± 0.050.23 ns
NH4+ (g m−2)76.61 ± 3.8520.34 ± 0.66206.27 ***46.7 ± 4.750.1 ± 5.080.73 ns
NO3 (g m−2)53.12 ± 4.311.42 ± 0.95133.4 ***32.9 ± 4.4531.6 ± 4.250.14 ns
NO3:NH4+0.74 ± 0.60.54 ± 0.356.62 *0.68 ± 0.060.60 ± 0.040.08 ns
total P (mg m−2)107.13 ± 2.56106.84 ± 3.690.004 ns107.9 ± 2.9106.7 ± 3.420.18 ns
available P (mg m−2)11.45 ± 0.3010.54 ± 0.442.85 ns10.5 ± 0.3811.2 ± 0.380.85 ns
* p < 0.05, ** p < 0.01, *** p < 0.001, ns = not significant.

