Article

Measuring the Labile and Recalcitrant Pools of Carbon and Nitrogen in Forested and Agricultural Soils: A Study under Tropical Conditions

by
Risely Ferraz de Almeida
1,*,
Joseph Elias Rodrigues Mikhael
2,
Fernando Oliveira Franco
3,
Luna Monique Fonseca Santana
1 and
Beno Wendling
1
1
Instituto de Ciências Agrárias, Universidade Federal de Uberlândia, Uberlândia, MG 38400, Brazil
2
School of Plant, Environmental and Soil Science, Louisiana State University, Baton Rouge, LA 70803, USA
3
Gerente Regional EPAMIG OESTE, Uberaba, MG 38060-040, Brazil
*
Author to whom correspondence should be addressed.
Forests 2019, 10(7), 544; https://doi.org/10.3390/f10070544
Submission received: 3 May 2019 / Revised: 18 June 2019 / Accepted: 24 June 2019 / Published: 28 June 2019
(This article belongs to the Section Forest Ecology and Management)

Abstract

:
Soil organic carbon and nitrogen can be divided into labile and recalcitrant pools according to the time it takes to be cycled. The way in which carbon and nitrogen pools are cycled and distributed between labile and recalcitrant pools can directly relate to soil quality. This paper tested the hypothesis that labile and recalcitrant pools of carbon and nitrogen vary between agricultural soils with different species and fertilization management systems (nitrogen, phosphorus, and potassium need) under tropical conditions. This study aimed to examine the impact of land-uses on stocks and losses of carbon and nitrogen under tropical conditions. We explored labile (soil microbial biomass and labile carbon) and recalcitrant carbon pools (humin, humic acid, and fulvic acid) in forested and agricultural soils, defined as latosol (forest, fertilized pasture, and unfertilized pasture) and cambisol (forest, coast pasture, sugarcane, and silage corn). Forested soil was used as an appropriate use to soil conservation in tropical that presents levels adequate of carbon and nitrogen stocks and biological condition in soil. Results showed that pools of labile and recalcitrant carbon are different on soil layers and the use of soil. Forest use in cambisol and latosol promoted higher labile and recalcitrant pools of carbon and nitrogen due to the greater environmental stability without human intervention. On the other hand, human intervention occurred in fertilized pasture and coast pasture; however, both uses presented similar recalcitrant carbon and nitrogen pools when compared to forested soil on the soil surface due to fertilizer uses and the high volume of the grass root system. Overall, our findings reveal that under tropical conditions, agriculture and forested soil can present similar recalcitrant pools of carbon and nitrogen if agricultural soils are associated with the appropriate fertilizer management. Pasture with adequate fertilization management systems can be used as an alternative to recover degraded areas with low levels of recalcitrant carbon and nitrogen pools.

1. Introduction

Soil organic matter (SOM) quality and management is the main factor to be considered in sustainable agricultural production [1]. SOM is an important attribute of soil fertility and biology that provides nutrients, increases the soil cation exchange capacity (CEC), and housing for the microbial population [2,3]. The misuse and bad management of natural ecosystems for agricultural activities can result in losses that exceed 50% of the carbon in the SOM, especially in sandy soils [4].
Labile carbon pools (LCP) can be represented by soil microbial biomass (SMB) and labile carbon (labile-C), which exhibit characteristics of fast decomposition and are a great indicator of soil quality [1]. On the other hand, recalcitrant carbon pools (RCP) take more time to decompose and are not readily available to microorganisms [5]. The RCP can be represented by humic substances (humin—HU, humic acid—HA, and fulvic acid—FA) [1]. Total organic carbon (TOC) is represented by the sum of labile and recalcitrant pools, which is characterized as a heterogeneous mixture of organic materials in soil, complex organic compounds, fresh litter, and carbohydrates [5,6].
The SMB and labile-C demonstrate strong capacities to detect any changes in the labile carbon associated with soil use and management [7,8,9]. Labile-C is the main source of energy for soil microorganisms and is directly related to nutrient cycling and bioavailability [10]. The SMB is mostly composed of bacteria and fungi, which have a very short life cycle. Microbial population and activity are highly influenced by temperature, pH, water content, and nutrient availability. Based on that, the microbial abundance can be quickly modified by changes in land use and management [10].
Labile-C is mainly responsible for supplying nutrients to plants through mineralization processes, as well as providing energy and carbon to soil microorganisms [11]. Additionally, SMB is an indicator and an active pool of SOM dynamics responsible for biogeochemical and biological processes [12,13].
Recalcitrant carbon pools show high variability in their chemical composition, stage of decomposition, and play role in soil functioning and health [1]. Humic substances represent 60%–80% of the TOC with the highest concentration of HU, followed by FA or HA [7]. Among them, HU presents the greatest concentration in soil and strong resistance against microbial degradation due to higher proportions of aromatic functions and bonds to mineral components [1]. Therefore, both pools recalcitrant and labile can elucidate how the soil has been used and which management is adequate to increase carbon stocks, mainly in tropical conditions.
Tropical climate zones suffer the greatest rainfall-related soil erosion with high levels of carbon losses. According to the Global Assessment of Soil Degradation (GLASOD), an estimated2 billion hectares (22.5%) of agricultural land, forest, pasture, and woodland had been degraded since the mid-twentieth century. For example, Brazil has approximately 200 million hectares of native or implanted pastures, with 130 million hectares with a medium-high level of degradation and requiring some intervention to reverse this state. Alternative management to recover these degraded areas with low levels of recalcitrant carbon and nitrogen pools in tropical conditions are requested to soil conservation in sustainable agriculture.
To better understand the labile and recalcitrant pools of carbon and nitrogen in forested and agricultural soils; and test the hypothesis that labile and recalcitrant carbon pools vary between agricultural soils with different species and fertilization management systems under tropical conditions. This study aimed to examine the impact of land-uses on carbon and nitrogen stocks and losses under tropical conditions with different uses and management of soil to find a possible alternative do recover degraded areas with low levels of recalcitrant carbon and nitrogen pools.

2. Materials and Methods

2.1. Sites

This study was conducted at EMBRAPA Gado de Leite in Coronel Pacheco-MG, Brazil (−21°14′ S, −43°15′ W, 435 m). The average annual temperature is 21 °C and the average annual rainfall is 1581 mm [14].
Soils were collected from slopes at the riverbank. Soil was classified according to the Brazilian Soil Classification System [15] as a Latossolo and Cambissolo, corresponding to latosol and cambisol, respectively in the World Reference Base (WRB/FAO) [16].
Carbon and nitrogen pools were monitored in both soils. The treatments in the latosol were as follows: forest-FO, fertilized pasture-FP, and unfertilized pasture-UP; the treatments in the cambisol were as follows: forest—FC, coast-cross pasture—CC, sugarcane—SC and silage corn—CS. Soils were collected with a soil probe from an area of 1 hectare of each treatment, with four replications in two distinct depth ranges within each soil type (0.0 to 0.1 m and 0.1 to 0.2 m).

2.2. Site History

Historically, the latosol areas were deforested in 1950 and firstly seeded with Angola grass (Panicum numidianum), which was replaced in 1998 by elephant grass (Pennisetum purpureum) until the year 2002. In 2003, these areas were seeded with Brachiaria sp. that was not initially fertilized. Then, 250 kg ha−1 of 20–05–20 fertilizer was applied following the pasture establishment. The nitrogen source was urea, the phosphorus source was single superphosphate and the potassium source was potassium chlorate, applied in top dress (Table 1).
In the cambisol areas, the deforestation occurred in 1935. The silage corn (Zea mays L.) in the treatment CS was first planted in 1986. The fertilization occurred twice per year since the corn was harvested two times for silage, which is a common practice in tropical regions. Additionally, the coast cross grass (Cynodon dactylon L.) area was established in 1992 with a fertilizer application rate of 200 kg ha−1 for N, P2O5, and K2O until 2002. After 2002, this rate was changed to 1 Mg ha−1 of the formulation 05–20–20, with the addition of 50 kg ha−1 of N top dressed in summer. Liming was performed at the time of planting using 3 Mg ha−1 of limestone and after planting at a rate of 1 Mg ha−1 every two years. In 1979, Angola grass was established on the area without fertilizer management. From 1980 until 1982 the area was cultivated with oat (Avena strigosa Schreb.) intercropped with ryegrass (Lolium multiflorum Lam.) under irrigated pasture management in winter (Table 1).
Sugarcane crop (Saccharum officinarum L.) was implemented in 1990 under a regime of fertilizer application using 300 kg ha−1 of 8–30–16 until the fifth year. The site reached a productivity level of 70 Mg ha−1 over the first four years but declined thereafter to less than 40 Mg ha−1 because of fertilization absence. The cultivation of sugarcane was preceded by Angola grass without fertilizer application and horticultural crops until 1989, as seen in Table 1. More details about fertilization systems from all areas can be found in [17].
Both soil types shared the common treatments comprising Cerrado biome vegetation, (FO and FC), which have the characteristics of secondary forest that has recovered following deforestation (Table 1).

2.3. Soil Analysis and Statistical Analysis

TOC was determined through wet combustion [18] and total organic nitrogen (TON) by using sulfuric acid digestion with subsequent Kjeldahl distillation [19]. The carbon from the humic substances (humin, fulvic acid, and humic acid) was determined by differential solubility, established by the International Society of Humic Substances and described by [20].
Labile carbon was determined through the process of oxidation using 0.033 M KMnO4 [21]. Carbon and nitrogen from SMB were determined using the method of irradiation-extraction [22] and a flow conversion factor (Kc) of 0.33 [23] and 0.54 [24], respectively, for carbon and nitrogen.
The descriptive statistics assessed included the mean, standard deviation, minimum, and maximum values. Assumptions of normality and homogeneity of variance were validated using the Shapiro–Wilk test and Bartlett test, respectively; outliers were identified with the Grubbs test.
Principal component analysis (PCA) was also used to assess variation between the surface (0.0–0.1 m) and subsurface (0.1–0.2 m) treatments using the variables: TOC, TON, labile-C, SMB-C, and SMB-N. The PCA data group was standardized to obtain a zero mean and constant variance, and the Euclidean distance and the Ward algorithm were calculated. Principal component (PC) values greater than 1 were used when observing correlation group similarity to obtain relevant information.
Carbon and nitrogen stocks in forested soils (latosol—FO and cambisol—FC) were used as carbon and nitrogen loss parameters to calculate the difference in carbon and nitrogen balance in agriculture soil. Univariate differences in measures of TON, labile-C, SMB-C, SMB-N, and humic substance from the surface and subsurface treatments were assessed using the analysis of variance (ANOVA) based on the F-test. Where the F-test was significant at the level of p ≤ 0.05, the different treatments were compared using Tukey tests (p ≤ 0.05). Land-uses were not compared using the ANOVA test when results represented by the mean due to lack of replication.

3. Results

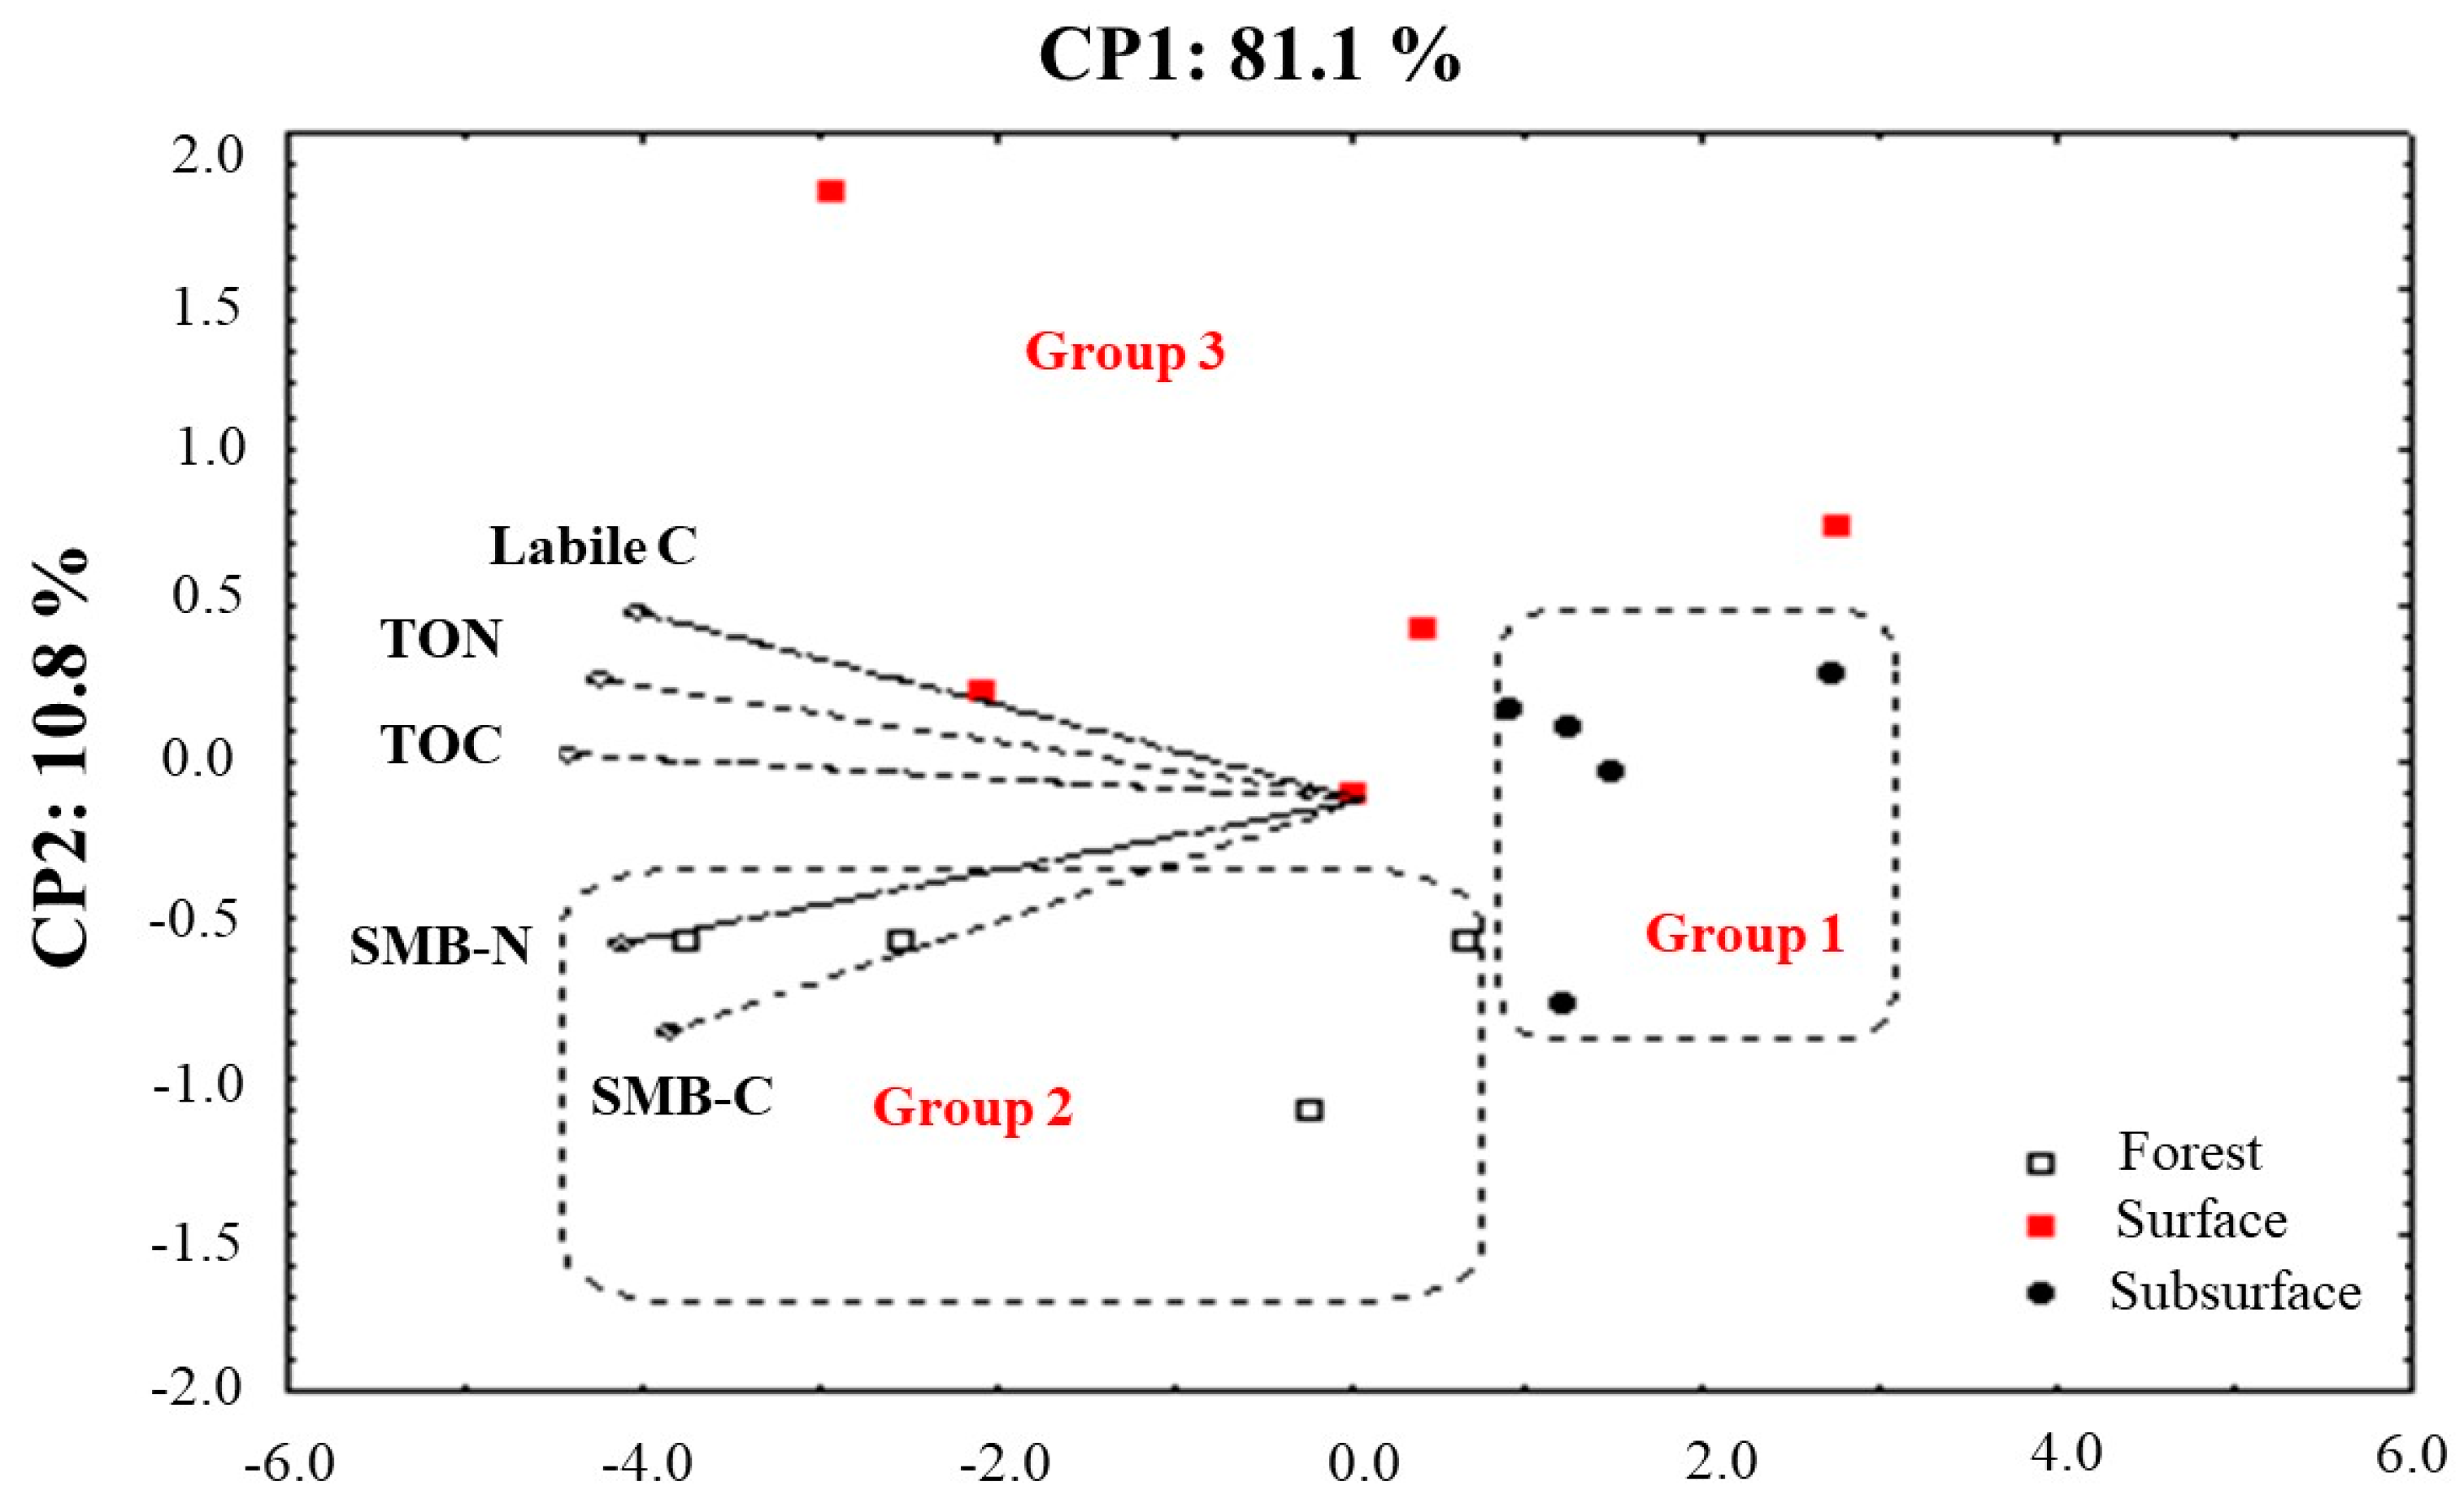
3.1. Carbon and Nitrogen Pools (Surface and Subsurface)

Soil surface presented higher stocks of carbon and nitrogen (TON, labile-C, SMB-C, and SMB-N) compared to the subsurface. There was a major difference between forested (Group 2) and agricultural soils with respect to the surface and subsurface group, as evidenced by the clear grouping of observations (Group 1–3). Also, there was a notable difference between agricultural soils for the surface group (Group 3), with comparatively higher dispersion among observations (Figure 1).
In PCA, TOC, TON, and labile-C presented similar results, as indicated by the close vector observable in the biplot (Figure 1). The SMB for both C and N also presented a strong correlation but with variance associated with CP2 (Figure 1 and Table 2).
The PCA variance was associated along the axis CP1, which explained 81.1% of the variance, followed by CP2 with 10.8%, and these components together accounted for 91.9% of the total variance (Figure 1 and Table 2).
A review of the biplot shows that all nitrogen and carbon pools were strongly related to CP1 (TOC: −0.98; TON: −0.94; SMB-C: −0.85; SMB-N: −0.92; labile-C: −0.89), but there was no significant correlation with CP2 (Table 2).

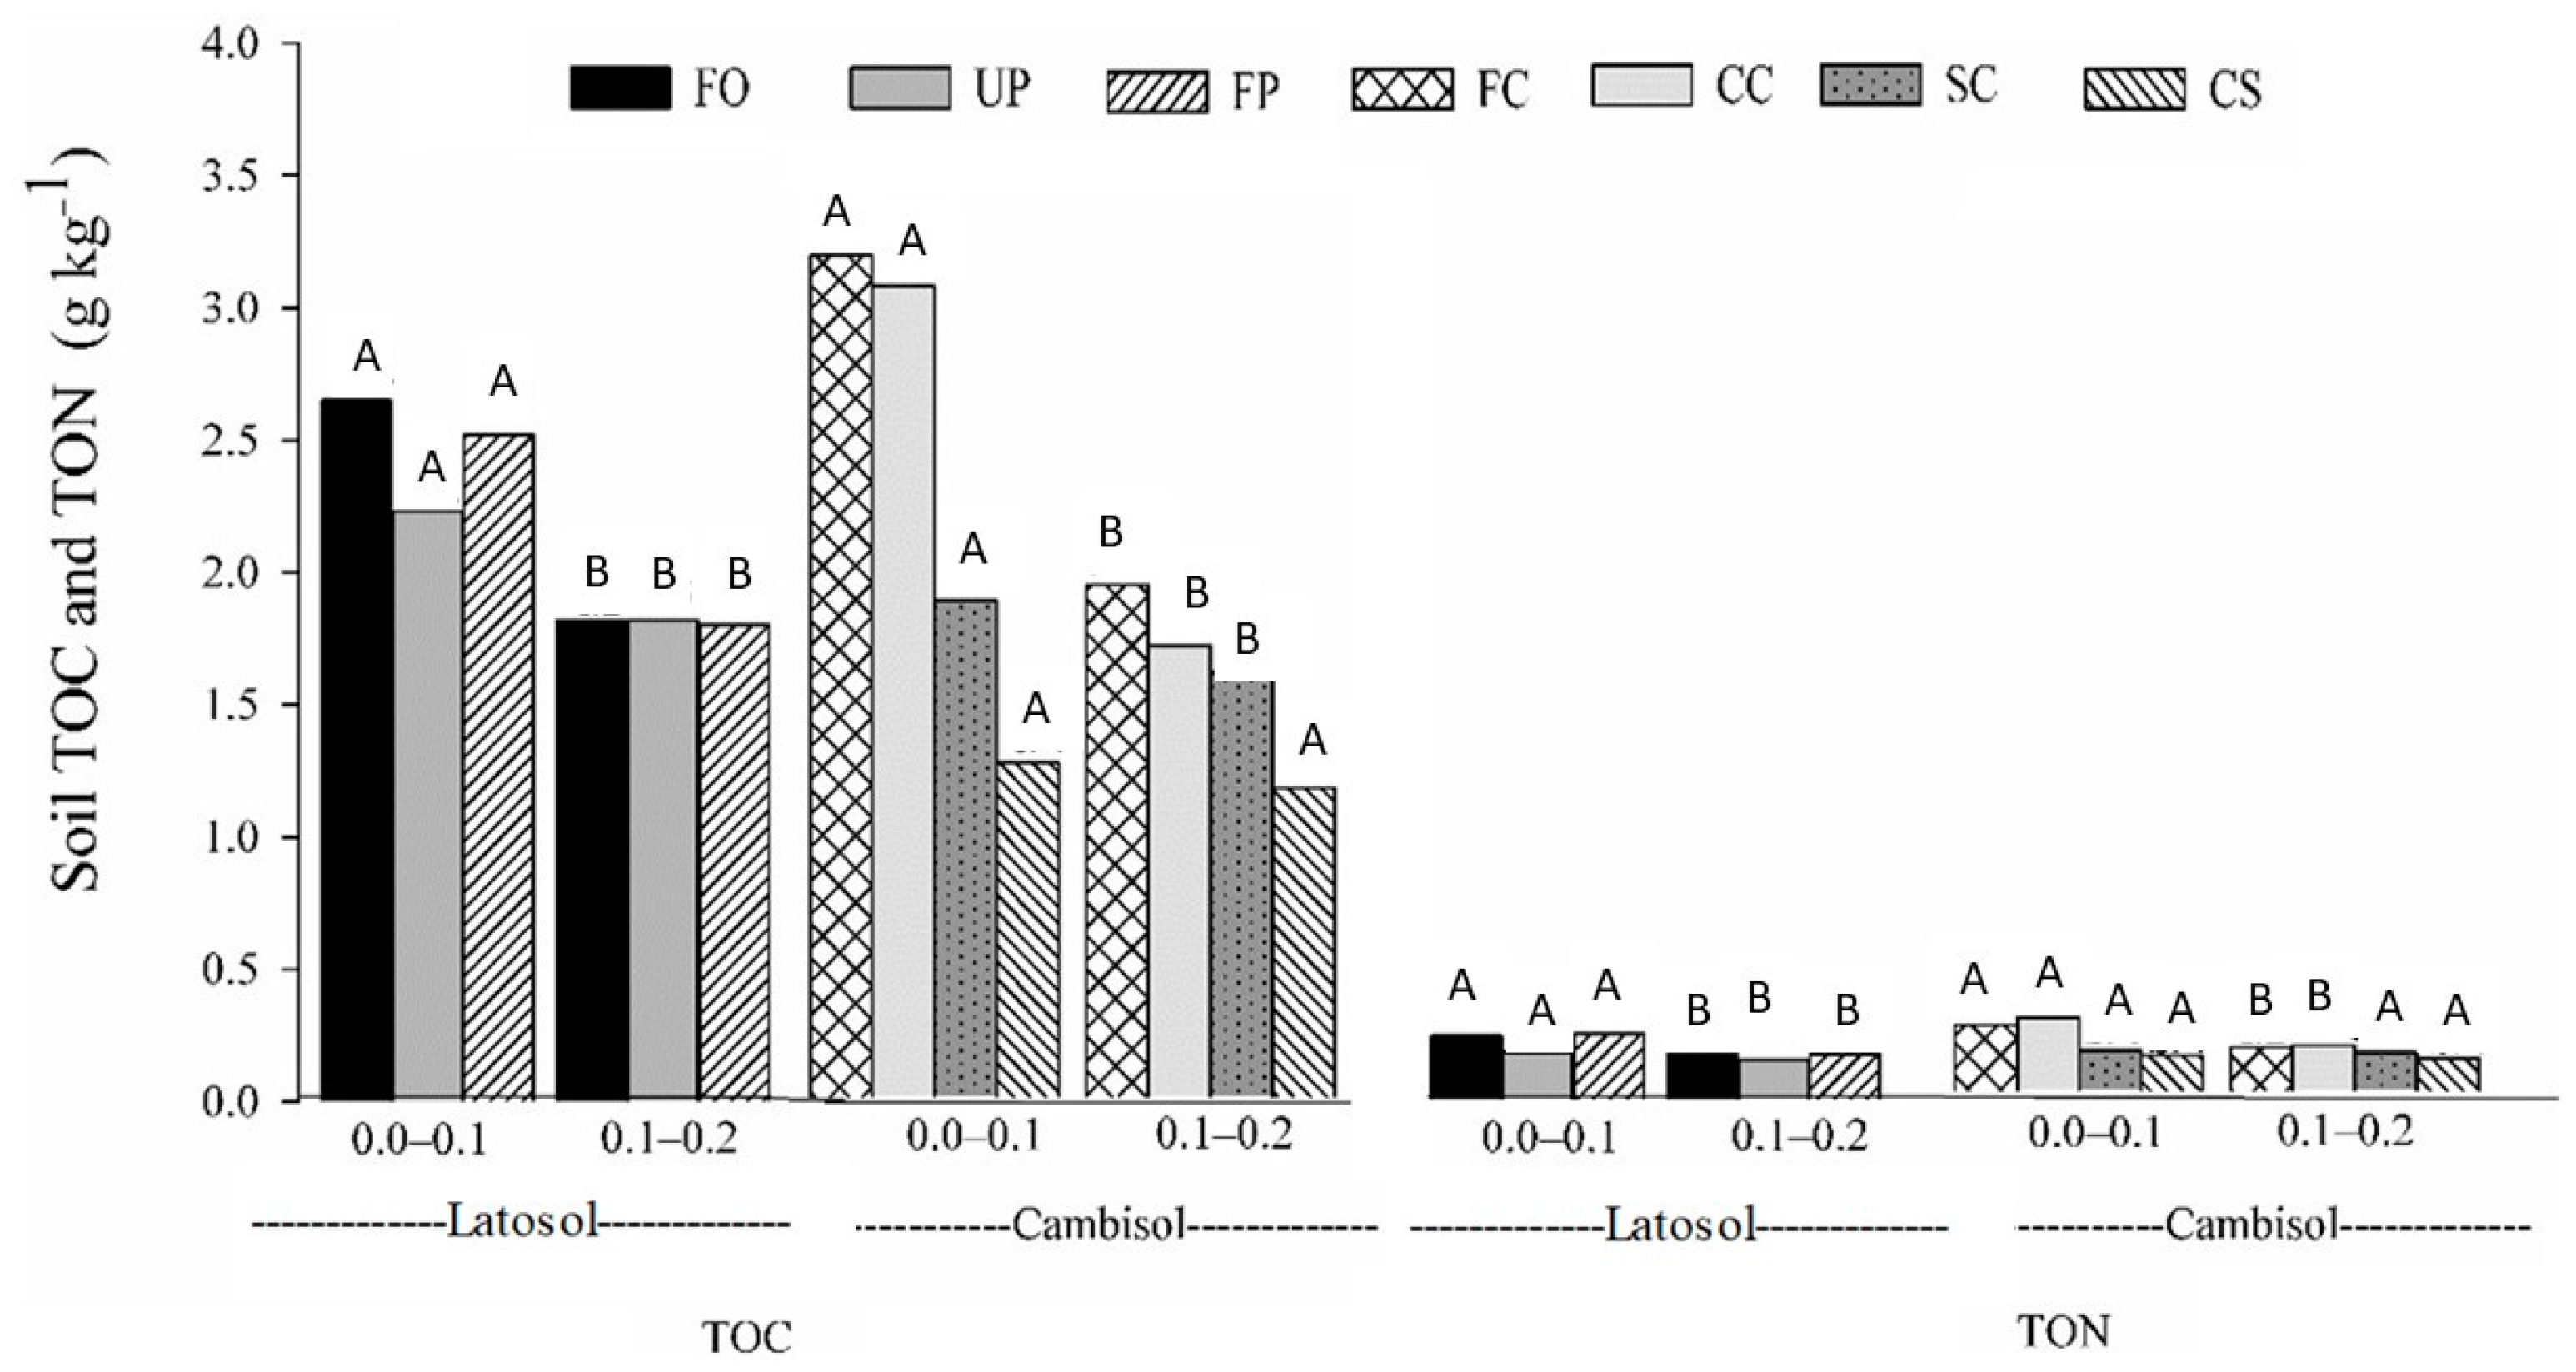
3.2. Total Organic Carbon

Both soil types presented higher values for TOC and TON accumulation within forest treatments, with significant differences and means of 2.65 and 1.82 g kg−1 in latosol, and 3.32 and 2.02 g kg−1 in cambisol, respectively, for the surface and subsurface layers. TON and TOC presented higher accumulations in the surface layer with a mean increase of 29% and 24%, respectively, when compared to subsurface (Figure 2).
Focusing on latosol, FP presented higher contents of TOC and TON, representing an increase of 28% and 15% compared to UP in the soil surface. On the other hand, there was no difference between soil uses in the subsurface, despite a significant reduction in TOC and TON (Figure 2).
For cambisol, the different managements yielded significant declines in the concentration of TOC and TON between layers, as evidenced by mean decreases of 32% and 28% compared to forested soil, respectively, except for the CC treatment. CC revealed mean values of 1.27 and 0.13 g kg−1 for TOC and TON within layers, respectively (Figure 2). Therefore, land use influences the accumulation of TOC and TON, which subsequently yielded higher concentrations when associated with the practice of fertilization and pasture use.

3.3. Soil Recalcitrant Carbon

For recalcitrant carbon, HU presented the highest concentration compared to HA and FA, mainly at the surface, representing a low carbon concentration to soluble fractions. In latosol, UP presented the lowest concentration of the humic substance fractions, while FO promoted higher carbon stocks (Table 3).
Forest also presented the highest concentration of humic substances in cambisol, with a more evident difference compared to FA and an increase of 23% compared to CC. Interestingly, the means of FO and CC for HU and HA fractions were similar, which are considered more stable than FA. On the other hand, CS presented the lowest concentration in all the fractions (Table 3).

3.4. Labile Carbon

Labile-C exhibited higher concentrations within the superficial soil layer with a significant mean increase of 34% for all environments, except for the CS treatment, where the mean was only 1.39 g kg−1 (Figure 3).
Forest treatment provided the highest labile-C stocks with a mean of 2.37 g kg−1 (surface) in latosol, which equates to an increase of 21% compared to FP. The CC exhibited the highest labile-C concentration, with a mean of 2.36 g kg−1, and considered 8% greater than the forest in cambisol (Figure 3).
The SMB-C and SMB-N decreased with depth for all management systems, showing a mean decline of 24% and 25%, except for the CS treatment, which demonstrated an opposite trend with a mean of 146.5 and 24 mg kg−1, respectively (Figure 4).
In both, latosol and cambisol, the forest provided higher SMB-C and SMB-N concentrations in the surface layer with a mean of 857.5 and 76 mg kg−1, respectively (Figure 4). In latosol, UP did not yield any differences in SMB-C and SMB-N between soil layers, with means of 434.5 and 49.0 mg kg−1, respectively. Additionally, SC and CS in cambisol presented means of 312.5 and 46 mg kg−1 and 146.5 and 24.0 mg kg−1, respectively. In addition, observations of latosol SMB-C and SMB-N did not highlight any significant differences among UP in the subsurface layer. In cambisol, FC was the land-use that presented the highest SMB-N and SMB-C concentrations, with means of 431.5 and 48 mg kg−1, respectively (Figure 4).

3.5. Effect of Soil Use and Management on Carbon and Nitrogen Losses

Using the forest in both soils as adequate carbon and nitrogen loss parameters, turned evident that the carbon and nitrogen losses were higher in land-use with agriculture culture, represented by CS and SC. CS presented the highest losses of around 50% of carbon and nitrogen, following by SC with 30% (Table 4).
Interestingly, for latosol, FP improved the soil carbon and nitrogen stocks, revealing the evident positive effect of pasture with fertilization on recalcitrant pools with the increment of carbon (+16%) and nitrogen (+2%). For cambisol, CC (pasture also fertilized) increased recalcitrant nitrogen stock (+8%) but presented no effect on carbon stocks (Table 4).

4. Discussion

The data showed that labile and recalcitrant carbon pools were most strongly related to the soil surface, as seen by higher labile-C and SMB-C concentrations compared to the subsurface layer. These results were expected and are due to greater plant biomass production and associated organic material deposition. Therefore, the results in this paper corroborate those reported in a previous study, which evaluated the rate of stratification in latosol, after ten years of no-tillage [25]. The fact that there was no large difference between forested and agricultural soil in regard to the subsurface group may also be associated with the low C concentration.
For forested soil (in latosol and cambisol), the highest values for recalcitrant carbon pool accumulation due to greater environmental stability resulted from the absence of human intervention and the constant maintenance of plant residues. In this way, it appears that soil disturbance disrupts the aggregation to expose the carbon and make it more available to microorganisms.
For cambisol, the different management strategies provided a reduction in TOC and TON concentrations for all soil uses, except for the CC treatment in recalcitrant N pool. The CS and SC homogeneity are, likely, due to the specific management of the area, which focuses on soil disturbance in the 0–0.2 m layer. Furthermore, the historical sequence of horticultural crops in the area may have exacerbated this homogeneity, through intense soil tillage and subsequent long periods of aeration. This may similarly explain why SC and CS had low concentrations of recalcitrant carbon pools and TON in soil and suggested high C and N losses due to the prevalence of plowing and harrowing.
For tropical soils, TOC and TON appear to decline rapidly when intensively managed crops are cultivated, as we observed for CS and SC treatment with 50% and 30% of carbon and nitrogen losses compared to forested soil, respectively. Moreover, the use of post-harvest burning for SC can further exacerbate these decreases in TOC and TON. Similar decreases of 70% and 47%, respectively, for the concentration of C and N were found in areas under continuous cultivation of sugarcane with burning, when compared to management approaches that used raw sugarcane (without burning) residue [26]. Therefore, maintaining sugarcane straw residue on the surface of the soil can directly promote increases in C and N with subsequent increases in the inputs of SOM [27].
Generally, observation of higher labile-C accumulation in surface soil layers from all environments, except CS, is most likely due to the contribution of organic matter on the soil surface, which leads to greater carbon stocks (predominantly labile-C) in this layer [27].
In CC, labile-C stocks were higher probably due to soil management systems that utilize residues with the low human intervention resulting in higher levels of labile-C. The rapid oxidation of C is related to its ease of degradation; thus, the labile fraction best reflected the most recent changes in management [28]. According to [11], the accumulation of C in labile SOM fractions demonstrated great soil biological dynamism, being influenced by the chemical composition of the residue returned to the soil, the availability of the substrate by climatic factors (temperature and soil moisture), and especially the management system adopted.
On the soil surface, the SMB-C showed initial changes in the C pool dynamics, which suggested rapid cycling and marked responses to seasonal fluctuations in moisture and temperature. Consequently, waste management and changes in management systems rapidly and profoundly affect the compartment of SOM. Within forests, the high SMB-C and SMB-N concentrations are due to the greater concentrations of TOC and TON, which implies enhanced activity by microorganisms and a closer balance between the processes of mineralization and immobilization.
In latosol, the fact that SMB-C and SMB-N were similar among the treatments FO, UP, and FP in the 0.1–0.2 m layer, was probably because the availability of C was temporarily higher in organically managed plots, and because they contain significantly higher amounts of soluble organic carbon [28,29]. These organic compounds enhance SMB because they increase the proportion of C and N-labile and thereby directly stimulate the activity of SMB.
In cambisol, CC presented the highest SMB-N and SMB-C concentrations and was closest to FC. Moreover, the lowest carbon and nitrogen losses were associated with CC- treatment. Therefore, our hypothesis of a decrease of N pools in land-uses is not adequate for CC treatment with positive recalcitrant nitrogen contribution. These results are likely to be due to the greater amount of organic material in soil which favored microbial development since the CC is a perennial with a large root system crop. Generally, of all the plant species used as cover crops, grasses have the greatest capacity to provide carbon to soil because of their extensive root systems that are constantly regenerated [30,31].
The SC and CS presented low concentrations of SMB-C and SMB-N, most likely due to the processes of plowing, coupled with the removal of plant material (crop), together with reduced TOC and TON, which are substrate and energy sources to SMB activity. Among these, the CS treatment had a lower concentration. The lower TOC and TON concentrations are due to the use of mineral fertilizers that have a lower rate of SMB activity compared with systems using organic material [29].

5. Conclusions

Labile and recalcitrant pools of carbon and nitrogen present different pools of carbon and nitrogen for different soil layers, being more pronounced in the surface layers, as evidenced by the higher correlation between labile carbon and total organic carbon.
Forest use in cambisol and latosol promotes higher labile and recalcitrant pools of carbon and nitrogen because of the constant addition of organic material and the greater environmental stability brought about through an absence of human intervention. Surprisingly, however, despite the clear human intervention characterizing FP (latosol) and CC (cambisol), these presented similar labile and recalcitrant carbon pools when compared to the soil surface layers of forest under a tropical condition. Moreover, FP and CC presented lower N and C losses due to pasture fertilization with the positive contribution of recalcitrant carbon and nitrogen for latosol being more evident.
Overall, our findings reveal that under tropical conditions, agriculture and forested soil can present similar recalcitrant pools of carbon and nitrogen if agriculture soils are associated with the appropriate fertilizer management and use. Pasture with adequate fertilization management systems can be an alternative to recover degraded areas with low levels of recalcitrant carbon and nitrogen pools.

Author Contributions

All the authors contributed significantly to the conclusion of this manuscript. R.F.d.A. wrote the paper. J.E.R.M., F.O.F., and L.M.F.S. assisted in writing the paper. B.W. collected and analyzed the data.

Funding

This research received no external funding.

Acknowledgments

The authors thank the Universidade Federal de Uberlândia/Pró reitoria de Pesquisa e Pós Graduação (UFU); the Coordenação de Aperfeiçoamento de Pessoal de Nível Superior (CAPES), the Fundação de Amparo à Pesquisa do Estado de Minas Gerais (FAPEMIG), the Conselho Nacional de Desenvolvimento Científico e Tecnológico (CNPq), and the Soil Science Department—Universidade de Viçosa (UFV), for the financial support. The Empresa Brasileira de Pesquisa Agropecuária (EMBRAPA/CNPGL) for the concession of the study área.

Conflicts of Interest

The authors declare no conflict of interest.

References

  1. Stevenson, F.J. Humus Chemistry: Genesis, Composition, Reactions, 2nd ed.; John Wiley & Sons: New York, NY, USA, 1994; p. 496. [Google Scholar]
  2. Scherer, E.E.; Baldissera, I.T.; Nesi, C.N. Propriedades químicas de um Latossolo Vermelho sob plantio direto e adubação com esterco de suínos. Rev. Bras. Cienc. Solo 2007, 31, 123–131. [Google Scholar] [CrossRef]
  3. Balota, E.L.; Calegari, A.; Nakatani, A.S.; Coyne, M.S. Benefits of winter cover crops and no-tillage for microbial parameters in a Brazilian Oxisol: A long-term study. Agric. Ecosyst. Environ. 2014, 197, 31–40. [Google Scholar] [CrossRef] [Green Version]
  4. Mielniczuk, J.; Bayer, C.; Vezzani, F.M.; Lovato, T.; Fernandes, F.F.; Debarba, L. Manejo de solo e culturas e sua relação com os estoques de carbono e nitrogênio do solo. Tópicos Ciência Solo 2003, 3, 209–248. [Google Scholar]
  5. Lal, R. Soil carbon sequestration to mitigate climate change. Geoderma 2004, 123, 1–22. [Google Scholar] [CrossRef]
  6. Almeida, R.F.; Machado, H.A.; Martins, F.P.; Queiroz, I.D.S.; Teixeira, W.G.; Mikhael, J.E.R.; Borges, E.N. Correlação do tamanho e distribuição dos agregados em Latossolos amarelo da região do triângulo mineiro em diferentes ambientes. Biosci. J. 2014, 30, 1325–1334. [Google Scholar]
  7. Almeida, R.F.; Silveira, C.H.; Mikhael, J.E.R.; Franco, F.O.; Ribeiro, B.T.; Ferreira, A.S.; Mendonça, E.S.; Wendling, B. CO2 emissions from soil incubated with sugarcane straw and nitrogen fertilizer. Afr. J. Biotechnol. 2014, 13, 3376–3384. [Google Scholar] [CrossRef]
  8. Loss, A.; Pereira, M.G.; Schultz, N.; Anjos, L.H.C.; Silva, E.M.R. Carbono e frações granulométricas da matéria orgânica do solo sob sistemas de produção. Rev. Ciênc. Rural 2009, 39, 1067–1072. [Google Scholar] [CrossRef]
  9. Panosso, A.R.; Marques, J.; Pereira, G.T.; La Scala, N. Spatial and temporal variability of soil CO2 emission in a sugarcane area under green and slash-and-burn managements. Soil Tillage Res. 2009, 105, 275–282. [Google Scholar] [CrossRef]
  10. Theng, B.K.G.; Tate, K.R.; Sollins, P. Constituents of organic matter in temperate and tropical soils. In Dynamics of Soil Organic Matter in Tropical Ecosystems; Coleman, D.C., Oades, J.M., Uehara, G., Eds.; NiftTAL Project; University of Hawaii: Honolulu, HI, USA, 1989. [Google Scholar]
  11. Silva, I.R.; Mendonça, E.S. Matéria orgânica do solo. In Fertilidade do Solo; Novais, R.F., Alvarez, V.H., Barros, N.F., Fontes, R.L.F., Cantarutti, R.B., Neves, J.C.L., Eds.; Sociedade Brasileira de Ciência do Solo: Viçosa, Brazil, 2007. [Google Scholar]
  12. Lundquist, E.J.; Jackson, L.E.; Scow, K.M.; Hsu, C. Changes in microbial biomass and community composition, and soil carbon and nitrogen pools after incorporation of Rye into three California agricultural soils. Soil Biol. Biochem. 1999, 31, 221–236. [Google Scholar] [CrossRef]
  13. Catellan, A.J.; Vidor, C. Flutuações na biomassa, atividade e população microbiana do solo, em função de variações ambientais. Rev. Bras. Ciênc. Solo 1990, 14, 133–142. [Google Scholar]
  14. Embrapa—Empresa Brasileira de Pesquisa Agropecuária. Serviço Nacional de Levantamento e Conservação de Solos; Levantamento de reconhecimento de meia intensidade dos solos e avaliação da aptidão agrícola das terras do Triângulo Mineiro; Embrapa-Snlcs: Rio de Janeiro, Brazil, 1982; p. 562. [Google Scholar]
  15. Embrapa—Empresa Brasileira de Pesquisa Agropecuária. Sistema Brasileiro de Classificação de Solos, 2nd ed.; Embrapa: Rio de Janeiro, Brazil, 2006; p. 412. [Google Scholar]
  16. Buol, S.W.; Southard, R.J.; Graham, R.C. Soil Genesis and Classification, 5th ed.; Blackwell Publishing: Ames, IA, USA, 2003. [Google Scholar]
  17. Wendling, B. Carbono e Nitrogênio no Solo Sob Diferentes Usos e Manejos e Sua Modelagem Pelo Century. Universidade de Viçosa, Viçosa-MG, Brazil. Available online: http://www.locus.ufv.br/bitstream/handle/123456789/1645/texto%20completo.pdf?sequence=1&isAllowed=y (accessed on 6 June 2018).
  18. Yeomans, J.C.; Bremner, L.M. A rapid and precise method for routine determination of organic carbon in soil. Commun. Soil Sci. Plant Anal. 1988, 19, 1467–1476. [Google Scholar] [CrossRef]
  19. Tedesco, M.J.; Bohnem, H.; Gianello, C.; Bissani, C.A.; Volkweiss, S.J. Análise de Solo, Plantas e Outros Materiais, 2nd ed.; Universidade Federal do Rio Grande do Sul: Porto Alegre, Brazil, 1995; p. 174. [Google Scholar]
  20. Swift, R.S. Organic Matter Characterization. In Methods of Soil Analysis: Chimical Methods; Sparks, D.L., Page, A.L., Helmke, P.A., Loeppert, R.H., Soltanpour, P.N., Tabatabai, M.A., Johnston, C.T., Sumner, M.E., Eds.; SSSA Book Series 5; Soil Science Society of America; American Society of Agronomy: Madison, WI, USA, 1996; Volume 3, pp. 1011–1020. [Google Scholar]
  21. Shang, C.; Tiessen, H. Organic matter lability in a tropical oxisol: Evidence from shifting cultivation, chemical oxidation, particle size, density and magnetic fractionations. Soil Sci. 1997, 162, 795–807. [Google Scholar] [CrossRef]
  22. Islam, K.R.; Weil, R.R. Microwave irradiation of soil for routine measurement of microbial biomass carbon. Biol. Fertil. Soils 1998, 27, 408–416. [Google Scholar] [CrossRef]
  23. Sparling, G.P.; West, A.W. A direct extraction method to estimate soil microbial C: Calibration in situ using microbial and 14C labelled cells. Soil Biol. Biochem. 1988, 20, 337–343. [Google Scholar] [CrossRef]
  24. Brookes, P.C.; Landman, A.; Pruden, G.; Jenkinson, D.S. Chloroform fumigation and the release of soil nitrogen: A rapid direct extraction method to measure soil microbial biomass nitrogen in soil. Rev. Bras. Ciênc. Solo 1985, 17, 837–842. [Google Scholar] [CrossRef]
  25. Tormena, C.A.; Friedrich, R.; Pintro, J.C.; Costa, A.C.S.; Fidalski, J. Propriedades físicas e taxa de estratificação de carbono orgânico num Latossolo Vermelho após dez anos sob dois sistemas de manejo. Rev. Bras. Ciênc. Solo 2004, 28, 1023–1031. [Google Scholar] [CrossRef]
  26. Canellas, L.P.; Velloso, A.C.X.; Marciano, C.R.; Ramalho, J.F.G.P.; Rumjanek, V.M.; Rezende, C.E.; Santos, G.A. Propriedades químicas de um cambissolo cultivado com cana-de-açúcar, com preservação do palhiço e adição de vinhaça por longo tempo. Rev. Bras. Ciênc. Solo 2003, 27, 935–944. [Google Scholar] [CrossRef]
  27. Monteiro, A.C.G.; Ponciano, N.J. Índice da qualidade do solo com cana-deaçúcar colhida crua e queimada. Rev. Cient. Int. 2012, 1, 58–70. [Google Scholar] [CrossRef]
  28. Chan, K.Y.; Bowman, A.; Oates, A. Oxidizible organic carbon fractions and soil quality changes in a paleustalf under different pasture leys. Soil Sci. 2001, 166, 61–67. [Google Scholar] [CrossRef]
  29. Mcgill, W.B.; Cannon, K.R.; Robertson, J.A.; Cook, F.D. Dynamics of soil microbial biomass and water-soluble organic C in Breton L after 50 years of cropping to two rotations. Can. J. Soil Sci. 1986, 66, 1–19. [Google Scholar] [CrossRef]
  30. Silva, I.F.; Mielniczuk, J. Ação do sistema radicular de plantas na formação e estabilização de agregados do solo. Rev. Bras. Ciênc. Solo 1997, 20, 113–117. [Google Scholar]
  31. Mielniczuk, J. Matéria orgânica e a sustentabilidade de sistemas agrícolas. In Fundamentos da Matéria Orgânica do Solo; Santos, G.A., Camargo, F.A.O., Eds.; Ecossistemas Tropicais e Subtropicais: Porto Alegre, Brazil, 1999; pp. 1–8. [Google Scholar]
Figure 1. Principal component analysis (PCA) using the variables: Total organic carbon (TOC) and organic nitrogen (TON), soil labile-C (g kg−1), soil microbial biomass carbon (SMB-C), and nitrogen (SMB-N) for surface (0.0–0.1 m) and subsurface (0.1–0.2 m) layers. In the figure, Group 1 (black) represents the subsurface for agriculture soil, Group 2 (white) represents surface/subsurface for forested soil, and Group 3 (red) represents surface for agriculture soil.
Forests 10 00544 g001
Figure 2. Total organic carbon (TOC, g kg−1) and organic nitrogen (TON, g kg−1) for latosol (forest-FO, unfertilized pasture-UP, fertilized pasture-FP) and cambisol (forest-FC, coast cross-CC, sugarcane- SC, and corn silage-CS) for the surface (0.0–0.1 m) and subsurface (0.1–0.2 m) layer. Within each soil type/land use combination, bars with different upper-case letters are significantly different (p < 0.05) between surface and subsurface layers.
Forests 10 00544 g002
Figure 3. Soil labile-C (g kg−1) for latosol (forest-FO, unfertilized pasture-UP, fertilized pasture-FP) and cambisol (f-FC, pasture, coast cross-CC, sugarcane-SC and corn silage-CS) for the surface (0.0–0.1) and subsurface (0.1–0.2 m) layers. Within each soil type/land use combination, bars with different upper-case letters are significantly different (p < 0.05) between surface and subsurface layers.
Forests 10 00544 g003
Figure 4. Soil microbial biomass carbon (SMB-C, mg kg−1) and (SMB-N, mg kg−1) for latosol (forest-FO, unfertilized pasture-UP, fertilized pasture-FP) and cambisol (forest-FC, pasture, coast cross-CC, sugarcane-SC, and corn silage-CS) for the surface (0.0–0.1) and subsurface (0.1–0.2 m) layers. Within each soil type/land use combination, bars with different upper-case letters are significantly different (p < 0.05) between surface and subsurface layers.
Forests 10 00544 g004
Table 1. Management history and usages for experimental treatments established within upper slope latosol and riverbed alluvial cambisol in the forest zone (Coronel Pacheco, Brazil).
TreatmentManagement and Usage of Soils
Latosol
Forest (FO)Secondary Atlantic forest
Unfertilized Braquiaria Pasture (UF)1950—Deforestation
1950 until 1985—Angola grass
1986 until 2011—Braquiaria grass
Fertilized Braquiaria Pasture (FP)1950—Deforestation
1950 until 1988—Angola grass
1989 until 2002—Elephant grass
2003 until 2011—Braquiaria grass
Cambisol
Forest (FC)Secondary Atlantic forest
Coast Cross (CC)1935—Deforestation
1935 until 1979—Angola grass
1980 until 1982—Oat pasture
1983 until 1991—Summer corn grain
1992 until 2011—Coast cross grass
Sugarcane (SC)1935—Deforestation
1935 until 1989—Angola grass
1990 until 2011—Sugarcane cultivation
Corn Silage (CS)1935—Deforestation
1935 until 1973—Horticultural crops
1974 until 1985—Angola grass
1986 until 2011—Corn silage
Table 2. Factor coordinates for each variable, based on correlations with total organic carbon (TOC) and nitrogen (TON), labile-C, soil microbial biomass carbon (SMB-C), and (SMB-N).
CP1 (81.1%)CP2 (10.8%)Mean
TOC (g kg−1)−0.980.092.10 ± 0.64
TON (g kg−1)−0.940.250.18 ± 0.05
SMB-C (mg kg−1)−0.85−0.47465.57 ± 231.66
SMB-N (mg kg−1)−0.92−0.2949.07 ± 16.39
Labile-C (g kg−1)−0.890.381.86 ± 0.55
Table 3. Humic (HU), humic acid (HA), and fulvic acid (FA) for latosol (forest-FO, unfertilized pasture-UP, fertilized pasture-FP) and cambisol (forest-FC, pasture, coast cross-CC, sugarcane-SC and corn silage-CS) for the surface (0.0–0.1 m) and subsurface layer (0.1–0.2 m).
SoilHU (g kg−1)HA (g kg−1)FA (g kg−1)
SurfaceSubsurfaceAverageSurfaceSubsurfaceAverageSurfaceSubsurfaceAverage
Latosol
FO16.6511.3313.994.251.332.794.213.603.9
UP13.3510.0511.703.211.452.333.472.913.18
FP16.129.6812.904.732.303.523.393.453.42
Average16.37A10.35B 4.06A1.69B 3.69A3.32A
Cambisol
FC21.90A12.30B17.105.69A2.54B4.124.533.794.16
CC23.10A12.75B17.934.56A2.14B3.353.622.773.20
SC23.28A9.75B11.513.07A2.39A2.733.072.772.92
CS10.88A9.83A10.350.99A0.74A0.871.831.561.69
Average17.2911.16 3.581.95 3.26A2.72B
Within each humic type/land use/soil combination, values with a different upper-case letter are significantly different (p < 0.05) between surface and subsurface layers.
Table 4. Carbon and nitrogen losses (labile and recalcitrant) for latosol (unfertilized pasture-UP, fertilized pasture-FP) and cambisol (pasture, coast cross-CC, sugarcane-SC and corn silage-CS).
Soil ManagementCarbonNitrogen
RecalcitrantLabileRecalcitrantLabile
LatosolUP−9%−23%−19%−24%
FP+16%−7%+2%−25%
CambisolCC−7%−7%+8%−25%
SC−32%−26%−28%−28%
CS−53%−49%−37%−62%

