Article

Soil Depth Determines the Composition and Diversity of Bacterial and Archaeal Communities in a Poplar Plantation

1
Co-Innovation Center for Sustainable Forestry in Southern China, College of Biology and the Environment, Nanjing Forestry University, Nanjing 210037, Jiangsu, China
2
Key Laboratory of Watershed Geographic Sciences, Nanjing Institute of Geography and Limnology, Chinese Academy of Sciences, Nanjing 210008, Jiangsu, China
3
State Key Laboratory of Subtropical Silviculture, Zhejiang A&F University, Hangzhou 311300, China
*
Author to whom correspondence should be addressed.
Forests 2019, 10(7), 550; https://doi.org/10.3390/f10070550
Submission received: 23 May 2019 / Revised: 22 June 2019 / Accepted: 27 June 2019 / Published: 30 June 2019
(This article belongs to the Section Forest Ecology and Management)

Abstract

:
Understanding the composition and diversity of soil microorganisms that typically mediate the soil biogeochemical cycle is crucial for estimating greenhouse gas flux and mitigating global changes in plantation forests. Therefore, the objectives of this study were to investigate changes in diversity and relative abundance of bacteria and archaea with soil profiles and the potential factors influencing the vertical differentiation of microbial communities in a poplar plantation. We investigated soil bacterial and archaeal community compositions and diversities by 16S rRNA gene Illumina MiSeq sequencing at different depths of a poplar plantation forest in Chenwei forest farm, Sihong County, Jiangsu, China. More than 882,422 quality-filtered 16S rRNA gene sequences were obtained from 15 samples, corresponding to 34 classified phyla and 68 known classes. Ten major bacterial phyla and two archaeal phyla were found. The diversity of bacterial and archaeal communities decreased with depth of the plantation soil. Analysis of variance (ANOVA) of relative abundance of microbial communities exhibited that Nitrospirae, Verrucomicrobia, Latescibacteria, GAL15, SBR1093, and Euryarchaeota had significant differences at different depths. The transition zone of the community composition between the surface and subsurface occurred at 10–20 cm. Overall, our findings highlighted the importance of depth with regard to the complexity and diversity of microbial community composition in plantation forest soils.

1. Introduction

Microorganisms exist throughout the soil profile and play vital roles in soil biogeochemical cycling, thereby influencing greenhouse gas emissions from soil and plant growth by altering nutrient availability [1,2]. Soils are considered one of the most diverse microbial habitats because of their extensive physical, chemical, and biological heterogeneity [3]. Our current understanding of the distribution of soil microbial communities and associated processes has largely been restricted to the surface soil [4,5]. Plantation forests provide over 45% of the global industrial round wood production and could have applications in mitigating global changes [6]. Within these forests, many functional microbes mediate the cycle of matter and energy in subsurface horizons. Therefore, the subsurface soil cannot be ignored in studies of greenhouse gas emissions from plantations and the underlying mechanisms.
Environmental conditions, such as temperature and moisture, tend to influence soil physical and chemical characteristics in shallow to deeper regions due to additions, losses, transfers, and transformations of matter and energy that occur during the formation and development of soil [7]. Bacterial and archaeal properties and potential functions are affected by edaphic factors [8], such as pH [9], soil organic carbon [10], and inorganic nitrogen [3,11]. In natural forest soils, deeper soil microbial communities are not simply diluted analogs of the surface community but exhibit larger variation and properties of microbial processes distinct from those of the surface [12,13]. Fundamentally, these changes can be attributed to variations in soil properties with depth [4,14].
According to the 8th National Forest Inventory of China, the forest area in China is 208 million ha, among which plantation forests account for 69 million ha, making these forests the largest of their kind worldwide. Poplar is one of the most widely distributed afforestation tree species in northern China owing to its rapid growth, high yield, strong adaptability to environmental changes, and large amounts of wood produced within a relatively short period of time [15,16]. Because site preparation typically involves manipulation of soil structure through disking, bedding, and ripping, these management strategies could dramatically modify the microbial community composition and diversity. However, the vertical spatial variation and taxonomy of bacterial and archaeal communities within the soil profile in the plantation remain unclear.
Accordingly, in this study, the objectives were to investigate changes in soil physicochemical characteristics with soil depth gradients in a poplar plantation, the corresponding changes in the bacterial and archaeal communities, and the potential relationships between these two group variables. We hypothesized that microbial communities may change with shifts in soil physicochemical characteristics along depth.

2. Materials and Methods

2.1. Site Description

The site was located in Chenwei forest farm (33°20’ N, 118°20’ E), Sihong County, on the west bank of Hongze Lake in northern Jiangsu, China. The climate belongs to a mid-latitude warm zone with long periods of sunshine. The mean annual temperature is 14.4 °C, and the mean monthly temperature ranges from −7 °C in January to 28 °C in July. The mean annual precipitation is 972.5 mm, mostly occurring from June to August. The soil is a Gleysols [17] with clay loam texture derived from lacustrine sediments.
Poplar plantations were established in March 2007 with 1-year-old seedlings of clone “Nanlin-95”, a hybrid of clone I-69 (Populus deltoides Bartr. cv. ’Lux’) × clone I-45 (P. euramericana [Dode] Guineir. cv. ’I-45/51’), with an area of 6.7 ha. Disking was performed to a depth of 30 cm to improve soil aeration and moisture movement prior to planting. A randomized block design was used to establish the trials with three replicates that were randomly arranged in 12 plots established at the same topographic position, with each plot measuring approximately 1200–1800 m2 (50 trees/plot). The average diameter at breast height and tree height were 20.7 cm and 21.2 m, respectively, in 2015. The main understory plant species included Echinochloa crusgalli, Youngia japonica, Geranium wilfordii, Duchesnea indica, and Herba cirsii.

2.2. Sampling

In July 2018, five pits were selected by S type in each block (four plots). Soils from five depths (D1: 0–10 cm, D2: 10–20 cm, D3: 20–30 cm, D4: 30–40 cm, D5: 40–50 cm) in each pit were collected using soil drills (d = 2.5 cm) after removing surface litter and herbs. Soil samples of the same horizon were mixed in each sampling plot and were then placed in a thermostatic chamber to analyze microbial communities. At the same time, soil samples were collected using a ring core (diameter = 5.05 cm) from each depth to measure bulk density (BD). Approximately 1 kg soil was collected in resalable plastic bags from corresponding pits to evaluate soil physicochemical characteristics. Soil samples used for microbial detection were frozen at −30 °C for 1 day before DNA extraction. One part of fresh soil samples was reserved at 4 °C, and the other part was air-dried and sieved through 2-mm mesh to measure soil properties after discarding fine roots and stones.

2.3. Soil Physicochemical Characteristics

Bulk density was measured by the cutting ring method. Soil pH was assessed with a pH probe (AB15 + Basic, Accumet, San Diego, CA, USA) by mixing soil and water in a 1:2.5 volume ratio. Soil organic carbon (SOC) was determined by the potassium dichromate oxidation-ferrous sulfate titration method. Approximately 1 g dry soil was added to 2 mL catalyst and 5 mL concentrated sulfuric acid for digestion; this sample was used to detect the total nitrogen (TN) content with an automatic continuous flow analyzer (AA3; Bran Luebbe, Norderstedt, Germany) [18]. Approximately 10 g dry soil was extracted with distilled water and potassium sulfate, and the extract was used to measure the concentrations of ammonium nitrogen (NH4+-N) and nitrate nitrogen (NO3-N) using an ultraviolet–visible (UV–vis) spectrophotometer (UV-2550; Shimadzu, Tokyo, Japan) [18].

2.4. DNA Extraction, Polymerase Chain Reaction (PCR) Amplification, and Illumina MiSeq Sequencing

DNA was extracted from 15 soil samples from five depths (three repetitions for each depth) using an E.Z.N.A. Soil DNA Kit (Omega Bio-tek, Norcross, GA, USA), according to the manufacturer’s instructions. The final DNA concentration and purification were determined using a NanoDrop 2000 UV–vis spectrophotometer (Thermo Scientific, Wilmington, DE, USA), and DNA quality was checked by 1% agarose gel electrophoresis. The primer sets of 515FmodF (5′-GTGYCAGCMGCCGCGGTAA-3′) and 806RmodR (5′-GGACTACNVGGGTWTCTAAT-3′) were designed to amplify the V4 hypervariable region of the 16S rRNA gene from nearly all bacteria and archaea [19].
Polymerase chain reactions (PCR) were conducted using the following sequencer: 3 min for denaturation at 95 °C; 29 cycles of 30 s at 95 °C, 30 s for annealing at 55 °C, 45 s for elongation at 72 °C, and 10 mins for a final extension at 72 °C. PCR reactions were conducted in triplicate 20 μL mixture comprising 0.4 μL of FastPfu Polymerase, 0.8 μL of each primer (5 μM), 2 μL of 2.5 mM deoxyribonucleoside triphosphates (dNTPs), 4 μL of 5 × FastPfu Buffer, and 10 ng of template DNA. The PCR products were extracted from 2% agarose gels, then purified with an AxyPrep DNA Gel Extraction Kit (Axygen Biosciences, Union City, CA, USA) and further quantified using QuantiFluor ™ -ST (Promega, Madison, WI, USA) following the manufacturer’s protocol. Purified amplicons were pooled in equimolar and paired-end sequenced (2 × 300) on an Illumina Miseq platform (Illumina, San Diego, USA) following the standard protocols by Majorbio Bio-Pharm Technology Co. Ltd. (Majorbio, Shanghai, China) [20,21].
Illumina Miseq sequencing yielded 882,422 quality sequences. Raw fastq files were quality-filtered by Trimmomatic and merged by Fast Length Adjustment of Short reads (FLASH, https://ccb.jhu.edu/software/FLASH/) with the following criteria: (i) the reads were truncated at any site receiving an average quality score <20 over a 50 bp sliding window; (ii) sequences whose overlap being longer than 10 bp were merged in terms of their overlap with mismatch no more than 2 bp; (iii) sequences of each sample were separated due to barcodes (exactly matching) and primers (allowing 2 nucleotide mismatching), and then reads containing ambiguous bases were deleted [20,21]. Operational taxonomic units (OTUs) were clustered with 97% similarity cutoff using UPARSE (version 7.1 http://drive5.com/uparse/) with a “greedy” algorithm that performs chimera filtering and OTU clustering simultaneously. The taxonomy of each 16S rRNA gene sequence was analyzed by Ribosomal Database Project (RDP) Classifier algorithm (http://rdp.cme.msu.edu/) against Silva (SSU128) 16S rRNA database using confidence threshold of 70% [22]. The raw data were submitted into the National Center for Biotechnology Information (NCBI) Sequence Read Archive (SRA) database (Accession Number: PRJNA541200).

2.5. Data Analysis

One-way analysis of variance (ANOVA) of soil physical and chemical characteristics at different depths was performed using SPSS 18.0. Shannon [23], Chao1 [24] and Coverage [25] indexes were used to evaluate alpha diversity, abundance, and coverage of the microbial community, respectively, and formulas were listed as follows:
S h a n n o n = i = 1 S o b s p i ln p i
where Sobs is the number of OTUs actually observed; pi is the proportion of individuals of the ith OTU divided by the total number of sequences (N).
C h a o 1 = S o b s + n 1 ( n 1 1 ) 2 ( n 2 + 1 )
where: n1 is the number of OTUs with only one sequence; n2 is the number of OTUs with only two sequences.
C o v e r a g e = 1 n 1 N
To assess beta diversity patterns, i.e., the changes in microbial community composition at different depths, the principal component analysis (PCA) was used. Venn graphs were used to assess the numbers of shared and unique operational taxonomic units (OTUs) at different depths based on a similarity level of 97% OTUs. The relationships between bacterial and archaeal community compositions and edaphic factors were evaluated using redundancy analysis (RDA) and Pearson correlation matrix.

3. Results

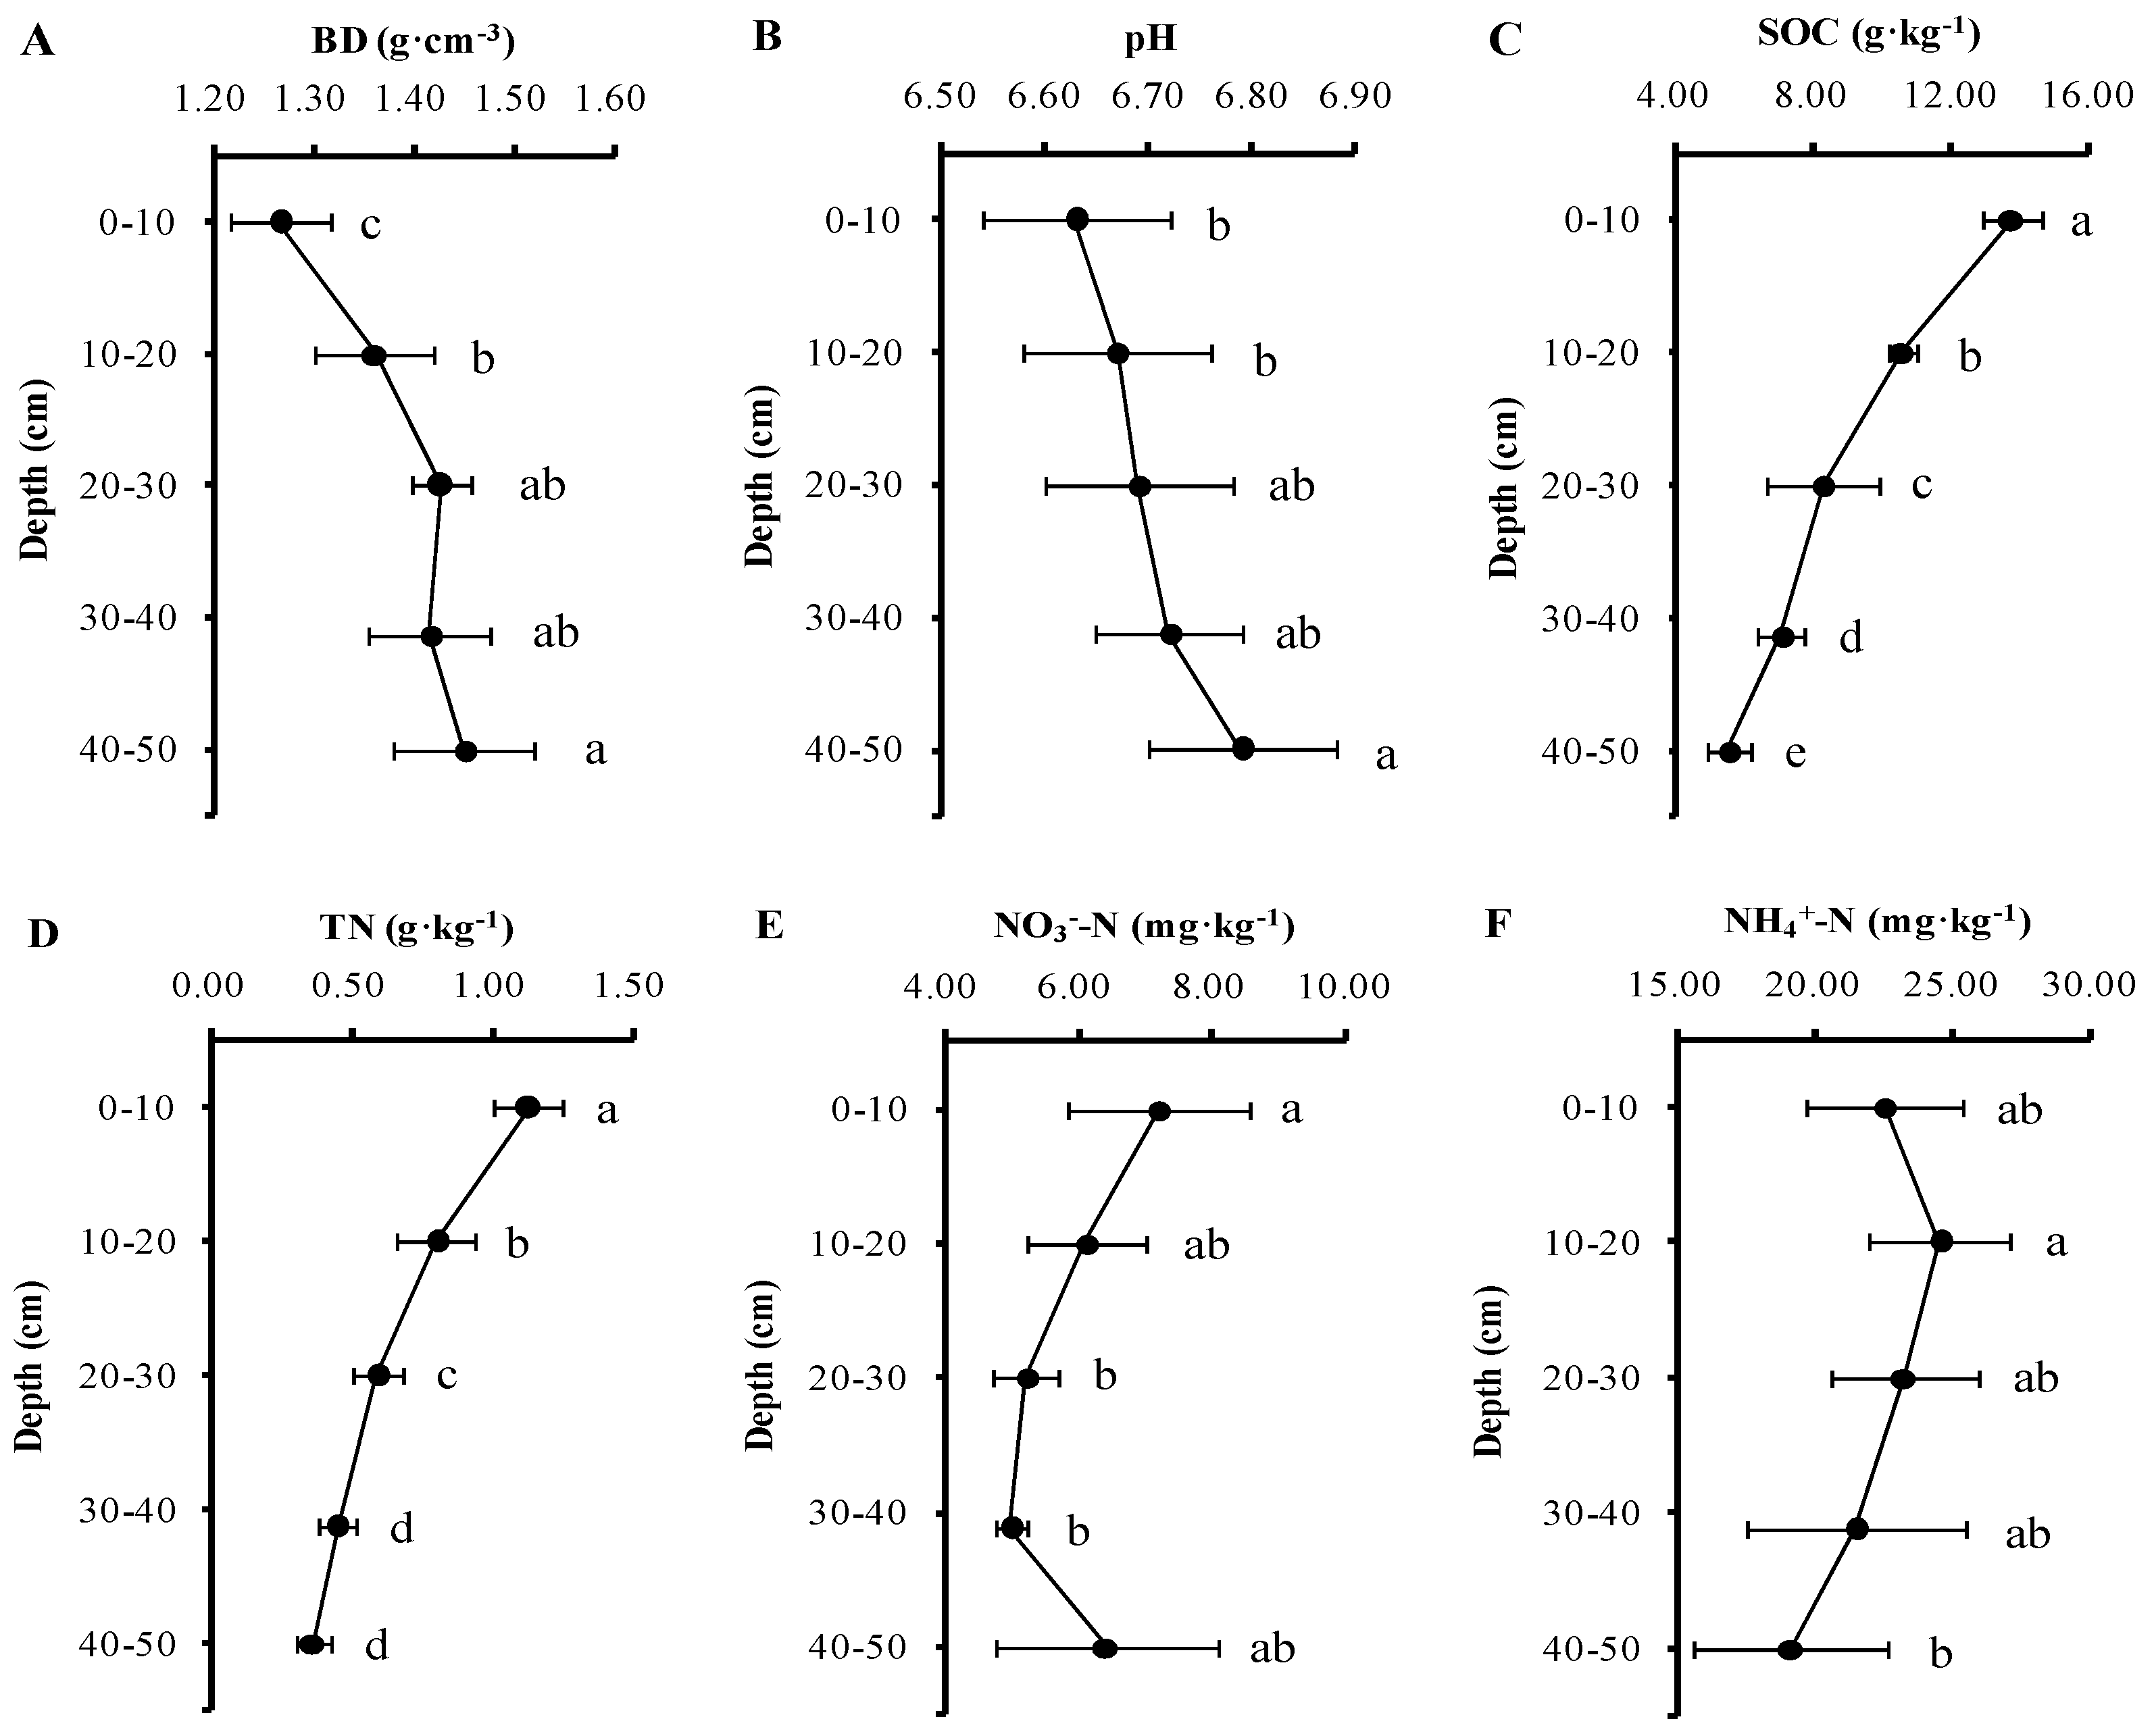
3.1. Soil Physicochemical Characteristics with Depth

Soil physicochemical characteristics varied with depth (Figure 1). Briefly, BD and soil pH increased with depth. Significant differences in BDs of D1, D2, and D5 were observed. Moreover, soil pH was significantly lower in D1 and D2 than in D5. However, SOC and TN decreased with depth. The SOC differed significantly at each depth, whereas only the first four layers showed significant differences for TN. NO3-N and NH4+-N concentrations also showed different patterns. For example, NO3-N concentrations generally decreased with depth in the first four layers, whereas the concentration increased at D5. The concentration of NH4+-N reached a maximum at D2 and a minimum at D5.

3.2. Alpha and Beta Diversity Patterns

Total effective sequences of different soil depths ranged from 45,874 to 57,609 (Table 1). Shannon index declined with depth, and analysis of the Chao index showed that D2 and D3 had higher species richness than the other samples. Coverage of all samples was more than 99%, demonstrating that the depth of the sequence was sufficient. PCA divided the bacterial and archaeal communities into three categories (Figure 2): D1, D2, and the group of D3–D5. The contributions of two selected principal components for the differences in bacterial and archaeal community compositions were 26.47% and 12.04%, separately.

3.3. Change in Bacterial and Archaeal Community Compositions with Depth

The number of shared OTUs was 2361, accounting for 64% of all observed OTUs (3689; Figure 3). However, the numbers of unique OTUs for D1, D2, D3, D4, and D5 were 20, 14, 6, 13, and 20, respectively. In total, 34 known phyla were observed in all samples. The main bacterial phyla included Actinobacteria, Proteobacteria, Acidobacteria, Chloroflexi, Nitrospirae, Planctomycetes, Gemmatimonadetes, GAL15, Firmicutes, and Bacteroidetes (Figure S1a). The relative abundances of these phyla together made up an average of 89.07% for all bacteria. Average relative abundance of the top 11 microbial dominant classes accounted for 83.59% of all bacterial classes (Figure 4a). Alphaproteobacteria, Betaproteobacteria, Deltaproteobacteria, and Gammaproteobacteria constituted the preponderant class of Proteobacteria. Thaumarchaeota was the dominant archaeal phylum (Figure S1b), and its main class was Soil_Crenarchaeotic_Group_SCG (Figure 4b). Although bacterial and archaeal communities at the phylum level were similar at five soil depths, the relative abundance varied. ANOVA revealed that Nitrospirae (p = 0.002), Verrucomicrobia (p = 0.043), Latescibacteria (p = 0.011), GAL15 (p = 0.037), SBR1093 (p = 0.028), and Euryarchaeota (p = 0.013) showed significant differences at the different depths (Figure S2).

3.4. Relationship between Bacterial and Archaeal Community Compositions and Edaphic Factors

BD (p = 0.002), pH (p = 0.012), SOC (p = 0.002), TN (p = 0.003), and NO3-N (p = 0.03) had significant effects on bacterial and archaeal community compositions (Figure 5). Furthermore, BD and pH were negatively correlated with other soil chemical characteristics. The Pearson correlation matrix showed that the soil physicochemical characteristics had different effects on the bacterial and archaeal communities (Table 2). Proteobacteria and Bacteroidetes had significantly negative correlations with BD but significantly positive correlations with TN, SOC, and NO3-N. Nitrospirae and GAL15 had significantly positive correlations with BD and pH, but significantly negative correlations with TN, SOC, and NH4+-N. Thaumarchaeota was significantly negatively correlated with BD, but was significantly positively correlated with TN, SOC, and NH4+-N. Euryarchaeota was significantly positively correlated with pH, but was significantly negatively correlated with TN, SOC, and NO3-N.

4. Discussion

In this study, we found that the diversity of bacterial and archaeal communities decreased with depth in a poplar plantation. Some surface-dwelling microbes showed reduced survival in the subsurface soil owing to the strong ecological filtration function in vertical space [4]. These findings are consistent with previous studies on soil microbial community diversity in response to depth across paddy soils [26], grassland soils [27], forest soils [5,28], and tundra soils [29]. Typically, the transition zone for the microbial community is thought to be 10–25 cm in natural forest soils [4]. We found that the transition zone for the bacterial and archaeal communities between surface and subsurface regions occurred at 10–20 cm at the study site.
Environmental conditions, such as oxygen levels and temperature, can affect the soil microbial community. Changes in soil physicochemical characteristics, such as pH, BD, SOC, TN, and NO3-N, with depth had significant positive (SOC and TN) or negative (BD and pH) correlations with the diversity of the microbial community. Soil pH has been identified as the dominant factor shaping microbial communities for surface soils across the continental scale [30]. Soil pH increased with depth, but microbial diversity was reversed in our study. The discrepancy between our soil profile study and previous studies across the continental scale could be explained by the very narrow pH range (6.6–6.8) observed in our soil samples. Furthermore, changes in the quality of SOC (e.g., labile SOC and resistant SOC) with soil depth could have stronger effects on the community structure than the total quantity of SOC [3]. Shifts in microbial communities between surface and subsurface soils could partially result from differences in the availability of labile SOC, leading to physiologically altered (adapted) organisms capable of utilizing more recalcitrant sources of organic carbon [31]. However, in our study, the quantity of SOC still strongly affected the microbial community structure.
We observed 10 major bacterial phyla in this study, in contrast to a previous study in which nine dominant groups were obtained from various soils ranging from agricultural land and grassland to pristine forest [32]. The unique bacterial phyla identified in this study were Nitrospirae and GAL15. The relative abundance of Nitrospirae and GAL15 increased significantly with depth, indicating that these organisms have a selective advantage in deeper soils [33]. Moreover, Nitrospira, belonging to the bacterial phylum Nitrospirae, were demonstrated to the most diverse and abundant nitrite-oxidizing bacteria (NOB) [34]. Latescibacteria and Tectomicrobia are potential new bacterial phyla obtained through metagenomic and single-cell genomics in recent years [35,36]. The relative abundance of Latescibacteria at intermediate depth (20–30 cm) was significantly larger than those at shallow and deeper regions, whereas the relative abundance of Tectomicrobia was more uniform with changes in depth.
The abundance of Proteobacteria and Bacteroidetes decreased with depth in the poplar soil profiles, which is consistent with previous studies [4,8,33]. The decreased abundances of Proteobacteria and Bacteroidetes could be attributed to the general copiotrophic properties and responses to labile sources of SOC at shallow depths [37]. Proteobacteria displayed various types of obligate and facultative chemo- and photoautotrophic CO2 fixation [38]. Moreover, previous studies found that Alphaproteobacteria and Betaproteobacteria were able to induce nitrogen-fixing nodules [39], and Gammaproteobacteria could carry out ammonia oxidation [40]. As well, methanotrophs were found within Alphaproteobacteria, Betaproteobacteria, and Gammaproteobacteria, and these bacteria were more likely to be detected in soil with pH ˃ 6.0 [41].
Additionally, we found that the relative abundances of Actinobacteria, Acidobacteria, Chloroflexi, and Firmicutes exhibited a mid-soil depth peak, but not significant. However, some studies reported that the relative abundances of Actinobacteria, Acidobacteria, Chloroflexi, and Firmicutes increased with depth [42,43], attributing to their adaptation to resource-limited conditions [8,37,44]. This discrepancy may because of the different soil type and land use type. The relative abundance of Planctomycetes did not show clear changes across profiles [4]. This is consistent with our finding. It was also reported that Planctomycetes derive their energy for growth from the conversion of ammonium and nitrite into dinitrogen gas in the complete absence of oxygen, regulating the nitrogen cycle [45]. As there is no significant change of relative abundance with soil depth, anaerobic ammonium oxidation mediated by the bacteria may not change with soil depth in the poplar plantations if the actual effectiveness in surface and subsurface soils is similar.
The relative abundance of Verrucomicrobia was significantly higher between 10 and 20 cm than other layers in this study, which is shallower than the middle depth peak (20–40 cm) in natural forests [4,8]. Verrucomicrobia may prefer a micro-aerobic environment rather than aerobic and extreme anoxic environments [4]. Previous studies have reported that some members of Verrucomicrobia could oxidize methane and take advantage of methane as the only source of carbon, making them the only known aerobic methanotrophs except for the Proteobacteria [46,47]. Consequently, the subsurface peak in Verrucomicrobia abundance may correspond to the peak in methane oxidation [48].
Although archaea were relatively rare in all layers, some individual members of archaea were abundant. For example, Thaumarchaeota was the dominant taxon of archaea within soil, and its relative abundance decreased with depth in this study. This pattern was consistent with a previous study showing that Thaumarchaeota was the only archaeal group in aerobic shallow soil [49]. Furthermore, Thaumarchaeota has been shown to have ammonia oxidation [50,51] and carbon sequestration activities [52,53], but to exhibit high denitrification potential under hypoxic conditions [53]. The relative abundance of Euryarchaeota increased significantly with depth within the first four layers, which could attribute to their preference for anaerobic environment. Notably, members of Euryarchaeota have been found not only to produce methane [54], but also oxidize methane, fix nitrogen, and reduce nitrates [55,56,57]. Generally, methanogens are thought to be strictly anaerobic Euryarchaeota but have recently been found in fully aerated environments of forests, grasslands, and agricultural soils [58,59,60]. Euryarchaeota have been shown to be ubiquitous and highly abundant in aerated upland soils and to participate in global methane production in upland soil [61]. However, it is difficult to detect the specific methanogens at the class level based on the primer used in this study. We will further identify the functional bacteria and archaea of the poplar plantations with specific functional primers (such as methanogens, methanotrophs, nitrogen fixing bacteria, denitrifying bacteria, etc.), and explore the microbial-driven mechanism of soil greenhouse gas productions and emissions.
Assuming that forest managers or scientists are more interested in greenhouse gas budgets from such managed ecosystems, further work will be required on at least two fronts. First, field measurements on CO2, CH4, and N2O emission rates across the surface between soils and the atmosphere must be conducted and microbial composition should be detected accordingly. However, this study is primarily concerned the change of microbial diversity and composition with soil profile, as the plantation ecosystem sometimes showed as a net CH4 source. Second, laboratory incubation studies must include the greenhouse gas production and corresponding microbial composition change at certain environmental conditions.

5. Conclusions

As a vital factor in the construction of environmental gradients, soil depth affects the complexity and diversity of bacterial and archaeal community structure. The vertical spatial heterogeneity of soil drives microbes to seek habitats selectively, resulting in apparent changes in the diversity and relative abundances of bacteria and archaea across soil depth. There were significant correlations between shifts of community compositions of bacteria and archaea and soil physicochemical characteristics with changes in depth. Moreover, we observed some bacterial and archaeal communities in poplar plantation soil profiles, and these microbes may regulate important soil carbon and nitrogen processes. Defining the biogeography of soil bacteria and archaea, particularly for deeper regions, could provide insights into unique and potentially significant processes affecting soil ecosystems. Studies such as our current work have produced useful information on microbial diversity in soil profiles. Further studies are needed to focus on functional bacteria such as methanogenesis, methane-oxidizing bacteria, and nitrogen-related bacteria for identifying related biogeochemical processes in man-made forest ecosystems.

Supplementary Materials

The following are available online at https://www.mdpi.com/1999-4907/10/7/550/s1: Figure S1. Abundances of bacteria (a) and archaea (b) at the phylum level for different soil depths (D1: 0–10 cm; D2: 11–20 cm; D3: 21–30 cm; D4: 31–40 cm; D5: 41–50 cm) in a poplar plantation ecosystem. The percentages inside the brackets represent the range of relative abundance of bacteria and archaea at the phylum level. Figure S2: Analysis of variance (ANOVA) of abundance of bacterial and archaeal communities at different soil depths (D1: 0–10 cm; D2: 11–20 cm; D3: 21–30 cm; D4: 31–40 cm; D5: 41–50 cm) in a poplar plantation ecosystem. * 0.01 < p ≤ 0.05, ** 0.001 < p ≤ 0.01, *** p ≤ 0.001.

Author Contributions

Conceptualization, W.W.; methodology, J.G. and H.F.; formal analysis, H.F.; investigation, J.G. and S.Y.; data curation, J.G. and S.Y.; writing—original draft preparation, H.F. and W.W.; writing—review and editing, W.W., X.S. and S.Y.; funding acquisition, W.W. All authors reviewed the manuscript.

Funding

This research was supported by the National Natural Science Foundation of China (grant no. 31700555), the Key Laboratory of Watershed Geographic Sciences, Nanjing Institute of Geography and Limnology, Chinese Academy of Sciences (grant no. WSGS201701), the Natural Science Foundation of Jiangsu Province (grant no. BK20170955), the Priority Academic Program Development of Jiangsu Higher Education Institutions (PAPD), and Jiangsu Distinguished Professor Program to WW.

Acknowledgments

We thank Xuan Xu, Menghua Han, Penghe Cao, and Shuang Zhang for their assistance with field sampling and laboratory work.

Conflicts of Interest

The authors declare no conflict of interest.

References

  1. Bardgett, R.D.; Freeman, C.; Ostle, N.J. Microbial contributions to climate change through carbon cycle feedbacks. ISME J. 2008, 2, 805–814. [Google Scholar] [CrossRef] [PubMed] [Green Version]
  2. Falkowski, P.G.; Fenchel, T.; Delong, E.F. The microbial engines that drive Earth‘s biogeochemical cycles. Science 2008, 320, 1034–1039. [Google Scholar] [CrossRef] [PubMed]
  3. Seuradge, B.J.; Oelbermann, M.; Neufeld, J.D. Depth-dependent influence of different land-use systems on bacterial biogeography. FEMS Microbiol. Ecol. 2017, 93, 239. [Google Scholar] [CrossRef] [PubMed]
  4. Eilers, K.G.; Debenport, S.; Anderson, S.; Fierer, N. Digging deeper to find unique microbial communities: The strong effect of depth on the structure of bacterial and archaeal communities in soil. Soil Biol. Biochem. 2012, 50, 58–65. [Google Scholar] [CrossRef]
  5. Tang, Y.; Yu, G.; Zhang, X.; Wang, Q.; Ge, J.; Liu, S. Changes in nitrogen-cycling microbial communities with depth in temperate and subtropical forest soils. Appl. Soil Ecol. 2018, 124, 218–228. [Google Scholar] [CrossRef]
  6. FAOSTAT. Statistical Division. FAO. Available online: http://www.fao.org/faostat/en/#data/FO (accessed on 20 August 2018).
  7. Quesada, C.A.; Lloyd, J.; Schwarz, M.; Patino, S.; Baker, T.R.; Czimczik, C.; Fyllas, N.M.; Martinelli, L.; Nardoto, G.B.; Schmerler, J.; et al. Variations in chemical and physical properties of Amazon forest soils in relation to their genesis. Biogeosciences 2010, 7, 1515–1541. [Google Scholar] [CrossRef] [Green Version]
  8. Hansel, C.M.; Fendorf, S.; Jardine, P.M.; Francis, C.A. Changes in bacterial and archaeal community structure and functional diversity along a geochemically variable soil profile. Appl. Environ. Microbiol. 2008, 74, 1620–1633. [Google Scholar] [CrossRef]
  9. Eichorst, S.A.; Breznak, J.A.; Schmidt, T.M. Isolation and characterization of soil bacteria that define Teniglobus gen. nov., in the phylum Acidobacteria. Appl. Environ. Microbiol. 2007, 73, 2708–2717. [Google Scholar] [CrossRef]
  10. Zhou, J.Z.; Xia, B.C.; Treves, D.S.; Wu, L.Y.; Marsh, T.L.; O‘Neill, R.V.; Palumbo, A.V.; Tiedje, J.M. Spatial and resource factors influencing high microbial diversity in soil. Appl. Environ. Microbiol. 2002, 68, 326–334. [Google Scholar] [CrossRef]
  11. Liu, D.; Huang, Y.; An, S.; Sun, H.; Bhople, P.; Chen, Z. Soil physicochemical and microbial characteristics of contrasting land-use types along soil depth gradients. Catena 2018, 162, 345–353. [Google Scholar] [CrossRef]
  12. Fierer, N.; Schimel, J.P.; Holden, P.A. Variations in microbial community composition through two soil depth profiles. Soil Biol. Biochem. 2003, 35, 167–176. [Google Scholar] [CrossRef]
  13. Fritze, H.; Pietikäinen, J.; Pennanen, T. Distribution of microbial biomass and phospholipid fatty acids in Podzol profiles under coniferous forest. Eur. J. Soil Sci. 2010, 51, 565–573. [Google Scholar] [CrossRef]
  14. Tripathi, B.M.; Kim, M.; Kim, Y.; Byun, E.; Yang, J.-W.; Ahn, J.; Lee, Y.K. Variations in bacterial and archaeal communities along depth profiles of Alaskan soil cores. Sci. Rep. 2018, 8, 504. [Google Scholar] [CrossRef] [PubMed]
  15. Cervera, M.T.; Storme, V.; Ivens, B.; Gusmao, J.; Liu, B.H.; Hostyn, V.; Van Slycken, J.; Van Montagu, M.; Boerjan, W. Dense genetic linkage maps of three Populus species (Populus deltoides, P-nigra and P-trichocarpa) based on AFLP and microsatellite markers. Genetics 2001, 158, 787–809. [Google Scholar] [PubMed]
  16. Liang, W.-J.; Hu, H.-Q.; Liu, F.-J.; Zhang, D.-M. Research advance of biomass and carbon storage of poplar in China. J. For. Res. 2006, 17, 75–79. [Google Scholar] [CrossRef]
  17. IUSS Working Group, WRB. World Reference Base for Soil Resources 2014, Update 2015 International Soil Classification System for Naming Soils and Creating Legends for Soil Maps; World Soil Resources Reports No. 106; FAO: Rome, Italy, 2015. [Google Scholar]
  18. Rayment, G.E.; Lyons, D.J. Soil Chemical Methods-Australasia; CSIRO Publishing: Clayton, Australia, 2010. [Google Scholar]
  19. Walters, W.; Hyde, E.R.; Berg-Lyons, D.; Ackermann, G.; Humphrey, G.; Parada, A.; Gilbert, J.A.; Jansson, J.K.; Caporaso, J.G.; Fuhrman, J.A.; et al. Improved Bacterial 16S rRNA Gene (V4 and V4-5) and Fungal Internal Transcribed Spacer Marker Gene Primers for Microbial Community Surveys. Msystems 2016, 1, e00009-15. [Google Scholar] [CrossRef] [PubMed] [Green Version]
  20. Tao, S.; Li, L.; Li, L.; Liu, Y.; Ren, Q.; Shi, M.; Liu, J.; Jiang, J.; Ma, H.; Huang, Z.; et al. Understanding the gut–kidney axis among biopsy-proven diabetic nephropathy, type 2 diabetes mellitus and healthy controls: An analysis of the gut microbiota composition. Acta Diabetol. 2019, 56, 581–592. [Google Scholar] [CrossRef]
  21. Wu, B.; Hou, S.; Peng, D.; Wang, Y.; Wang, C.; Xu, F.; Xu, H. Response of soil micro-ecology to different levels of cadmium in alkaline soil. Ecotoxicol. Environ. Saf. 2018, 166, 116–122. [Google Scholar] [CrossRef]
  22. Li, X.; Meng, D.; Li, J.; Yin, H.; Liu, H.; Liu, X.; Liu, X.; Cheng, C.; Xiao, Y.; Liu, Z.; et al. Response of soil microbial communities and microbial interactions to long-term heavy metal contamination. Environ. Pollut. 2017, 231, 908–917. [Google Scholar] [CrossRef]
  23. Shannon, C.E. A Mathematical Theory of Communication. Bell Syst. Tech. J. 1948, 27, 379–423. [Google Scholar] [CrossRef] [Green Version]
  24. Chao, A. Nonparametric estimation of the number of classes in a population. Scand. J. Stat. 1984, 11, 265–270. [Google Scholar]
  25. Good, I.J. The population frequencies of species and the estimation of population parameters. Biometrika 1953, 40, 237–264. [Google Scholar] [CrossRef]
  26. Bai, R.; Xi, D.; He, J.-Z.; Hu, H.-W.; Fang, Y.-T.; Zhang, L.-M. Activity, abundance and community structure of anammox bacteria along depth profiles in three different paddy soils. Soil Biol. Biochem. 2015, 91, 212–221. [Google Scholar] [CrossRef] [Green Version]
  27. Griffiths, R.I.; Whiteley, A.S.; O‘Donnell, A.G.; Bailey, M.J. Influence of depth and sampling time on bacterial community structure in an upland grassland soil. FEMS Microbiol. Ecol. 2003, 43, 35–43. [Google Scholar] [CrossRef] [PubMed]
  28. Levy-Booth, D.J.; Prescott, C.E.; Christiansen, J.R.; Grayston, S.J. Site preparation and fertilization of wet forests alter soil bacterial and fungal abundance, community profiles and CO2 fluxes. For. Ecol. Manag. 2016, 375, 159–171. [Google Scholar] [CrossRef]
  29. Deng, J.; Gu, Y.; Zhang, J.; Xue, K.; Qin, Y.; Yuan, M.; Yin, H.; He, Z.; Wu, L.; Schuur, E.A.; et al. Shifts of tundra bacterial and archaeal communities along a permafrost thaw gradient in Alaska. Mol. Ecol. 2015, 24, 222–234. [Google Scholar] [CrossRef]
  30. Lauber, C.L.; Hamady, M.; Knight, R.; Fierer, N. Pyrosequencing-Based Assessment of Soil pH as a Predictor of Soil Bacterial Community Structure at the Continental Scale. Appl. Environ. Microbiol. 2009, 75, 5111–5120. [Google Scholar] [CrossRef] [Green Version]
  31. Fierer, N.; Allen, A.S.; Schimel, J.P.; Holden, P.A. Controls on microbial CO2 production: a comparison of surface and subsurface soil horizons. Glob. Chang. Biol. 2003, 9, 1322–1332. [Google Scholar] [CrossRef]
  32. Janssen, P.H. Identifying the dominant soil bacterial taxa in libraries of 16S rRNA and 16S rRNA genes. Appl. Environ. Microbiol. 2006, 72, 1719–1728. [Google Scholar] [CrossRef]
  33. Will, C.; Thuermer, A.; Wollherr, A.; Nacke, H.; Herold, N.; Schrumpf, M.; Gutknecht, J.; Wubet, T.; Buscot, F.; Daniel, R. Horizon-Specific Bacterial Community Composition of German Grassland Soils, as Revealed by Pyrosequencing-Based Analysis of 16S rRNA Genes. Appl. Environ. Microbiol. 2010, 76, 6751–6759. [Google Scholar] [CrossRef] [Green Version]
  34. Daims, H.; Nielsen, J.L.; Nielsen, P.H.; Schleifer, K.H.; Wagner, M. In situ characterization of Nitrospira-like nitrite oxidizing bacteria active in wastewater treatment plants. Appl. Environ. Microbiol. 2001, 67, 5273–5284. [Google Scholar] [CrossRef] [PubMed]
  35. Rinke, C.; Schwientek, P.; Sczyrba, A.; Ivanova, N.N.; Anderson, I.J.; Cheng, J.-F.; Darling, A.; Malfatti, S.; Swan, B.K.; Gies, E.A.; et al. Insights into the phylogeny and coding potential of microbial dark matter. Nature 2013, 499, 431–437. [Google Scholar] [CrossRef] [PubMed] [Green Version]
  36. Wilson, M.C.; Mori, T.; Rueckert, C.; Uria, A.R.; Helf, M.J.; Takada, K.; Gernert, C.; Steffens, U.A.; Heycke, N.; Schmitt, S.; et al. An environmental bacterial taxon with a large and distinct metabolic repertoire. Nature 2014, 506, 58–62. [Google Scholar] [CrossRef] [PubMed] [Green Version]
  37. Fierer, N.; Bradford, M.A.; Jackson, R.B. Toward an ecological classification of soil bacteria. Ecology 2007, 88, 1354–1364. [Google Scholar] [CrossRef] [PubMed]
  38. Badger, M.R.; Bek, E.J. Multiple Rubisco forms in proteobacteria: their functional significance in relation to CO2 acquisition by the CBB cycle. J. Exp. Bot. 2008, 59, 1525–1541. [Google Scholar] [CrossRef]
  39. Velázquez, E.; García-Fraile, P.; Ramírez-Bahena, M.; Peix, A.; Rivas, R. Proteobacteria Forming Nitrogen Fixing Symbiosis with Higher Plants; Nova Science Publishers, Inc.: Hauppauge, NY, USA, 2010; pp. 37–56. [Google Scholar]
  40. Imhoff, J.F.; Wiese, J. The Order Kiloniellales. In The Prokaryotes: Alphaproteobacteria and Betaproteobacteria; Rosenberg, E., DeLong, E.F., Lory, S., Stackebrandt, E., Thompson, F., Eds.; Springer: Berlin/Heidelberg, Germany, 2014; pp. 301–306. [Google Scholar]
  41. Knief, C.; Lipski, A.; Dunfield, F.P. Diversity and activity of methanotrophic bacteria in different upland soils. Appl. Environ. Microbiol. 2003, 69, 6703–6714. [Google Scholar] [CrossRef] [PubMed]
  42. Bai, R.; Wang, J.-T.; Deng, Y.; He, J.-Z.; Feng, K.; Zhang, L.-M. Microbial Community and Functional Structure Significantly Varied among Distinct Types of Paddy Soils but Responded Differently along Gradients of Soil Depth Layers. Front. Microbiol. 2017, 8, 945. [Google Scholar] [CrossRef]
  43. Hartmann, M.; Lee, S.; Hallam, S.J.; Mohn, W.W. Bacterial, archaeal and eukaryal community structures throughout soil horizons of harvested and naturally disturbed forest stands. Environ. Microbiol. 2009, 11, 3045–3062. [Google Scholar] [CrossRef]
  44. Li, C.; Yan, K.; Tang, L.; Jia, Z.; Li, Y. Change in deep soil microbial communities due to long-term fertilization. Soil Biol. Biochem. 2014, 75, 264–272. [Google Scholar] [CrossRef]
  45. Jetten, M.S.; Niftrik, L.; Strous, M.; Kartal, B.; Keltjens, J.T.; Op den Camp, H.J. Biochemistry and molecular biology of anammox bacteria. Crit. Rev. Biochem. Mol. Biol. 2009, 44, 65–84. [Google Scholar] [CrossRef]
  46. Islam, T.; Jensen, S.; Reigstad, L.J.; Larsen, O.; Birkeland, N.-K. Methane oxidation at 55 degrees C and pH 2 by a thermoacidophilic bacterium belonging to the Verrucomicrobia phylum. Proc. Natl. Acad. Sci. USA 2008, 105, 300–304. [Google Scholar] [CrossRef] [PubMed]
  47. Pol, A.; Heijmans, K.; Harhangi, H.R.; Tedesco, D.; Jetten, M.S.M.; den Camp, H.J.M.O. Methanotrophy below pH1 by a new Verrucomicrobia species. Nature 2007, 450, 874–878. [Google Scholar] [CrossRef] [PubMed]
  48. Bergmann, G.T.; Bates, S.T.; Eilers, K.G.; Lauber, C.L.; Caporaso, J.G.; Walters, W.A.; Knight, R.; Fierer, N. The under-recognized dominance of Verrucomicrobia in soil bacterial communities. Soil Biol. Biochem. 2011, 43, 1450–1455. [Google Scholar] [CrossRef] [PubMed] [Green Version]
  49. Mikkonen, A.; Santalahti, M.; Lappi, K.; Pulkkinen, A.-M.; Montonen, L.; Suominen, L. Bacterial and archaeal communities in long-term contaminated surface and subsurface soil evaluated through coextracted RNA and DNA. FEMS Microbiol. Ecol. 2014, 90, 103–114. [Google Scholar] [CrossRef] [PubMed]
  50. Konneke, M.; Bernhard, A.E.; de la Torre, J.R.; Walker, C.B.; Waterbury, J.B.; Stahl, D.A. Isolation of an autotrophic ammonia-oxidizing marine archaeon. Nature 2005, 437, 543–546. [Google Scholar] [CrossRef] [PubMed]
  51. Treusch, A.H.; Leininger, S.; Kletzin, A.; Schuster, S.C.; Klenk, H.P.; Schleper, C. Novel genes for nitrite reductase and Amo-related proteins indicate a role of uncultivated mesophilic crenarchaeota in nitrogen cycling. Environ. Microbiol. 2005, 7, 1985–1995. [Google Scholar] [CrossRef] [PubMed]
  52. Koenneke, M.; Schubert, D.M.; Brown, P.C.; Huegler, M.; Standfest, S.; Schwander, T.; Schada von Borzyskowski, L.; Erb, T.J.; Stahl, D.A.; Berg, I.A. Ammonia-oxidizing archaea use the most energy-efficient aerobic pathway for CO2 fixation. Proc. Natl. Acad. Sci. USA 2014, 111, 8239–8244. [Google Scholar] [CrossRef] [PubMed]
  53. Walker, C.B.; de la Torre, J.R.; Klotz, M.G.; Urakawa, H.; Pinel, N.; Arp, D.J.; Brochier-Armanet, C.; Chain, P.S.; Chan, P.P.; Gollabgir, A. Nitrosopumilus maritimus genome reveals unique mechanisms for nitrification and autotrophy in globally distributed marine crenarchaea. Proc. Natl. Acad. Sci. USA 2010, 107, 8818–8823. [Google Scholar] [CrossRef] [PubMed]
  54. Liu, Y.; Whitman, W.B. Metabolic, phylogenetic, and ecological diversity of the methanogenic archaea. In Incredible Anaerobes: From Physiology to Genomics to Fuels; Wiegel, J., Maier, R.J., Adams, M.W.W., Eds.; Wiley-Blackwell: Hoboken, NJ, USA, 2008; pp. 171–189. [Google Scholar]
  55. Cabello, P.; Roldan, M.D.; Moreno-Vivian, C. Nitrate reduction and the nitrogen cycle in archaea. Microbiol. Sgm. 2004, 150, 3527–3546. [Google Scholar] [CrossRef]
  56. Jason, R.; Janet, L.S.; Christopher, R.S.; Robert, E.B. The natural history of nitrogen fixation. Mol. Biol. Evol. 2004, 21, 541–554. [Google Scholar]
  57. Michaelis, W.; Seifert, R.; Nauhaus, K.; Treude, T.; Thiel, V.; Blumenberg, M.; Knittel, K.; Gieseke, A.; Peterknecht, K.; Pape, T. Microbial reefs in the black sea fueled by anaerobic oxidation of methane. Science 2002, 297, 1013–1015. [Google Scholar] [CrossRef] [PubMed]
  58. Angel, R.; Claus, P.; Conrad, R. Methanogenic archaea are globally ubiquitous in aerated soils and become active under wet anoxic conditions. ISME J. 2012, 6, 847–862. [Google Scholar] [CrossRef] [PubMed]
  59. Pesaro, M.; Widmer, F. Identification of novel Crenarchaeota and Euryarchaeota clusters associated with different depth layers of a forest soil. FEMS Microbiol. Ecol. 2002, 42, 89–98. [Google Scholar] [CrossRef] [PubMed]
  60. Poplawski, A.B.; Martensson, L.; Wartiainen, I.; Rasmussen, U. Archaeal diversity and community structure in a Swedish barley field: Specificity of the EK510R/(EURY498) 16S rDNA primer. J. Microbiol. Methods 2007, 69, 161–173. [Google Scholar] [CrossRef] [PubMed]
  61. Hu, H.-W.; Zhang, L.-M.; Yuan, C.-L.; He, J.-Z. Contrasting Euryarchaeota communities between upland and paddy soils exhibited similar pH-impacted biogeographic patterns. Soil Biol. Biochem. 2013, 64, 18–27. [Google Scholar] [CrossRef]
Figure 1. Soil physicochemical characteristics with depth in a poplar plantation ecosystem. A: bulk density (BD), B: soil pH, C: soil organic carbon (SOC), D: total nitrogen (TN), E: nitrate nitrogen (NO3-N), F: ammonium nitrogen (NH4+-N). The lower-case letters represent the significant difference at p ≤ 0.05.
Forests 10 00550 g001
Figure 2. Principal component analysis (PCA) of bacterial and archaeal community compositions with different soil depth (D1: 0–10 cm; D2: 11–20 cm; D3: 21–30 cm; D4: 31–40 cm; D5: 41–50 cm; indicated by different color) in a poplar plantation ecosystem. The horizontal and vertical axes represent the two selected principal components; the percentages represent the contribution value of the principal components to the difference of microbial communities; the closer the points are, the more similar the microbial community.
Forests 10 00550 g002
Figure 3. Venn graph of the numbers of shared and unique operational taxonomic units (OTUs) at different soil depths (D1: 0–10 cm; D2: 11–20 cm; D3: 21–30 cm; D4: 31–40 cm; D5: 41–50 cm; indicated with different color) in a poplar plantation ecosystem. The overlapping part represents the shared OTUs; non-overlapping part represents the specific OTUs of the given depth; and the number means the corresponding amount of OTUs. In the bar chart, 1,2,3,4, and 5 represent numbers of shared group; the corresponding numbers in the bar are the number of OTUs.
Forests 10 00550 g003
Figure 4. Abundance of bacteria (a) and archaea (b) at the class level for different soil depths (D1: 0–10 cm; D2: 11–20 cm; D3: 21–30 cm; D4: 31–40 cm; D5: 41–50 cm) in a poplar plantation ecosystem. The percentages inside the brackets represent the range of relative abundance of microbes in the class level.
Forests 10 00550 g004
Figure 5. Redundancy analysis (RDA) of the relationships between microbial composition and edaphic factors in a poplar plantation forest. The lengths of arrows represent the extent of edaphic factors influencing the bacterial and archaeal compositions. Positive relationships of soil factors are indicated by acute angles between arrows; negative relationships are indicated by obtuse angles between arrows. The percentages on the X and Y axis represent principal component 1 and 2 interpreting for the weight ratio of the result.
Forests 10 00550 g005
Table 1. Sequences and alpha diversities of bacterial and archaeal communities for each soil depth (D1: 0–10 cm; D2: 11–20 cm; D3: 21–30 cm; D4: 31–40 cm; D5: 41–50 cm) in a poplar plantation ecosystem.
Depth
cm
SequencesShannonChao1Coverage
%
D1524176.582811.8099.2
D2492066.442969.5598.7
D3458746.232957.7498.7
D4576096.012861.6499.1
D5530865.892877.7498.8
Table 2. Pearson correlation matrix between the top 20 abundant microorganisms and edaphic factors. The numbers in the table represent the correlation coefficient (* 0.01 < p ≤ 0.05, ** 0.001 < p ≤ 0.01, *** p ≤ 0.001). BD: bulk density; SOC: soil organic carbon; TN: total nitrogen; NO3-N: nitrate nitrogen; NH4+-N: ammonium nitrogen.
BDpHSOCTNNO3−NNH4+−N
Nitrospirae0.608 *0.646 **−0.736 **−0.741 **−0.558 *−0.516 *
GAL150.605 *0.804 ***−0.693 **−0.668 **−0.404−0.613 *
Euryarchaeota0.4740.55 *−0.636 *−0.612 *−0.622 *−0.036
unclassified_k__
norank_d__Bacteria
0.554 *0.497−0.526 *−0.478−0.765 **0.119
Latescibacteria0.542 *0.489−0.564 *−0.497−0.676 **0.086
Chloroflexi0.4760.534 *−0.43−0.305−0.458−0.037
SBR10930.3280.358−0.458−0.405−0.472−0.001
Saccharibacteria−0.116−0.130.3490.340.3560.128
Gemmatimonadetes−0.59 *−0.1090.4830.5110.4680.13
Tectomicrobia−0.533 *−0.0410.4420.538 *0.230.29
Thaumarchaeota−0.574 *−0.4370.65 **0.704 **0.3190.582 *
Proteobacteria−0.765 **−0.2530.619 *0.626 *0.584 *0.13
Bacteroidetes−0.847 ***−0.3740.733 **0.713 **0.696 **0.037
Planctomycetes−0.131−0.1210.1480.186−0.2020.596 *
Firmicutes−0.202−0.2110.0430.107−0.180.742 **
Verrucomicrobia−0.361−0.2650.3230.313−0.0460.567 *
Cyanobacteria−0.233−0.3660.2140.196−0.0360.614 *
Actinobacteria−0.0740.4110.120.2120.091−0.277
Acidobacteria−0.0430.181−0.0080.046−0.2320.164
Armatimonadetes−0.0690.15−0.0160.049−0.2040.101

