Exploring Nonlinear Intra-Annual Growth Dynamics in Fagus sylvatica L. Trees at the Italian ICP-Forests Level II Network
Abstract
:1. Introduction
2. Materials and Methods
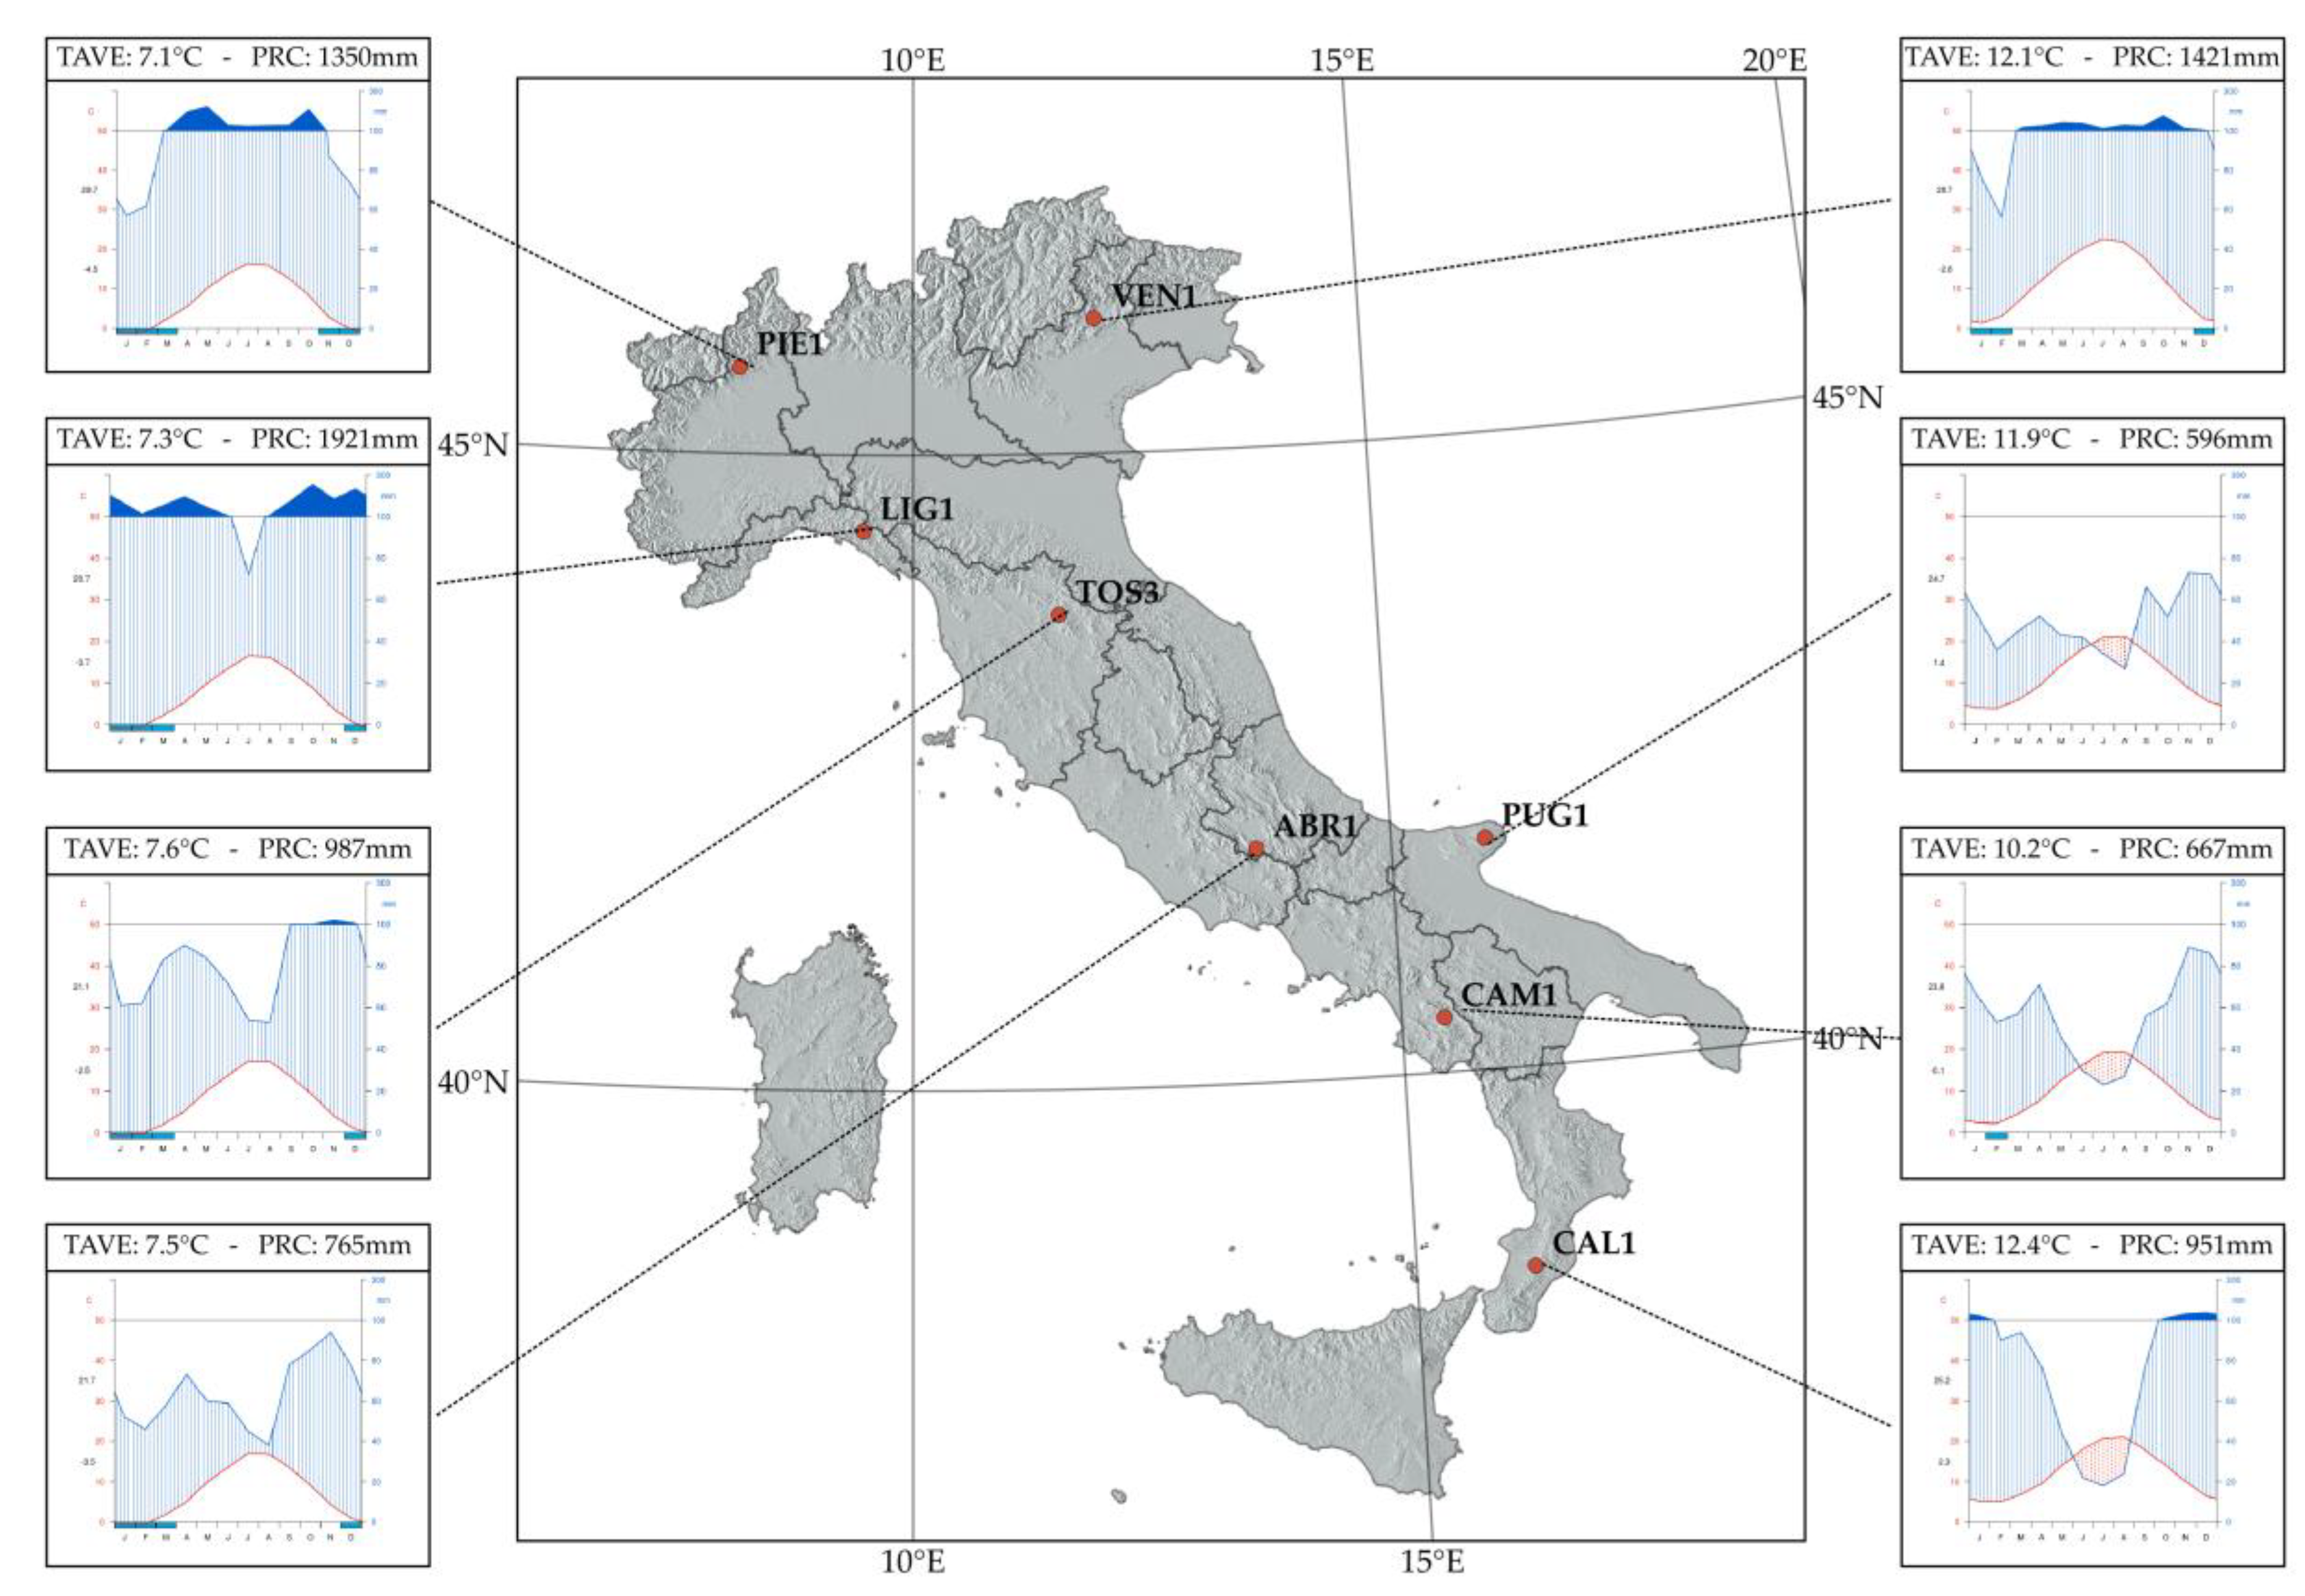
2.1. Spatial Distribution of ICP-Forests Monitoring Network for European Beech in Italy
2.2. Dendrometers and Climate Data
2.3. Statistical Analysis and Modelling Method
3. Results
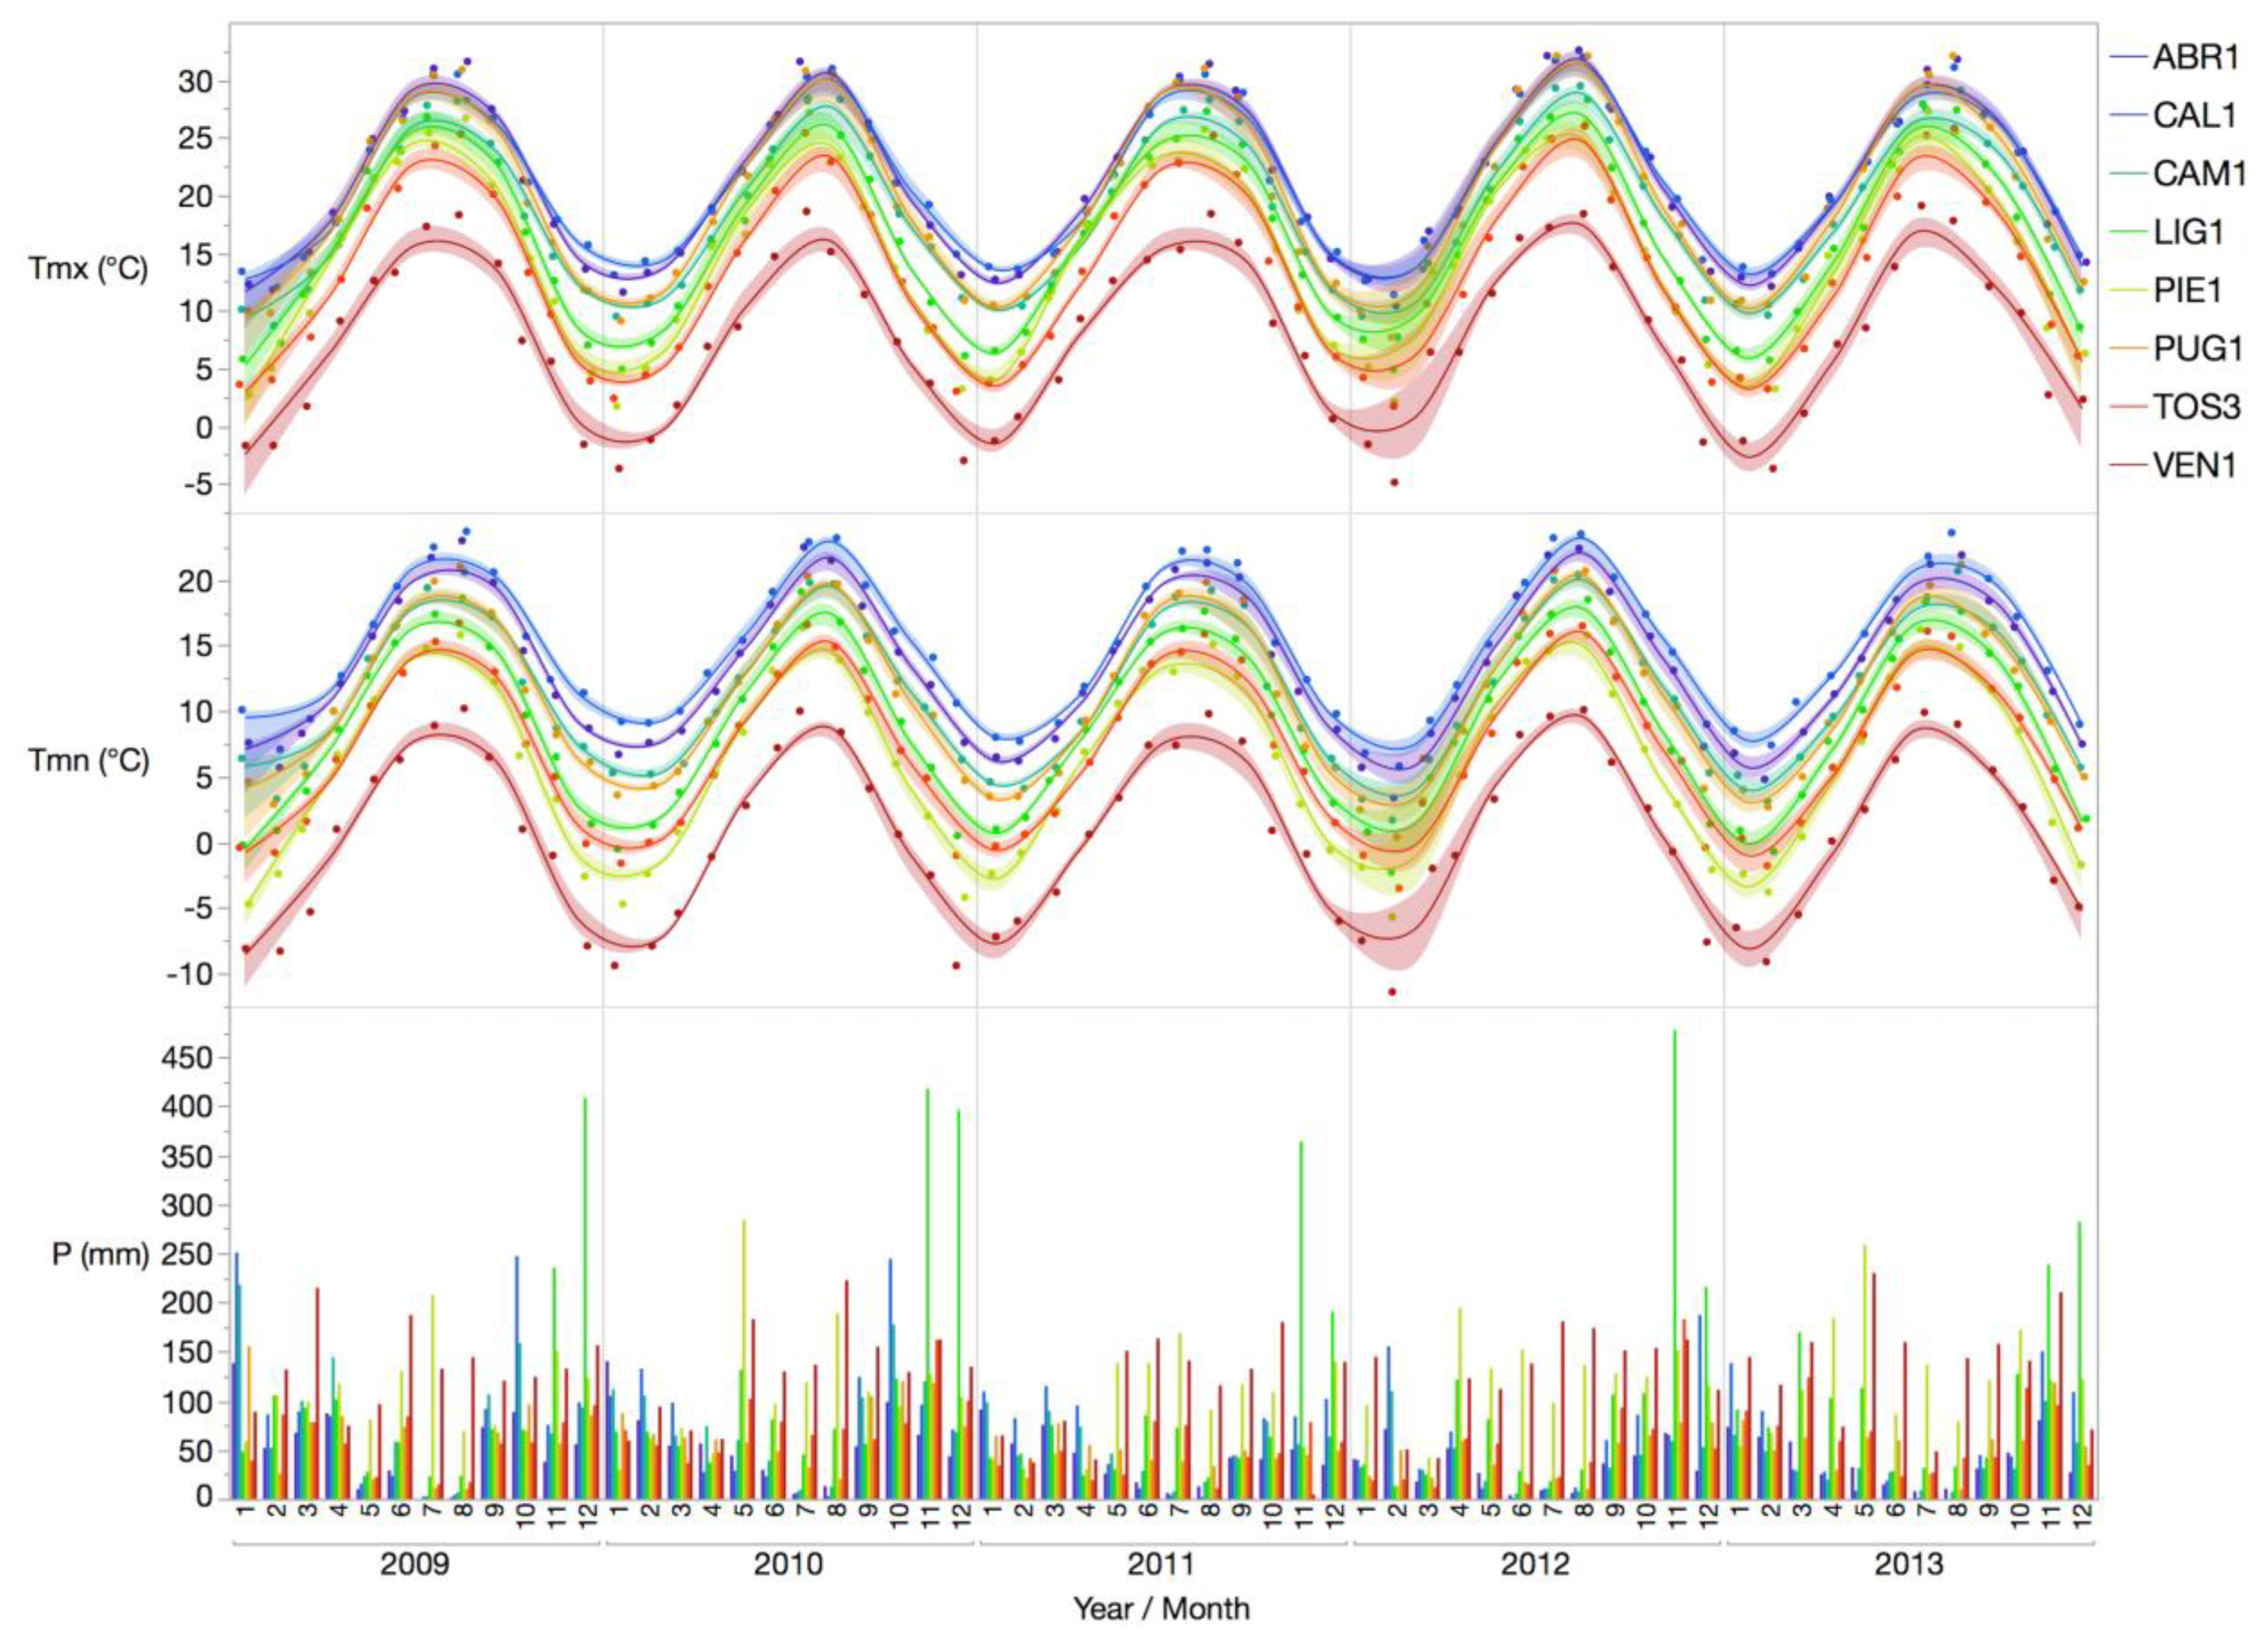
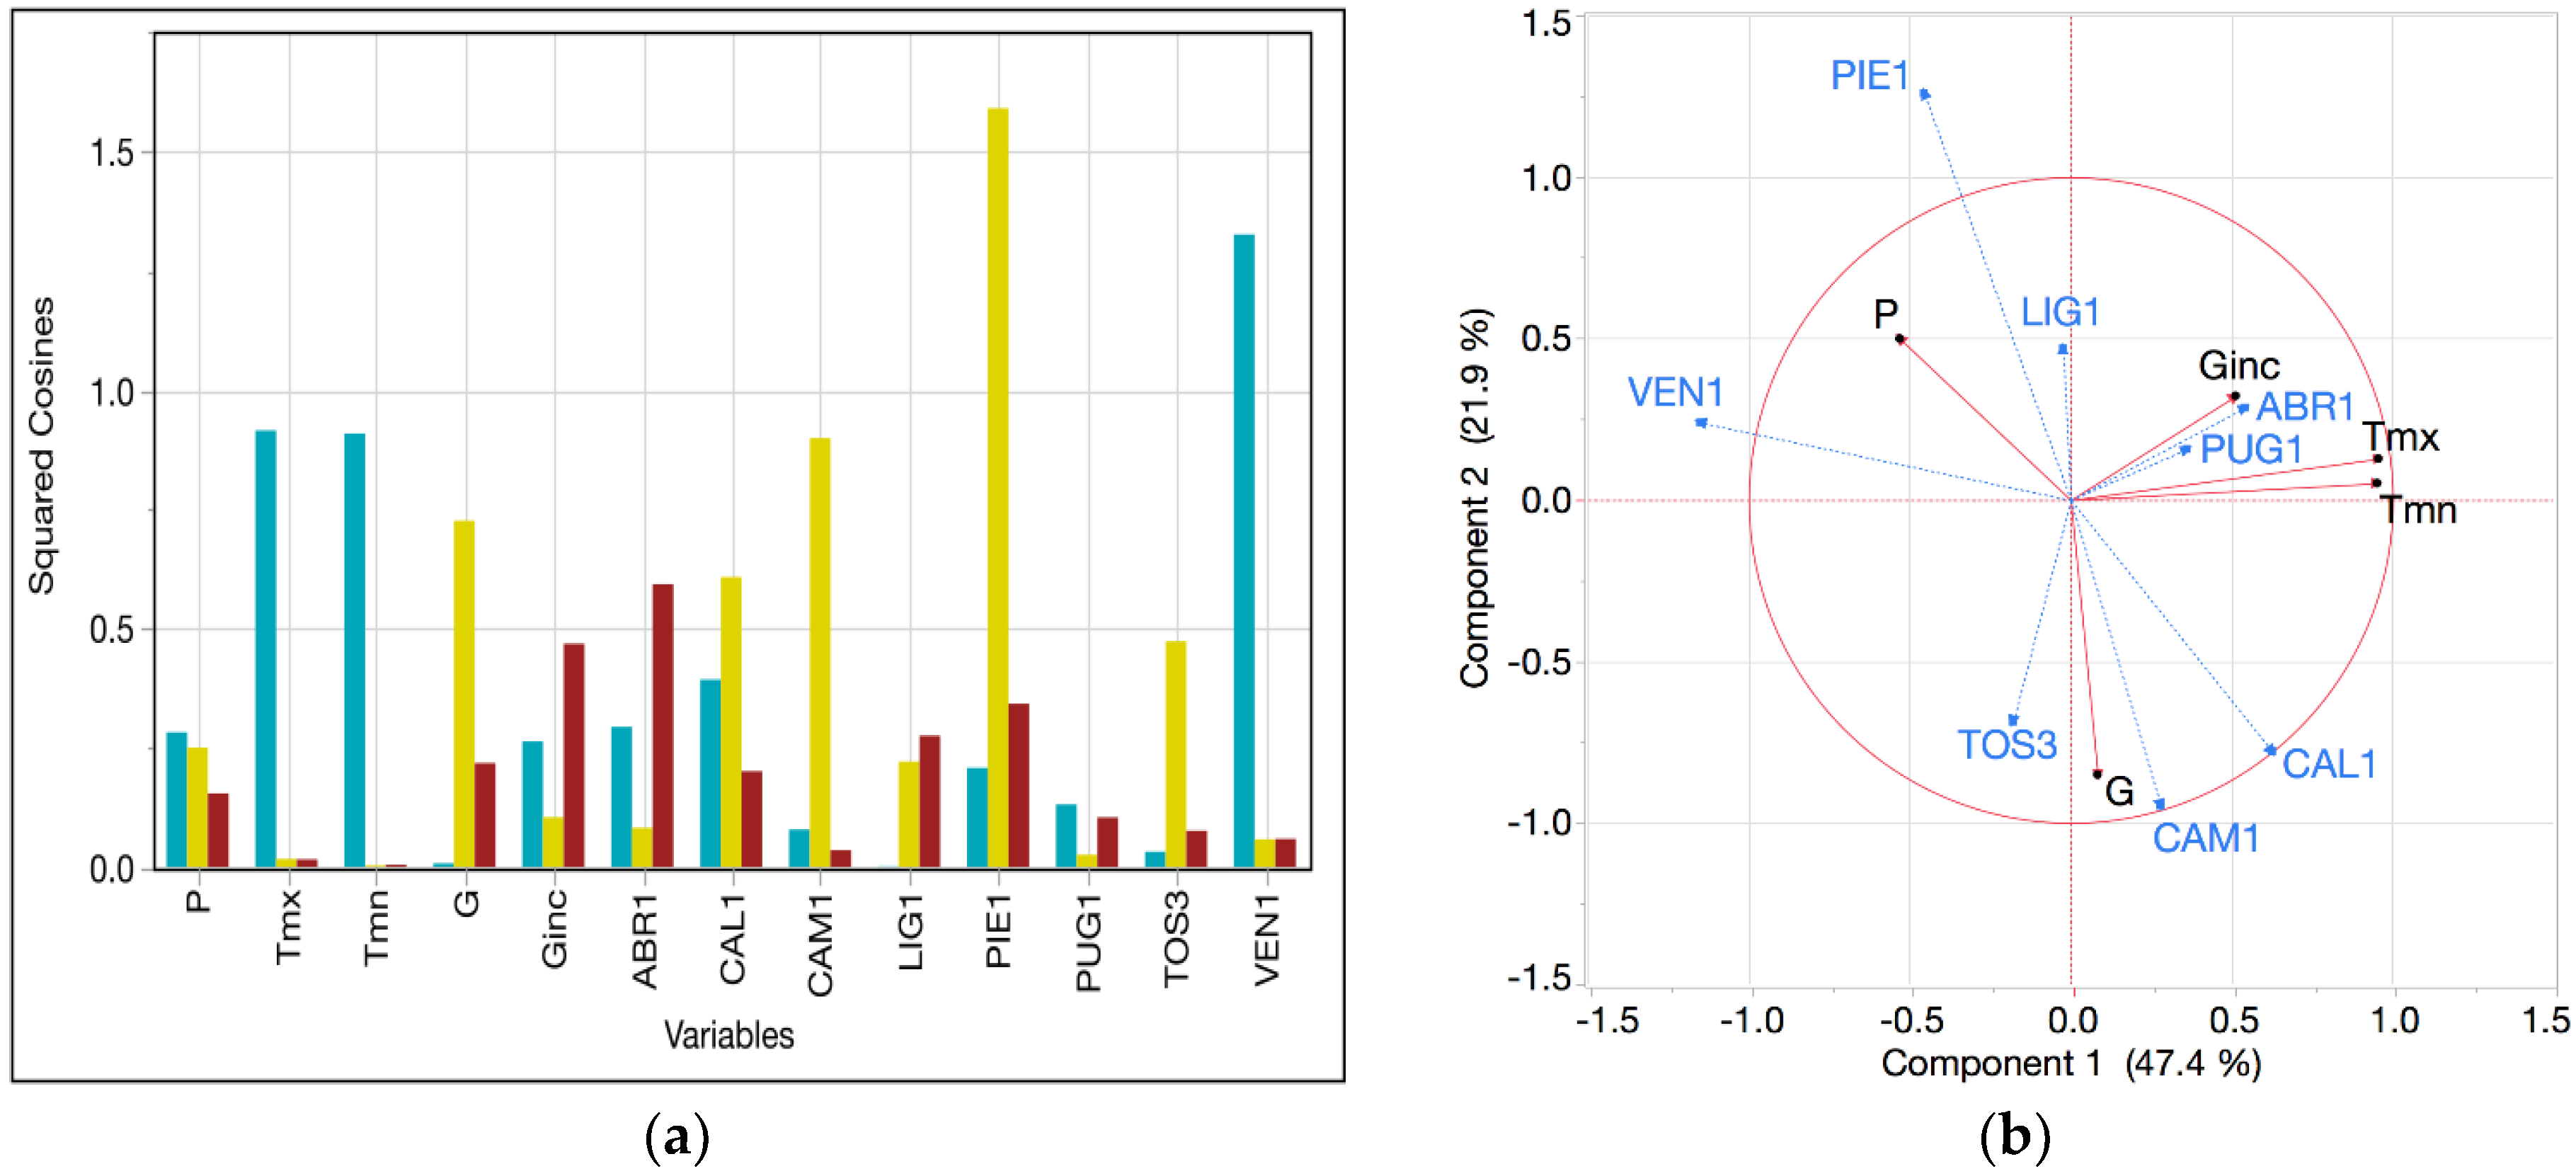
3.1. Integrated Analysis of Climatic and Dendrometers’ Data
3.2. Data Modelling with GAMM
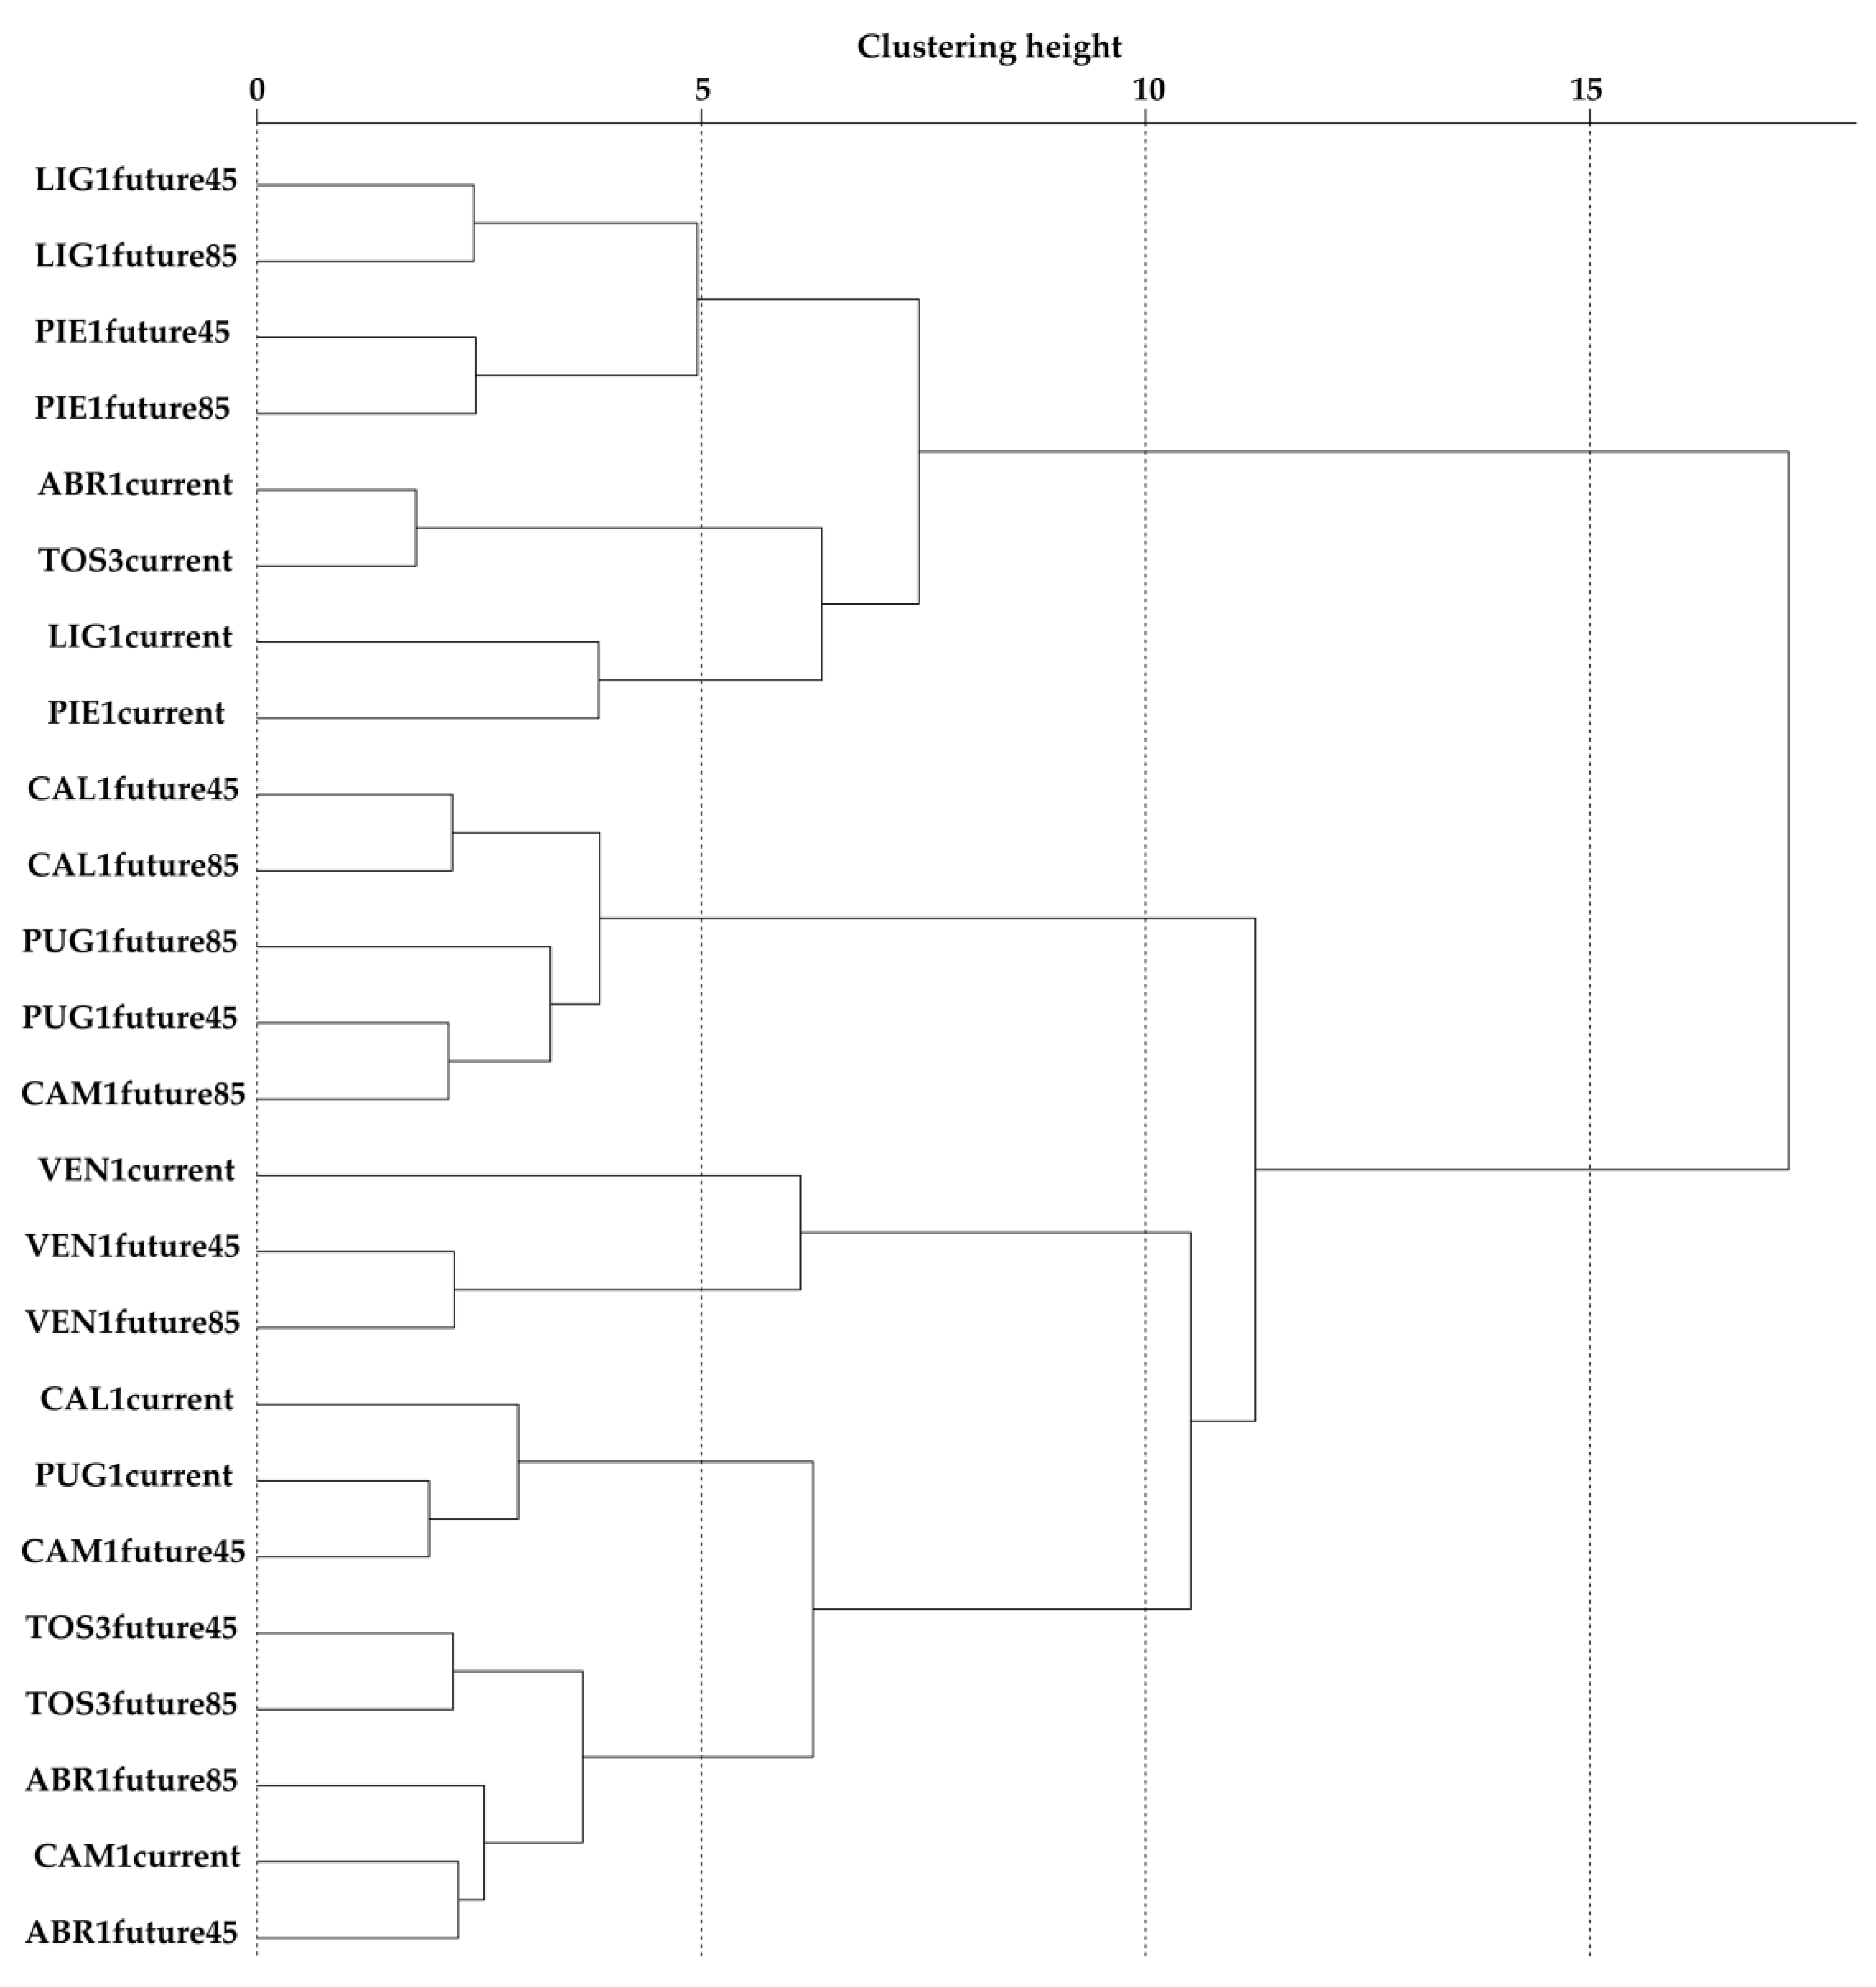
3.3. Data Forecasting
4. Discussion
5. Conclusions
Author Contributions
Funding
Acknowledgments
Conflicts of Interest
References
- Marchetti, M.; Vizzarri, M.; Lasserre, B.; Sallustio, L.; Tavone, A. Natural capital and bioeconomy: Challenges and opportunities for forestry. Ann. Silvic. Res. 2014, 38, 62–73. [Google Scholar]
- Ciccarese, L.; Mattsson, A.; Pettenella, D. Ecosystem services from forest restoration: Thinking ahead. New For. 2012, 43, 543–560. [Google Scholar] [CrossRef]
- Seppelt, R.; Dormann, C.F.; Eppink, F.V.; Lautenbach, S.; Schmidt, S. A quantitative review of ecosystem service studies: Approaches, shortcomings and the road ahead. J. Appl. Ecol. 2011, 48, 630–636. [Google Scholar] [CrossRef]
- Wagner, S.; Nocentini, S.; Huth, F.; Hoogstra-Klein, M. Forest management approaches for coping with the uncertainty of climate change: Trade-offs in service provisioning and adaptability. Ecol. Soc. 2014, 19, 32. [Google Scholar] [CrossRef]
- Chelli, S.; Wellstein, C.; Campetella, G.; Canullo, R.; Tonin, R.; Zerbe, S.; Gerdol, R. Climate change response of vegetation across climatic zones in Italy. Clim. Res. 2017, 71, 249–262. [Google Scholar] [CrossRef]
- Ray, D.; Petr, M.; Mullett, M.; Bathgate, S.; Marchi, M.; Beauchamp, K. A simulation-based approach to assess forest policy options under biotic and abiotic climate change impacts: A case study on Scotland’s National Forest Estate. For. Policy Econ. 2019, 103, 17–27. [Google Scholar] [CrossRef]
- Metzger, M.J.; Bunce, R.G.H.; Jongman, R.H.G.; Sayre, R.; Trabucco, A.; Zomer, R. A high-resolution bioclimate map of the world: A unifying framework for global biodiversity research and monitoring. Glob. Ecol. Biogeogr. 2013, 22, 630–638. [Google Scholar] [CrossRef]
- Marchi, M.; Sinjur, I.; Bozzano, M.; Westergren, M. Evaluating WorldClim Version 1 (1961–1990) as the Baseline for Sustainable Use of Forest and Environmental Resources in a Changing Climate. Sustainability 2019, 11, 3043. [Google Scholar] [CrossRef]
- Pecchi, M.; Marchi, M.; Giannetti, F.; Bernetti, I.; Bindi, M.; Moriondo, M.; Maselli, F.; Fibbi, L.; Corona, P.; Travaglini, D.; et al. Reviewing climatic traits for the main forest tree species in Italy. iFor. Biogeosci. For. 2019, 12, 173–180. [Google Scholar] [CrossRef] [Green Version]
- Bussotti, F.; Pollastrini, M. Traditional and Novel Indicators of Climate Change Impacts on European Forest Trees. Forests 2017, 8, 137. [Google Scholar] [CrossRef]
- Baral, H.; Guariguata, M.R.; Keenan, R.J. A proposed framework for assessing ecosystem goods and services from planted forests. Ecosyst. Serv. 2016, 22, 260–268. [Google Scholar] [CrossRef] [Green Version]
- Duncker, P.S.; Raulund-Rasmussen, K.; Gundersen, P.; Katzensteiner, K.; De Jong, J.; Ravn, H.P.; Smith, M.; Eckmüllner, O.; Spiecker, H. How forest management affects ecosystem services, including timber production and economic return: Synergies and trade-offs. Ecol. Soc. 2012, 17, 50. [Google Scholar] [CrossRef]
- Marchi, M.; Ducci, F. Some refinements on species distribution models using tree-level national forest inventories for supporting forest management and marginal forest population detection. iFor. Biogeosci. For. 2018, 11, 291–299. [Google Scholar] [CrossRef]
- Rathgeber, C.B.K.; Santenoise, P.; Cuny, H.E. CAVIAR: An R package for checking, displaying and processing wood-formation-monitoring data. Tree Physiol. 2018, 38, 1246–1260. [Google Scholar] [CrossRef]
- Marchi, M. Nonlinear versus linearised model on stand density model fitting and stand density index calculation: Analysis of coefficients estimation via simulation. J. For. Res. 2019. [CrossRef]
- Fréjaville, T.; Fady, B.; Kremer, A.; Ducousso, A.; Benito Garzón, M. Inferring phenotypic plasticity and local adaptation to climate across tree species ranges using forest inventory data. bioRxiv 2019. [CrossRef]
- Pacheco, A.; Camarero, J.J.; Ribas, M.; Gazol, A.; Gutierrez, E.; Carrer, M. Disentangling the climate-driven bimodal growth pattern in coastal and continental Mediterranean pine stands. Sci. Total Environ. 2018, 615, 1518–1526. [Google Scholar] [CrossRef]
- Dobbertin, M. Tree growth as indicator of tree vitality and of tree reaction to environmental stress: A review. Eur. J. For. Res. 2005, 124, 319–333. [Google Scholar] [CrossRef]
- Garet, J.; Raulier, F.; Pothier, D.; Cumming, S.G. Forest age class structures as indicators of sustainability in boreal forest: Are we measuring them correctly? Ecol. Indic. 2012, 23, 202–210. [Google Scholar] [CrossRef]
- Avanzi, C.; Piermattei, A.; Piotti, A.; Büntgen, U.; Heer, K.; Opgenoorth, L.; Spanu, I.; Urbinati, C.; Vendramin, G.G.; Leonardi, S. Disentangling the effects of spatial proximity and genetic similarity on individual growth performances in Norway spruce natural populations. Sci. Total Environ. 2019, 650, 493–504. [Google Scholar] [CrossRef]
- Bussotti, F.; Pollastrini, M. Observing Climate Change Impacts on European Forests: What Works and What Does Not in Ongoing Long-Term Monitoring Networks. Front. Plant Sci. 2017, 8, 629. [Google Scholar] [CrossRef]
- Bonan, G.B. Forests and climate change: Forcings, feedbacks, and the climate benefits of forests. Science 2008, 320, 1444–1449. [Google Scholar] [CrossRef]
- Millar, C.I.; Stephenson, N.L.; Stephens, S.L. Climate change and forests of the future: Managing in the face of uncertainty. Ecol. Appl. 2007, 17, 2145–2151. [Google Scholar] [CrossRef]
- Spathelf, P.; Stanturf, J.; Kleine, M.; Jandl, R.; Chiatante, D.; Bolte, A. Adaptive measures: Integrating adaptive forest management and forest landscape restoration. Ann. For. Sci. 2018, 75, 55. [Google Scholar] [CrossRef]
- Lindner, M.; Maroschek, M.; Netherer, S.; Kremer, A.; Barbati, A.; Garcia-Gonzalo, J.; Seidl, R.; Delzon, S.; Corona, P.; Kolström, M.; et al. Climate change impacts, adaptive capacity, and vulnerability of European forest ecosystems. For. Ecol. Manag. 2010, 259, 698–709. [Google Scholar] [CrossRef]
- Milad, M.; Schaich, H.; Bürgi, M.; Konold, W. Climate change and nature conservation in Central European forests: A review of consequences, concepts and challenges. For. Ecol. Manag. 2011, 261, 829–843. [Google Scholar] [CrossRef]
- Ciais, P.; Reichstein, M.; Viovy, N.; Granier, A.; Ogée, J.; Allard, V.; Aubinet, M.; Buchmann, N.; Bernhofer, C.; Carrara, A.; et al. Europe-wide reduction in primary productivity caused by the heat and drought in 2003. Nature 2005, 437, 529–533. [Google Scholar] [CrossRef]
- Allen, C.D.; Macalady, A.K.; Chenchouni, H.; Bachelet, D.; McDowell, N.; Vennetier, M.; Kitzberger, T.; Rigling, A.; Breshears, D.D.; Hogg, E.H.; et al. A global overview of drought and heat-induced tree mortality reveals emerging climate change risks for forests. For. Ecol. Manag. 2010, 259, 660–684. [Google Scholar] [CrossRef] [Green Version]
- Neumann, M.; Mues, V.; Moreno, A.; Hasenauer, H.; Seidl, R. Climate variability drives recent tree mortality in Europe. Glob. Chang. Biol. 2017, 23, 4788–4797. [Google Scholar] [CrossRef]
- Ummenhofer, C.C.; Meehl, G.A. Extreme Weather and Climate Events with Ecological Relevance—A review. Philos. Trans. R. Soc. B Biol. Sci. 2017, 372, 20160135. [Google Scholar] [CrossRef]
- Ferretti, M.; Fischer, R.; Moffat, A.J. Terrestrial methods in forest monitoring: Toward the next generation? Dev. Environ. Sci. 2013, 12, 483–496. [Google Scholar]
- Marchi, M.; Ferrara, C.; Bertini, G.; Fares, S.; Salvati, L. A sampling design strategy to reduce survey costs in forest monitoring. Ecol. Indic. 2017, 81, 182–191. [Google Scholar] [CrossRef]
- Dobbertin, M.; Neumann, M. Manual on methods and criteria for harmonized sampling, assessment, monitoring and analysis of the effects of air pollution on forests. Wetlands 2010, 30, 29. [Google Scholar]
- Bertini, G.; Amoriello, T.; Fabbio, G.; Piovosi, M. Forest growth and climate change: Evidences from the ICP-Forests intensive monitoring in Italy. iFor. Biogeosci. For. 2011, 4, 262–267. [Google Scholar] [CrossRef]
- Vitale, M.; Mancini, M.; Matteucci, G.; Francesconi, F.; Valenti, R.; Attorre, F. Model-based assessment of ecological adaptations of three forest tree species growing in Italy and impact on carbon and water balance at national scale under current and future climate scenarios. iFor. Biogeosci. For. 2012, 5, 235–246. [Google Scholar] [CrossRef] [Green Version]
- De Vries, W.; Posch, M. Modelling the impact of nitrogen deposition, climate change and nutrient limitations on tree carbon sequestration in Europe for the period 1900–2050. Environ. Pollut. 2011, 159, 2289–2299. [Google Scholar] [CrossRef]
- Meier, E.S.; Edwards, T.C.; Kienast, F.; Dobbertin, M.; Zimmermann, N.E. Co-occurrence patterns of trees along macro-climatic gradients and their potential influence on the present and future distribution of Fagus sylvatica L. J. Biogeogr. 2011, 38, 371–382. [Google Scholar] [CrossRef]
- Gavin, D.G.; Fitzpatrick, M.C.; Gugger, P.F.; Heath, K.D.; Rodriguez-Sanchez, F.; Dobrowski, S.Z.; Hampe, A.; Hu, F.S.; Ashcroft, M.B.; Bartlein, P.J.; et al. Climate refugia: Joint inference from fossil records, species distribution models and phylogeography. New Phytol. 2014, 204, 37–54. [Google Scholar] [CrossRef]
- Piovesan, G.; Bernabei, M.; Di Filippo, A.; Romagnoli, M.; Schirone, B. A long-term tree ring beech chronology from a high-elevation old-growth forest of Central Italy. Dendrochronologia 2003, 21, 13–22. [Google Scholar] [CrossRef]
- Di Filippo, A.; Biondi, F.; Čufar, K.; De Luis, M.; Grabner, M.; Maugeri, M.; Presutti Saba, E.; Schirone, B.; Piovesan, G. Bioclimatology of beech (Fagus sylvatica L.) in the Eastern Alps: Spatial and altitudinal climatic signals identified through a tree-ring network. J. Biogeogr. 2007, 34, 1873–1892. [Google Scholar] [CrossRef]
- Kramer, K.; Ducousso, A.; Gömöry, D.; Hansen, J.K.; Ionita, L.; Liesebach, M.; Lorenţ, A.; Schüler, S.; Sulkowska, M.; de Vries, S.; et al. Chilling and forcing requirements for foliage bud burst of European beech (Fagus sylvatica L.) differ between provenances and are phenotypically plastic. Agric. For. Meteorol. 2017, 234, 172–181. [Google Scholar] [CrossRef]
- Falk, W.; Hempelmann, N. Species Favourability Shift in Europe due to Climate Change: A Case Study for Fagus sylvatica L. and Picea abies (L.) Karst. Based on an Ensemble of Climate Models. J. Climatol. 2013, 2013, 787250. [Google Scholar] [CrossRef]
- Piovesan, G.; Biondi, F.; Bernabei, M.; Di Filippo, A.; Schirone, B. Spatial and altitudinal bioclimatic zones of the Italian peninsula identified from a beech (Fagus sylvatica L.) tree-ring network. Acta Oecol. 2005, 27, 197–210. [Google Scholar]
- Piovesan, G.; Di Filippo, A.; Alessandrini, A.; Biondi, F.; Schirone, B. Structure, dynamics and dendroecology of an old-growth Fagus forest in the Apennines. J. Veg. Sci. 2005, 16, 13–28. [Google Scholar] [CrossRef]
- Ferrara, C.; Marchi, M.; Fares, S.; Salvati, L. Sampling strategies for high quality time-series of climatic variables in forest resource assessment. iFor. Biogeosci. For. 2017, 10, 739–745. [Google Scholar] [CrossRef] [Green Version]
- Poschenrieder, W.; Biber, P.; Pretzsch, H. An Inventory-Based Regeneration Biomass Model to Initialize Landscape Scale Simulation Scenarios. Forests 2018, 9, 212. [Google Scholar] [CrossRef]
- Hastie, T.J. Generalized additive models. In Statistical Models in S; Physica-Verlag: Heidelberg, Germany, 2017; ISBN 9781351414234. [Google Scholar]
- Wood, S.N. On confidence intervals for generalized additive models based on penalized regression splines. Aust. N. Z. J. Stat. 2006, 48, 445–464. [Google Scholar] [CrossRef]
- Wood, S.; Scheipl, F. gamm4: Generalized Additive Mixed Models using “mgcv” and “lme4”. 2017. Available online: https://rdrr.io/cran/gamm4/ (accessed on 29 May 2019).
- The R Development Core Team. R: A language and environment for statistical computing. R Found. Stat. Comput. 2019. [Google Scholar]
- Maca, P.; Pech, P. Forecasting SPEI and SPI Drought Indices Using the Integrated Artificial Neural Networks. Comput. Intell. Neurosci. 2016, 2016, 3868519. [Google Scholar] [CrossRef]
- Wang, T.; Hamann, A.; Spittlehouse, D.L.; Murdock, T.Q. ClimateWNA-high-resolution spatial climate data for western North America. J. Appl. Meteorol. Climatol. 2012, 51, 16–29. [Google Scholar] [CrossRef]
- Isaac-Renton, M.G.; Roberts, D.R.; Hamann, A.; Spiecker, H. Douglas-fir plantations in Europe: A retrospective test of assisted migration to address climate change. Glob. Chang. Biol. 2014, 20, 2607–2617. [Google Scholar] [CrossRef] [PubMed]
- Hamann, A.; Wang, T.; Spittlehouse, D.L.; Murdock, T.Q. A comprehensive, high-resolution database of historical and projected climate surfaces for western North America. Bull. Am. Meteorol. Soc. 2013, 94, 1307–1309. [Google Scholar] [CrossRef]
- Wang, T.; Hamann, A.; Spittlehouse, D.; Carroll, C. Locally downscaled and spatially customizable climate data for historical and future periods for North America. PLoS ONE 2016, 11, e0156720. [Google Scholar] [CrossRef] [PubMed]
- de Dato, G.; Teani, A.; Mattioni, C.; Marchi, M.; Monteverdi, M.C.; Ducci, F. Delineation of seed collection zones based on environmental and genetic characteristics for Quercussuber L. in Sardinia, Italy. iFor. Biogeosci. For. 2018, 11, 651–659. [Google Scholar] [CrossRef]
- Piotti, A.; Leonarduzzi, C.; Postolache, D.; Bagnoli, F.; Spanu, I.; Brousseau, L.; Urbinati, C.; Leonardi, S.; Vendramin, G.G.; Urfm, U.R. Unexpected scenarios from Mediterranean refugial areas: Disentangling complex demographic dynamics along the Apennine distribution of silver fir. J. Biogeogr. 2017, 44, 1547–1558. [Google Scholar] [CrossRef]
- Marchi, M.; Castaldi, C.; Merlini, P.; Nocentini, S.; Ducci, F. Stand structure and influence of climate on growth trends of a Marginal forest population of Pinusnigra spp. nigra. Ann. Silvic. Res. 2015, 39, 100–110. [Google Scholar]
- Eckert, C.G.; Samis, K.E.; Lougheed, S.C. Genetic variation across species’ geographical ranges: The central–marginal hypothesis and beyond. Mol. Ecol. 2008, 17, 1170–1188. [Google Scholar] [CrossRef]
- Vakkari, P.; Rusanen, M.; Kärkkäinen, K. High genetic differentiation in marginal populations of European White Elm (Ulmuslaevis). Silva Fenn. 2009, 43, 185–196. [Google Scholar] [CrossRef]
- Hampe, A.; Petit, R.J. Conserving biodiversity under climate change: The rear edge matters. Ecol. Lett. 2005, 8, 461–467. [Google Scholar] [CrossRef]
- Colantoni, A.; Mavrakis, A.; Sorgi, T.; Salvati, L. Towards a ‘polycentric’ landscape? Reconnecting fragments into an integrated network of coastal forests in Rome. Rend. Lincei 2015, 26, 615–624. [Google Scholar] [CrossRef]
- Biasi, R.; Colantoni, A.; Ferrara, C.; Ranalli, F.; Salvati, L. In-between sprawl and fires: Long-term forest expansion and settlement dynamics at the wildland-urban interface in Rome, Italy. Int. J. Sustain. Dev. World Ecol. 2015, 22, 467–475. [Google Scholar] [CrossRef]


| ICP-Forests Plot | Stand Age (Years) | Total Standing Volume m3ha−1 | Trees Per Hectare (N) | Mean dbh (cm) | Mean Height (m) | Proportion of Beech Trees in Volume % |
|---|---|---|---|---|---|---|
| PIE1 | 80 | 373 | 1109 | 20.1 | 18.5 | 100% |
| VEN1 | 140 | 659 | 337 | 39.1 | 29.6 | 100% |
| LIG1 | 120 | 457 | 336 | 35 | 25.8 | 100% |
| TOS3 | 165 | 981 | 367 | 43.6 | 32.9 | 100% |
| ABR1 | 130 | 630 | 926 | 26.2 | 22.9 | 100% |
| PUG1 | 95 | 755 | 718 | 36.1 | 26.9 | 96.4% |
| CAM1 | 120 | 948 | 236 | 54.6 | 30.6 | 100% |
| CAL1 | 130 | 795 | 251 | 48.3 | 31.4 | 98.6% |
| Statistic | ABR1 | CAL1 | CAM1 | LIG1 | PIE1 | PUG1 | TOS3 | VEN1 |
|---|---|---|---|---|---|---|---|---|
| Mean | 39.80 | 55.53 | 54.95 | 46.18 | 28.04 | 44.28 | 52.81 | 47.13 |
| StdDev | 0.32 | 0.47 | 0.29 | 0.42 | 0.19 | 0.51 | 0.22 | 0.32 |
| Median | 39.80 | 55.53 | 55.03 | 46.23 | 28.05 | 44.36 | 52.85 | 47.18 |
| Min | 39.26 | 54.79 | 54.43 | 45.49 | 27.72 | 43.29 | 52.47 | 46.58 |
| Max | 40.28 | 56.40 | 55.36 | 46.78 | 28.34 | 45.07 | 53.15 | 47.62 |
| Coef. of Variation | 0.79 | 0.84 | 0.54 | 0.92 | 0.67 | 1.15 | 0.42 | 0.68 |
| Variable | Statistics | ABR1 | CAL1 | CAM1 | LIG1 | PIE1 | PUG1 | TOS3 | VEN1 |
|---|---|---|---|---|---|---|---|---|---|
| Maximum air temperature (°C) | Mean | 21.18 | 21.18 | 18.46 | 16.48 | 14.76 | 19.89 | 13.54 | 7.77 |
| StdDev | 6.90 | 6.37 | 6.75 | 7.52 | 7.95 | 7.59 | 7.67 | 7.13 | |
| Median | 20.50 | 20.40 | 17.85 | 16.55 | 15.25 | 18.95 | 13.00 | 7.95 | |
| Min | 10.40 | 11.40 | 7.70 | 4.90 | 1.70 | 7.70 | 1.70 | −4.90 | |
| Max | 32.60 | 32.00 | 29.50 | 28.40 | 27.30 | 32.10 | 26.00 | 19.10 | |
| CV | 32.56 | 30.09 | 36.57 | 45.61 | 53.84 | 38.14 | 56.66 | 91.78 | |
| Minimum air temperature (°C) | Mean | 13.52 | 14.89 | 11.51 | 8.95 | 6.06 | 11.15 | 7.13 | 0.59 |
| StdDev | 5.65 | 5.39 | 5.60 | 6.32 | 6.74 | 6.12 | 6.06 | 6.45 | |
| Median | 13.40 | 14.80 | 11.40 | 8.90 | 6.60 | 10.85 | 6.65 | 0.75 | |
| Min | 3.40 | 5.80 | 1.70 | −2.30 | −5.70 | 0.40 | −3.50 | −11.40 | |
| Max | 23.00 | 23.70 | 20.70 | 19.10 | 16.40 | 21.20 | 16.70 | 10.20 | |
| CV | 41.78 | 36.19 | 48.65 | 70.66 | 111.37 | 54.90 | 85.02 | 1086.27 | |
| Monthly precipitation (mm) | Mean | 45.04 | 69.79 | 59.02 | 107.85 | 110.51 | 56.17 | 60.20 | 126.62 |
| StdDev | 31.25 | 62.14 | 45.38 | 109.89 | 53.41 | 30.43 | 34.84 | 49.19 | |
| Median | 42.85 | 67.15 | 52.00 | 71.45 | 110.35 | 56.85 | 57.30 | 133.95 | |
| Min | 0.10 | 0.00 | 3.20 | 13.30 | 13.10 | 9.60 | 10.70 | 4.20 | |
| Max | 140.40 | 250.80 | 218.00 | 477.70 | 284.10 | 156.00 | 182.80 | 229.70 | |
| CV | 69.37 | 89.03 | 76.89 | 101.89 | 48.33 | 54.18 | 57.87 | 38.85 |
| Acronym Used in Recent Literature | Description |
|---|---|
| MAT | mean annual temperature (°C) |
| MWMT | mean warmest month temperature (°C) |
| MCMT | mean coldest month temperature (°C) |
| TD | temperature difference between MWMT and MCMT, or continentality (°C) |
| MAP | mean annual precipitation (mm) |
| MSP | mean summer (May to Sept.) precipitation (mm) |
| AH:M | annual heat moisture index (MAT+10)/(MAP/1000)) |
| SH:M | summer heat moisture index ((MWMT)/(MSP/1000)) |
| DD<0 | degree-days below 0°C, chilling degree-days |
| DD>5 | degree-days above 5°C, growing degree-days |
| DD<18 | degree-days below 18°C, heating degree-days |
| DD>18 | degree-days above 18°C, cooling degree-days |
| NFFD | the number of frost-free days |
| FFP | frost-free period |
| bFFP | the Julian date on which FFP begins |
| eFFP | the Julian date on which FFP ends |
| PAS | precipitation as snow between August in previous year and July in current year |
| EMT | extreme minimum temperature over 30 years |
| Eref | Hargreaves reference evaporation |
| CMD | Hargreaves climatic moisture deficit |
| TAV_wt | winter (Dec.(prev. year)–Feb.) mean temperature (°C) |
| TAV_sp | spring (Mar.–May) mean temperature (°C) |
| TAV_sm | summer (Jun.–Aug.) mean temperature (°C) |
| TAV_at | autumn (Sep.–Nov.) mean temperature (°C) |
| TMAX_wt | winter mean maximum temperature (°C) |
| TMAX_sp | spring mean maximum temperature (°C) |
| TMAX_sm | summer mean maximum temperature (°C) |
| TMAX_at | autumn mean maximum temperature (°C) |
| TMIN_wt | winter mean minimum temperature (°C) |
| TMIN_sp | spring mean minimum temperature (°C) |
| TMIN_sm | summer mean minimum temperature (°C) |
| TMIN_at | autumn mean minimum temperature (°C) |
| PPT_wt | winter precipitation (mm) |
| PPT_sp | spring precipitation (mm) |
| PPT_sm | summer precipitation (mm) |
| PPT_at | autumn precipitation (mm) |
| Cluster | Number of Members | Most Representative Variable | Cluster Proportion of Variation Explained | Total Proportion of Variation Explained |
|---|---|---|---|---|
| 1 | 2 | Ginc | 1 | 0.50 |
| 2 | 2 | G | 0.99 | 0.49 |
| Variable | ABR1 | CAL1 | CAM1 | LIG1 | PIE1 | PUG1 | TOS3 | VEN1 |
|---|---|---|---|---|---|---|---|---|
| Day of the year (DOY) | *** | *** | * | *** | *** | *** | *** | *** |
| Monitoring day (DAY) | *** | *** | ** | *** | ns | ** | ns | ** |
| SPEI | *** | *** | *** | *** | * | *** | * | *** |
| Maximum temperature (Tmx) | ** | *** | *** | *** | *** | * | ns | ** |
| Minimum temperature (Tmn) | ** | *** | *** | *** | *** | *** | ns | *** |
| Total annualprecipitation (P) | *** | * | ** | *** | ** | ** | *** | *** |
| Varianceexplained by GAMM % | 47.15 | 36.42 | 68.70 | 72.94 | 29.96 | 42.72 | 37.26 | 49.62 |
© 2019 by the authors. Licensee MDPI, Basel, Switzerland. This article is an open access article distributed under the terms and conditions of the Creative Commons Attribution (CC BY) license (http://creativecommons.org/licenses/by/4.0/).
Share and Cite
Ferrara, C.; Marchi, M.; Fabbio, G.; Fares, S.; Bertini, G.; Piovosi, M.; Salvati, L. Exploring Nonlinear Intra-Annual Growth Dynamics in Fagus sylvatica L. Trees at the Italian ICP-Forests Level II Network. Forests 2019, 10, 584. https://doi.org/10.3390/f10070584
Ferrara C, Marchi M, Fabbio G, Fares S, Bertini G, Piovosi M, Salvati L. Exploring Nonlinear Intra-Annual Growth Dynamics in Fagus sylvatica L. Trees at the Italian ICP-Forests Level II Network. Forests. 2019; 10(7):584. https://doi.org/10.3390/f10070584
Chicago/Turabian StyleFerrara, Carlotta, Maurizio Marchi, Gianfranco Fabbio, Silvano Fares, Giada Bertini, Maurizio Piovosi, and Luca Salvati. 2019. "Exploring Nonlinear Intra-Annual Growth Dynamics in Fagus sylvatica L. Trees at the Italian ICP-Forests Level II Network" Forests 10, no. 7: 584. https://doi.org/10.3390/f10070584
APA StyleFerrara, C., Marchi, M., Fabbio, G., Fares, S., Bertini, G., Piovosi, M., & Salvati, L. (2019). Exploring Nonlinear Intra-Annual Growth Dynamics in Fagus sylvatica L. Trees at the Italian ICP-Forests Level II Network. Forests, 10(7), 584. https://doi.org/10.3390/f10070584


